

Abstract
Lipid rafts, membrane microdomains enriched with (glyco)sphingolipids, cholesterol, and select proteins, act as cellular signalosomes. Various methods have been used to separate lipid rafts from bulk (non‐raft) membranes, but most often, non‐ionic detergent Triton X‐100 has been used in their isolation. However, Triton X‐100 is a reported disruptor of lipid rafts. Histological evidence confirmed raft disruption by Triton X‐100, but remarkably revealed raft stability to treatment with a related polyethylene oxide detergent, Brij O20. We report isolation of detergent‐resistant membranes from mouse brain using Brij O20 and its use to determine the distribution of major mammalian brain gangliosides, GM1, GD1a, GD1b and GT1b. A different distribution of gangliosides—classically used as a raft marker—was discovered using Brij O20 versus Triton X‐100. Immunohistochemistry and imaging mass spectrometry confirm the results. Use of Brij O20 results in a distinctive membrane distribution of gangliosides that is not all lipid raft associated, but depends on the ganglioside structure. This is the first report of a significant proportion of gangliosides outside raft domains. We also determined the distribution of proteins functionally related to neuroplasticity and known to be affected by ganglioside environment, glutamate receptor subunit 2, amyloid precursor protein and neuroplastin and report the lipid raft populations of these proteins in mouse brain tissue. This work will enable more accurate lipid raft analysis with respect to glycosphingolipid and membrane protein composition and lead to improved resolution of lipid–protein interactions within biological membranes.

Keywords: amyloid precursor protein, detergent‐resistant membranes, glutamate receptor subunit 2, glycosphingolipids, neuroplastin
Using a data‐driven partitioning strategy, we report that a significant proportion of gangliosides, long believed to be lipid raft resident, reside outside raft domains. Immunohistochemistry and imaging mass spectrometry revealed that the distribution of gangliosides remains largely unchanged by treatment with Brij O20 detergent compared to the widely used Triton X‐100, which induces ganglioside redistribution. Lipid raft analyses of Brij O20 brain extracts revealed that gangliosides are not all lipid raft depending on the ganglioside structures. Likewise, different neuroplasticity protein raft distributions were revealed. This work enables more accurate lipid raft analyses for resolution of lipid–protein interactions in biological membranes.
Abbreviations
- AD
Alzheimer's disease
- APP
amyloid precursor protein
- CAM
cell adhesion molecule
- cat.no.
catalogue number
- CTB
cholera toxin subunit B
- DRM
detergent‐resistant membrane
- Flot1
flotillin 1
- GluA2
glutamate receptor subunit 2
- GPI
glycophosphatidylinositol
- IMS
imaging mass spectrometry
- ITO
indium tin oxide
- LMI
light microscopy image
- LR
lipid raft
- nLR
non‐lipid raft (bulk membrane)
- Np
neuroplastin
- PMSF
phenylmethylsulfonyl fluoride
- RRID
Research Resource Identifier
- TfR
transferrin receptor
- TIC
total ion current
- TX100
Triton X‐100
1. INTRODUCTION
Within the plane of the plasma membrane, lateral lipid compartmentalization with select proteins is the basis for molecular clustering that impacts cell signaling (Sezgin et al., 2017; Simons & Ehehalt, 2002; Simons & Ikonen, 1997; Sonnino & Prinetti, 2013). These lateral associations of molecules on the plasma membrane are referred to as membrane microdomains or lipid rafts (LR). Various types of evidence support the existence of LRs as nanometer‐scale, heterogeneous, and dynamic intramembrane structures (Carquin et al., 2016; Komura et al., 2016; Suzuki et al., 2012, 2017, 2018). LRs are especially enriched with (glyco)sphingolipids, cholesterol, glycophosphatidylinositol (GPI)‐anchored proteins, and also with a select subset of transmembrane proteins, enabling LRs to act as signalosomes (Marin et al., 2013). As an extension, disturbances in the lipid microenvironment are recognized as potential driving factors in the pathogenesis of several human disorders (Molander‐Melin et al., 2005; Marin et al., 2016; Canerina‐Amaro et al., 2017; Shi et al. 2017; Grassi et al., 2019). Generally, gangliosides, particularly GM1, have been considered as classical raft markers (Ledeen & Wu, 2015) and are assumed to be nearly exclusively raft associated. However, a difficulty in studying lipid rafts and assessing their resident molecules is their elusive nature during isolation. Detergent treatment has been the most frequently published method for describing raft resident molecules; the relative resistance of LRs to disruption by cold detergent solutions has long been the basis of their isolation. However, the results are dependent upon the isolation conditions including temperature, detergent type and its concentration, and the cell or tissue homogenization method. These methods were determined empirically and have been widely adopted (Aureli et al., 2016; Chamberlain, 2004; Dalskov et al., 2005; Macdonald & Pike, 2005; Persaud‐Sawin et al., 2009; Pike, 2009; Williamson et al., 2010).
Although various methods have been used to separate LRs from bulk (non‐raft) membranes (Chamberlain, 2004; Shah & Sehgal, 2007; Simons & Gerl, 2010; Sonnino & Prinetti, 2013), most often, homogenization of cells or tissues with buffered ice‐cold non‐ionic detergent Triton X‐100 (TX100) has been used to generate detergent‐resistant membranes (DRM) enriched in cholesterol and sphingomyelin and thought to be related to rafts (Aureli et al., 2016; Eckert et al., 2003; Persaud‐Sawin et al., 2009; Pike, 2009; Schuck et al., 2003; Sezgin et al., 2017). However, there remain discrepancies between results obtained using TX100 versus co‐localization and pull‐down experiments with known LR markers (Cole et al., 2010; Hering et al., 2003; Hou et al., 2008). In earlier studies (Heffer‐Lauc et al., 2005), we made a serendipitous discovery which provided independent evidence that ice‐cold 1% buffered TX100 results in fluid‐phase redistribution of the highly validated lipid raft markers, gangliosides, and GPI‐anchored proteins. Using histological cryostat thin sections of mouse brain, our evidence unambiguously showed that in the presence of ice‐cold 1% buffered TX100 gangliosides and GPI‐anchored proteins left lipid rafts, entered the aqueous phase, and re‐equilibrated into other membrane compartments. Whereas at any time the lipid raft components remained predominantly TX100‐insoluble, they were no longer in their original membrane environment. These studies not only demonstrated the lipid raft‐disruptive properties of ice‐cold 1% buffered TX100, which causes shuffling of lipid molecules, but also provided an independent method to compare other detergents to identify those less likely to disrupt lipid raft components.
In subsequent studies using the same brain thin section reporting system (Heffer‐Lauc et al., 2007), we established that replacing TX100 with Brij O20 (polyoxyethylene (20) oleyl ether, previously called Brij 98 (Drevot et al., 2002)), did not result in redistribution of gangliosides and GPI‐anchored proteins, consistent with raft‐resident molecules staying in their original environment (Heffer‐Lauc et al., 2005, 2007). Based on these observations, we optimized a method for isolation of detergent‐resistant membranes which enabled realization of two major goals: a) to isolate membrane fractions under conditions retaining submembrane distribution of gangliosides and proteins; b) to determine the composition of major mammalian brain gangliosides, GM1, GD1a, GD1b, and GT1b, in detergent‐resistant membranes. Membrane fractions isolated from mouse brain tissue were analyzed in detail by combination of classical analytical and immunochemical methods. We report that use of Brij O20 results in a distinctive membrane distribution of gangliosides that, unlike the use of TX100, is not all LR associated, but depends on the ganglioside structure. To the best of our knowledge, this is the first report of a significant proportion of gangliosides outside raft domains, which brings novel insights into the membrane organization and warrants a change in the way we approach distribution of gangliosides in and out of lipid rafts.
Having established the ganglioside distribution using this new system, we determined the distribution of transmembrane proteins functionally related to neuroplasticity and known to be affected by ganglioside environment to resolve the discordance in the literature regarding their LR‐association (Cole et al., 2010; Hartmann & Prinetti, 2011; Hering et al., 2003; Hicks et al., 2012; Hou et al., 2008; Rushworth & Hooper, 2010; Santos et al., 2016; Vetrivel & Thinakaran, 2010). We assessed the distribution of glutamate receptor subunit 2 (GluA2), amyloid precursor protein (APP) and neuroplastin (Np) using this experimentally driven choice of detergent for LR isolation and report the LR populations of these proteins in mouse brain tissue.
2. MATERIALS AND METHODS
2.1. Materials
Usual laboratory buffer reagents, sucrose, and organic solvents were purchased from Kemika. Protease inhibitors (Protease inhibitor cocktail, cat.no. P8340), detergents (Brij O20, cat.no. 436240 and Triton X‐100, cat.no. T8787), bovine serum albumin (BSA, cat.no. A7906), Sephadex G‐25 gel (cat.no. G2580‐100G), HPTLC silica gel 60 glass plates (cat.no. 1.05631.0001), poly(isobutyl methacrylate) (cat.no. 181544), diaminobenzidine (DAB) tablets (SigmaFast DAB with Metal Enhancer, cat.no. D4293), indium tin oxide (ITO) slides (15–25 Ω/sq surface resistivity, cat.no. 636916),9–aminoacridine (9‐AA, cat.no. 8183620010), and Avertin (2,2,2‐tribromoethanol, cat.no. T48402‐25G) were purchased from Sigma‐Aldrich. DEAE Sephadex A‐25 (cat.no. GE17‐0170‐01) and liquid chromatography grade methanol (cat.no. 34885) were purchased from Merck. V. cholerae sialidase was expressed in E. coli and purified as described (Moustafa et al., 2004). Western blot reagents: NuPage LDS sample buffer (cat.no. NP0007), NuPage sample reducing buffer (cat.no. NP0009), NuPage antioxidant (cat.no. NP0005), NuPage 4%–12% precast Bis‐Tris gels (cat.no. NP0322BOX), prestained protein ladder (cat.no. 26616), MOPS electrophoresis running buffer (cat.no. NP0001), and NuPage transfer buffer (cat.no. NP00061) were all purchased from Thermo Fisher Scientific. PVDF blotting membranes (Porablot pore size 0.20 μm, cat.no. 741260) were from Macherey‐Nagel. Non‐fat dry milk used for blocking in western blotting was from Santa Cruz Biotechnology (cat.no. sc‐2324). Primary antibody for transferrin receptor (monoclonal mouse anti‐TfR, RRID:AB_2533029) and horseradish peroxidase (HRP)‐conjugated CTB (cholera toxin subunit B) which recognizes ganglioside GM1 (cat.no. C34780) were purchased from Thermo Fisher Scientific. Primary antibody for flotillin (monoclonal mouse anti‐Flot1, RRID:AB_398140) was purchased from BD Biosciences. Primary antibody recognizing GluA2 (monoclonal mouse anti‐GluA2/GluR2, RRID:AB_2232661) was purchased from Antibodies Inc. Primary antibody recognizing APP (monoclonal rabbit anti‐APP, RRID:AB_2289606) was purchased from Abcam. Primary antibody recognizing neuroplastin 65 (polyclonal goat anti‐Np65, RRID:AB_2155920) was purchased from R and D Systems. Monoclonal primary antibodies recognizing gangliosides GM1, GD1a, GD1b, and GT1b were prepared and validated as reported (Schnaar et al., 2002). Secondary antibodies were HRP conjugated (donkey anti‐mouse (RRID:AB_2340770), donkey anti‐rabbit (RRID:AB_10015282), rabbit anti‐goat (RRID:AB_2339400)) or biotin conjugated (goat anti‐mouse, RRID:AB_2338564) and were all purchased from Jackson ImmunoResearch Laboratories Europe. Tertiary HRP‐conjugated complex (A + B HRP Vector, RRID:AB_2336819) was purchased from Vector labs. Mounting medium (Biomount DPX, cat.no. BM‐500) was purchased from Biognost. ECL Clarity western blotting substrate (cat.no. 1705060) was purchased from BioRad. Isoflurane (Isofluran‐Piramal, cat.no. 66794001310) was purchased from Piramal Healthcare.
2.2. Animals
Adult 3‐ to 6‐month old C57BL/6 mice (RRID:MGI:5656552) of both sexes (18 male and 27 female) were used in this study (n = 45; n = 23 for optimization purposes and n = 22 used to generate the data presented). The animals, originally sourced from Harlan Laboratories, were group‐housed, kept under standardized temperature and humidity, and a 12 hr light–dark cycle with water and food ad libitum in standard cages. For lipid raft isolations, mice were anesthetized with Avertin and decapitated. Avertin (2,2,2‐tribromoethanol) was prepared accordingly by adding 3.1 ml of 2 methyl‐2‐butanol to 5 g 2,2,2‐tribromoethanol in a dark bottle and stirred until 2,2,2‐tribromoethanol was completely dissolved. Stock solution was stored at +4℃ and used up until 6 months after preparing. Working solution (20 mg/ml) was prepared fresh weekly by adding 0.25 ml of stock solution to 19.75 ml of sterile saline, stirred well at 40℃ and filtered through a 0.22 μm sterile filter into a sterile dark bottle and stored at +4℃ until use. Dose per mouse was 200 mg/kg and mice were injected intraperitoneally. After decapitation, brains were rapidly removed, dissected in a standardized manner, snap frozen in liquid nitrogen, and stored at −80℃. Cortical brain tissue was used for all lipid raft isolation experiments. To reduce the total number of animals used and to minimize animal suffering, one hemisphere was utilized for Brij O20 isolations, and other for Triton X‐100 isolations. For immunohistochemistry, mice were anesthetized with isoflurane overdose which was applied in isoflurane induction chamber until loss of consciousness and decapitated. Whole brains were fixed in 4% PFA, cryoprotected in sucrose, and cut with a cryostat. For imaging mass spectrometry (IMS) experiments, the animals were killed by cervical dislocation. Brains were removed, snap frozen, and cut with a cryostat. The experimental design including number of animals is shown in Figure 1. All experimental procedures were performed in accordance with the ARRIVE guidelines. All procedures were approved by regional ethics committees for scientific experiments and approved by the Croatian Ministry of Agriculture (2158‐61‐07‐14‐118), in accordance with institutional and government guidelines. There were no exclusion criteria predetermined, no randomization was performed, and the study was exploratory and not pre‐registered. The experiments were not performed in a blinded manner, and no sample calculation was performed as high inbred mouse line was used, and hence, the expected variability was low. The number of animals was determined based on studies of a similar nature (Ohmi et al., 2011; Persaud‐Sawin et al., 2009).
FIGURE 1.
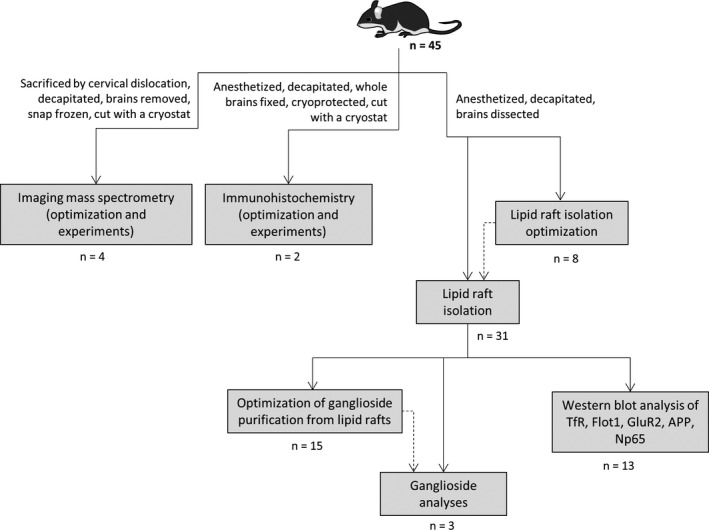
Experimental design flowchart. Number of animals per experiment type is shown
2.3. Immunohistochemistry
Coronal brain sections (35 μm) were pretreated in 3.33% H2O2 in phosphate‐buffered saline (PBS) for 30 min and washed. The sections were incubated in either PBS (no detergent), or PBS containing 1% TX100 or 1% Brij O20 for 2 hr and then treated with blocking medium (1% BSA, 5% goat serum, and 5% horse serum in PBS) for 2 hr at +4℃. Primary antibodies were diluted in blocking solution with no detergent as follows: 1:500 for GM1, 1:2 500 for GD1a, 1:4 000 for GD1b, and 1:4 000 for GT1b. Sections were incubated in primary antibody solutions overnight at +4℃, thoroughly washed, and then incubated with appropriate biotin‐conjugated secondary antibody diluted 1:2 000 in PBS for 5 hr at +4℃. After washing, the sections were incubated with A + B HRP vector with tertiary complex according to the manufacturer's instructions for 2 hr at +4℃. The sections were visualized using DAB tablets prepared according to the manufacturer's instructions until the development of color. The sections were mounted using Biomount onto glass slides and coverslipped. The staining with each antibody and for every condition was performed in triplicates, and repeated in 2 animals. The sections were imaged using Zeiss Axiovert 200 M. Digital images were quantified using ImageJ analysis software (NIH). Images were first converted to 8 bit. The quantification was done by measuring the integrated density in a 600 × 600 pixels square at least four times in each of the selected regions. Repeated measurements were performed at different positions within the selected region. Obtained values were averaged for each region and animal. The averaged values were positively correlated as follows: 360 000 pixels (total number of pixels of the measured area) were multiplied by 256 (8‐bit color intensity range). From the calculated number, measured and averaged value of the integrated density was subtracted. Hence, darker stained areas are represented as the higher number and lighter stained areas as the lower number. The obtained positively correlated values were converted into percentages of staining with respect to no detergent group.
2.4. MALDI‐TOF imaging mass spectrometry (IMS)
MALDI‐TOF imaging mass spectrometry (IMS) analysis was performed using Shimadzu IMScope TRIO MALDI‐IT‐TOF (Shimadzu, Kyoto, Japan). Cerebellar tissue sections (16‐μm) were mounted on ITO slides. After drying for 1 hr, the sections were treated for 2 hr with either PBS, 1% TX100 or 1% Brij O20 in PBS at +4℃. After washing with prechilled 20 mM ammonium acetate buffer, the sections were dried and stored at −80℃. Matrix was applied to samples using iMLayer device (Shimadzu, Kyoto, Japan) according to the manufacturer's instructions (5 min sublimation on 220℃). Sublimation was followed by 5 min recrystallization at 37℃ with 5% methanol in a vapor chamber. Imaging in the negative ion mode was performed using m/z ranges 600–900 and 1500–1900 and the following setup: pitch 10 μm, laser diameter 10 μm, laser intensity 10%, 75 laser shots/pixel, and 1 000 Hz laser frequency. Every experiment for every condition was performed in triplicate and repeated in total of 4 animals. Data analysis was performed by ImageReveal ver. 1.1.010128 (Shimadzu).
2.5. Lipid raft isolation procedures
Integral membrane protein flotillin (Flot1) was used as an LR marker. The protein transferrin receptor (TfR) was used as a non‐lipid raft (bulk, nLR) membrane marker. To compare outcomes of different lipid raft isolation procedures, lipid raft and bulk membrane fractions were collected following sucrose density ultracentrifugation and the distribution of the above markers determined by western blotting. The gangliosides were purified from collected fractions and analyzed by immunoblotting. In addition, fractions were analyzed for the distribution of transmembrane proteins GluA2, APP, and Np by western blotting. All reagents, solutions, and labware were pre‐cooled at ≤+4℃ and all steps performed on ice.
2.5.1. Isolation using Brij O20
LRs were isolated using discontinuous sucrose density centrifugation, by an optimized procedure modified in our Laboratory (Ilic et al., 2019; Puljko et al., 2021). Frozen cortical brain tissue samples were thawed on ice and 70 ± 5 mg of tissue was homogenized in 3 ml of detergent‐free homogenization buffer (50 mM Tris (pH = 8), 150 mM NaCl, 1 mM MgCl2, 1 mM CaCl2, and protease inhibitors 1 mM phenylmethylsulfonyl fluoride (PMSF), 5 mM NaF, 1 mM Na3VO4, and 1% protease inhibitor cocktail) containing 0.32 M sucrose with 30 strokes in a Potter‐Elvehjem glass homogenizer with a Teflon pestle. The homogenate was centrifuged at 1 000 g for 15 min at +4℃, postnuclear supernatant (PNS) removed, and pellet discarded. The PNS was ultracentrifuged at 100 000 g for 30 min at +4℃ (Beckman Optima XL‐80 K ultracentrifuge; 50.4 Ti rotor). The pellet was homogenized in 1 ml of homogenization buffer containing 1% Brij O20 with 15 strokes in a Potter‐Elvehjem glass homogenizer with a Teflon pestle. Homogenized pellet (600 µl) was placed in pre‐cooled SW 28.1 Ti ultracentrifuge tube on ice and gently mixed with 600 μL of 85% sucrose (w/v; prepared in homogenization buffer without protease inhibitors containing 1% Brij O20). This was carefully overlaid with 10 ml of 35% sucrose (w/v, prepared in homogenization buffer without protease inhibitors containing 1% Brij O20) followed by 4 ml of 3% sucrose (w/v, prepared in homogenization buffer without protease inhibitors containing 1% Brij O20). The tubes were ultracentrifuged at 141 000 g for 18 hr at +4℃ (Beckman Optima XL‐80 K; SW 28 rotor). After centrifugation, there was a visible band containing lipid rafts at the interface of 3% and 35% sucrose. Eleven fractions were collected top to bottom and stored at −80℃.
2.5.2. Isolation using Triton X‐100
To compare our optimized lipid raft isolation procedure using Brij O20 with isolation using TX100, we used published procedures (Aureli et al., 2016; Molander‐Melin et al., 2005; Ohmi et al., 2011) while maintaining the buffers, homogenization methods, centrifugation times, and sucrose gradient preparation used for the Brij O20 procedure to avoid differences due solely to methodological variations.
Frozen cortical brain tissue samples were thawed on ice and 70 ± 5 mg of tissue was homogenized in 2 ml of homogenization buffer containing 1% TX100 with 30 strokes in a Potter‐Elvehjem glass homogenizer with Teflon pestle. The homogenate was centrifuged at 1 000 g for 15 min at +4℃, postnuclear supernatant (PNS) removed, and pellet discarded. The supernatant (600 μl) was placed in pre‐cooled SW 28.1 Ti ultracentrifuge tube on ice and gently mixed with 600 μl of 85% sucrose (w/v; prepared in detergent‐free homogenization buffer without protease inhibitors). This was carefully overlaid with 10 ml of 35% sucrose (w/v; prepared in detergent‐free homogenization buffer without protease inhibitors) followed by 4 ml of 3% sucrose (w/v; prepared in detergent‐free homogenization buffer without protease inhibitors). The tube was ultracentrifuged at 141 000 g for 18 hr at +4℃ (Beckman Optima XL‐80 K; SW 28 rotor). After centrifugation, there was a visible band containing lipid rafts at the interface of 3% and 35% sucrose. Eleven fractions were carefully collected top to bottom and stored at −80℃.
2.6. Ganglioside analyses
Following a discontinuous sucrose density centrifugation, one ml of each lipid raft (LR) and bulk membrane (non‐lipid raft; nLR) fraction was pooled and used for ganglioside isolation according to the following protocol as reported previously (Puljko et al., 2021). Samples were subjected to short organic extraction (Schnaar, 1994; Svennerholm & Fredman, 1980) by adding 2.67 volumes of methanol followed by 1.33 volumes of chloroform to LR and nLR fractions. After brief centrifugation (450 g for 10 min at ambient temperature), the supernatant was recovered, measured, and 0.173 volumes of dH2O were added. After brief centrifugation as above, the upper phase was recovered and evaporated to dryness. The samples were further purified by DEAE anion‐exchange chromatography (Schnaar, 1994). The evaporated samples were dissolved in 1 ml of methanol and 400 µl of DEAE ion exchanger (acetate form (Schnaar, 1994)) prepared in chloroform‐methanol‐water (4:8:3) was added. The samples were incubated at ambient temperature for 3 hr with mixing. After centrifugation as above, the supernatant was discarded and the resin washed with 1 ml of methanol followed by 10‐min incubation while mixing and centrifugation as above. The supernatant was discarded and 1 ml of 100 mM sodium acetate (dissolved in methanol) was added to the resin. After a brief incubation and centrifugation as above, the supernatant was recovered and the last step was repeated after which the supernatants were pooled and evaporated to dryness. The residues were dissolved in chloroform–methanol–water (60:30:4.5) and purified by gel filtration on Sephadex‐G25 (Wells & Dittmer, 1963). The collected eluates were evaporated to dryness.
The samples were dissolved in chloroform–methanol–water (60:30:4.5), spotted on HPTLC plates and resolved in chloroform–methanol–aqueous 0.2% CaCl2 (50:40:10). After drying, the plate was immersed in 0.3% poly(isobutyl methacrylate) in n‐hexane for 90 s, thoroughly dried and overlaid with aqueous buffer containing V. cholerae sialidase (see below). Sialidase treatment degrades the resolved complex gangliosides to GM1, allowing CTB detection of each ganglioside species with equal binding affinity for accurate direct quantitative comparison (Davidsson et al., 1991). Sialidase was diluted to 30 mU/ml in phosphate‐buffered saline (PBS, with Ca2+ and Mg2+, pH =6.3), and the plate incubated immersed with occasional shaking for 3 hr at 37℃. After washing, the plate was blocked for 15 min at ambient temperature in 10 mg/ml BSA prepared in 0.1% Tween 20 in PBS (PBST). After blocking, the plate was incubated in HRP‐conjugated CTB diluted in blocking solution (1:20 000) for 1 hr at ambient temperature. After washing, the bands were visualized using DAB tablets prepared according to manufacturer's instructions until the development of color. Densitometry was performed using Image Lab software (BioRad) and bands were quantified using ImageJ analysis software (NIH).
2.7. Western blot analyses
Isolated fractions were thawed on ice and 15 µl of each fraction was mixed with 5 µl of LDS sample buffer: reducing buffer (2:1) and heated for 5 min at 95℃. Equal volumes were loaded to allow direct comparisons of protein distributions across fractions (Persaud‐Sawin et al., 2009). The samples were loaded onto 4%–12% Bis Tris gels and resolved in MOPS running buffer with antioxidant at 120 V for 80 min. After separation, proteins were electro‐transferred onto PVDF membranes at 20 V for 1 hr. Membranes were blocked with either 5% non‐fat dry milk (in the case of TfR, Flot1, Np, and GluA2 detection) or 30 mg/ml BSA (in the case of APP detection) in PBST for 1 hr at ambient temperature. Primary antibodies were diluted in corresponding blocking solutions as follows: 1:1 000 for TfR, 1:5 000 for Flot1, 1:1 000 for Np, 1:1 000 for GluA2, and 1:2 000 for APP. Membranes were incubated in primary antibody solutions overnight at +4℃, thoroughly washed, and then incubated with appropriate secondary antibodies (except for GM1 as CTB was already HRP‐conjugated) diluted 1:50 000 in PBS for 1 hr at ambient temperature. After washing, protein bands were visualized using ECL western blotting substrate and imaged on BioRad Chemidoc XRS+System. The bands were quantified using ImageJ analysis software (NIH) as relative intensity for all 11 fractions.
2.8. Statistical analysis
Data were processed in Microsoft Excel and statistical analyses were performed using GraphPad Prism (Version 8.4.2, GraphPad Software). Prior to statistical analysis, data were tested for normality using the Shapiro–Wilk test and the statistical tests were chosen appropriately. No outliers were removed prior to statistical analysis. For statistical analysis of ganglioside immunoreactivity distribution (relative CTB binding; Figure 8), Student's t test was performed. For protein immunoreactivity (Figures 9 and 10), a multiple t test was performed and statistical significance was determined using the Holm‐Šídák method. For comparing more than two groups, two‐way ANOVA was used, followed by Tukey's post hoc test to test for differences between groups (for calculating statistical significance for the difference in immunoreactivity for gangliosides GM1, GD1a, GD1b, and GT1b in immunohistochemistry sections treated with Brij O20, TX100, or non‐treated sections). In all cases, p < .05 was considered statistically significant. In Figures 9 and 10, data are presented as box plots with median (center line), minimum and maximum (whiskers), and 25th –75th percentile (box).
FIGURE 8.
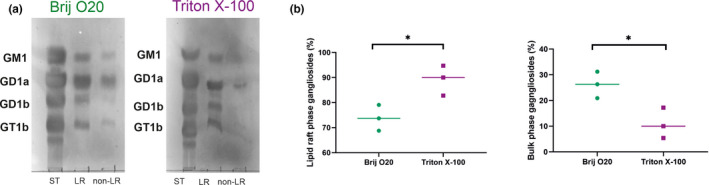
Distribution of major vertebrate gangliosides in lipid rafts (LR) and bulk membrane (nLR) isolated by using either Brij O20 or Triton X‐100 detergent. (a) Representative cholera toxin subunit B (CTB) overlay results following sialidase treatment for gangliosides GM1, GD1a, GD1b and GT1b. Left panel shows results of isolation using Brij O20, right panel shows results of isolation using Triton X‐100. ST =standard mixture of GM1, GD1a, GD1b, and GT1b. (b) Quantification results (percentage of relative CTB binding in LR and non‐LR fractions) are calculated using ImageJ. Results are shown as mean ±SE and individual values for ≥3 biological replicates. n(animals) = 3; n(technical replicates) = 3. The asterisk indicates statistical significance (p < .05; Student's t test)
FIGURE 9.
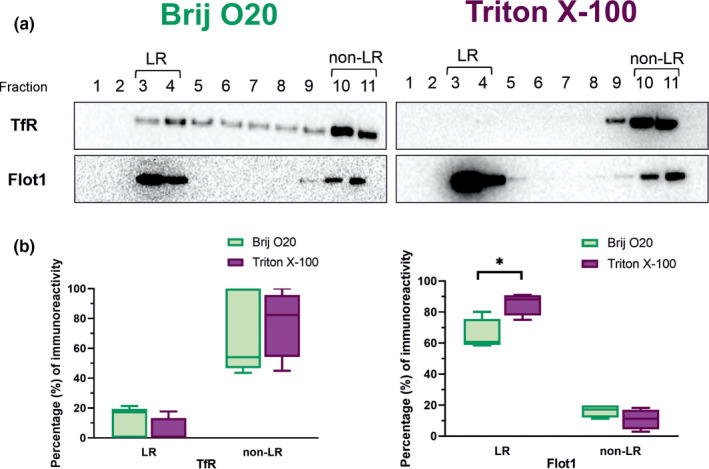
Distribution of common lipid rafts (LR) and bulk membrane (nLR) markers in membrane fractions isolated by using either Brij O20 or Triton X‐100 detergent. (a) Representative Western blot results for nLR marker transferrin receptor (TfR) and LR marker flotillin (Flot1). Fractions collected after lipid raft isolation are numbered 1–11. Left panels show results of isolation using Brij O20, right panels show results of isolation using Triton X‐100. (b) Boxes represent the percentage in LR and non‐LR fractions immunoreactivity intensity which is calculated using ImageJ. n(animals) = 5; n(technical replicates) = 4–5. The asterisk indicates statistical significance (p < .05; multiple t test and the Holm‐ Šídák method)
FIGURE 10.
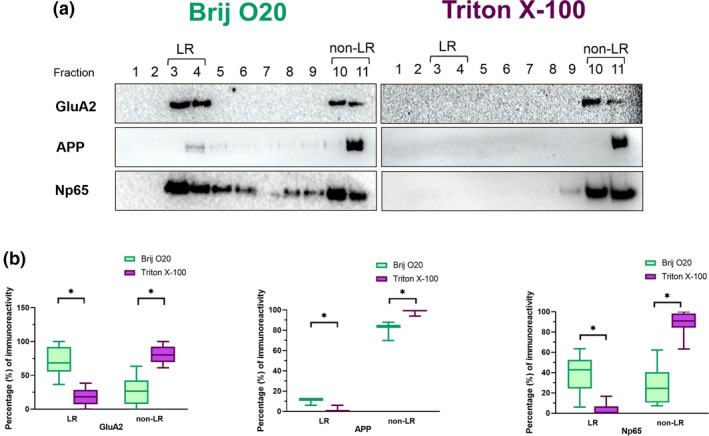
Distribution of glutamate receptor subunit 2 (GluA2), amyloid precursor protein (APP), and neuroplastin (Np) in lipid rafts (LR) and bulk membrane (nLR) isolated by using either Brij O20 or Triton X‐100 detergent. (a) Representative Western blot results. Fractions collected after lipid raft isolation are numbered 1–11. Left panels show results of isolation using Brij O20, right panels show results of isolation using Triton X‐100. (b) Boxes represent the percentage in LR and non‐LR fractions immunoreactivity intensity which is calculated using ImageJ. n(animals) = 8; n(technical replicates) = 3–8. The asterisk indicates statistical significance (p < .05; multiple t test and the Holm‐ Šídák method)
3. RESULTS
3.1. Redistribution of major brain gangliosides following incubation with Triton X‐100
Figure 2 shows the immunohistological distribution of major brain gangliosides in sublayers of cerebellum after treatment with Brij O20 and TX100 in comparison to the tissue sections not treated with detergents. The results clearly indicate that TX100 treatment leads to the most dramatic changes in ganglioside immunostaining pattern and intensity in all analyzed cerebellar areas, while Brij 020 treatment has no significant impact on immunoreactivity of gangliosides when compared to control sections. Quantification of immunoreactivity confirmed significantly higher staining of GM1, GD1a, GD1b, and GT1b in inferior cerebellar peduncle after TX100 treatment compared to non‐detergent protocol (GM1: p = .0329; Two‐way ANOVA, Tukey's post‐hoc analysis) or to Brij O20 treatment (GM1: p = .0095; GD1a: p = .0378, GD1b: p = .0330; GT1b: p = .0405; Two‐way ANOVA, Tukey's post‐hoc analysis). In gigantocellular reticular nucleus, significantly higher intensity of GM1, GD1a, and GT1b immunostaining was observed in TX100‐treated sections compared to non‐detergent protocol (GM1: p = .0104; GD1a: p = .0449; GT1b: p = .0307; Two‐way ANOVA, Tukey's post‐hoc analysis) or to Brij O20 treatment (GM1: p = .0030; GD1a: p = .0358; GT1b: p = .0177; Two‐way ANOVA, Tukey's post‐hoc analysis). Similar effect was observed in cerebellar arbor vitae, when comparing ganglioside species immunoreactivity after TX100 treatment to non‐detergent protocol (GD1a: p = .0462; GD1b: p = .0095; GT1b: p ≤ 0.0001; Two‐way ANOVA, Tukey's post‐hoc analysis) or to Brij O20 treatment (GM1: p = .0263; GD1a: p = .0380; GT1b: p = .0008; Two‐way ANOVA, Tukey's post‐hoc analysis). Unlike evidenced TX100 effects, Brij O20 had minimal to no impact on ganglioside immunoreactivity in cerebellar sections as compared with non‐detergent protocol. The only observed difference was lower GM1 staining in inferior cerebellar peduncle compared to non‐detergent treatment (p = .0234; Two‐way ANOVA, Tukey's post‐hoc analysis). Complete data related to statistical analysis of immunoreactivity quantifications are available in Table S1. Negative controls for immunohistochemical staining when primary antibodies are omitted are shown in Figure S1.
FIGURE 2.
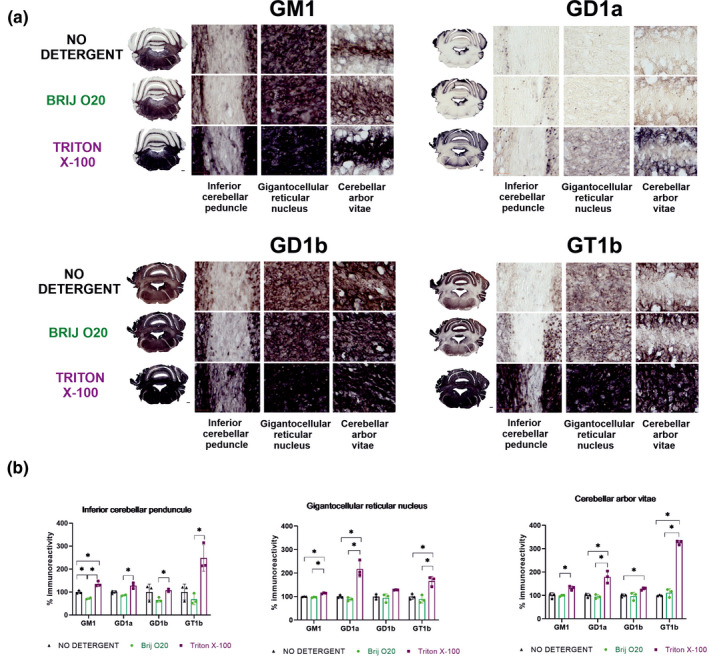
Effects of Brij O20 and Triton X‐100 on immunohistological redistribution of major brain gangliosides. (a) The effect of 1% of Triton X‐100 and Brij O20 compared to non‐detergent treatment on the redistribution of GM1, GD1a, GD1b, and GT1b in mouse cerebellum. Immunoreactivity of gangliosides is shown in selected cerebellar regions (inferior cerebellar peduncle, gigantocellular reticular nucleus and cerebellar arbor vitae). (b) Quantification of ganglioside immunoreactivity intensity in mouse cerebellum. n(animals) = 2; n(technical replicates) = 6. Asterisk represents statistically significant difference (two‐way ANOVA with Tukey's post‐hoc analysis; p < .05)
3.2. Imaging mass spectrometry (IMS) of Brij O20 versus Triton X‐100 treated mouse brain sections
Figure 3 shows average MALDI‐TOF mass spectra of mouse cerebellar sections recorded in 600–900 m/z range. Sections were incubated in PBS, 1% Brij O20, or 1% TX100 and both detergents have reduced MS signals, but TX100 caused more detrimental effects, especially for species in 700–800 m/z range.
FIGURE 3.
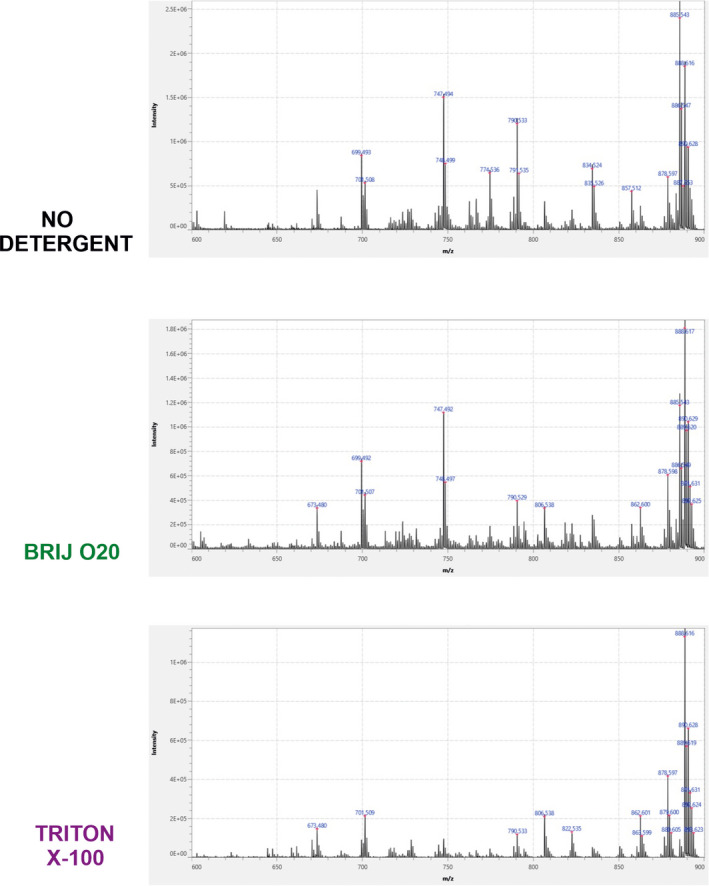
Average MALDI‐TOF spectra recorded in 600–900 m/z range following Brij O20 and Triton X‐100 treatment of mouse cerebellar tissue, compared to non‐treated sections. n(animals) = 4; n(technical replicates) = 12
Dominant simple phospholipid and glycolipid species were characterized by two opposite lateral distribution patterns (Figure S2a, b): molecular layer/granular layer or white matter tracts/granular layer. To further emphasize the changes that occur after detergent treatment, we summed the signals with a similar distribution and displayed them alongside the total ion current (TIC) images (Figure 4). TIC images showed significant redistribution of molecular species represented in 600–900 m/z range. In contrast to TX100 treatment, Brij O20 treatment retained the lateral distribution of summed m/z signals that correspond to the most abundant simple phospholipids and glycolipids (Table S2).
FIGURE 4.
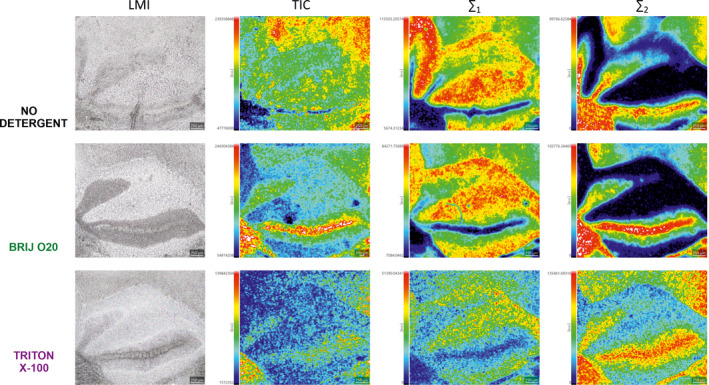
Mass spectrometry imaging in 600–900 m/z range following Brij O20 and Triton X‐100 treatment of mouse cerebellar tissue. Equally treated sections are presented in each row that begins with the light microscopy image (LMI) of the fresh frozen cerebellar section, followed by total ion current (TIC) images. ∑1 represents sum of m/z signals: 699.4927, 747.4938, 790.5328, 885.5433. ∑2 represents sum of m/z signals: 806.5374, 862.5997, 878.5972, 888.6160. Selected m/z signals correspond to the most abundant simple phospholipids and glycolipids characterized by contrasting lateral distribution in cerebellar tissue. n(animals) = 4; n(technical replicates) = 12
Figure 5 shows average MALDI‐TOF mass spectra recorded in 1500–1900 m/z range for cerebellar sections adjacent to the ones used for the lower mass range. Once again, TX100 reduced the signal much more than Brij O20. In this case, we summed all adducts (M‐H, M‐H2O‐H, M+Cl and M+CH3COOH‐H) from two main GM1 variants (GM1 (d18:1–18:0, 1545.877 AMU) and GM1 (d20:1–18:0, 1573.908 AMU) and from two main GD1 variants (GD1 (d18:1–18:0, 1836.973 AMU) and GD1 (d20:1–18:0, 1865.004 AMU) which is presented in Figure 6. In both cases, signal intensity and lateral distribution were better preserved when Brij O20 treatment was used. Finally, we generated ∑GM1 + GD1 image normalized to the highest signal of all three samples (no‐treatment, Brij O20, and TX100 treatment). In this case, we can detect some rearrangements generated by both detergents, but again much more prominently when TX100 is used.
FIGURE 5.
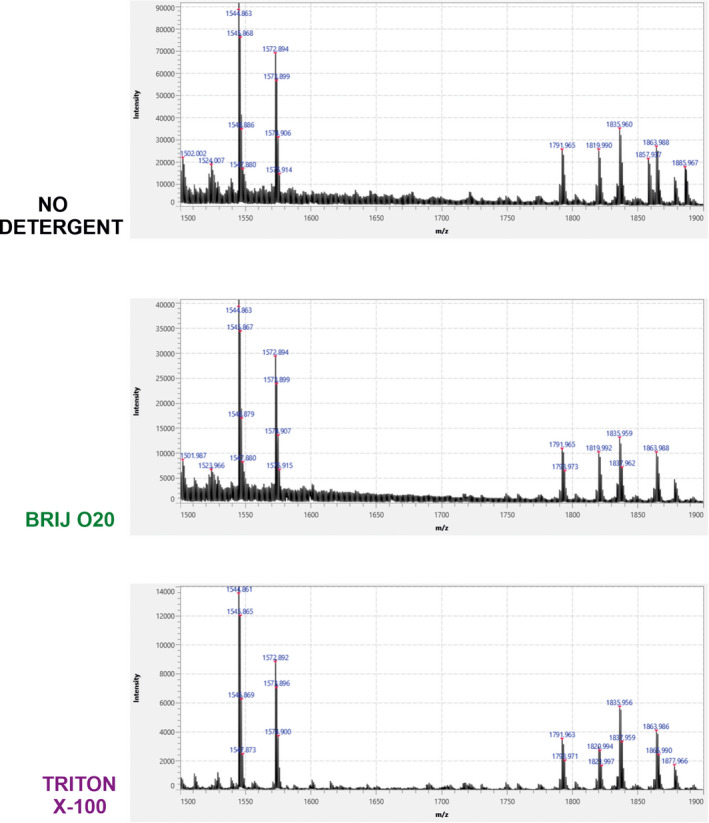
Average MALDI‐TOF spectra recorded in 1500–1900 m/z range following Brij O20 and Triton X‐100 treatment of mouse cerebellar tissue, compared to non‐treated sections. n(animals) = 4; n(technical replicates) = 12
FIGURE 6.
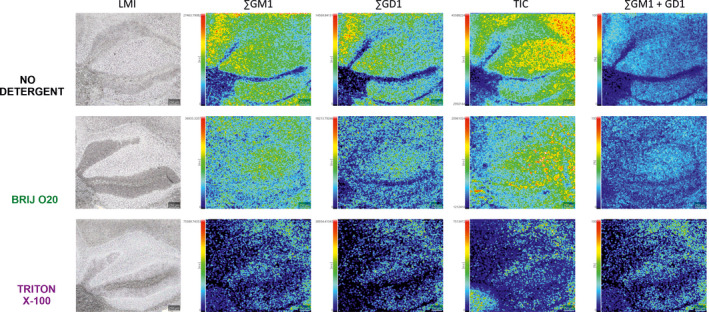
Mass spectrometry imaging in 1500–1900 m/z range following Brij O20 and Triton X‐100 treatment of mouse cerebellar tissue. Equally treated sections are presented in each row that begins with the light microscopy image (LMI) of the fresh frozen cerebellar section. It is followed by ∑GM1 image that represents sum of all adducts (M‐H, M‐H2O‐H, M+Cl and M+CH3COOH‐H) from two main GM1 variants (GM1 (d18:1–18:0) and GM1 (d20:1–18:0). ∑GD1 image represents sum of all adducts (M‐H, M‐H2O‐H, M+Cl and M+CH3COOH‐H) from two main GD1 variants (GD1 (d18:1–18:0) and GD1 (d20:1–18:0), which is followed by total ion current (TIC) image of the sample. ∑GM1 + GD1image represents sum of major brain gangliosides normalized according to the highest signal of those three samples. n(animals) = 4; n(technical replicates) = 12
3.3. Distribution of major brain gangliosides in lipid rafts and bulk membrane in Brij O20 versus Triton X‐100 isolation
The distribution of the major brain gangliosides GM1, GD1a, GD1b, and GT1b, which account for up to 97% of all ganglioside species in vertebrate brain, was analyzed in LRs and bulk membrane, as well as compared between LR isolations using Brij O20 or TX100 (Figures 7 and 8). When Brij O20 is used in the isolation procedure, there is a rich pattern of gangliosides found in the bulk membrane, significantly more than in TX100 isolations. Overall, 74% of the total gangliosides detected resides in lipid rafts and 26% in non‐rafts for Brij O20 isolations, while 90% of the total gangliosides detected is present in rafts, with only 10% in the bulk membrane for TX100 isolation (Figure 7). All four major gangliosides are found outside rafts in Brij O20 isolations, while for TX100, GD1a is easily observable (with the percentage present in nLR membrane of 21%), followed by GM1, a classical LR marker, of 16% out of rafts, and GD1b and GT1b present in negligible amounts in nLR membrane for TX100 isolations (less than 2% for GD1b and 4% for GT1b), shown in Figure 7. On the other hand, in Brij O20 isolation, the percentage of GM1 outside rafts is a high 32%, GD1a 35%, while GD1b and GT1b exhibit lower abundance outside rafts: 16% for GD1b and 21% for GT1b. The difference in submembrane distribution for major brain gangliosides between Brij O20 and TX100 isolations is statistically significant (p = .0285).
FIGURE 7.
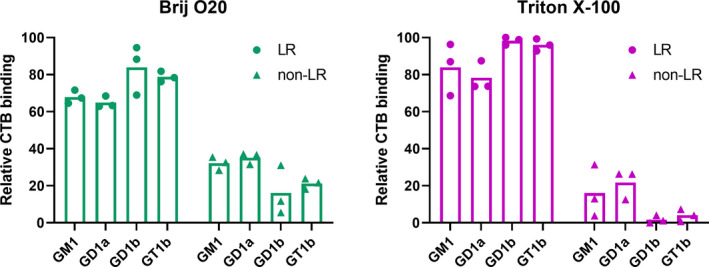
Distribution of major brain gangliosides in lipid rafts (LR) and bulk membrane (nLR) isolated by using either Brij O20 or Triton X‐100 detergent. Individual values of relative CTB binding intensity of the three biological replicates are shown. n(animals) = 3; n(technical replicates) = 3
3.4. Distribution of raft and non‐raft markers Flot1 and TfR in Brij O20 versus Triton X‐100 isolation
To determine the efficacy of lipid raft isolations by two different isolation procedures, we assessed the distribution of generally accepted LR marker flotillin (Flot1) and non‐LR marker transferrin receptor (TfR) (Aureli et al., 2016; Chamberlain, 2004; Persaud‐Sawin et al., 2009) (Figure 9). The majority of TfR is found in non‐LR (bulk membrane) fractions: 69% and 77% for Brij O20 and TX100 isolation, respectively. Flot1 appears primarily but not exclusively in raft fraction as previously reported (Macdonald & Pike, 2005; Persaud‐Sawin et al., 2009; Williamson et al., 2010), but the difference in distribution of flotillin in rafts between Brij O20 and TX100 isolation is significant: 65% and 85% for Brij O20 and TX100 isolation, respectively (p = .017).
3.5. Distribution of transmembrane proteins functionally related to neuroplasticity in Brij O20 versus Triton X‐100 isolation
After establishing the relative raft distributions of gangliosides and classical raft markers, we investigated the distribution of proteins proposed to be affected by ganglioside associations. Figure 10 shows the distribution of transmembrane proteins glutamate receptor subunit 2, amyloid precursor protein, and neuroplastin.
In the case of GluA2, when Brij O20 is used in the isolation, the majority of GluA2 appears in LR fractions (75%) compared to 21% in the non‐LR fractions. However, in the case of TX100 isolation, the majority of GluA2 is no longer present in LR fractions where 15% of the immunoreactivity is detected, as opposed to 83% in the non‐LR fractions. This difference in immunoreactivity for LR and non‐LR fractions in Brij O20 compared to TX100 isolation is statistically significant (p = .002 for LR fractions and p = .001 for non‐LR fractions).
The trend of higher proportion of protein present in LR fractions using Brij O20 in the isolation observed for GluA2 is consistent for APP as well. Almost 10% of APP is present in LR fractions when Brij O20 is used for isolation, compared to only 2% for TX100 isolation. For non‐LR fractions, 80% of APP is found in non‐LR fractions in Brij O20 isolations, compared to 98% for TX100 isolation. The difference in percentage of APP immunoreactivity for LR and non‐LR fractions in Brij O20 compared to TX100 isolation is also statistically significant (p = .048 for LR fractions and p = .039 for non‐LR fractions).
In the case of neuroplastin, 40% of Np is present in LR fractions after using Brij O20 in the isolation procedure, compared to only 4% in LR fractions when TX100 is used in isolation, with the majority of Np65 (88%) being present in the non‐LR fractions in TX100 isolation (compared to 26% in non‐LR fractions in Brij O20 isolation) (Figure 10). The difference in percentage of immunoreactivity for LR and non‐LR fractions in Brij O20 compared to TX100 isolation is statistically significant (p < .001 for both LR and non‐LR fractions). The Np distribution across all fractions collected during LR isolation is much more diffuse when Brij O20 is used compared to TX100 where there is a distinct accumulation of Np in heavy non‐LR fractions.
4. DISCUSSION
The analysis of lipid rafts, which are by definition dynamic platforms, not surprisingly yields different results based on the detergent used to isolate them. However, based on histological stability of membrane residency, we confirmed that cold TX100 treatment, a standard for lipid raft isolation, solubilizes raft markers (gangliosides) where they re‐equilibrate into different membrane compartments, whereas the similar polyethylene oxide detergent Brij O20 leaves raft markers in their membrane milieu. We report a strikingly different distribution pattern of gangliosides dependent on whether Brij O20 or TX100 is used in immunohistochemical, mass spectrometry, or lipid raft analyses of mouse brain. The differences are readily noticeable between white and gray matter, revealed by immunohistochemistry (Figure 2) and IMS (Figures 3, 4, 5, 6), and between raft and non‐raft membrane, determined by lipid raft isolation and subsequent ganglioside analyses (Figures 7 and 8). The effect of detergent treatment on lipid localization in histological sections analyzed by IMS has never been reported before. The IMS analysis demonstrated that TX100 severely reduced the MS signals, in addition to causing localization rearrangements between white and gray matter for gangliosides as well as simple phospholipid and glycolipid species (Figures 3, 4, 5, 6 and Figure S2), compared to non‐detergent protocol. When comparing the decreased signal after TX100 treatment in IMS and immunohistochemistry analysis, it has to be kept in mind that antigen detection by primary antibody is influenced by affinity of the antibody for the antigen and can be obscured by either too much or too less primary antibody (Hoffman et al. 2016). A higher signal on immunohistochemistry may be because of antigen abundance—what is likely the case with the four major gangliosides in nervous tissue. After extraction of part of the ganglioside with detergents, the excess antigen is removed and with the same concentration of primary antibody, a higher signal can be detected primarily because of a more favorable titration ratio between the amount of antigen and primary antibody, not because “unmasking” of antigen. The conjunction of immunohistochemical and imaging mass spectrometry analysis showing significant misplacement of all four major mammalian brain gangliosides in addition to altered immunoreactivity signal demonstrates that the disruptive effects of TX100 cannot be overlooked.
Having previously established in histological sections (Heffer‐Lauc et al., 2005, 2007) that use of certain non‐ionic detergents, notably TX100, results in bulk phase redistribution of certain membrane molecules (gangliosides and GPI‐anchored proteins), we now demonstrate that use of Brij O20 in lipid raft isolation, a detergent that causes minimal shuffling of lipids and lipid‐dependent molecules between membranes, reveals an abundant presence of gangliosides in the non‐raft plasma membrane. The observed enriched ganglioside pattern outside rafts is not surprising considering the highly dynamic nature of lipid rafts which need to quickly and efficiently respond to extracellular stimuli (Carquin et al., 2016; Grassi et al., 2019; Sezgin et al., 2017).
Although the distribution of the raft and non‐raft markers in our study (Flot1, TfR) is quite similar using the known LR disruptor TX100 and the LR non‐disruptor Brij O20, there are distinctive and quantitatively large differences for distributions of gangliosides and other functional markers tested. The overall similar appearance of known LR and non‐LR markers (Flot1 and TfR) when different detergents are used may be particularly misleading when conclusions are drawn regarding the fidelity of lipid raft isolation. Hence, the distribution of proteins in LRs using a LR‐disrupting detergent (TX100) should be considered quantitatively inaccurate, even though it is possible that different aspects of the organization of the membrane are highlighted using TX100 compared to other detergents. Furthermore, we have established that even though GM1 is a feasible lipid raft marker, other gangliosides, particularly GD1b, are even more appropriate for that task as they are more concentrated in rafts than GM1.
Gangliosides are crucial in the maintenance of lipid rafts as verified by studies showing that ganglioside deficiency and/or compositional change disturb lipid raft integrity (Ohmi et al., 2011, 2012). Therefore, redistribution of gangliosides during lipid raft isolation could lead to redistribution of proteins known to be affected by ganglioside milieu. Indeed, we confirmed this effect of different lipid raft isolation procedures on changed ganglioside composition with subsequent redistribution of GluA2, APP, and Np within the membrane. AMPA receptors localize within specific regions of synaptic membranes rich in GM1 ganglioside (Cole et al., 2010). Gangliosides sequester GluA2‐containing AMPA receptors and GluA2 specifically binds to GM1 (Prendergast et al., 2014) and would therefore be reasonable to assume that it is affected by ganglioside redistribution, which indeed we show is the case. Most published analyses using TX100 in the isolation procedure show the presence of only a minor subpopulation of GluA2 receptors in LRs, which is in agreement with our data for TX100 (Figure 10) (Hou et al., 2008). The conundrum, however, is that published data from co‐localization, co‐segregation studies and pull‐down assays differ from data obtained using TX100‐generated rafts, in that the majority of GluA2 receptor is present in the raft fractions (Cole et al., 2010; Hering et al., 2003; Hou et al., 2008), findings that are consistent with our data when Brij O20 is used in the isolation procedure (Figure 10). Therefore, by using rational approach where choice of detergent is made based on its stability for molecules known to be in rafts, we were able to bring physical isolation and co‐localization findings into concordance, showing that the AMPA receptor subunit GluR2 is highly enriched in lipid rafts.
Amyloid precursor protein processing is heavily dependent on ganglioside composition of the membrane and lipid rafts are considered platforms for amyloid conversion where processing of APP by secretases occurs (Fabelo et al., 2014; Fantini & Yahi, 2015; Grassi et al., 2019; Grimm et al., 2017; Yamaguchi et al., 2016). However, it is important to discriminate between normal and pathological conditions, primarily Alzheimer's disease (AD). Many studies have been conducted to determine the precise role of lipid rafts in the pathogenesis of AD, but the results are often conflicting (Rushworth & Hooper, 2010). The research indicates that the key players involved in APP processing are segregated in and out of LRs. Namely, APP is found primarily, but not exclusively, outside LRs, while APP processing enzymes (β‐secretase and γ‐secretase) predominantly reside inside LRs (Fabelo et al., 2014; Rushworth & Hooper, 2010; Santos et al., 2016; Vetrivel & Thinakaran, 2010). Under normal, non‐pathological conditions, APP is first processed outside LRs in a different manner than pathological conditions where APP is cleaved sequentially inside LRs (Hartmann & Prinetti, 2011; Hicks et al., 2012; Santos et al., 2016; Vetrivel & Thinakaran, 2010). Therefore, our results (Figure 10) obtained in healthy wild‐type mouse brain tissue are in accordance with published studies finding APP primarily outside LRs. However, the proportion of APP found in LRs is still significantly higher using Brij O20 than TX100 in the isolation procedure (10% vs. 2%), which is not at all surprising having in mind a membrane dynamics in living cells and cellular functions of APP dependent on moving in and out of LRs.
Neuroplastin is a cell adhesion molecule (CAM) involved in regulation of synaptic plasticity, formation and stabilization of excitatory synapses, balancing the ratio of excitatory and inhibitory synapses and neuronal calcium regulation, as well as being implicated in AD (Beesley et al., 2014; Gong et al., 2018; Herrera‐Molina et al., 2014, 2017; Ilic et al., 2019; Korthals et al., 2017). It is a heavily glycosylated transmembrane protein dependent on ganglioside environment: Np expression and localization are altered in the brains of mice lacking complex gangliosides (Mlinac et al., 2012). Np has not previously been investigated in the light of LR/non‐LR association and as it is influenced by gangliosides in the membrane, we hypothesized that we will also detect a difference in Np distribution between Brij O20 and TX100 isolations. As a protein which holds a major role for neuroplasticity processes and is ganglioside‐affected, it is difficult to accept that the distribution shown in TX100 isolations reflects the physiological positioning of Np. We found that to investigate ganglioside‐associated proteins linked to neuroplasticity and neurodegeneration in brain tissue, Brij O20 appears to be consistent with other, non‐detergent‐dependent methods. By using a rational choice of detergent, we can explain and bring into concordance data conflicted about LR affiliation of specific proteins and demonstrate that we can biochemically confirm different co‐localization studies performed in live cells, which were not in agreement with lipid rafts studies.
These results offer a change in paradigm that all gangliosides are almost exclusive to lipid rafts and we trust this work will enable more accurate lipid raft analyses in respect of glycosphingolipid and membrane protein composition and lead to improved resolution of lipid–protein functional associations within lipid rafts.
CONFLICT OF INTEREST
The authors declare no conflict of interest.
AUTHOR CONTRIBUTIONS
K. Mlinac‐Jerkovic, R.L. Schnaar, and M. Heffer designed the research; K. Mlinac‐Jerkovic, K. Ilic, M. Zjalić, D. Mandić, Ž. Debeljak, M. Balog, V. Damjanović, N. Maček Hrvat, N. Habek and M. Heffer performed the research; K. Mlinac‐Jerkovic, K. Ilic, M. Zjalić, D. Mandić, Ž. Debeljak, S. Kalanj‐Bognar, R.L. Schnaar, and M. Heffer analyzed and interpreted data; K. Mlinac‐Jerkovic wrote manuscript draft; M. Heffer and R.L. Schnaar critically revised and edited the manuscript; S. Kalanj‐Bognar, R.L. Schnaar, and M. Heffer supervised the study; S. Kalanj‐Bognar, R.L. Schnaar and M. Heffer obtained funding. All authors read and approved the final version of the manuscript.
Supporting information
Supplementary Material
ACKNOWLEDGMENTS
This work was funded by Croatian Science Foundation grant to MH (Raft tuning, IP‐2014‐09‐2324) and SK‐B (NeuroReact, IP‐2016‐06‐8636). MH kindly acknowledges the support of University of Osijek (INGI‐2015‐35 grant). KM‐J gratefully acknowledges the support from EMBO (Short‐term fellowship, ASTF 363‐2015), and RLS support from the US National Institutes of Health (U01CA241953). The authors would like to thank Prof. Aleksandra Dugandzic for contributing to manuscript preparation. This publication was co‐financed by the European Union through the European Regional Development Fund, Operational Programme Competitiveness and Cohesion, grant agreement No. KK.01.1.1.01.0007, CoRE – Neuro and grant agreement No KK.01.1.1.02.0015. Graphical abstract was created with BioRender.com.
All experiments were conducted in compliance with the ARRIVE guidelines.
Mlinac‐Jerkovic, K. , Ilic, K. , Zjalić, M. , Mandić, D. , Debeljak, Ž. , Balog, M. , Damjanović, V. , Maček Hrvat, N. , Habek, N. , Kalanj‐Bognar, S. , Schnaar, R. L. , & Heffer, M. (2021). Who's in, who's out? Re‐evaluation of lipid raft residents. Journal of Neurochemistry, 158, 657–672. 10.1111/jnc.15446
DATA AVAILABILITY STATEMENT
The data that support the findings of this study are available from the corresponding author upon reasonable request.
REFERENCES
- Aureli, M. , Grassi, S. , Sonnino, S. , & Prinetti, A. (2016). Isolation and analysis of detergent‐resistant membrane fractions. Methods in Molecular Biology, 1376, 107–131. [DOI] [PubMed] [Google Scholar]
- Beesley, P. W. , Herrera‐Molina, R. , Smalla, K. H. , & Seidenbecher, C. (2014). The Neuroplastin adhesion molecules: Key regulators of neuronal plasticity and synaptic function. Journal of Neurochemistry, 131, 268–283. 10.1111/jnc.12816 [DOI] [PubMed] [Google Scholar]
- Canerina‐Amaro, A. , Hernandez‐Abad, L. G. , Ferrer, I. , Quinto‐Alemany, D. , Mesa‐Herrera, F. , Ferri, C. , Puertas‐Avendano, R. A. , Diaz, M. , & Marin, R. (2017). Lipid raft ER signalosome malfunctions in menopause and Alzheimer's disease. Frontiers in Bioscience, 9, 111–126. [DOI] [PubMed] [Google Scholar]
- Carquin, M. , D'Auria, L. , Pollet, H. , Bongarzone, E. R. , & Tyteca, D. (2016). Recent progress on lipid lateral heterogeneity in plasma membranes: From rafts to submicrometric domains. Progress in Lipid Research, 62, 1–24. 10.1016/j.plipres.2015.12.004 [DOI] [PMC free article] [PubMed] [Google Scholar]
- Chamberlain, L. H. (2004). Detergents as tools for the purification and classification of lipid rafts. FEBS Letters, 559, 1–5. 10.1016/S0014-5793(04)00050-X [DOI] [PubMed] [Google Scholar]
- Cole, A. A. , Dosemeci, A. , & Reese, T. S. (2010). Co‐segregation of AMPA receptors with G(M1) ganglioside in synaptosomal membrane subfractions. The Biochemical Journal, 427, 535–540. 10.1042/BJ20091344 [DOI] [PMC free article] [PubMed] [Google Scholar]
- Dalskov, S. M. , Immerdal, L. , Niels‐Christiansen, L. L. , Hansen, G. H. , Schousboe, A. , & Danielsen, E. M. (2005). Lipid raft localization of GABA A receptor and Na+, K+‐ATPase in discrete microdomain clusters in rat cerebellar granule cells. Neurochemistry International, 46, 489–499. 10.1016/j.neuint.2004.11.010 [DOI] [PubMed] [Google Scholar]
- Davidsson, P. , Fredman, P. , Mansson, J. E. , & Svennerholm, L. (1991). Determination of gangliosides and sulfatide in human cerebrospinal fluid with a microimmunoaffinity technique. Clinica Chimica Acta, 197, 105–115. 10.1016/0009-8981(91)90272-E [DOI] [PubMed] [Google Scholar]
- Drevot, P. , Langlet, C. , Guo, X. J. , Bernard, A. M. , Colard, O. , Chauvin, J. P. , Lasserre, R. , & He, H. T. (2002). TCR signal initiation machinery is pre‐assembled and activated in a subset of membrane rafts. EMBO Journal, 21, 1899–1908. 10.1093/emboj/21.8.1899 [DOI] [PMC free article] [PubMed] [Google Scholar]
- Eckert, G. P. , Igbavboa, U. , Muller, W. E. , & Wood, W. G. (2003). Lipid rafts of purified mouse brain synaptosomes prepared with or without detergent reveal different lipid and protein domains. Brain Research, 962, 144–150. 10.1016/S0006-8993(02)03986-0 [DOI] [PubMed] [Google Scholar]
- Fabelo, N. , Martin, V. , Marin, R. , Moreno, D. , Ferrer, I. , & Diaz, M. (2014). Altered lipid composition in cortical lipid rafts occurs at early stages of sporadic Alzheimer's disease and facilitates APP/BACE1 interactions. Neurobiology of Aging, 35, 1801–1812. 10.1016/j.neurobiolaging.2014.02.005 [DOI] [PubMed] [Google Scholar]
- Fantini, J. , & Yahi, N. (2015). Common mechanisms in neurodegenerative diseases. In Fantini J., & Yahi N. (Eds.), Brain lipids in synaptic function and neurological disease (pp. 183–200). Academic Press. [Google Scholar]
- Gong, D. , Chi, X. , Ren, K. , Huang, G. , Zhou, G. , Yan, N. , Lei, J. , & Zhou, Q. (2018). Structure of the human plasma membrane Ca(2+)‐ATPase 1 in complex with its obligatory subunit neuroplastin. Nature Communications, 9, 3623. 10.1038/s41467-018-06075-7 [DOI] [PMC free article] [PubMed] [Google Scholar]
- Grassi, S. , Giussani, P. , Mauri, L. , Prioni, S. , Sonnino, S. , & Prinetti, A. (2019). LIPID RAFTS AND NEURODEGENERATION: Structural and functional roles in physiologic aging and neurodegenerative diseases. Journal of Lipid Research, 61(5), 636–654. 10.1194/jlr.TR119000427 [DOI] [PMC free article] [PubMed] [Google Scholar]
- Grimm, M. O. , Mett, J. , Grimm, H. S. , & Hartmann, T. (2017). APP function and lipids: A bidirectional link. Frontiers in Molecular Neuroscience, 10, 63. 10.3389/fnmol.2017.00063 [DOI] [PMC free article] [PubMed] [Google Scholar]
- Hartmann, T. , & Prinetti, A. (2011). Going the wrong road: Fyn and targeting of amyloid precursor protein to lipid rafts. Journal of Neurochemistry, 118, 677–679. 10.1111/j.1471-4159.2011.07353.x [DOI] [PubMed] [Google Scholar]
- Heffer‐Lauc, M. , Lauc, G. , Nimrichter, L. , Fromholt, S. E. , & Schnaar, R. L. (2005). Membrane redistribution of gangliosides and glycosylphosphatidylinositol‐anchored proteins in brain tissue sections under conditions of lipid raft isolation. Biochimica Et Biophysica Acta, 1686, 200–208. 10.1016/j.bbalip.2004.10.002 [DOI] [PubMed] [Google Scholar]
- Heffer‐Lauc, M. , Viljetic, B. , Vajn, K. , Schnaar, R. L. , & Lauc, G. (2007). Effects of detergents on the redistribution of gangliosides and GPI‐anchored proteins in brain tissue sections. The Journal of Histochemistry and Cytochemistry: Official Journal of the Histochemistry Society, 55, 805–812. 10.1369/jhc.7A7195.2007 [DOI] [PMC free article] [PubMed] [Google Scholar]
- Hering, H. , Lin, C. C. , & Sheng, M. (2003). Lipid rafts in the maintenance of synapses, dendritic spines, and surface AMPA receptor stability. The Journal of Neuroscience: The Official Journal of the Society for Neuroscience, 23, 3262–3271. 10.1523/JNEUROSCI.23-08-03262.2003 [DOI] [PMC free article] [PubMed] [Google Scholar]
- Herrera‐Molina, R. , Mlinac‐Jerkovic, K. , Ilic, K. , Stöber, F. , Vemula, S. K. , Sandoval, M. , Milosevic, N. J. , Simic, G. , Smalla, K.‐H. , Goldschmidt, J. , Bognar, S. K. , & Montag, D. (2017). Neuroplastin deletion in glutamatergic neurons impairs selective brain functions and calcium regulation: Implication for cognitive deterioration. Scientific Reports, 7, 7273. 10.1038/s41598-017-07839-9 [DOI] [PMC free article] [PubMed] [Google Scholar]
- Herrera‐Molina, R. , Sarto‐Jackson, I. , Montenegro‐Venegas, C. , Heine, M. , Smalla, K. H. , Seidenbecher, C. I. , Beesley, P. W. , Gundelfinger, E. D. , & Montag, D. (2014). Structure of excitatory synapses and GABAA receptor localization at inhibitory synapses are regulated by neuroplastin‐65. The Journal of Biological Chemistry, 289, 8973–8988. 10.1074/jbc.M113.514992 [DOI] [PMC free article] [PubMed] [Google Scholar]
- Hicks, D. A. , Nalivaeva, N. N. , & Turner, A. J. (2012). Lipid rafts and Alzheimer's disease: Protein‐lipid interactions and perturbation of signaling. Frontiers in Physiology, 3, 189. 10.3389/fphys.2012.00189 [DOI] [PMC free article] [PubMed] [Google Scholar]
- Hoffman, G. E. , Murphy, K. J. , & Sita, L. V. (2016). The importance of titrating antibodies for immunocytochemical methods. Current Protocols in Neuroscience, 76(1), 11–12. 10.1002/cpns.1. [DOI] [PMC free article] [PubMed] [Google Scholar]
- Hou, Q. , Huang, Y. , Amato, S. , Snyder, S. H. , Huganir, R. L. , & Man, H. Y. (2008). Regulation of AMPA receptor localization in lipid rafts. Molecular and Cellular Neurosciences, 38, 213–223. 10.1016/j.mcn.2008.02.010 [DOI] [PMC free article] [PubMed] [Google Scholar]
- Ilic, K. , Auer, B. , Mlinac‐Jerkovic, K. , & Herrera‐Molina, R. (2019). Neuronal signaling by Thy‐1 in Nanodomains with specific ganglioside composition: Shall we open the door to a new complexity? Frontiers in Cell and Developmental Biology, 7, 27. 10.3389/fcell.2019.00027 [DOI] [PMC free article] [PubMed] [Google Scholar]
- Komura, N. , Suzuki, K. G. N. , Ando, H. , Konishi, M. , Koikeda, M. , Imamura, A. , Chadda, R. , Fujiwara, T. K. , Tsuboi, H. , Sheng, R. , Cho, W. , Furukawa, K. , Furukawa, K. , Yamauchi, Y. , Ishida, H. , Kusumi, A. , & Kiso, M. (2016). Raft‐based interactions of gangliosides with a GPI‐anchored receptor. Nature Chemical Biology, 12, 402–410. 10.1038/nchembio.2059 [DOI] [PubMed] [Google Scholar]
- Korthals, M. , Langnaese, K. , Smalla, K.‐H. , Kähne, T. , Herrera‐Molina, R. , Handschuh, J. , Lehmann, A.‐C. , Mamula, D. , Naumann, M. , Seidenbecher, C. , Zuschratter, W. , Tedford, K. , Gundelfinger, E. D. , Montag, D. , Fischer, K.‐D. , & Thomas, U. (2017). A complex of Neuroplastin and plasma membrane Ca(2+) ATPase controls T cell activation. Scientific Reports, 7, 8358. 10.1038/s41598-017-08519-4 [DOI] [PMC free article] [PubMed] [Google Scholar]
- Ledeen, R. W. , & Wu, G. (2015). The multi‐tasked life of GM1 ganglioside, a true factotum of nature. Trends in Biochemical Sciences, 40, 407–418. 10.1016/j.tibs.2015.04.005 [DOI] [PubMed] [Google Scholar]
- Macdonald, J. L. , & Pike, L. J. (2005). A simplified method for the preparation of detergent‐free lipid rafts. Journal of Lipid Research, 46, 1061–1067. 10.1194/jlr.D400041-JLR200 [DOI] [PubMed] [Google Scholar]
- Marin, R. , Casanas, V. , Perez, J. A. , Fabelo, N. , Fernandez, C. E. , & Diaz, M. (2013). Oestrogens as modulators of neuronal signalosomes and brain lipid homeostasis related to protection against neurodegeneration. Journal of Neuroendocrinology, 25, 1104–1115. 10.1111/jne.12068 [DOI] [PubMed] [Google Scholar]
- Marin, R. , Fabelo, N. , Fernandez‐Echevarria, C. , Canerina‐Amaro, A. , Rodriguez‐Barreto, D. , Quinto‐Alemany, D. , Mesa‐Herrera, F. , & Diaz, M. (2016). Lipid raft alterations in aged‐associated neuropathologies. Current Alzheimer Research, 13, 973–984. 10.2174/1567205013666160314150017 [DOI] [PubMed] [Google Scholar]
- Mlinac, K. , Jovanov Milosevic, N. , Heffer, M. , Smalla, K. H. , Schnaar, R. L. , & Kalanj Bognar, S. (2012). Neuroplastin expression in the hippocampus of mice lacking complex gangliosides. Journal of Molecular Neuroscience: MN, 48, 161–166. 10.1007/s12031-012-9801-x [DOI] [PubMed] [Google Scholar]
- Molander‐Melin, M. , Blennow, K. , Bogdanovic, N. , Dellheden, B. , Mansson, J. E. , & Fredman, P. (2005). Structural membrane alterations in Alzheimer brains found to be associated with regional disease development; increased density of gangliosides GM1 and GM2 and loss of cholesterol in detergent‐resistant membrane domains. Journal of Neurochemistry, 92, 171–182. 10.1111/j.1471-4159.2004.02849.x [DOI] [PubMed] [Google Scholar]
- Moustafa, I. , Connaris, H. , Taylor, M. , Zaitsev, V. , Wilson, J. C. , Kiefel, M. J. , von Itzstein, M. , & Taylor, G. (2004). Sialic acid recognition by Vibrio cholerae neuraminidase. The Journal of Biological Chemistry, 279, 40819–40826. 10.1074/jbc.M404965200 [DOI] [PubMed] [Google Scholar]
- Ohmi, Y. , Ohkawa, Y. , Yamauchi, Y. , Tajima, O. , Furukawa, K. , & Furukawa, K. (2012). Essential roles of gangliosides in the formation and maintenance of membrane microdomains in brain tissues. Neurochemical Research, 37, 1185–1191. 10.1007/s11064-012-0764-7 [DOI] [PubMed] [Google Scholar]
- Ohmi, Y. , Tajima, O. , Ohkawa, Y. , Yamauchi, Y. , Sugiura, Y. , Furukawa, K. , & Furukawa, K. (2011). Gangliosides are essential in the protection of inflammation and neurodegeneration via maintenance of lipid rafts: Elucidation by a series of ganglioside‐deficient mutant mice. Journal of Neurochemistry, 116, 926–935. 10.1111/j.1471-4159.2010.07067.x [DOI] [PubMed] [Google Scholar]
- Persaud‐Sawin, D. A. , Lightcap, S. , & Harry, G. J. (2009). Isolation of rafts from mouse brain tissue by a detergent‐free method. Journal of Lipid Research, 50, 759–767. 10.1194/jlr.D800037-JLR200 [DOI] [PMC free article] [PubMed] [Google Scholar]
- Pike, L. J. (2009). The challenge of lipid rafts. Journal of Lipid Research, 50(Suppl), S323–328. 10.1194/jlr.R800040-JLR200 [DOI] [PMC free article] [PubMed] [Google Scholar]
- Prendergast, J. , Umanah, G. K. E. , Yoo, S.‐W. , Lagerlof, O. , Motari, M. G. , Cole, R. N. , Huganir, R. L. , Dawson, T. M. , Dawson, V. L. , & Schnaar, R. L. (2014). Ganglioside regulation of AMPA receptor trafficking. The Journal of Neuroscience: The Official Journal of the Society for Neuroscience, 34, 13246–13258. 10.1523/JNEUROSCI.1149-14.2014 [DOI] [PMC free article] [PubMed] [Google Scholar]
- Puljko, B. , Stojanovic, M. , Ilic, K. , Macek Hrvat, N. , Zovko, A. , Damjanovic, V. , Mlinac‐Jerkovic, K. , & Kalanj‐Bognar, S. (2021). Redistribution of gangliosides accompanies thermally induced Na(+), K(+)‐ATPase activity alternation and submembrane localisation in mouse brain. Biochimica et Biophysica Acta (BBA) ‐ Biomembranes, 1863, 183475. 10.1016/j.bbamem.2020.183475 [DOI] [PubMed] [Google Scholar]
- Rushworth, J. V. , & Hooper, N. M. (2010). Lipid rafts: Linking Alzheimer's amyloid‐beta production, aggregation, and toxicity at neuronal membranes. International Journal of Alzheimer's Disease, 2011, 603052. [DOI] [PMC free article] [PubMed] [Google Scholar]
- Santos, G. , Diaz, M. , & Torres, N. V. (2016). Lipid raft size and lipid mobility in non‐raft domains increase during aging and are exacerbated in APP/PS1 mice model of Alzheimer's disease. Predictions from an Agent‐Based Mathematical Model. Frontiers in Physiology, 7, 90. 10.3389/fphys.2016.00090 [DOI] [PMC free article] [PubMed] [Google Scholar]
- Schnaar, R. L. (1994). Isolation of glycosphingolipids. Methods in Enzymology, 230, 348–370. [DOI] [PubMed] [Google Scholar]
- Schnaar, R. L. , Fromholt, S. E. , Gong, Y. , Vyas, A. A. , Laroy, W. , Wayman, D. M. , Heffer‐Lauc, M. , Ito, H. , Ishida, H. , Kiso, M. , Griffin, J. W. , & Shiekh, K. A. (2002). Immunoglobulin G‐class mouse monoclonal antibodies to major brain gangliosides. Analytical Biochemistry, 302, 276–284. 10.1006/abio.2001.5540 [DOI] [PubMed] [Google Scholar]
- Schuck, S. , Honsho, M. , Ekroos, K. , Shevchenko, A. , & Simons, K. (2003). Resistance of cell membranes to different detergents. Proceedings of the National Academy of Sciences of the United States of America, 100, 5795–5800. 10.1073/pnas.0631579100 [DOI] [PMC free article] [PubMed] [Google Scholar]
- Sezgin, E. , Levental, I. , Mayor, S. , & Eggeling, C. (2017). The mystery of membrane organization: Composition, regulation and roles of lipid rafts. Nature Reviews. Molecular Cell Biology, 18, 361–374. [DOI] [PMC free article] [PubMed] [Google Scholar]
- Shah, M. B. , & Sehgal, P. B. (2007). Nondetergent isolation of rafts. Methods in Molecular Biology, 398, 21–28. [DOI] [PubMed] [Google Scholar]
- Shi, H. , Fang, W. , Liu, M. , & Fu, D. (2017). Complement component 1, q subcomponent binding protein (C1QBP) in lipid rafts mediates hepatic metastasis of pancreatic cancer by regulating IGF‐1/IGF‐1R signaling. International Journal of Cancer, 141(7), 1389–1401. 10.1002/ijc.30831. [DOI] [PubMed] [Google Scholar]
- Simons, K. , & Ehehalt, R. (2002). Cholesterol, lipid rafts, and disease. Journal of Clinical Investigation, 110, 597–603. 10.1172/JCI0216390 [DOI] [PMC free article] [PubMed] [Google Scholar]
- Simons, K. , & Gerl, M. J. (2010). Revitalizing membrane rafts: New tools and insights. Nature Reviews Molecular Cell Biology, 11, 688–699. [DOI] [PubMed] [Google Scholar]
- Simons, K. , & Ikonen, E. (1997). Functional rafts in cell membranes. Nature, 387, 569–572. 10.1038/42408 [DOI] [PubMed] [Google Scholar]
- Sonnino, S. , & Prinetti, A. (2013). Membrane domains and the "lipid raft" concept. Current Medicinal Chemistry, 20, 4–21. [PubMed] [Google Scholar]
- Suzuki, K. G. N. , Ando, H. , Komura, N. , Fujiwara, T. K. , Kiso, M. , & Kusumi, A. (2017). Development of new ganglioside probes and unraveling of raft domain structure by single‐molecule imaging. Biochimica Et Biophysica Acta ‐ General Subjects, 1861, 2494–2506. 10.1016/j.bbagen.2017.07.012 [DOI] [PubMed] [Google Scholar]
- Suzuki, K. G. N. , Ando, H. , Komura, N. , Konishi, M. , Imamura, A. , Ishida, H. , Kiso, M. , Fujiwara, T. K. , & Kusumi, A. (2018). Revealing the raft domain organization in the plasma membrane by single‐molecule imaging of fluorescent ganglioside analogs. Methods in Enzymology, 598, 267–282. [DOI] [PubMed] [Google Scholar]
- Suzuki, K. G. , Kasai, R. S. , Hirosawa, K. M. , Nemoto, Y. L. , Ishibashi, M. , Miwa, Y. , Fujiwara, T. K. , & Kusumi, A. (2012). Transient GPI‐anchored protein homodimers are units for raft organization and function. Nature Chemical Biology, 8, 774–783. 10.1038/nchembio.1028 [DOI] [PubMed] [Google Scholar]
- Svennerholm, L. , & Fredman, P. (1980). A procedure for the quantitative isolation of brain gangliosides. Biochimica Et Biophysica Acta, 617, 97–109. 10.1016/0005-2760(80)90227-1 [DOI] [PubMed] [Google Scholar]
- Vetrivel, K. S. , & Thinakaran, G. (2010). Membrane rafts in Alzheimer's disease beta‐amyloid production. Biochimica Et Biophysica Acta, 1801, 860–867. 10.1016/j.bbalip.2010.03.007 [DOI] [PMC free article] [PubMed] [Google Scholar]
- Wells, M. A. , & Dittmer, J. C. (1963). The use of sephadex for the removal of Nonlipid contaminants from lipid extracts. Biochemistry, 2, 1259–1263. [DOI] [PubMed] [Google Scholar]
- Williamson, R. , Thompson, A. J. , Abu, M. , Hye, A. , Usardi, A. , Lynham, S. , Anderton, B. H. , & Hanger, D. P. (2010). Isolation of detergent resistant microdomains from cultured neurons: Detergent dependent alterations in protein composition. BMC Neuroscience, 11, 120. 10.1186/1471-2202-11-120 [DOI] [PMC free article] [PubMed] [Google Scholar]
- Yamaguchi, T. , Yamauchi, Y. , Furukawa, K. , Ohmi, Y. , Ohkawa, Y. , Zhang, Q. , Okajima, T. , & Furukawa, K. (2016). Expression of B4GALNT1, an essential glycosyltransferase for the synthesis of complex gangliosides, suppresses BACE1 degradation and modulates APP processing. Scientific Reports, 6, 34505. 10.1038/srep34505 [DOI] [PMC free article] [PubMed] [Google Scholar]
Associated Data
This section collects any data citations, data availability statements, or supplementary materials included in this article.
Supplementary Materials
Supplementary Material
Data Availability Statement
The data that support the findings of this study are available from the corresponding author upon reasonable request.