

Abstract
γ-Glutamylpeptides have been identified as potential biomarkers for a number of diseases including cancer, diabetes, and liver disease. In this study, we developed and validated a novel quantitative analytical strategy for measuring γ-glutamylisoleucine, γ-glutamylthreonine, and γ-glutamylvaline, all of which have been previously reported as potential biomarkers for prostate cancer, in HeLa cells using UHPLC-MS/MS. A BEH C18 column was used as the stationary phase. Mobile phase A was 99:1 water:formic acid, and mobile phase B was acetonitrile. Chemical isotope labeling using benzoyl chloride was used as the internal standardization strategy. Sample preparation consisted of the addition of water to a frozen cell pellet, sonication, derivatization, centrifugation, and subsequent addition of an internal standard solution. The method was validated for selectivity, accuracy, precision, linearity, and stability. The determined concentrations of γ-glutamylisoleucine, γ-glutamylthreonine, and γ-glutamylvaline in HeLa cells were 1.92 ± 0.06, 10.8 ± 0.4, and 1.96 ± 0.04 pmol/ mg protein, respectively. In addition, the qualitative analysis of these analytes in human serum was achieved using a modified sample preparation strategy. To the best of our knowledge, this is the first report of the use of benzoyl chloride for chemical isotope labeling for metabolite quantitation in cells.
Keywords: γ-Glutamylpeptide, Chemical isotope labeling, Derivatization, Internal standard, Quantification
1. Introduction:
Glutathione is a tripeptide present in all eukaryotic cells that serves several critical functions including the regulation of the intracellular redox state, the detoxification of reactive oxygen species, and the metabolism of xenobiotic compounds [1,2]. Glutathione is the most abundant thiol specie in cells, with intracellular concentrations typically ranging from 0.5 to 10 mM [2]. Glutathione deficiency can severely impair an organism’s ability to respond to oxidative stress, which may result in cellular damage and the eventual death of the organism [1]. Glutathione is not efficiently transported across cell membranes and, thus, must be synthesized intracellularly from its constituent amino acids [3].
The metabolites and enzymes involved in the extracellular degradation and intracellular synthesis of glutathione comprise the γ-glutamyl cycle [3]. The first step in the extracellular degradation of glutathione is the transfer of its γ-glutamyl moiety to an acceptor molecule, such as an amino acid, catalyzed by γ-glutamyltransferase [3]. The products of this reaction are cysteinylglycine and, usually, a γ-glutamylpeptide. γ-Glutamyltransferase activity has been reported to correlate positively with alcohol consumption [4], as well as with the incidences of diabetes [5,6], hypertension [7], liver disease [8], cardiovascular disease [9,10], cancer [11], and mortality [12,13]. γ-Glutamyltransferase activity is also affected by age, race, sex, diet, body mass index, and the use of tobacco and oral contraceptives [14].
The influence of patient demographics, lifestyle choices, and various disease states on γ-glutamyltransferase activity limits its usefulness as a single biomarker to diagnose or prognosticate any particular disease [14]. The analysis of its products, γ-glutamylpeptides, is an attractive alternative that provides many potential biomarkers. γ-Glutamylpeptides are also produced via γ-glutamylcysteine synthetase, another enzyme involved in the γ-glutamyl cycle [3]. γ-Glutamylpeptides have been identified as potential biomarkers for aging [15], amyotrophic lateral sclerosis [16], cancer [17–22], diabetes [23], liver disease [24,25], metabolic syndrome [26], obesity [27], and dietary intake [28]. Additionally, the analysis of γ-glutamylpeptides as a biomarker panel may improve the sensitivity and specificity of a clinical test for a particular disease or prognosis. Indeed, Soga et al. were able to discriminate between different forms of liver disease using the serum concentrations of several γ-glutamylpeptides [25]. Interestingly, several studies have shown positive correlations of the concentrations of some γ-glutamylpeptide species with disease states and negative correlations of the concentrations of other species with the same disease state [16,17].
To date, few studies have been reported on the quantitative analysis of γ-glutamylpeptides in biological samples. Soga et al. quantitated γ-glutamylpeptides in human serum from patients with different types of liver diseases as well as healthy controls using LC-MS/MS [25]. The same group later reported a quantitative method for analyzing γ-glutamylpeptides in serum and liver samples using CE-MS/MS [29]. Kobayashi et al. quantitated 21 γ-glutamylpeptides and 45 amino acids in mice plasma and liver samples using LC-MS/MS [30]. N-ethylmaleimide was used to derivatize thiol-containing analytes to prevent their oxidation. Saoi et al. used multisegment injection-CE-MS/MS to quantitate 16 γ-glutamylpeptides in serum from nonalcoholic steatohepatitis patients [31]. Interestingly, γ-glutamylpeptides have also been analyzed in foods. Desfontaine et al. analyzed 27 glutamylpeptides, including 15 γ-glutamylpeptides, in food ingredients using LC-MS/MS [32]. To the best of our knowledge, no method thus far has been reported which provides each γ-glutamylpeptide specie with its own internal standard, the absence of which risks inaccuracy due to the susceptibility of electrospray ionization to matrix effects [33,34].
Given the numerous important health implications that have been discovered for γ-glutamylpeptides, there is a critical need for the development of validated methods for their quantitative analysis in biological samples. The aim of this study was to develop an ultra high performance liquid chromatography-tandem mass spectrometry (UHPLC-MS/MS) method to determine the concentrations of γ-glutamylisoleucine (γ-Glu-Ile), γ-glutamylthreonine (γ-Glu-Thr), and γ-glutamylvaline (γ-Glu-Val) in HeLa cells. All three analytes have been reported as potential biomarkers for fatal prostate cancer [20,22], and their structures are displayed in Fig. 1A. Chemical isotope labeling (CIL) using benzoyl chloride (BzCl) was used as the internal standardization strategy, and the reaction scheme is displayed in Fig. 1B. To the best of our knowledge, this is the first report of the use of BzCl for CIL for quantitative analysis in cells.
Figure 1.
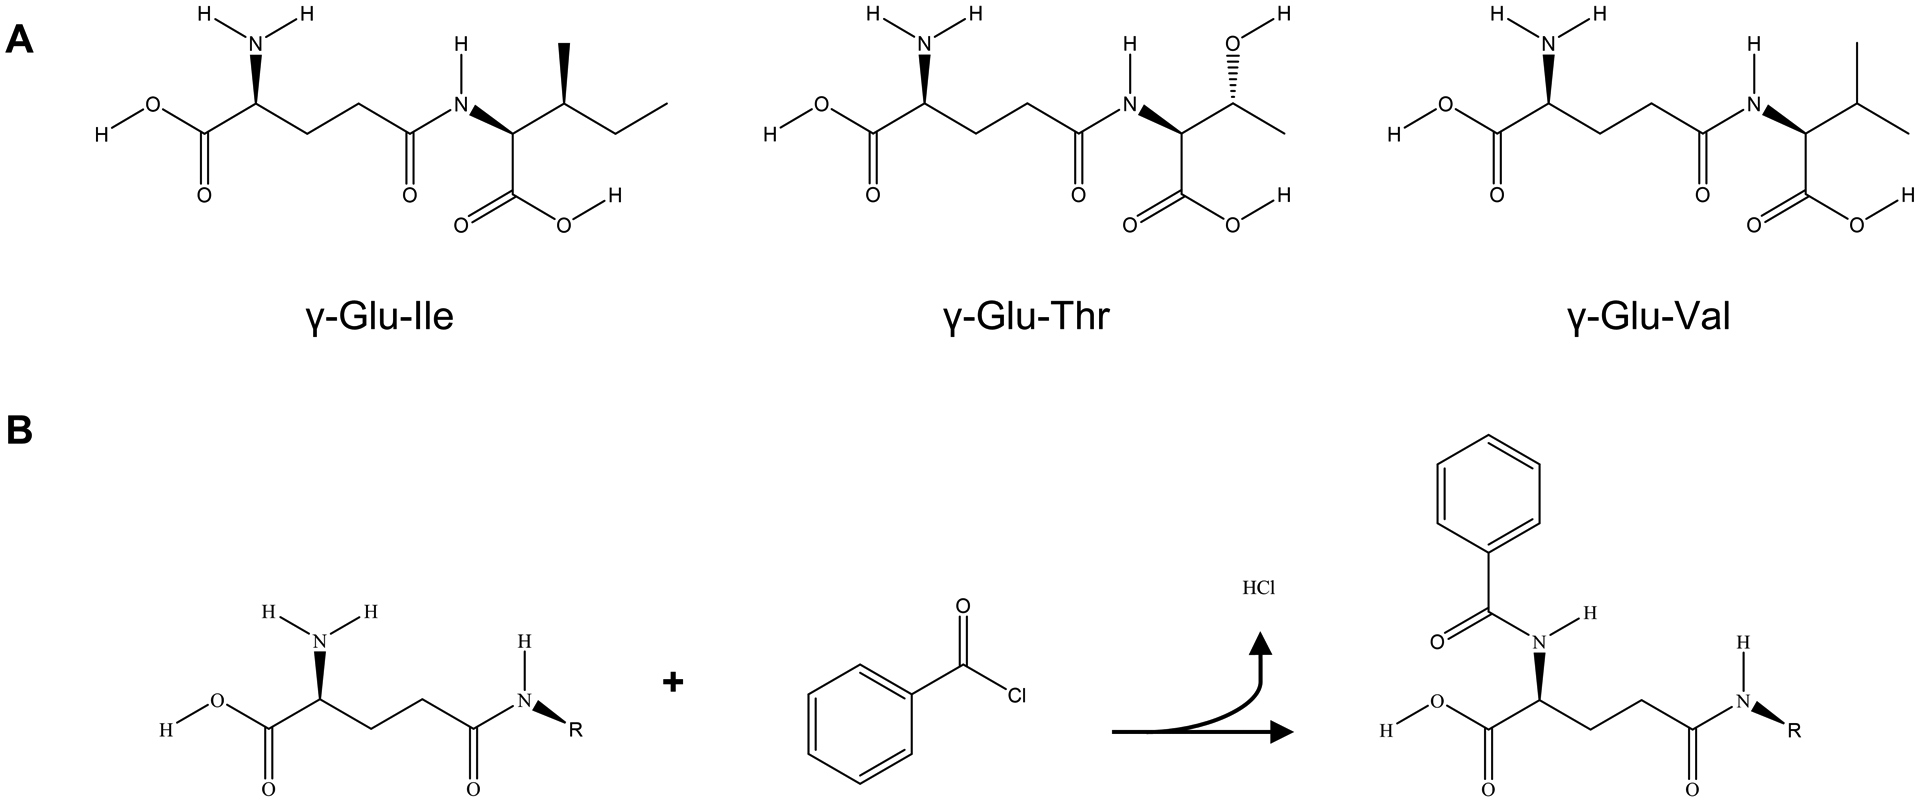
A Chemical structures of γ-glutamylisoleucine, γ-glutamylthreonine, and γ-glutamylvaline. B Reaction of a γ-glutamylpeptide with benzoyl chloride
2. Materials and Methods
2.1. Chemicals and Reagents
γ-Glu-Ile (≥95%) was purchased from Santa Cruz Biotechnology (Dallas, TX, USA). γ-Glu-Thr (>95%) was synthesized by the Proteomics and Peptide Synthesis Core at the University of Michigan. γ-Glu-Val was purchased from Bachem Americas, Inc. (Torrance, CA, USA). Acetonitrile (ACN; LC-MS grade), fetal bovine serum, methanol (LC-MS grade), minimum essential medium, penicillin-streptomycin (10,000 U/ mL), phosphate-buffered saline (PBS, pH 7.4), trypsin-EDTA (0.25%), and water (LC-MS grade) were purchased from Thermo Fisher Scientific (Waltham, MA, USA). Acetic acid (LC-MS grade) and formic acid (FA; LC-MS grade) were purchased from EMD Millipore Corp. (Burlington, MA, USA). 12C6-BzCl (≥99%), 13C6-BzCl (99%), and sodium carbonate (≥99.5%) were purchased from Sigma-Aldrich (St. Louis, MO, USA). Human serum (pooled) was purchased from Innovative Research, Inc. (Novi, MI, USA).
2.2. Preparation of Standard Solutions
Stock solutions of γ-Glu-Ile, γ-Glu-Thr, and γ-Glu-Val were prepared in water. Derivatized γ-glutamylpeptide standard solutions were each prepared at 500 μM by diluting the standards from the stock solutions to 1 mM at a final volume of 75 μL with water followed by the additions of 37.5 μL 200 mM sodium carbonate in water and 37.5 μL 1% (v/v) 12C6- or 13C6-BzCl in ACN. The benzoylation reactions were then allowed to proceed at room temperature for 5 min. The internal standard solution consisted of each 13C6-BzO-γ-Glu-Ile, 13C6-BzO-γ-Glu-Thr, and 13C6-BzO-γ-Glu-Val at 1 μM in 85:15:1 (v/v) water:ACN:FA. Calibration standard solutions were prepared at 40 μL, containing 4 μL of the internal standard solution as well as 12C6-BzO-γ-Glu-Ile, 12C6-BzO-γ-Glu-Thr, and 12C6-BzO-γ-Glu-Val at concentrations ranging from 0.5 – 1000 nM. All solutions were stored at −20 °C when not in use.
2.3. UHPLC-MS/MS Analysis
All UHPLC-MS/MS experiments were performed using an Agilent 6495 triple quadrupole mass spectrometer (Agilent Technologies, Inc.; Santa Clara, CA, USA) equipped with a binary pump (Agilent; 1290 Infinity series), autosampler (Agilent; 1290 Infinity series), and a thermostatted column compartment (Agilent; 1260 Infinity series). An Acquity UPLC BEH C18 column (2.1×100 mm, 1.7 μm; Waters Corp.; Milford, MA, USA) equipped with an Acquity UPLC BEH C18 VanGuard Pre-column (2.1×5 mm, 1.7 μm; Waters) was used as the LC column. Mobile phase A consisted of 99:1 (v/v) water:FA, and mobile phase B consisted of ACN. A solution of 80:20 (v/v) water:ACN was used as the needle wash solvent. The UHPLC gradient program is displayed in Table 1. The following LC parameters were used: injection volume, 1 μL; autosampler temperature, 4 °C; and column compartment temperature, 15 °C.
Table 1.
UHPLC Gradient Program
| Time (min) | %B | Flow Rate (mL/ min) |
|---|---|---|
| 0.00 | 15 | 0.200 |
| 8.00 | 45 | 0.200 |
| 8.01 | 45 | 0.400 |
| 8.50 | 99 | 0.400 |
| 9.50 | 99 | 0.400 |
| 9.51 | 15 | 0.400 |
| 10.50 | 15 | 0.400 |
| 10.51 | 15 | 0.200 |
| 11.50 | 15 | 0.200 |
MS/MS was performed in the positive ionization multiple reaction monitoring (MRM) mode with the following parameters: collision gas, nitrogen; drying gas temperature, 290 °C; sheath gas temperature, 400 °C; drying gas flow rate, 12 L/ min; sheath gas flow rate, 12 L/ min; nebulizer pressure, 30 psi; capillary voltage, 3500 V; nozzle voltage, 500 V; and dwell time, 50 msec. Both a quantitative and qualitative MRM transition were monitored for each 12C6-/ 13C6-benzoylated analyte/ internal standard. The [M+H]+ specie was monitored as the precursor ion for each MRM transition. MRM transitions for each 12C6-/ 13C6-benzoylated analyte/ internal standard were monitored within their own time segment. MRM parameters are displayed in Table 2.
Table 2.
MRM parameters for the 12C6-/ 13C6-benzoylated analytes/ internal standards
| Time Segment (min) | Compound | Retention Time (min) | Quant.a MRM | Qual.b MRM |
|---|---|---|---|---|
| 0.00→4.49 | 12C6-BzO-γ-Glu-Thr | 3.26 | 353.0→186.1; 16 V | 353.0→140.0; 30 V |
| 0.00→4.49 | 13C6-BzO-γ-Glu-Thr | 3.26 | 359.1→111.0; 35 V | 359.1→341.0; 8 V |
| 4.50→5.99 | 12C6-BzO-γ-Glu-Val | 5.53 | 351.0→156.2; 22 V | 351.0→229.1; 18 V |
| 4.50→5.99 | 13C6-BzO-γ-Glu-Val | 5.53 | 357.2→311.1; 12 V | 357.2→111.1; 35 V |
| 6.00→7.99 | 12C6-BzO-γ-Glu-Ile | 6.65 | 365.1→86.0; 16 V | 365.1→170.1; 25 V |
| 6.00→7.99 | 13C6-BzO-γ-Glu-Ile | 6.65 | 371.2→111.0; 35 V | 371.2→325.2; 12 V |
Quant., Quantitative;
Qual., Qualitative
2.4. Cell Culture
HeLa cells were cultured in minimum essential medium supplemented with 10% (w/v) fetal bovine serum and 100 U/ mL of each penicillin and streptomycin at 37 °C in 5% CO2 to a confluence of 70%. Plates were then washed twice with PBS at 37 °C, followed by the addition of trypsin-EDTA at 37 °C until the cells were detached. Ice-cold serum-free minimum essential medium equal to the volume of trypsin-EDTA was then added, and the cells were gently aspirated to separate from each other and the plate. Cells were then counted via hemocytometry, washed twice in ice-cold PBS, and resuspended in PBS to a concentration of 2×10⁶ cells/ mL. Aliquots of 1 ml were then collected into cryovials, centrifuged to remove the PBS, flash-frozen in liquid nitrogen, and stored at −80 °C.
2.5. Sample Preparation
HeLa cells were taken out of storage at −80 °C immediately followed by the addition of 55 μL of ice-cold water and bath sonication for 30 sec. Samples were then placed on ice, and a 5 μL aliquot to assay protein content (DC Protein Assay; Bio-Rad.; Hercules, CA, USA) was taken and stored at −20 °C. Ice-cold 200 mM sodium carbonate in water (25 μL) was then added followed by 25 μL 1% (v/v) 12C6-BzCl in ACN. The sample was then inverted and vortexed for 10 sec and then held at room temperature for 5 min to allow for the reaction to complete. The sample was then centrifuged for 10 min at 17,100×g and 4 °C, and 18 μL of the supernatant was then mixed with 2 μL of the internal standard solution followed by centrifugation for 10 min at 17,100×g and 4 °C. Finally, the supernatant was transferred to an autosampler vial and analyzed by UHPLC-MS/MS. Four HeLa cell samples were analyzed, subjected to ten injections each, on consecutive days. 12C6-BzCl and sodium carbonate solutions were prepared fresh daily.
Human serum was also prepared and analyzed to assess the methodology’s applicability to other biological matrices. A 50 μL aliquot of thawed serum was added to 200 μL ice-cold 0.1% (v/v) acetic acid in methanol for protein precipitation. The sample was then vortexed and incubated on ice for 5 min followed by centrifugation for 5 min at 17,100×g and 4 °C. 50 μL of the supernatant was then mixed with 25 μL 200 mM sodium carbonate in water followed by the addition of 25 μL 1% (v/v) 12C6-BzCl in ACN. The sample was then inverted, vortexed, and held at room temperature for 5 min. Finally, 90 μL of the sample was added to 10 μL of the internal standard solution, and the sample was centrifuged for 5 min at 17,100×g and 4 °C prior to analysis by UHPLC-MS/MS.
2.6. Data Analysis
Peak areas, retention times, and signal-to-noise ratios were obtained using MassHunter Quantitative Analysis software (B.07.00; Agilent) and were all reviewed manually. MS response henceforth refers to the ratio of the peak areas for the quantitative MRM transition of the 12C6-benzoylated analyte to that of its 13C6-benzoylated internal standard. The concentrations used in the calibration standard solutions were: 0, 0.5, 1, 2.5, 5, 10, 25, 50, 100, 250, 500, and 1000 nM. For validation experiments, the concentrations used in the calibration curves were 0 and 0.5–1000 nM for 12C6-BzO-γ-Glu-Ile and 0 and 1–1000 nM for 12C6-BzO-γ-Glu-Thr and 12C6-BzO-γ-Glu-Val. For the determination of the analyte concentration in samples, seven-point calibration curves were constructed from calibration standard solutions and spanned the concentration ranges of 1–100, 5–500, and 2.5–250 nM for 12C6-BzO-γ-Glu-Ile, 12C6-BzO-γ-Glu-Thr, and 12C6-BzO-γ-Glu-Val, respectively. Each calibrant was analyzed in triplicate. Weighted least-squares regression (1/x2) was used to obtain the calibration equations. Recoveries were taken into account when determining analyte concentrations in samples. Analyte concentrations in samples were normalized to their protein content obtained from the DC Protein Assay.
2.7. Method Validation
Method validation was conducted as much as possible in accordance with the US Food and Drug Administration (FDA) guidelines for bioanalytical method validation for industry [35]. However, the lack of a commercially available matrix free of the endogenous analytes prevented the ability to follow FDA guidelines requiring an analyte-free blank of the same biological matrix. As recommended by the European Commission, selectivity was assessed by verifying that the retention times and the relative peak areas of the quantitative and qualitative MRM transitions for each 12C6-benzoylated analyte measured in HeLa cells were within 2.5% and 20% of those values measured in 25 nM calibration standard solutions, respectively [36]. In addition, blanks consisting of water prepared in the same manner as samples were also analyzed to ensure that the reagents and internal standard solution did not contribute to the MS response of samples.
For accuracy and precision experiments, quality control standard solutions were separately prepared from the calibration standard solutions and analyzed five times each. Quality control standards at concentrations of 0.5, 1, 2.5, and 5 nM were used to determine the lower limits of quantitation (LLOQs) and low quality control (LQC) concentrations for each analyte. LLOQs were determined as the lowest analyte concentration at which their accuracies based on their experimentally determined concentrations as well as their relative standard deviations (RSDs) were 100±20% and <20%, respectively, and whose next highest concentration, the LQC concentration, had values of 100±15% and <15%, respectively. Medium quality control (MQC) and high quality control (HQC) concentrations were 500 and 800 nM, respectively, for all analytes and were subjected to the same criteria as the LQC. These experiments were performed on three separate days with freshly prepared quality control and calibration standards. The intra-day accuracy and precision values were obtained from the experiments on the first day, and the inter-day values were obtained throughout the three days.
Autosampler stability was assessed by analyzing three HeLa samples immediately after preparation followed by reanalysis of the same samples 12 and 24h later. Freeze-thaw stability was assessed by subjecting three samples to three freeze-thaw cycles with at least 12 h between cycles prior to processing and analysis. For long-term stability, three samples were kept in storage at − 80 °C and processed and analyzed two weeks after the autosampler stability experiment. All samples were analyzed five times for each treatment.
Spike and recovery was used to determine the recoveries of the analytes in HeLa cells. Water (55 μL) was added to two HeLa samples followed by bath sonication for 30 sec. The samples were then pooled and split into eight 12 μL subsamples. Four of these subsamples, the pre-derivatization spiked subsamples, were spiked with 2 μL underivatized analyte solution at concentrations of 0, 1.75, 8.75, and 17.5 μM such that their final concentrations, assuming 100% recoveries, were 0, 100, 500, and 1000 nM. Water (2 μL) was added to the other four subsamples, the post-derivatization spiked subsamples. To each subsample, 7 μL 200 mM sodium carbonate was added, followed by 7 μL 1% (v/v) 12C6-BzCl in ACN. The samples were vortexed, allowed 5 min to react, and centrifuged. Supernatant (16 μL) was then taken from each subsample, and 2 μL water was added to the pre-derivatization subsamples. To the post-derivatization spiked subsamples, 2 μL of 12C6-benzoylated analytes at concentrations of 0, 1, 5, and 10 μM were added, such that their final concentrations were the same as the pre-derivatization spiked subsamples. Finally, 2 μL of the internal standard solution was added prior to analysis. The recoveries were determined by dividing the slope of the MS response vs. spiked concentration of the pre-derivatization spiked subsamples by those of the post-derivatization spiked subsamples. Matrix effects were assessed by comparing the slopes of the calibration curve to that of the post-derivatization spiked subsamples.
Accuracy was also assessed via standard addition where a HeLa sample was split into 3 equal volumes and spiked prior to derivatization with underivatized analytes such that their final concentrations were 0, 25, and 50 nM for γ-Glu-Ile and γ-Glu-Val and 0, 250, and 500 nM for γ-Glu-Thr. The concentrations determined by standard addition were assumed as the true concentrations, and this was compared to the concentration obtained from the calibration curves, corrected for recovery, for the sample spiked at 0 nM.
We systematically assessed whether the reactions of BzCl and the γ-glutamylpeptide analytes were quantitative. Briefly, 55 μL 10 μM underivatized analyte solution were added to three HeLa samples followed by bath sonication. Each sample was then split into two 20 μL subsamples followed by the addition of 10 μL 200 mM sodium carbonate. For subsample A, 10 μL 1% (v/v) 13C6-BzCl in ACN was added, and for subsample B, 10 μL ACN was added. The subsamples were then vortexed and the reactions were allowed to proceed for 5 min. After centrifugation, supernatant from each subsample (5 μL) were taken and diluted with 245 μL water followed by the additions of 125 μL 200 mM sodium carbonate and 125 μL 1% (v/v) 12C6-BzCl in ACN. The reactions were allowed to proceed for 5 min prior to analysis.
3. Results and Discussion
3.1. Method Development
One of the most formidable challenges in quantitative LC-MS/MS method development for biological samples is correcting for matrix effects. This is most often achieved through the use of isotopically labeled internal standards. These internal standards were not commercially available for the investigated analytes, but their possession of nucleophilic primary amine functional groups allowed for the use of CIL as an internal standardization strategy. Additional benefits of derivatizing hydrophilic analytes with hydrophobic moieties, such as benzoyl or dansyl groups, include greater reversed-phase LC retention and improved ESI-MS sensitivity [37–40]. The use of BzCl as a derivatizing agent for CIL had previously been effectively demonstrated for analytes possessing a variety of nucleophilic functional groups including primary and secondary amines, phenols, thiols, and some alcohols [37,41,42]. Unlike other commonly used derivatizing regents for CIL, such as dansyl chloride, BzCl has the advantages of commercial availability both as isotopically-labeled and -unlabeled, and its reaction with nucleophiles proceeds rapidly at room temperature [37]. For these reasons, BzCl was chosen as the derivatizing reagent.
Several reversed-phase LC columns were screened during method development. The Acquity UPLC BEH C18 column resulted in narrow, symmetrical chromatographic peaks and was ultimately chosen. Mobile phase flow rates were increased after the elution of analytes during the washing and re-equilibration steps in order to shorten the analysis time. Based on previous experience with UHPLC columns, the last minute of re-equilibration was set at the initial flow rate to reduce the elevated column temperature caused by frictional heating at higher flow rates, which may have otherwise had a detrimental impact on efficiency and reproducibility [43]. Chromatograms of a standard solution at 25 nM, a standard solution at the LLOQs, a HeLa sample, a HeLa sample without the addition of BzCl or an internal standard, and a human serum sample are displayed in Fig. 2. All targeted analytes were baseline separated from closely eluting interferents in the HeLa cell sample as well as the serum sample. Interestingly, an interferent that eluted immediately after 12C6-BzO-γ-Glu-Ile was present in the quantitative and qualitative MRM chromatograms for both the HeLa cell and serum sample. No attempt was made to identify this interferent, but given its similar retention time to and response to both MRM channels of 12C6-BzO-γ-Glu-Ile, it is possibly the benzoylation product of γ-glutamylleucine. For this analytical challenge, the high efficiency of UHPLC, imparted by its sub-2 μm particles, may have been necessary to baseline separate the quantitative MRM chromatographic peaks of 12C6-γ-Glu-Ile from the closely eluting interferent, whereas HPLC, with larger sized particles, would likely not have provided the sufficient number of theoretical plates for these separations [44].
Figure 2.
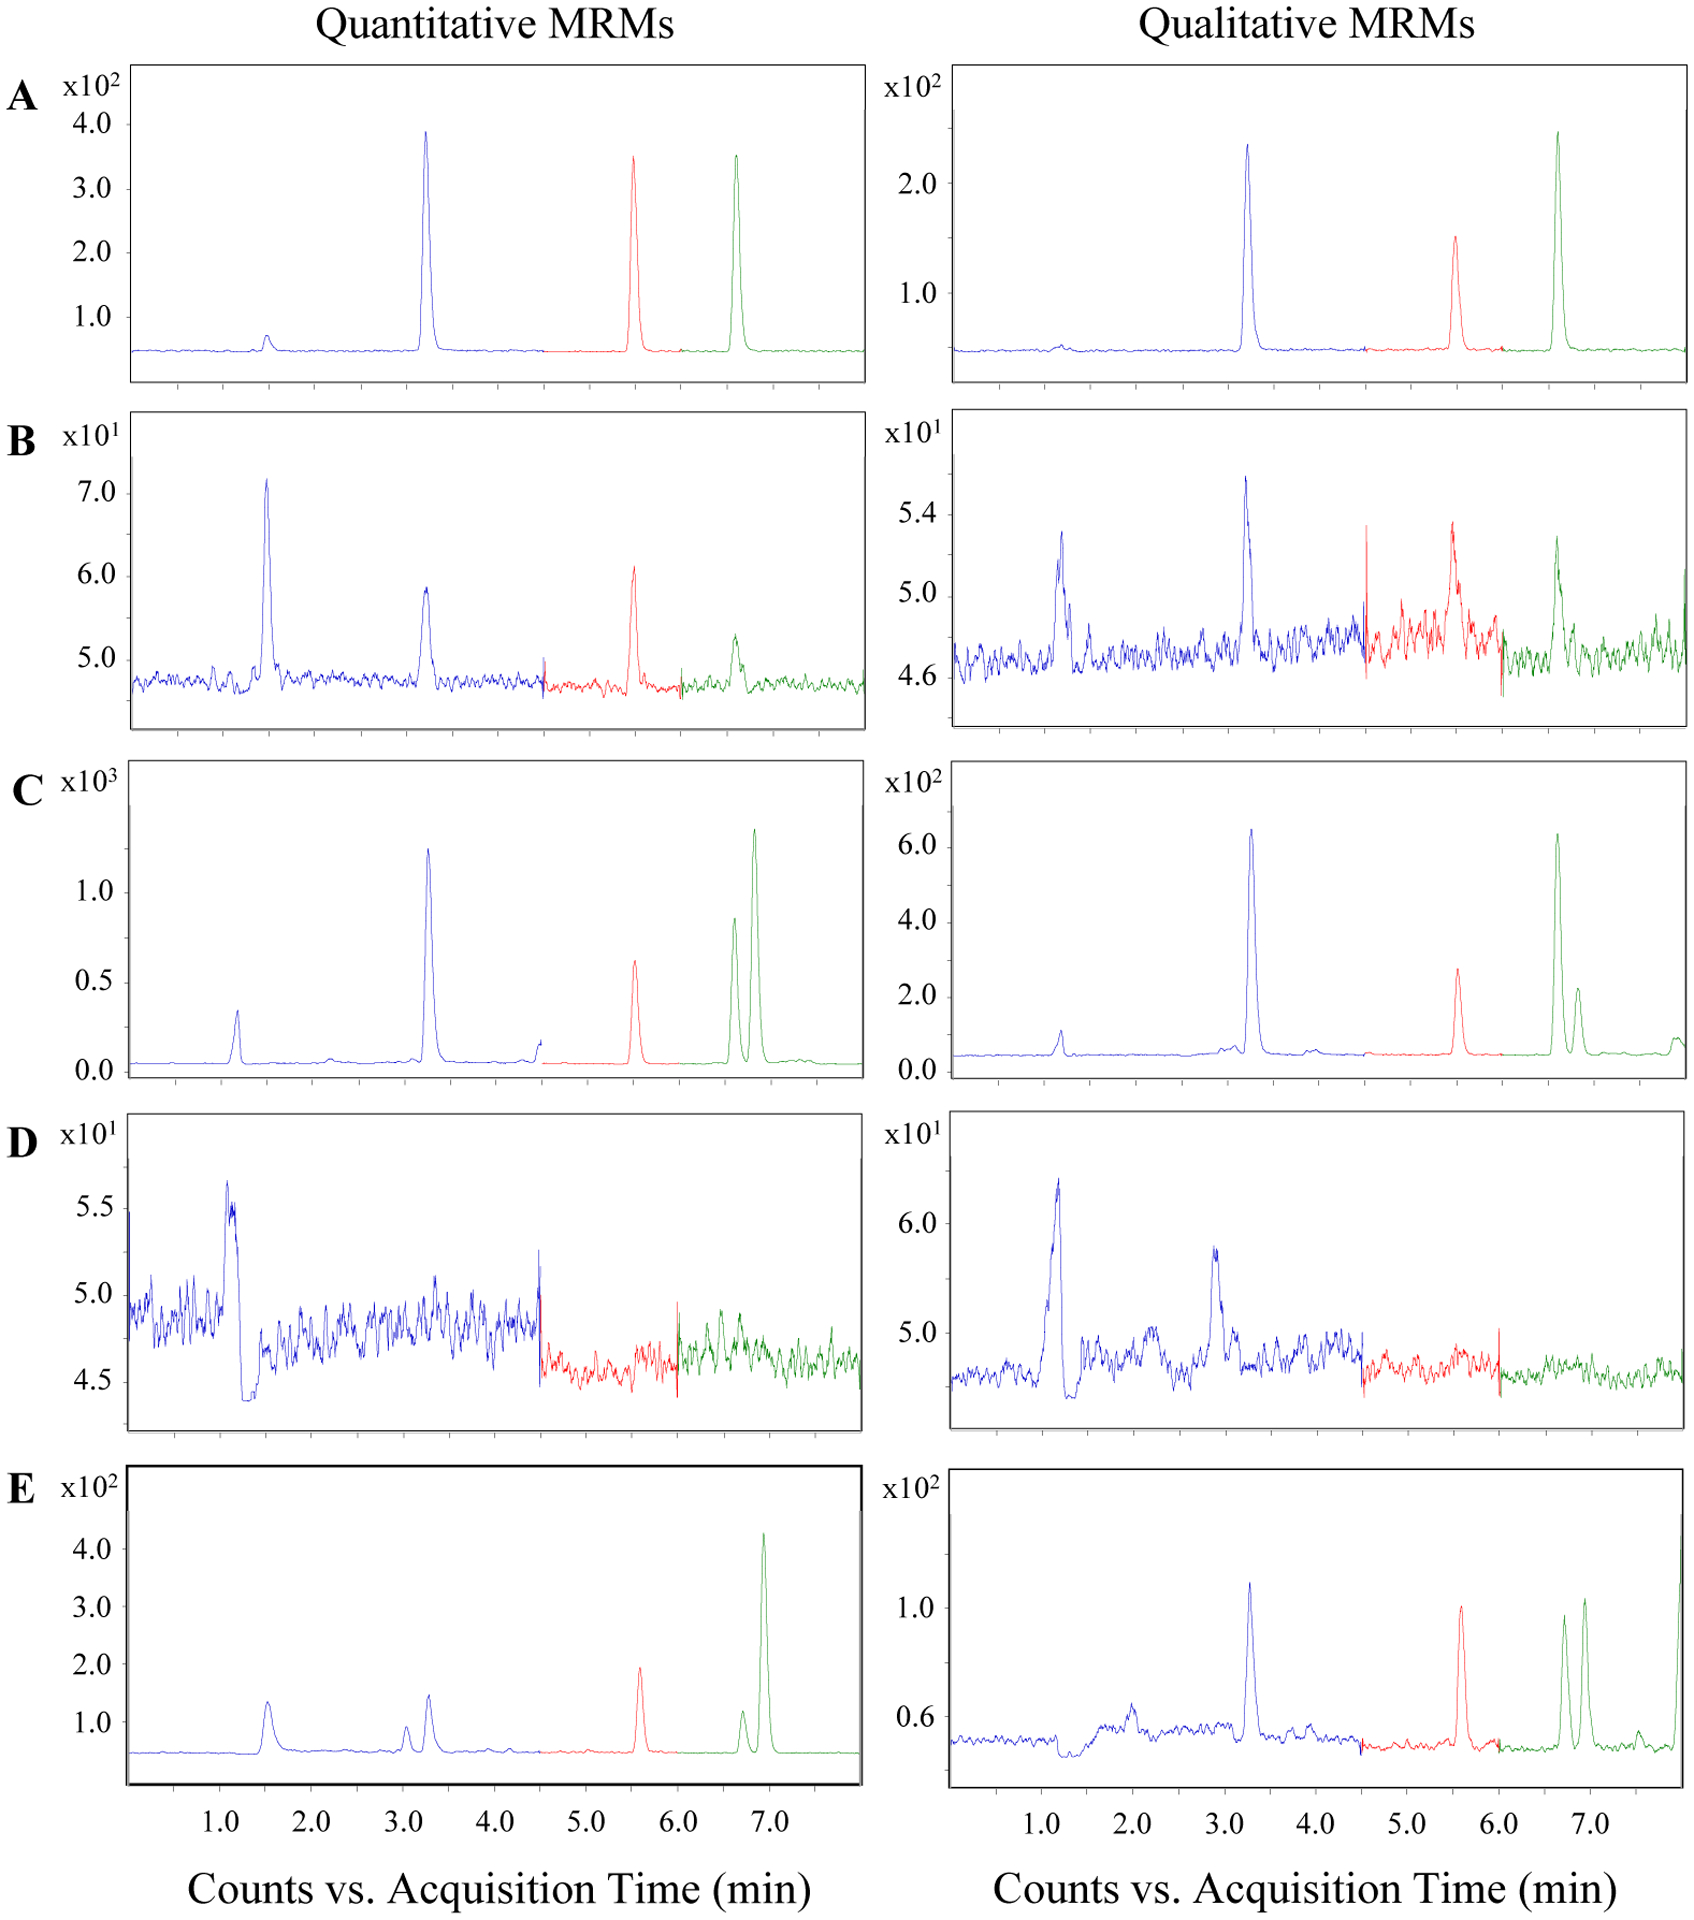
UHPLC-MS/MS chromatograms of A 25 nM standard solution, B standard solution at the LLOQs, C HeLa sample, D HeLa sample without the addition of benzoyl chloride or internal standard solution, and E human serum sample.
3.2. Method Validation
The retention times and the relative ion intensities of the quantitative and qualitative MRM transitions for each 12C6-benzoylated analyte measured in HeLa samples differed from those measured in 25 nM calibration standard solutions less than 1% and 15%, respectively, demonstrating acceptable selectivity. In addition, the ion intensities of the quantitative MRM transition in blanks were less than 1% of those of HeLa samples, indicating that the contributions of the reagents and internal standard to the sample measurement are negligible.
Results from the accuracy and precision experiments are displayed in Table 3. The LLOQ for γ-Glu-Ile was 0.5 nM and those for γ-Glu-Thr and γ-Glu-Val were 1 nM. All QC concentrations for all analytes for both the intra- and inter-day datasets had an accuracy of 100±10% and an RSD of <15%. The linearities of the calibration curves throughout the study were excellent, with r2 > 0.99. Although 1000 nM was chosen as the highest calibrant concentration, the calibration curves remained linear (r2 > 0.99) up to 100 μM, the highest standard solution concentration analyzed. Accuracies determined via standard addition were 91.8, 82.6, and 106.0 for γ-Glu-Ile, γ-Glu-Thr, and γ-Glu-Val, respectively. The linearities in the standard addition experiments were excellent, with r2 > 0.999.
Table 3.
Results from accuracy and precision experiments
| Analyte | Concentration (nM) | Intra-Day | Inter-Day | ||||
|---|---|---|---|---|---|---|---|
| Accuracy (%) | RSD (%) | Accuracy (%) | RSD (%) | ||||
| BzO-γ-Glu-Ile | 0.5 | 101.6 | 10.6 | 105.0 | 7.4 | ||
| 1 | 101.6 | 5.9 | 103.1 | 5.8 | |||
| 500 | 102.9 | 1.8 | 100.1 | 8.1 | |||
| 800 | 108.3 | 1.4 | 101.0 | 7.3 | |||
| BzO-γ-Glu-Thr | 1 | 95.2 | 5.4 | 103.7 | 13.2 | ||
| 2.5 | 106.8 | 6.3 | 104.0 | 10.4 | |||
| 500 | 100.5 | 1.1 | 98.5 | 9.0 | |||
| 800 | 104.2 | 0.8 | 99.9 | 5.7 | |||
| BzO-γ-Glu-Val | 1 | 97.6 | 6.4 | 101.1 | 5.6 | ||
| 2.5 | 96.8 | 5.1 | 100.7 | 9.6 | |||
| 500 | 102.6 | 2.4 | 99.3 | 7.9 | |||
| 800 | 108.7 | 2.2 | 101.2 | 6.9 | |||
Fig. 3 displays the results from the sample stability experiments. Sample concentrations after 12 and 24 h in an autosampler (4 °C), three freeze-thaw cycles, and storage at −80 °C for two weeks were all within 10% of the concentration of freshly processed samples, demonstrating excellent autosampler, freeze-thaw, and long-term stabilities.
Figure 3.

Relative analyte concentrations in HeLa cells: processed and stored in the autosampler (AS; 4 °C) for 0, 12, and 24 h; subjected to three freeze-thaw cycles (3xFT) prior to sample preparation; and processed after storage of the pellet at −80 °C for 2 weeks.
Recoveries for γ-Glu-Ile, γ-Glu-Thr, and γ-Glu-Val were 82.0, 90.8, and 87.5%, respectively. Linearities for the pre- and post-derivatization spiked sample subsets (n=4 each) were excellent, with r2 > 0.999. This is indicative that the benzoylation reaction is highly reproducible. The % recoveries decreased with increasing retention time. This relationship may be due to the increase in analyte hydrophobicity with increased retention time [45], which may also result in increased adsorption to precipitates formed during sample preparation and other insoluble material. If this is the case, analyte recovery may be dependent upon a sample’s concentration of cells during sample preparation, so it would be critical for all samples to have the same concentration of cells as those in the recovery experiments. The slope of the calibration curve differed by <10% to that of the post-derivatization spiked subsamples for all analytes, indicating a minimal influence of matrix effects on the MS response in HeLa samples.
The benzoylation reaction of the analytes in the HeLa cell matrix was found to be nearly quantitative. For the A subsamples (see 2.7 Method Validation for details), which were first reacted with 13C6-BzCl prior to dilution and reaction with 12C6-BzCl, the peak areas for the 12C6-benzoylated analytes were less than 2% of those of the B subsamples, which were not reacted with 13C6-BzCl prior to their dilution and reaction with 12C6-BzCl.
3.3. Analysis of HeLa cells
The aforementioned validated UHPLC-MS/MS method was applied to four HeLa samples measured ten times each on consecutive days. Measured analyte concentrations in HeLa cells are presented in Table 4. Average concentrations of γ-Glu-Ile, γ-Glu-Thr, and γ-Glu-Val in HeLa cells were 1.92, 10.8, and 1.96 pmol/ mg protein, respectively. RSDs for all analyte concentrations in all samples were < 10%, and the RSDs for concentration among the four analyzed HeLa samples were < 5% for all analytes. To the best of our knowledge, this is the first reported validated method for the quantitation of any metabolites in cells using BzCl for CIL.
Table 4.
Analyte concentrations in HeLa cells
| Compound | Concentration (pmol/ mg protein) ± SDa | ||||
|---|---|---|---|---|---|
| HeLa 1 | HeLa 2 | HeLa 3 | HeLa 4 | Average | |
| γ-Glu-Ile | 1.949 ± 0.074 | 1.913 ± 0.076 | 1.838 ± 0.091 | 1.970 ± 0.050 | 1.917 ± 0.058 |
| γ-Glu-Thr | 10.58 ± 0.67 | 10.52 ± 0.22 | 10.51 ± 0.32 | 11.41 ± 0.60 | 10.76 ± 0.44 |
| γ-Glu-Val | 2.01 ± 0.13 | 1.962 ± 0.062 | 1.92 ± 0.11 | 1.92 ± 0.10 | 1.955 ± 0.042 |
SD, standard deviation
3.4. Future Perspective
Most metabolomics studies to date have been semi-quantitative, which severely limits their usefulness when compared to one another. The development and adoption of more quantitative metabolomics methods would allow for meta-analyses of studies using different sample preparation techniques, instrumentation, and instrumental parameters, which could be immensely beneficial for biomarker discovery and the elucidation of molecular mechanisms of pathogenesis. Correcting for matrix effects continues to be the greatest obstacle for quantitative metabolomics using LC-MS/MS and is most commonly addressed through the use of isotopically labeled internal standards. CIL is an extremely promising internal standardization strategy, allowing for the generation of labeled internal standards from relatively inexpensive labeled reagents and unlabeled standards. While BzCl has been demonstrated to be a convenient CIL reagent for analytes possessing nucleophilic functional groups, there is a need for the development of new methods using reagents that react quantitatively, rapidly, predictably, and under mild conditions with other functional groups.
Although the goal of the present study was to develop, validate, and apply a quantitative LC-MS/MS method for the analysis of γ-Glu-Ile, γ-Glu-Thr, and γ-Glu-Val in HeLa cells, this methodology is likely applicable to other nucleophilic compounds and other biological matrices. The broadness of the methodology’s applicability has been supported by its successful application to serum, with a modified sample preparation strategy, as well as the apparent detection of γ-glutamylleucine in both HeLa cells and serum. Application to other biological matrices will require sample preparation optimization and method validation. Other γ-glutamylpeptides could likely be added as targeted analytes, though some amino acids require special considerations. The side chains of cysteine, lysine, and tyrosine contain a thiol, primary amine, and phenol functional group, respectively, which are all reactive to BzCl [41]; the benzoylation product of a γ-glutamylpeptide will contain an additional benzoyl group for each of these amino acids. In addition, cysteine is particularly susceptible to oxidation, and consequently, a carefully considered and optimized sample preparation strategy and thorough method validation are critical. Obviously, this strategy requires the purchase or synthesis of unlabeled targeted analytes, but these are far less expensive than their labeled analogs.
4. Concluding Remarks
In this report, we describe the development and validation of a method for the quantitative analysis of γ-Glu-Ile, γ-Glu-Thr, and γ-Glu-Val using UHPLC-MS/MS in HeLa cells. The method used CIL using BzCl as its internal standardization strategy, and sample preparation consisted of the addition of water, sonication, derivatization, centrifugation, and the addition of internal standard solution. This methodology would also likely work well for other peptide species as well as reducing carbohydrates, polyamines, and other metabolites possessing nucleophilic functional groups. In addition, we have demonstrated the applicability of the method to serum with a modified sample preparation strategy. In the future, we would like to apply this method to human cells from clinical samples and include additional γ-glutamylpeptides in the assay.
Acknowledgements:
This work was supported by the National Institutes of Health grants P30DK089503, P30DK081943, U2C ES026553, and JDRF Center of Excellence for Diabetes Complications Grant 5-COE-2019-861-S-B (to S.P.) and T32DK101357 (to C.H.). The authors would also like to thank Nancy Roeser for help with experimental procedures.
Abbreviations:
- γ-Glu-Ile
γ-Glutamylisoleucine
- γ-Glu-Thr
γ-Glutamylthreonine
- γ-Glu-Val
γ-Glutamylvaline
- ACN
Acetonitrile
- BzCl
Benzoyl chloride
- CIL
Chemical isotope labeling
- FA
Formic acid
- FDA
Food and Drug Administration
- HQC
High quality control
- LLOQ
Lower limit of quantitation
- LQC
Low quality control
- MQC
Medium quality control
- MRM
Multiple reaction monitoring
- PBS
Phosphate-buffered saline
- RSD
Relative standard deviation
- UHPLC-MS/MS
Ultra high performance liquid chromatography – tandem mass spectrometry
Footnotes
Conflict of Interest Statement:
The authors have declared no conflict of interest.
References
- [1].Chen Y, Yang Y, Miller ML, Shen D, Shertzer HG, Stringer KF, Wang B, Schneider SN, Nebert DW, Dalton TP, Hepatocyte-specific Gclc deletion leads to rapid onset of steatosis with mitochondrial injury and liver failure. Hepatology 2007, 45, 1118–1128. [DOI] [PubMed] [Google Scholar]
- [2].Meister A, Anderson ME, Glutathione. Ann. Rev. Biochem 1983, 52, 711–760. [DOI] [PubMed] [Google Scholar]
- [3].Meister A, The γ-glutamyl cycle: diseases associated with specific enzyme deficiencies. Ann. Intern 1974, 81, 247–253. [DOI] [PubMed] [Google Scholar]
- [4].Nilssen O, Førde OH, Brenn T, The Tromsø study: distribution and population determinants of gamma-glutamyltransferase. Am. J. Epidemiol 1990, 132, 318–326. [DOI] [PubMed] [Google Scholar]
- [5].Lee D-H, Ha M-H, Kim J-H, Christiani DC, Gross MD, Steffes M, Blomhoff R, Jacobs DR, Gamma-glutamyltransferase and diabetes - a 4 year follow-up study. Diabetologia 2003, 46, 359–364. [DOI] [PubMed] [Google Scholar]
- [6].Kunutsor SK, Abbasi A, Adler AI, Gamma-glutamyl transferase and risk of type II diabetes: an updated systematic review and dose-response meta-analysis. Ann. Epidemiol 2014, 24, 809–816. [DOI] [PubMed] [Google Scholar]
- [7].Liu C-F, Gu Y-T, Wang H-Y, Fang N-Y, Gamma-glutamyltransferase level and risk of hypertension: a systematic review and meta-analysis. PLoS One 2012, 7, 1–11. [DOI] [PMC free article] [PubMed] [Google Scholar]
- [8].Whitfield JB, Pounder RE, Neale G, Moss DW, Serum y-glutamyl transpeptidase activity in liver disease. Gut 1972, 13, 702–708. [DOI] [PMC free article] [PubMed] [Google Scholar]
- [9].Ruttmann E, Brant LJ, Concin H, Diem G, Rapp K, Ulmer H, Vorarlberg health monitoring and promotion program study group, γ-glutamyltransferase as a risk factor for cardiovascular disease mortality. Circulation 2005, 112, 2130–2137. [DOI] [PubMed] [Google Scholar]
- [10].Kunutsor SK, Apekey TA, Khan H, Liver enzymes and risk of cardiovascular disease in the general population: A meta-analysis of prospective cohort studies. Atherosclerosis 2014, 236, 7–17. [DOI] [PubMed] [Google Scholar]
- [11].Kunutsor SK, Apekey TA, Van Hemelrijck M, Calori G, Perseghin G, Gamma glutamyltransferase, alanine aminotransferase and risk of cancer: systematic review and meta-analysis. Int. J. Cancer 2015, 136, 1162–1170. [DOI] [PubMed] [Google Scholar]
- [12].Ruhl CE, Everhart JE, Elevated serum alanine aminotransferase and γ-glutamyltransferase and mortality in the United States population. Gastroenterology 2009, 136, 477–485. [DOI] [PubMed] [Google Scholar]
- [13].Kunutsor SK, Apekey TA, Seddoh D, Walley J, Liver enzymes and risk of all-cause mortality in general populations: a systematic review and meta-analysis. Int. J. Epidemiol 2014, 43, 187–201. [DOI] [PubMed] [Google Scholar]
- [14].Whitfield JB, Gamma glutamyl transferase. Crit. Rev. Clin. Lab. Sci 2001, 38, 263–355. [DOI] [PubMed] [Google Scholar]
- [15].Connor KM, Hsu Y, Aggarwal PK, Capone S, Colombo AR, Ramsingh G, Understanding metabolic changes in aging bone marrow. Exp. Hematol. Oncol 2018, 7, 1–11. [DOI] [PMC free article] [PubMed] [Google Scholar]
- [16].Yang L, Lv X, Du H, Wu D, Wang M, Causal effects of serum metabolites on amyotrophic lateral sclerosis: a Mendelian randomization study. Prog. Neuro-Psychoph 2020, 97, 1–7. [DOI] [PubMed] [Google Scholar]
- [17].Priolo C, Khabibullin D, Reznik E, Filippakis H, Ogórek B, Kavanagh TR, Nijmeh J, Herbert ZT, Asara JM, Kwiatkowski DJ, Wu C-L, Henske EP, Impairment of gamma-glutamyl transferase 1 activity in the metabolic pathogenesis of chromophobe renal cell carcinoma. Proc. Natl. Acad. Sci. USA 2018, 115, E6274–E6282. [DOI] [PMC free article] [PubMed] [Google Scholar]
- [18].Kanaan YM, Sampey BP, Beyene D, Esnakula AK, Naab TJ, Ricks-Santi LJ, Dasi S, Day A, Blackman KW, Frederick W, Copeland RL Sr., Gabrielson E, DeWitty RL Jr., Metabolic profile of triple-negative breast cancer in African-American women reveals potential biomarkers of aggressive disease. Cancer Genom. Proteom 2014, 11, 279–294. [PubMed] [Google Scholar]
- [19].Lécuyer L, Dalle C, Lyan B, Demidem A, Rossary A, Vasson M-P, Petera M, Lagree M, Ferreira T, Centeno D, Galan P, Hercberg S, Deschasaux M, Partula V, Srour B, Latino-Martel P, Kesse-Guyot E, Druesne-Pecollo N, Durand S, Pujos-Guillot E, Touvier M, Plasma metabolomic signatures associated with long-term breast cancer risk in the SU.VI.MAX prospective cohort. Cancer Epidemiol. Biomarkers Prev 2019, 28, 1300–1307. [DOI] [PubMed] [Google Scholar]
- [20].Huang J, Mondul AM, Weinstein SJ, Derkach A, Moore SC, Sampson JN, Albanes D, Prospective serum metabolomic profiling of lethal prostate cancer. Int. J. Cancer 2019, 145, 3231–3243. [DOI] [PMC free article] [PubMed] [Google Scholar]
- [21].Tang X, Lin C-C, Spasojevic I, Iversen ES, Chi J-T, Marks JR, A joint analysis of metabolomics and genetics of breast cancer. Breast Cancer Res. 2014, 16, 1–15. [DOI] [PMC free article] [PubMed] [Google Scholar]
- [22].Wang Y, Jacobs EJ, Carter BD, Gapstur SM, Stevens VL, Plasma metabolomic profiles and risk of advanced and fatal prostate cancer. Eur. Urol. Oncol 2019, DOI: 10.1016/j.euo.2019.07.005. [DOI] [PubMed] [Google Scholar]
- [23].Suhre K, Meisinger C, Döring A, Altmaier E, Belcredi P, Gieger C, Chang D, Milburn MV, Gall WE, Weinberger KM, Mewes H-W, Hrabé de Angelis M, Wichmann H-E, Kronenberg F, Adamski J, Illig T, Metabolic footprint of diabetes: a multiplatform metabolomics study in an epidemiological setting. PLoS One 2010, 5, 1–11. [DOI] [PMC free article] [PubMed] [Google Scholar]
- [24].Min H-K, Sookoian S, Pirola CJ, Cheng J, Mirshahi F, Sanyal AJ, Metabolic profiling reveals that PNPLA3 induces widespread effects on metabolism beyond triacylglycerol remodeling in Huh-7 hepatoma cells. Am. J. Physiol. Gastrointest. Liver Physiol 2014, 307, G66–G76. [DOI] [PMC free article] [PubMed] [Google Scholar]
- [25].Soga T, Sugimoto M, Honma M, Mori M, Igarashi K, Kashikura K, Ikeda S, Hirayama A, Yamamoto T, Yoshida H, Otsuka M, Tsuji S, Yatomi Y, Sakuragawa T, Watanabe H, Nihei K, Saito T, Kawata S, Suzuki H, Tomita M, Suematsu M, Serum metabolomics reveals γ-glutamyl dipeptides as biomarkers for discrimination among different forms of liver disease. J. Hepatol 2011, 55, 896–905. [DOI] [PubMed] [Google Scholar]
- [26].Candi E, Tesauro M, Cardillo C, Lena AM, Schinzari F, Rodia G, Sica G, Gentileschi P, Rovella V, Annicchiarico-Petruzzelli M, Di Daniele N, Melino G, Metabolic profiling of visceral adipose tissue from obese subjects with or without metabolic syndrome. Biochem. J 2018, 475, 1019–1035. [DOI] [PubMed] [Google Scholar]
- [27].Moore SC, Matthews CE, Sampson JN, Stolzenberg-Solomon RZ, Zheng W, Cai Q, Tan YT, Chow W-H, Ji B-T, Liu DK, Xiao Q, Boca SM, Leitzmann MF, Yang G, Xiang YB, Sinha R, Shu XO, Cross AJ, Human metabolic correlates of body mass index. Metabolomics 2014, 10, 259–269. [DOI] [PMC free article] [PubMed] [Google Scholar]
- [28].Zheng Y, Yu B, Alexander D, Steffen LM, Boerwinkle E, Human metabolome associates with dietary intake habits among African Americans in the atherosclerosis risk in communities study. Am. J. Epidemiol 2014, 179, 1424–1433. [DOI] [PMC free article] [PubMed] [Google Scholar]
- [29].Hirayama A, Igarashi K, Tomita M, Soga T, Development of quantitative method for determination of γ-glutamyl peptides by capillary electrophoresis tandem mass spectrometry: An efficient approach avoiding matrix effect. J. Chromatogr. A 2014, 1369, 161–169. [DOI] [PubMed] [Google Scholar]
- [30].Kobayashi S, Tokairin Y, Miyakoshi T, Saito T, Nagaoka K, Ikeda Y, Fujii J, Konno H, Quantitative analysis of γ-glutamylpeptides by liquid chromatography-mass spectrometry and application for γ-glutamyltransferase assays. Anal. Biochem 2019, 578, 13–22. [DOI] [PubMed] [Google Scholar]
- [31].Saoi M, Sasaki K, Sagawa H, Abe K, Kogiso T, Tokushige K, Hashimoto E, Ohashi Y, Britz-McKibbin P, High throughput screening of serum γ-glutamyl dipeptides for risk assessment of nonalcoholic steatohepatitis with impaired glutathione salvage pathway. J. Proteome Res 2020, 19, 2689–2699. [DOI] [PubMed] [Google Scholar]
- [32].Desfontaine V, Goyon A, Veuthey J-L, Charve J, Guillarme D, Development of a LC–MS/MS method for the determination of isomeric glutamyl peptides in food ingredients. J. Sep. Sci 2018, 41, 847–855. [DOI] [PubMed] [Google Scholar]
- [33].Fu I, Woolf EJ, Matuszewski BK, Effect of the sample matrix on the determination of indinavir in human urine by HPLC with turbo ion spray tandem mass spectrometric detection. J. Pharm. Biomed. Anal 1998, 18, 347–357. [DOI] [PubMed] [Google Scholar]
- [34].Stokvis E, Rosing H, López-Lázaro L, Schellens JHM, Beijnen JH, Switching from an analogous to a stable isotopically labeled internal standard for the LC-MS/MS quantitation of the novel anticancer drug Kahalalide F significantly improves assay performance. Biomed. Chromatogr 2004, 18, 400–402. [DOI] [PubMed] [Google Scholar]
- [35].FDA, Bioanalytical method validation: guidance for industry, http://www.fda.gov/Drugs/GuidanceComplianceRegulatoryInformation/Guidances/default.htmand/orhttp://www.fda.gov/AnimalVeterinary/GuidanceComplianceEnforcement/GuidanceforIndustry/default.htm (last time accessed: May 15, 2021).
- [36].Commission, E., Commission decision 2002/657/ec of 12 August 2002 implementing council directive 96/23/ec concerning the performance of analytical methods and the interpretation of results. Off. J. Euro. Commun 2002, 8–36. [Google Scholar]
- [37].Song P, Mabrouk OS, Hershey ND, Kennedy RT, In vivo neurochemical monitoring using benzoyl chloride derivatization and liquid chromatography–mass spectrometry. Anal. Chem 2012, 84, 412–419. [DOI] [PMC free article] [PubMed] [Google Scholar]
- [38].Wang Z, Yu J, Yao J, Wu L, Xiao H, Wang J, Gao R, Simultaneous identification and quantification of bisphenol A and 12 bisphenol analogues in environmental samples using precolumn derivatization and ultra high performance liquid chromatography with tandem mass spectrometry. J. Sep. Sci 2018, 41, 2269–2278. [DOI] [PubMed] [Google Scholar]
- [39].Learey JJ, Crawford-Clark S, Bowen BJ, Barrow CJ, Adcock JL, Detection of biogenic amines in pet food ingredients by RP-HPLC with automated dansyl chloride derivatization. J. Sep. Sci 2018, 41, 4430–4436. [DOI] [PubMed] [Google Scholar]
- [40].Baghdady YZ, Schug KA, Review of in situ derivatization techniques for enhanced bioanalysis using liquid chromatography with mass spectrometry. J. Sep. Sci 2016, 39, 102–114. [DOI] [PubMed] [Google Scholar]
- [41].Wong J-MT, Malec PA, Mabrouk OS, Ro J, Dus M, Kennedy RT, Benzoyl chloride derivatization with liquid chromatography–mass spectrometry for targeted metabolomics of neurochemicals in biological samples. J. Chromatogr. A 2016, 1446, 78–90. [DOI] [PMC free article] [PubMed] [Google Scholar]
- [42].Meng X, Bai H, Ma Q, Zhang P, Ma H, Deng Y, Broad targeted analysis of neurochemicals in rat serum using liquid chromatography tandem mass spectrometry with chemical derivatization. J. Sep. Sci 2020, 43, 4006–4017. [DOI] [PubMed] [Google Scholar]
- [43].Nováková L, Veuthey JL, Guillarme D, Practical method transfer from high performance liquid chromatography to ultra-high performance liquid chromatography: The importance of frictional heating. J. Chromatogr. A 2011, 1218, 7971–7981. [DOI] [PubMed] [Google Scholar]
- [44].Swartz ME, UPLC ™ : an introduction and review. J. Liq. Chromatogr. R. T 2005, 28, 1253–1263. [Google Scholar]
- [45].D’Amboise M, Hanai T, Hydrophobicity and retention in reversed phase liquid chromatography. J. Liq. Chromatogr 1982, 5, 229–244. [Google Scholar]