Correction to: Scientific Reports https://doi.org/10.1038/s41598-019-53209-y, published online 13 November 2019
The original version of this Article contained errors in Figures 1 and 2.
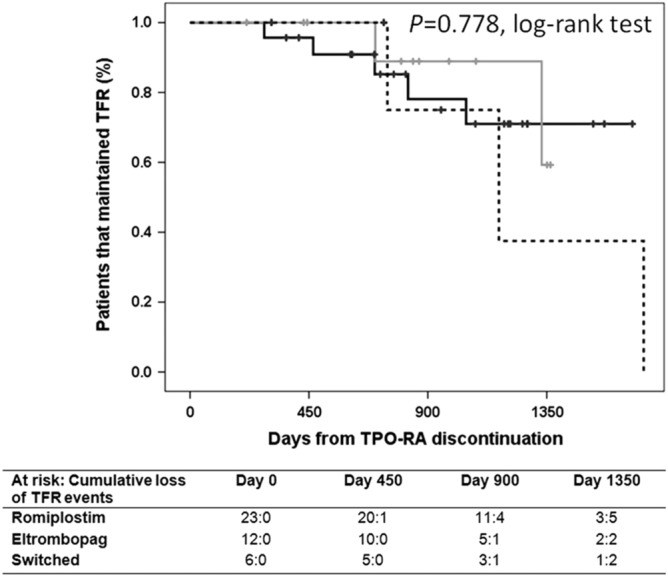
Figure 1.

Probability of maintaining therapy free responses (TFR) upon TPO-RA discontinuation. Kaplan–Meier plot showing the estimated probability of TFR in patients who discontinue TPO-RA for reasons other than lack of efficacy and being followed for a minimum of 6 months (n = 41). Patients who died while on TPO-RA therapy were not included in the study. Solid black line represents patients that received only romiplostim (n = 23); solid grey line represents patients that received only eltrombopag (n = 12), and dashed black line represents patients that switched TPO-RA (n = 6). The number of patients that discontinue TPO therapy (“at risk”) and the cumulative loss of TFR events at time points are presented for each group below the figure.
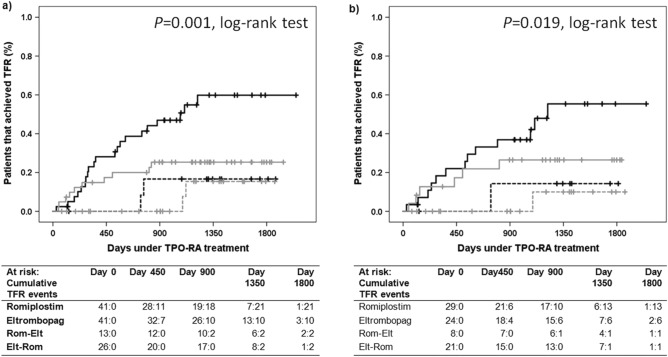
Figure 2.
Probability of achieving therapy free responses (TFR). Proportion of patients achieving TFR within the whole cohort (n = 121) included in the study (panel a), and in those with chronic ITP (panel b). TFR was defined as the ability of a patient to discontinue TPO-RA as platelet counts > 50 × 109/l for at least 6 months in the absence of any therapies meant to increase platelet counts. Patients who died while on TPO-RA therapy were not included in the study. Solid black line represents patients that received only romiplostim (Panel a, n = 41; Panel b, n = 29). Solid grey line represents patients that received only eltrombopag (Panel a, n = 41; Panel b, n = 24). Dashed black line represents patients that initiated romiplostim and switched to eltrombopag (Panel a, n = 13; Panel b, n = 8). Dashed grey line represents patients that initiated eltrombopag and switched to romiplostim (Panel a, n = 26; Panel b, n = 21). The number of patients under TPO therapy (“at risk”) and the cumulative TFR at time points are presented for each group below each figure.
In Figure 1, the y-axis label, “Proportion of patients that maintain TFR” was incorrectly given as “Patients that maintained TFR (%)”. In Figure 2, the y-axis label, “Proportion of patients that achieve TFR” was incorrectly given as “Patients that achieved TFR (%)”. The original Figures 1 and 2 and accompanying legends appear below.
The original Article has been corrected.


