Abstract
Purpose
Diagnosing celiac artery compression syndrome (CACS) is based on an imaging finding of celiac artery compression (CAC), but the diagnostic criteria are inconsistent. The study aim was to devise an ultrasonographic screening method to effectively diagnose CAC in occult CACS.
Methods
The subjects were 61 patients with suspected CACS who underwent ultrasonography at our hospital from May 2017 to December 2019 and were divided into the following two groups: the “arterial compression hook sign”-positive group (n = 15, mean age: 26.6 ± 16.4 years, six males, nine females) and -negative group (n = 41, mean age: 32.5 ± 18.6 years, 12 males, 34 females). We used B-mode and advanced dynamic flow to detect arterial compression hook sign and pulse Doppler to measure expiration peak systolic velocity (EPSV) and inspiration PSV (IPSV).
Results
The EPSV was significantly higher in the arterial compression hook sign-positive group (304.7 ± 47.4 cm/s) than in the -negative groups (158.2 ± 38.7 cm/s), (p < 0.001). Receiver operating characteristic curve analysis was performed to calculate the EPSV cutoff value for presence of CAC, which was 226 cm/s (sensitivity: 0.957, specificity: 1.000, AUC: 0.997, 95% confidence interval: 0.99–1). The IPSV was lower in the positive group than in the negative group in all cases (EPSV − IPSV range: 68–199 cm/s).
Conclusion
Our results showed that if arterial compression hook sign determined by B-mode ultrasound, EPSV > 226 cm/s, and IPSV decreases by ≥ 68 cm/s, then CAC can be detected with high specificity.
Graphic abstract
Keywords: Arterial compression hook sign, Celiac artery compression syndrome, Median arcuate ligament syndrome, Ultrasound
Introduction
Celiac artery compression syndrome (CACS), also known as median arcuate ligament syndrome (MALS), is caused by MAL compression of the celiac plexus and celiac artery origin. It was initially described by Harjola in 1963, with symptoms characterized by postprandial intestinal angina [1]. Although several papers have described the ultrasound (US) findings of CACS [2–5], there is no consensus on the US diagnostic criteria. For example, Scholbach [2] established the following criteria for US findings for CACS: (1) a greater than two-fold acceleration of peak systolic velocity (PSV) of flow in the celiac artery measured in the mid position between inspiration and expiration relative to that of the abdominal aorta immediately below the diaphragm, (2) a PSV > 200 cm/s in the mid position, and (3) variations in flow velocity occurring during respiration. Moreover, Gruber et al. [3] reported that combined maximum expiratory peak flow velocities > 350 cm/s and celiac trunk deflection angles > 50° appeared to be the most reliable indicator for MALS in their small series of patients.
According to reports [4, 5], a > 3:1 ratio between the PSV in the celiac artery during expiration and that in the abdominal aorta immediately below the diaphragm is also a criterion for diagnosing MALS. The essence of CACS is a stenotic lesion resulting from compression by the MAL, so it is first necessary to clearly image the stenosis by B-mode US. Furthermore, an increase in expiratory peak systolic velocity (EPSV) provides a basis for supporting the presence of a stenotic lesion, and a decrease in inspiration PSV (IPSV) indicates reduced stenosis during inspiration. Diagnosis of CACS could benefit by applying a concept that integrates morphological findings with blood flow evaluation results. A morphological finding in CACS can be described as “arterial compression hook sign”. The study aim was to evaluate the use of EPSV and IPSV with the presence of arterial compression hook sign to develop an effective and systematic US method for diagnosis of CACS.
Materials and methods
Patients
The subjects were 61 patients (mean age: 30.8 ± 18.1 years, 18 males, 43 females) who presented with abdominal pain and had no obvious organic diseases as potential causes on US. We considered CACS as a differential disease. For these patients, US had been performed between May 2017 to December 2019 at Fukuoka Tokushukai Hospital (Fukuoka, Japan). The patients were divided into the following two groups: the “arterial compression hook sign”-positive group (15 patients, mean age: 26.6 ± 16.4 years, six males, nine females) and the “arterial compression hook sign”-negative group (46 patients, mean age: 32.5 ± 18.6 years, 12 males, 34 females). This study was approved by our ethics committee, and informed consent was obtained from each patient.
Ultrasound diagnostic equipment
Transabdominal US using Aplio 400, Aplio 500, or Aplio XG instruments with a 5-MHz convex transducer (6C1, 10C1) (Canon Medical Systems, Japan) was performed.
B-mode US
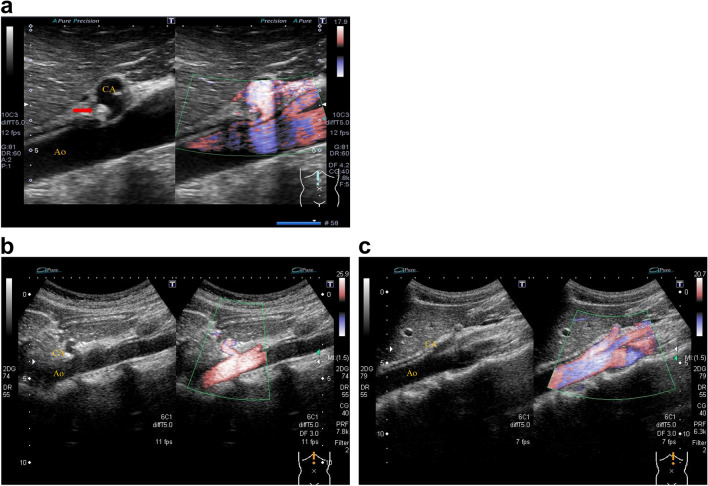
We defined arterial compression hook sign as narrowing and flexing of the celiac artery origin resulting from compression by the enlarged MAL (Fig. 1a). On the other hand, cases in which the deflection angle was negative and cases in which the deflection angle was positive but there was no stenosis at the origin of the celiac artery were defined as arterial compression hook sign negative (Fig. 1b, c). A positive deflection angle was defined according to the end-expiratory upturn angle proposed by Gruber et al. [3].
Fig. 1.
Arterial compression hook sign. a “Arterial compression hook sign”-positive case. On expiration, narrowing of the celiac artery origin due to compression by the high echoic structure (red arrow; hypertrophied median arcuate ligament) can be observed and subsequently shows the “arterial compression hook sign”. b “Arterial compression hook sign”-negative case. The celiac artery has an angular deflection, but no root stenosis. c “Arterial compression hook sign”-negative case. The celiac artery is straight without angular deflection. CA celiac artery, Ao aorta
Color Doppler
Color Doppler US used the advanced dynamic flow mode, which has little blooming and high resolution. The angle correction was set to < 60° and as close to 0° as possible.
Statistical analysis
A p value of < 0.05 was considered statistically significant. The Shapiro–Wilks normality test was used to confirm normal distributions. The paired t-test was used to determine the significance of differences between EPSV and IPSV, and the unpaired t-test was used to determine the significance of difference in EPSV between the arterial compression hook sign-positive and -negative groups. Repeated-measures ANOVA was also used for these cross comparisons. Receiver operating characteristic curve analysis was used to calculate the PSV cutoff value for presence or absence of CAC.
Results
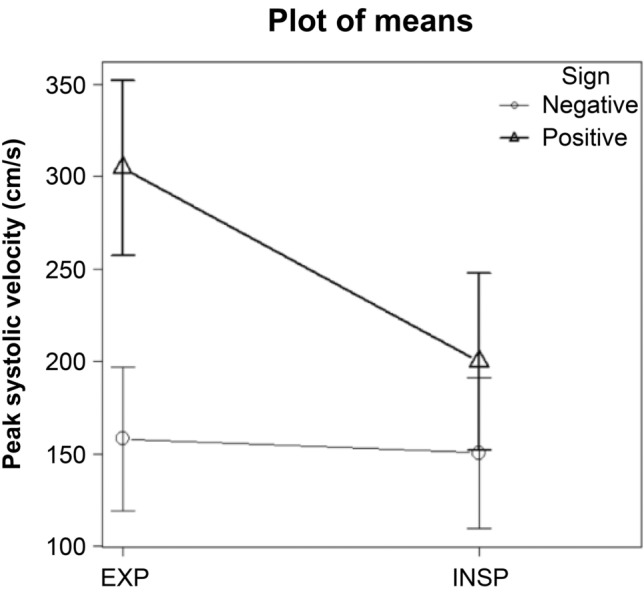
The EPSVs of the arterial compression hook sign-positive and -negative groups were 304.7 ± 47.4 cm/s and 158.2 ± 38.7 cm/s, respectively (Table 1). The EPSV was significantly higher than the IPSV in the arterial compression hook sign-positive group (p < 0.001) but was not significantly different from the IPSV in the negative group (p = 0.08). Comparison of the EPSVs between the positive and negative groups showed significantly higher values in the positive group (p < 0.001). Repeated-measures ANOVA with group (positive and negative) and phase of respiration (expiration or inspiration) as factors showed significant effects of group (F(1, 59) = 72.843, p < 0.001) and phase of respiration (F(1,59) = 139.472, p < 0.001) as well as a group × phase of respiration interaction (F(1,59) = 104.092, p < 0.001) (Fig. 2).
Table 1.
Comparison of EPSV and IPSV between the “arterial compression hook sign”-positive and -negative groups
| n | Peak systolic velocity, cm/s | EPSV vs IPSV | |||
|---|---|---|---|---|---|
| EPSV | IPSV | EPSV − IPSV | |||
| Arterial compression hook sign ( −) | 46 | 158.2 ± 38.7 | 150.5 ± 40.9 | 7.7 ± 28.5 | p = 0.08 |
| Arterial compression hook sign ( +) | 15 | 304.7 ± 47.4 | 199.9 ± 47.8 | 104.8 ± 41.4 | p < 0.001 |
| Sign ( −) vs sign ( +) | p < 0.001 | p < 0.001 | |||
EPSV expiration peak systolic velocity, INSP inspiration peak systolic velocity
Fig. 2.

Comparison of expiration and inspiration peak systolic velocities between the “arterial compression hook sign”-positive group and -negative group. Repeated-measures ANOVA with group (positive and negative) and phase of respiration (expiration or inspiration) as factors revealed effects of group (F(1, 59) = 72.843, p < 0.001) and phase of respiration (F(1,59) = 139.472, p < 0.001) as well as a group × phase of respiration interaction (F(1,59) = 104.092, p < 0.001). EXP: expiration, INSP: inspiration, Sign: arterial compression hook sign
Furthermore, an EPSV value of 226 cm/s enabled discrimination between the positive and negative groups [sensitivity: 0.957, specificity: 1.000, AUC: 0.997, 95% confidence interval (CI): 0.99–1]. The mean value of EPSV − IPSV was 104.8 ± 41.4 cm/s (range: 68–199 cm/s) in the positive group and 7.7 ± 28.5 cm/s (range: − 55 to 72 cm/s) in the negative group, and the negative group showed disordered bidirectional changes, but the positive group showed decreased PSV during inspiration in all cases (Fig. 2).
The 15 arterial compression hook sign-positive patients consisted of seven who were clinically symptomatic and eight who were asymptomatic (Table 2). In this study, only three patients had characteristic postprandial symptoms in CACS patients, and four patients had “abdominal pain that increased during exercise.”
Table 2.
Characteristics of “arterial compression hook sign” in 15 patients in the positive group
| Age | Sex | Arterial compression hook sign | Peak systolic velocity, cm/s | Symptoms | Postprandial abdominal symptoms | Intense exercise | Chronic abdominal pain | |||
|---|---|---|---|---|---|---|---|---|---|---|
| EPSV | IPSV | EPSV − IPSV | ||||||||
| Case 1 | 11 | M | ( +) | 350 | 162 | 188 | Symptomatic | ( +) | ( +) | ( +) |
| Case 2 | 16 | M | ( +) | 331 | 223 | 108 | Symptomatic | ( +) | ( +) | ( +) |
| Case 3 | 13 | F | ( +) | 283 | 215 | 68 | Symptomatic | ( −) | ( +) | ( +) |
| Case 4 | 15 | F | ( +) | 303 | 232 | 71 | Symptomatic | ( −) | ( +) | ( +) |
| Case 5 | 21 | M | ( +) | 370 | 274 | 96 | Symptomatic | ( +) | ( −) | ( +) |
| Case 6 | 27 | F | ( +) | 363 | 164 | 199 | Symptomatic | ( −) | ( −) | ( +) |
| Case 7 | 14 | F | ( +) | 322 | 254 | 68 | Symptomatic | ( −) | ( −) | ( +) |
| Case 8 | 14 | M | ( +) | 383 | 298 | 85 | Asymptomatic | ( −) | ( −) | ( −) |
| Case 9 | 19 | M | ( +) | 251 | 158 | 93 | Asymptomatic | ( −) | ( −) | ( −) |
| Case 10 | 28 | M | ( +) | 293 | 174 | 119 | Asymptomatic | ( −) | ( −) | ( −) |
| Case 11 | 23 | F | ( +) | 304 | 182 | 122 | Asymptomatic | ( −) | ( −) | ( −) |
| Case 12 | 37 | F | ( +) | 226 | 154 | 72 | Asymptomatic | ( −) | ( −) | ( −) |
| Case 13 | 38 | F | ( +) | 261 | 184 | 77 | Asymptomatic | ( −) | ( −) | ( −) |
| Case 14 | 61 | F | ( +) | 267 | 190 | 77 | Asymptomatic | ( −) | ( −) | ( −) |
| Case 15 | 62 | M | ( +) | 264 | 135 | 129 | Asymptomatic | ( −) | ( −) | ( −) |
Discussion
US is an indispensable technique for examining abdominal pain, and its usefulness in primary care has been often reported [6, 7]. However, close examination of branch vessels of the abdominal aorta, such as the celiac artery, is rare in all cases, and CAC is an often overlooked anatomical abnormality. An overlooked CAC could possibly lead to future aneurysm formation in the pancreaticoduodenal arcade, so early detection is important. US can non-invasively detect CAC and simultaneously rule out other diseases. In the research described here, we devised an effective US screening method for patients with suspected CACS.
The key to diagnosing CACS is to recall the disease first. The 15 CAC cases were clinically manifested as seven symptomatic and eight asymptomatic (Table 2). A typical symptom of CACS was “postprandial abdominal pain”, which was a complaint in three patients in this study. Also noteworthy was “abdominal pain that increased during intense exercise”, which occurred in four patients. The following hypotheses can be considered regarding the mechanism through which CACS developed in patients with abdominal pain that increased during intense exercise. Although cardiac output is distributed to each organ according to the condition of a living body, blood flow to the skeletal muscles can reach 80% of the total cardiac output during intense exercise, which conversely reduces blood flow to the digestive tract considerably [8].
Such a reduction in blood flow distribution to the digestive tract could have perhaps caused relative visceral ischemia to the celiac artery governing the region. Furthermore, the increase in respiratory frequency due to repeated intense breathing induced by vigorous exercise could have likely caused frequent physical stimulation and compression of the celiac artery plexus. We recommend that physicians also consider the possibility of CACS involvement when abdominal pain occurs during intense exercise and after postprandial abdominal symptoms as well as actively evaluate celiac artery morphology; i.e., the presence of arterial compression hook sign and PSV during inspiration and expiration. However, not all patients with CAC are diagnosed as having CACS. Asymptomatic CAC has been reported in approximately 2.4–8% of the population [9–11] because patients with asymptomatic CAC prevent ischemia within the celiac artery region by receiving blood flow from the superior mesenteric artery via the pancreaticoduodenal arcade [9, 12].
An important aspect of CACS imaging is to prove that CAC is present, and there are various reports of the use of US [2–5], computed tomography (CT) [13, 14], and MRI [15] for this purpose. Particularly in US, many findings obtained by using Doppler US have been reported [2–5, 16]. However, their diagnostic criteria are not uniform. A characteristic finding of CAC in CT is “hooked appearance” [13, 14]. We called this hooked appearance observed by US arterial compression hook sign when the origin of the celiac artery was compressed and bent during expiration because the form is similar to a hook. Figure 1 shows a typical arterial compression hook sign and a normal celiac artery origin. This arterial compression hook sign is an important B-mode US finding that morphologically suggests compression of the origin of the celiac artery by the MAL. It is a morphological image that emphasizes not only the already reported “deflection angle” [3], but also the compression narrowing at the origin, and we clearly defines its features in this research.
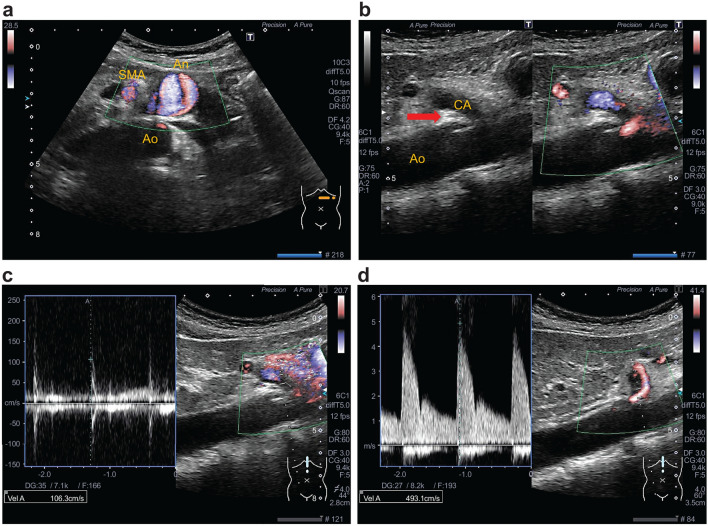
The mean EPSV in CACS has previously been reported to be 348 ± 103.18 cm/s by Scholbach [2] and 425 ± 130.1 cm/s by Gruber et al. [3]. In the present study, the mean EPSV was 304.7 ± 47.4 cm/s, which was slightly lower than the values in these two previous reports. This difference may have been caused by mild stenosis, which was detected. Acampora et al. [17] reported a borderline case in which EPSV increased only up to 169.3 cm/s, suggesting that the degree of compression and EPSV are positively correlated. Additionally, Taimur et al. [16] stated that the following two criteria are supportive for the diagnosis of CACS by ultrasound: an EPSV > 200 cm/s and deflection angle > 50°. However, the EPSV cutoff value derived from the present study was 226 cm/s, which gave better specificity than that for a cutoff of 200 cm/s (EPSV 226 cm/s = specificity 0.957, EPSV 200 cm/s = specificity 0.833). Further, we found that an IPSV ≥ 62 cm/s more than the EPSV indicated that the stenosis has been alleviated during inspiration. In other words, this important finding indicated the presence of stenosis in the celiac artery during expiration. Additionally, it should be noted that this stenosis indicated near occlusion. In this case, despite the fact that arterial compression hook sign is positive, the reversal phenomenon occurs in which the EPSV is low and the IPSV increases (Fig. 3). This reversal occurs because the stenosis is somewhat alleviated by inspiration and high-speed blood flow occurs, whereas the blood flow is almost occluded during expiration.
Fig. 3.
Another case of celiac artery compression syndrome (CACS) with inferior pancreaticoduodenal artery aneurysm. In a 51-year-old woman, accidental 22-mm abdominal visceral aneurysm was observed (a), and pancreaticoduodenal artery aneurysm resection was performed. Despite “arterial compression hook sign”-positive (b), the expiration peak systolic velocity (PSV) has a low flow velocity with systolic spikes without diastolic flow (c). PSV at different respiratory positions. c) expiration PSV (106 cm/s); d) inspiration PSV (493 cm/s). Unlike typical CACS, when a blood vessel is nearly occluded during expiration, peak systolic velocity rises during inspiration rather than expiration. Such a reverse phenomenon occurs when the celiac artery is compressed very strongly and almost occluded. SMA Superior mesenteric artery, CA celiac artery, Ao aorta, An aneurysm
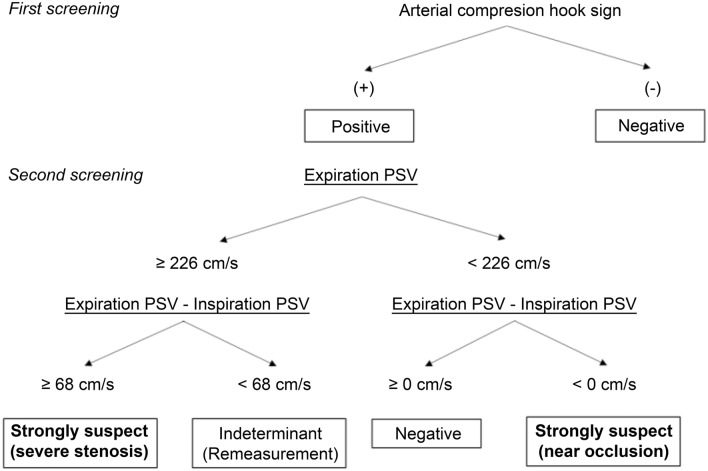
These effects were integrated in a flowchart (Fig. 4). In the first step of an examination, the presence or absence of arterial compression hook sign is confirmed, and if positive, it is a strong basis for the presence of CAC. Next, the EPSV is measured to determine if the blood flow is at a high speed of ≥ 226 cm/s. Furthermore, if the IPSV becomes > 68 cm/s less than the EPSV, it is then a basis for strongly supporting the existence of CAC. By using this flowchart, it is possible to detect many potential cases of CAC with high specificity and is a superior test to those used in previous reports in this respect.
Fig. 4.
US screening flowchart for effective detection of celiac artery compression syndrome
There were two limitations in this study that should be considered when evaluating our results. First, our patient sample size was small, which means that it is possible that our results might not apply broadly. This should be confirmed by further testing. Second, we did not confirm the presence of CAC by another method, which would have been useful to confirm the accuracy of our findings.
Conclusion
We devised an effective US screening method for patients suspected of having CACS. If arterial compression hook sign is positive in this screening, EPSV is ≥ 226 cm/s, and the difference between IPSV drops to > 68 cm/s than the EPSV, then CAC can be suspected with high specificity.
Acknowledgements
The authors would like to thank Enago (www.enago.jp) for the English language review.
Author contributions
DM: data collection and analysis, manuscript writing, RH: data collection, MS: data collection, YH: diagnosis and treatment, TS: check and proofread.
Funding
No financial support was received.
Data availability
The data sets generated and analyzed during the current study are available from the corresponding author on reasonable request.
Compliance with ethical standards
Conflict of interest
The authors have no competing interests to declare.
Research involving human participants and/or animals
This research was approved by the medical ethics committee of the Fukuoka Tokushukai Hospital (No.200302).
Informed consent
Informed consent was obtained from all individual participants included in the study.
Footnotes
Publisher's Note
Springer Nature remains neutral with regard to jurisdictional claims in published maps and institutional affiliations.
References
- 1.Harjola PT. A rare obstruction of the coeliac artery. Report of a case. Ann Chir Gynaecol Fenn. 1963;52:547–550. [PubMed] [Google Scholar]
- 2.Scholbach T. Celiac artery compression syndrome in children, adolescents, and young adults. J Ultrasound Med. 2006;25:299–305. doi: 10.7863/jum.2006.25.3.299. [DOI] [PubMed] [Google Scholar]
- 3.Gruber H, Loizides A, Peer S, Gruber I. Ultrasound of the median arcuate ligament syndrome: a new approach to diagnosis. Med Ultrasound. 2012;14:5–9. [PubMed] [Google Scholar]
- 4.Wolfman D, Bluth EI, Sossaman J. Median arcuate ligament syndrome. J Ultrasound Med. 2003;22:1377–1380. doi: 10.7863/jum.2003.22.12.1377. [DOI] [PubMed] [Google Scholar]
- 5.Erden A, Yurdakul M, Cumhur T. Marked increase in flow velocities during deep expiration: a duplex Doppler sign of celiac artery compression syndrome. Cardiovasc Interv Radiol. 1999;22:331–332. doi: 10.1007/s002709900399. [DOI] [PubMed] [Google Scholar]
- 6.Abdolrazaghnejd A, Banaie M, Tavakoli N, Safdari M, Rajabpour-Sanati A. Pain management in the emergency department: a review article on options and methods. Adv J Emerg Med. 2018;2:e45. doi: 10.22114/AJEM.v0i0.93. [DOI] [PMC free article] [PubMed] [Google Scholar]
- 7.Cruz-Arámbulo R, Wrigley R. Ultrasonography of the acute abdomen. Clin Tech Small Anim Pract. 2003;18:20–31. doi: 10.1016/1096-2867(03)90022-3. [DOI] [PubMed] [Google Scholar]
- 8.Russell TD. Exercise medicine chapter 2—cardiovascular physiology of exercise. Cambridge: Academic Press; 1983. pp. 19–27. [Google Scholar]
- 9.Gümüş H, Gümüş M, Tekbas G, Onder H, Ekici F, Centiccakmak MG, Bilici A. Clinical and multidetector computed tomography findings of patients with median arcuate ligament syndrome. Clin Imaging. 2012;36:522–525. doi: 10.1016/j.clinimag.2011.11.031. [DOI] [PubMed] [Google Scholar]
- 10.Samon S, Sudhakar SV, Keshava SN. Celiac axis compression by median arcuate ligament on computed tomography among asymptomatic persons. Indian J Gastroenterol. 2010;29:121–123. doi: 10.1007/s12664-010-0028-x. [DOI] [PubMed] [Google Scholar]
- 11.Park CM, Chung JW, Kim HB, Shin SJ, Park JH. Celiac axis stenosis: incidence and etiologies in asymptomatic individuals. Korean J Radiol. 2001;2:8–13. doi: 10.3348/kjr.2001.2.1.8. [DOI] [PMC free article] [PubMed] [Google Scholar]
- 12.Prabhakar D, Venkat D, Cooper GS. Celiac axis compression syndrome: a syndrome of delayed diagnosis? Gastroenterol Hepatol. 2017;13:192–194. [PMC free article] [PubMed] [Google Scholar]
- 13.Karahan OI, Kahriman G, Yikilmaz A, Ok E. Celiac artery compression syndrome: diagnosis with multislice CT. Diagn Interv Radiol. 2007;13:90–93. [PubMed] [Google Scholar]
- 14.Horton KM, Talamini MA, Fishman EK. Median arcuate ligament syndrome: evaluation with CT angiography. Radio Graphics. 2005;25:1177–1182. doi: 10.1148/rg.255055001. [DOI] [PubMed] [Google Scholar]
- 15.Lee VS, Morgan JN, Tan AG, Pandharipande PV, Krinsky GA, Barker JA, Lo C, Weinreb JC. Celiac artery compression by the median arcuate ligament: a pitfall of end-expiratory MR Imaging. Radiology. 2003;228:437–442. doi: 10.1148/radiol.2282020689. [DOI] [PubMed] [Google Scholar]
- 16.Taimur S, Donald TB (2019) Celiac artery compression syndrome, stat pearls internet https//www.ncbi.nlm.nih.gov/books/NBK470601/. Accessed 8 Apr 2020
- 17.Acampora C, Di Serafino M, Iacobellis F, Trovato P, Barbuto L, Sangiuliano N, Costigliola L, Romano L. Insight into dunbar syndrome: color-Doppler ultrasound findings and literature review. J Ultrasound. 2020 doi: 10.1007/s40477-019-00422-0. [DOI] [PMC free article] [PubMed] [Google Scholar]
Associated Data
This section collects any data citations, data availability statements, or supplementary materials included in this article.
Data Availability Statement
The data sets generated and analyzed during the current study are available from the corresponding author on reasonable request.


