

Abstract
Background
Combined markers of renal dysfunction and inflammation, e.g., cystatin C, might assist with risk stratification and clinical decisions in patients with coronavirus disease 19 (COVID-19). We conducted a systematic review and meta-analysis with meta-regression of serum cystatin C in COVID-19.
Methods
We searched PubMed, Web of Science and Scopus, between January 2020 and February 2021, for studies reporting serum cystatin C concentrations, measures of clinical severity and survival outcomes in hospitalized COVID-19 patients (PROSPERO registration number: CRD42021245295).
Results
Thirteen studies in 2510 COVID-19 patients, 1972 with low severity or survivor status and 538 with high severity or non-survivor status during follow up, were included in the meta-analysis. The pooled results showed that serum cystatin C concentrations were higher in patients with high disease severity or non-survivor status (standard mean deviation, SMD, 1.71, 95% CI 0.95 to 2.46, p < 0.001). Extreme between-study heterogeneity was observed (I2 = 97.5%, p < 0.001). Sensitivity analysis, performed by sequentially removing each study and re-assessing the pooled estimates, showed that the magnitude and direction of the effect size was not substantially modified. The Begg’s and Egger’s t tests did not show publication bias. In meta-regression, the SMD of serum cystatin C was not associated with age, proportion of males, C-reactive protein, neutrophils, lymphocytes, aspartate aminotransferase, alanine aminotransferase, albumin, creatinine, creatine kinase-MB, lactate dehydrogenase, and proportion of patients with diabetes or hypertension.
Conclusions
Higher concentrations of serum cystatin C were associated with higher COVID-19 severity and mortality.
Graphic abstract

Keywords: Serum cystatin C, COVID-19 severity, Mortality
Introduction
A number of clinical and demographic factors and biomarkers have shown significant associations with coronavirus disease 19 (COVID-19) severity, based on clinical presentation, imaging findings, or need for intensive care unit (ICU) admission, and survival outcomes [1, 2]. In terms of biomarkers, the excessive activation of inflammatory and oxidative stress pathways observed in severe COVID-19 has prompted the assessment of the diagnostic and prognostic role of C-reactive protein, white blood cell components, procalcitonin, ferritin, prealbumin, and serum amyloid A [3–7]. Additionally, patients with more severe forms of the disease often experience extrapulmonary abnormalities affecting different organs and systems, e.g., cardiovascular, haematological, gastrointestinal, and neurological [8]. Another key organ likely to be involved in COVID-19 is the kidney, with a reported prevalence of acute kidney injury (AKI) in hospitalized patients as high as 43% [9, 10]. While the exact mechanisms responsible for the onset and the development of renal dysfunction are not fully established, studies have reported positive staining of tubules with antigens of severe acute respiratory syndrome coronavirus 2 (SARS-CoV-2), the agent responsible for COVID-19, and complement components, the presence of viral particles in tubular epithelial cells and podocytes, and the isolation of SARS-CoV-2 in urine [9]. Other investigations have demonstrated the presence of acute tubular injury, glomerular fibrin thrombi, indicating endothelial dysfunction and coagulopathy, and acute tubular necrosis [11–15]. Notably, the presence of COVID-19-associated AKI independently predicts adverse clinical outcomes [10]. The relatively frequent occurrence of renal dysfunction in patients with COVID-19 suggests that renal biomarkers might assist with early risk stratification, monitoring and management in this group [10]. However, the availability of biomarkers that are able to reflect not only the early presence of kidney dysfunction but also other abnormal processes, e.g., systemic inflammation, oxidative stress, and cytokine storm, might be particularly useful in this context. Cystatin C is a low-molecular-weight protein that is a member of the cystatin superfamily of cysteine protease inhibitors. Cystatin C is widely distributed in different organs and tissues and, in view of its relatively small molecular weight and easy detection, is also used as a marker of glomerular filtration rate. Unlike other renal biomarkers, e.g., serum creatinine, cystatin C is less susceptible to biological interference and more sensitive to early deterioration in renal function [16–18]. Furthermore, there is increasing evidence that cystatin C is associated with various immune responses to exogenous and endogenous antigens and that its encoding gene is regulated by a number of cytokines during inflammation and infection [19]. In turn, cystatin C can exert several immunomodulatory functions by controlling the activity of cysteine proteases and other mechanisms. This has led some authors to propose its prognostic use in inflammatory disorders [19, 20]. Given that the assessment of serum cystatin C in COVID-19 patients might provide useful information regarding the combined presence of excess systemic inflammation and kidney dysfunction, we sought to investigate the clinical role of this biomarker by conducting a systematic review and meta-analysis of studies reporting serum cystatin C concentrations in patients with different degrees of disease severity and survival status during follow-up. In particular, we speculated that patients with severe disease and/or reduced survival had higher concentrations of serum cystatin C when compared to those with milder disease and/or favourable outcomes. A meta-regression analysis was also performed to investigate possible associations between the effect size of the between-group differences in serum cystatin C concentrations, clinical and demographic factors, and markers of inflammation and organ damage.
Materials and methods
Search strategy and study selection
A literature search was conducted, using the terms “cystatin C” and “coronavirus disease 19” or “COVID-19”, in the electronic databases PubMed, Web of Science and Scopus, from January 2020 to February 2021, to identify peer-reviewed studies reporting serum cystatin C concentrations in COVID-19 patients (PROSPERO registration number: CRD42021245295). The references of the retrieved articles were also searched to identify additional studies. Eligibility criteria for inclusion were as follows: (a) reporting continuous data on serum cystatin C concentrations in COVID-19 patients, (b) investigating COVID-19 patients with different degrees of disease severity and/or survival status during follow up, (c) adult patients, (d) English language, and (e) full-text article available. Two investigators independently screened all abstracts. If relevant, they independently reviewed the full-text articles. The Newcastle–Ottawa scale was used to assess study quality. A score of ≥ 6 indicated high quality [21].
Statistical analysis
Standardized mean differences (SMD) and 95% confidence intervals (CIs) were calculated to build forest plots of continuous data and evaluate differences in cystatin C concentrations between COVID-19 patients with low vs. high severity or survivor vs. non-survivor status during follow up. A p value < 0.05 was considered statistically significant. If studies reported concentrations as median and interquartile range (IQR), the corresponding mean and standard deviation were estimated [22]. When individual studies described more than two patient groups (e.g., mild, moderate, severe, and critical illness) the mild/moderate and the severe/critical were combined. The mean and standard deviation of the new combined group was calculated by weighting for the sample size of the original groups. The Q-statistic was used to assess the heterogeneity of the SMD across studies (the significance level was set at p < 0.10) and to select the model, random vs. fixed, to be used. Inconsistency across studies was evaluated using the I2 statistic: I2 < 25%, no heterogeneity; I2 between 25 and 50%, moderate heterogeneity; I2 between 50 and 75%, large heterogeneity; and I2 > 75%, extreme heterogeneity [23, 24]. Sensitivity analyses were conducted to evaluate the influence of individual studies on the overall effect size using the leave-one-out method [25]. The possible presence of publication bias was assessed using the Begg’s adjusted rank correlation test and the Egger’s regression asymmetry test at the p < 0.05 level of significance [26, 27]. The Duval and Tweedie “trim-and-fill” procedure was also used to further test and correct for the possible presence of publication bias. This method recalculates a pooled SMD by incorporating the hypothetical missing studies as though they existed, to augment the observed data and the symmetry of the funnel plot [28]. To explore possible contributors to the between-study variance, we further investigated in univariate meta-regression analysis the associations, expressed as t values, between the SMD and the following parameters, expressed as summary statistics in means or medians: age, proportion of males, study endpoint, inflammatory markers (C-reactive protein, neutrophils, lymphocytes), liver function (aspartate aminotransferase, alanine aminotransferase, albumin), renal function (creatinine), myocardial damage (creatine kinase-MB), multi-tissue damage (lactate dehydrogenase), proportion of patients with diabetes and proportion of patients with hypertension. Sub-group analysis was conducted to investigate possible differences in SMD and heterogeneity according to specific endpoints, i.e., disease severity vs. survival status. Statistical analyses were performed using Stata 14 (STATA Corp., College Station, TX, USA). We fully complied with the PRISMA statement regarding the reporting of systematic reviews and meta-analyses [29].
Results
Study selection
We initially identified 65 studies. Of them, 51 were excluded after the first screening because they were either duplicates (same article identified in different databases) or irrelevant (not fulfilling the inclusion criteria). After a full-text revision of the remaining 14 articles, one was excluded because of missing information, leaving 13 studies for further analysis (Fig. 1) [30–42]. The characteristics of these studies, all conducted in China, are described in Tables 1, 2. A total of 2510 COVID-19 patients were assessed, 1972 (51% males, mean age 51 years) with low severity or survivor status and 538 (58% males, mean age 59 years) with high severity or non-survivor status. Eleven studies were retrospective [30–32, 34–37, 39–42], whilst the remaining two were prospective [33, 38]. Endpoints included disease severity based on current clinical guidelines (8 studies) [31, 33–35, 37, 39, 40, 42], disease progression (one study) [38] and occurrence of acute respiratory distress syndrome (ARDS) (one study) [36], and survival status (4 studies) [30, 32, 36, 41]. Only two studies reported the presence of AKI [32, 39]. All studies reported cystatin C concentrations measured on admission, except one study that reported mean values throughout the hospitalization [34].
Fig. 1.
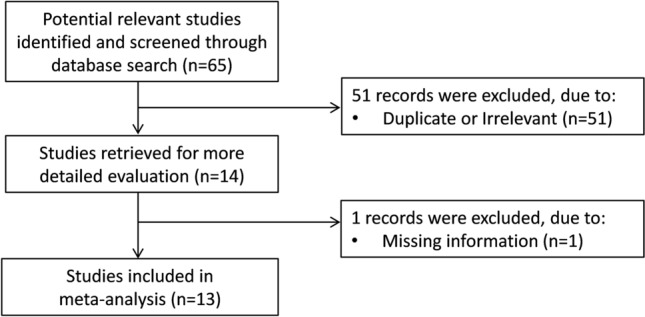
Flow chart of study selection
Table 1.
Study characteristics according to disease severity or survival status
| First Author [Ref] | Study design | Endpoint | Mild disease or survivor | Severe disease or non-survivor | ||||||
|---|---|---|---|---|---|---|---|---|---|---|
| n | Age (Years) | Gender (M/F) | Cystatin C mg/L (Mean ± SD) | n | Age (Years) | Gender (M/F) | Cystatin C mg/L (Mean ± SD) | |||
| Cao J [30] | R | Survival | 102 | 53 | 57/45 | 0.98 ± 0.23 | 17 | 72 | 13/4 | 1.66 ± 0.97 |
| Deng M [31] | R | Severity | 53 | 35 | 24/29 | 0.89 ± 0.35 | 12 | 33 | 12/0 | 1.10 ± 0.24 |
| Li Y [32] | R | Survival | 64 | 54 | 30/34 | 0.80 ± 0.15 | 37 | 72 | 23/14 | 1.07 ± 0.30 |
| Tang Y [33] | P | Severity | 60 | 64 | 34/26 | 0.93 ± 0.04 | 60 | 65 | 20/40 | 1.30 ± 0.13 |
| Wang C [34] | R | Severity | 35 | 38 | 17/18 | 0.81 ± 0.26 | 10 | 43 | 6/4 | 2.33 ± 2.50 |
| Wang J [35] | R | Severity | 509 | 46 | 265/244 | 0.95 ± 0.22 | 53 | 59 | 25/28 | 1.06 ± 0.41 |
| Wu C (a) [36] | R | ARDS | 117 | 48 | 68/49 | 0.83 ± 0.16 | 84 | 59 | 60/24 | 1.00 ± 0.30 |
| Wu C (b) [36] | R | Survival | 40 | 50 | 31/9 | 0.92 ± 0.26 | 44 | 69 | 29/15 | 1.11 ± 0.43 |
| Xiang HX [37] | R | Severity | 125 | NR | NR | 0.81 ± 0.16 | 29 | NR | NR | 0.84 ± 0.16 |
| Yang Z [38] | P | Progression | 202 | 48 | 101/101 | 0.80 ± 0.01 | 71 | 54 | 33/37 | 1.01 ± 0.04 |
| Yao Q [39] | R | Severity | 96 | 51 | 36/60 | 1.44 ± 0.39 | 12 | 65 | 7/5 | 2.55 ± 2.63 |
| Zhang Q [40] | R | Severity | 47 | 61 | 18/29 | 0.93 ± 0.27 | 27 | 72 | 18/9 | 1.17 ± 0.30 |
| Zhang XB [41] | R | Survival | 410 | 53 | 219/191 | 1.05 ± 0.26 | 22 | 66 | 11/11 | 1.55 ± 0.91 |
| Zhao C [42] | R | Severity | 112 | 64 | 45/67 | 1.07 ± 0.24 | 60 | 71 | 37/23 | 1.35 ± 0.56 |
ARDS acute respiratory distress syndrome; NOS Newcastle–Ottawa quality assessment scale for case–control studies; NR not reported; P prospective; R retrospective
Table 2.
Newcastle–Ottawa Scale assessment of individual studies
| Selection | Comparability | Outcome | Total score | |||||||
|---|---|---|---|---|---|---|---|---|---|---|
| First Author [Ref] | Representativeness of exposed cohort | Selection of non-exposed cohort | Ascertainment of exposure | Demonstration that outcome of interest was not present at start of the study | Adjust for the most important risk factors | Adjust for other risk factors | Assessment of outcome | Follow-up length | Loss to follow-up rate | |
| Cao J [30] | 1 | 1 | 1 | 1 | 0 | 0 | 0 | 1 | 1 | 6 |
| Deng M [31] | 1 | 1 | 1 | 1 | 1 | 1 | 1 | 0 | 0 | 7 |
| Li Y [32] | 1 | 1 | 1 | 1 | 1 | 0 | 0 | 1 | 1 | 7 |
| Tang Y [33] | 1 | 1 | 1 | 1 | 1 | 0 | 0 | 1 | 1 | 7 |
| Wang C [34] | 1 | 1 | 1 | 1 | 0 | 0 | 0 | 1 | 1 | 6 |
| Wang J [35] | 1 | 1 | 1 | 1 | 1 | 0 | 0 | 1 | 1 | 7 |
| Wu C [36] | 1 | 1 | 1 | 1 | 0 | 0 | 0 | 1 | 1 | 6 |
| Xiang HX [37] | 1 | 1 | 1 | 1 | 1 | 0 | 0 | 1 | 1 | 7 |
| Yang Z [38] | 1 | 1 | 1 | 1 | 1 | 0 | 0 | 1 | 1 | 7 |
| Yao Q [39] | 1 | 1 | 1 | 1 | 1 | 0 | 0 | 1 | 1 | 7 |
| Zhang Q [40] | 1 | 1 | 1 | 1 | 1 | 0 | 0 | 1 | 1 | 7 |
| Zhang XB [41] | 1 | 1 | 1 | 1 | 1 | 0 | 0 | 1 | 1 | 7 |
| Zhao C [42] | 1 | 1 | 1 | 1 | 1 | 0 | 0 | 1 | 1 | 7 |
Meta-analysis
The overall SMD in cystatin C concentrations between COVID-19 patients with low vs. high severity or survivor vs. non-survivor status is reported in Fig. 2. In 12 studies, patients with high severity or non-survivor status had higher cystatin C concentrations when compared to those with low severity or survivor status (mean difference range, 0.19–9.51) [31–37]. The pooled results confirmed that cystatin C concentrations were higher in patients with high severity or non-survivor status (SMD = 1.71, 95% CI 0.95–2.46, p < 0.001) (Fig. 2). Extreme heterogeneity between studies was observed (I2 = 97.5%, p < 0.001).
Fig. 2.

Forest plot of selected studies
Sensitivity analysis, performed by sequentially removing individual studies and re-assessing the pooled estimates, showed that the magnitude and direction of the effect size was not substantially modified (effect size range, between 1.12 and 1.83) (Fig. 3). However, the funnel plot showed a distortive effect of the two prospective studies (Fig. 4) [33, 38]. Removing these studies attenuated both the effect size (SMD = 0.89, 95% CI, 0.64–1.14, p < 0.001) and the magnitude of the heterogeneity (I2 = 74.7%, p < 0.001).
Fig. 3.

Sensitivity analysis of the association between cystatin C and COVID-19 disease. The influence of individual studies on the overall standardized mean difference (SMD) is shown. The middle vertical axis indicates the overall SMD, and the two vertical axes indicate the 95% confidence intervals (CIs). The hollow circles represent the pooled SMD when the remaining study is omitted from the meta-analysis. The two ends of each broken line represent the 95% CI
Fig. 4.
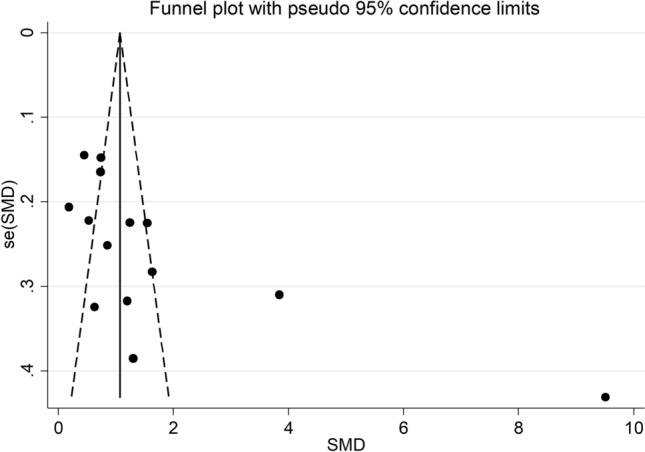
Funnel plot of studies investigating low vs. high severity or survivor vs. non-survivor status
Analysis of the 11 remaining studies did not show publication bias (Begg’s test, p = 0.15; Egger’s test, p = 0.10). The trim-and-fill method identified four potential missing studies to add to the left of the funnel plot to ensure symmetry (Fig. 5). This resulted in a reduced effect size (SMD = 0.64, 95% CI 0.36–0.92, p < 0.001).
Fig. 5.
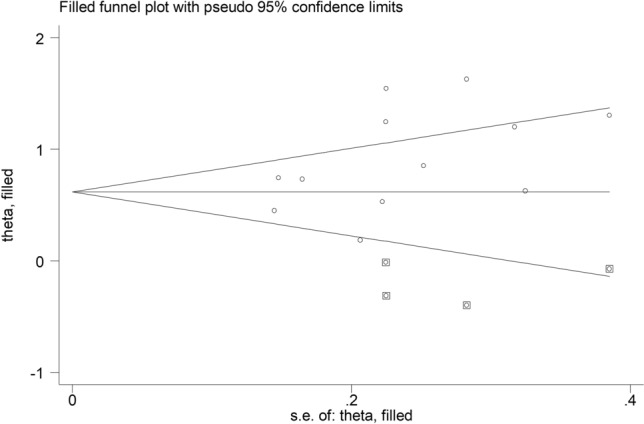
Funnel plot of studies investigating low vs. high severity or survivor vs. non-survivor status after trimming and filling. Dummy studies and genuine studies are represented by enclosed circles and free circles, respectively
Meta-regression
There were no associations between the SMD and age (t = 0.76, p = 0.47), proportion of males (t = 0.26, p = 0.80), C-reactive protein (t = − 0.76, p = 0.47), neutrophils (t = 1.65, p = 0.15), lymphocytes (t = − 0.38, p = 0.72), aspartate aminotransferase (t = 0.25, p = 0.81), alanine aminotransferase (t = − 0.26, p = 0.80), albumin (t = − 1.69, p = 0.14), creatinine (t = 0.57, p = 0.59), creatine kinase-MB (t = 0.41, p = 0.70), lactate dehydrogenase (t = 1.37, p = 0.22), proportion of patients with diabetes (t = 1.08, p = 0.31), or proportion of patients with hypertension (t = 1.43, p = 0.19).
In addition, sub-group analysis according to the specific endpoint evaluated, i.e., disease severity or survival status, did not show any differences (t = 2.10, p = 0.06) between the effect size in studies evaluating disease severity (SMD = 0.69, 95% CI 0.47–0.90, p < 0.001) and those assessing survival (SMD = 1.23, 95% CI 0.73–1.72, p < 0.001) (Fig. 6), with a relatively lower between-study heterogeneity in the former (I2 = 50.3% vs. I2 = 78.3%).
Fig. 6.

Forest plot of studies examining cystatin C serum concentrations in patients with COVID-19 according to disease severity or survival status
Discussion
The results of this systematic review and meta-analysis support a potential clinical role of cystatin C in the evaluation of patients with COVID-19. Specifically, serum cystatin C concentrations were associated with COVID-19 severity and mortality. The magnitude of the observed SMD value, 1.71, indicates the presence of a large effect size [43]. Although the between-group heterogeneity was extreme the sequential removal of individual studies did not substantially affect the overall SMD value. While the funnel plot identified a distortive effect of two studies, their removal attenuated the effect size, but not the significance of the between-group difference, and the magnitude of the heterogeneity. Furthermore, no publication bias was observed.
The cysteine protease inhibitor cystatin C has been studied for a relatively long time as a marker of renal function, specifically glomerular filtration rate. In contrast with the traditional biomarker creatinine, cystatin C is less influenced by differences in muscle mass and other factors such as age and changes in diet [17, 44, 45]. In support of these characteristics, cystatin C has been shown to have superior sensitivity to changes in borderline renal function, and to rise earlier than creatinine in different patient groups, e.g., transplant, surgical, cardiovascular, and diabetic [18, 46, 47]. While higher serum concentrations of cystatin C are likely to reflect the presence of kidney dysfunction, e.g., AKI, in patients with COVID-19, they might also be a marker of the excessive systemic inflammatory and pro-oxidant state that characterizes this group [3]. An increasing number of studies have provided convincing evidence that cystatin C plays an important pathophysiological role in the immunomodulatory responses observed during inflammatory states and infections [19]. Furthermore, its production can be modulated by several cytokines [19]. Consequently, fluctuations in serum cystatin C concentrations can be associated not only with changes in glomerular filtration rate but also with alterations in its production and/or consumption [19]. In turn, cystatin C can modulate the release of a number of cytokines, e.g., tumour necrosis factor-α, interleukin-12, and interleukin-10, as well as nitric oxide (NO) [19]. In particular, cystatin C activates the inducible isoform of NO synthase (iNOS), which is primarily responsible for the excessive NO production observed in local and systemic proinflammatory states [48]. This leads to the generation of highly reactive NO derivatives, nitrosative stress and irreversible modifications of several intracellular components, with consequent cell apoptosis and organ dysfunction. These phenomena play an important role in the pathophysiology of the cytokine storm and severe COVID-19, and the associated multi-organ compromise observed in these patients [3, 49]. There is also evidence that cystatin C can exert antiviral effects. Studies have shown that cystatin C can inhibit the replication of human coronaviruses other than SARS-CoV-2 in human lung cells, poliovirus, adenovirus, and herpes simplex virus [50–53]. Taken together, these data support the proposition that elevations in serum cystatin C concentrations in severe COVID-19 may reflect the presence of one or more coexisting processes, including reduced renal function, excessive release of pro-inflammatory cytokines, anti-viral effects, iNOS-mediated stimulation of NO synthesis, and cytokine storm. Notably, our meta-regression did not show any significant association between the SMD of cystatin C concentrations and markers of inflammation and renal function. This suggests that the information provided by cystatin C is complementary to that of conventional markers of renal function and inflammation, rather than redundant.
The extreme between-study heterogeneity observed in our meta-analysis represents a significant limitation that curtails the generalizability of the results. However, the trend and magnitude of the reported differences in cystatin C were maintained, in the presence of reduced heterogeneity (I2 = 50.3%, p = 0.05), in a sub-group of eight studies that had disease severity as endpoint. It is possible that other, unreported factors might have contributed to this residual heterogeneity. One such factor is the inter-laboratory difference in cystatin C assay measurement, which can involve nephelometric, turbidimetric, or spectrophotometric immunoassays [54–56]. At the same time, there was no evidence of publication bias and the overall effect size was not affected in sensitivity analysis. Another limitation is that no selected study, barring one [34], performed a serial measurement of complement component concentrations during hospitalization. This might provide additional information regarding possible clinical deterioration. Further studies are required to determine whether serial measurements of cystatin C provide additional prognostic information to that of single measurements on admission.
In conclusion, our systematic review and meta-analysis with meta-regression has shown that higher serum concentrations of cystatin C, indicating one or more processes including deterioration of renal function, excess inflammation, anti-viral activity, and cytokine storm, are associated with severe disease and increased mortality in hospitalized patients with COVID-19. Additional studies are required to determine whether single or serial measurement of this biomarker, with or without other clinical, demographic, and biochemical variables, can further enhance early risk stratification and clinical decisions in this patient group.
Author contributions
Initial idea: AZ; Data analysis: AZ; Data interpretation: AZ, AAM; First draft: AA Mangoni; Subsequent drafts and final version: AZ, AAM.
Funding
This study was supported by a Visiting Professorship awarded to Arduino A Mangoni by the University of Sassari.
Data availability
The data that support the findings of this systematic review and meta-analysis with meta-regression are available from Angelo Zinellu upon reasonable request.
Code availability
Not applicable.
Declarations
Conflict of interest
The authors declare no financial or non-financial conflicts of interest for this work.
Ethical approval
No ethics approval was required as this study was a systematic review and meta-analysis of published work.
Footnotes
Publisher's Note
Springer Nature remains neutral with regard to jurisdictional claims in published maps and institutional affiliations.
References
- 1.Huang C, Soleimani J, Herasevich S, Pinevich Y, Pennington KM, Dong Y, Pickering BW, Barwise AK. Clinical characteristics, treatment, and outcomes of critically Ill patients with COVID-19: a scoping review. Mayo Clin Proc. 2021;96:183–202. doi: 10.1016/j.mayocp.2020.10.022. [DOI] [PMC free article] [PubMed] [Google Scholar]
- 2.Pijls BG, Jolani S, Atherley A, Derckx RT, Dijkstra JIR, Franssen GHL, Hendriks S, Richters A, Venemans-Jellema A, Zalpuri S, Zeegers MP. Demographic risk factors for COVID-19 infection, severity, ICU admission and death: a meta-analysis of 59 studies. BMJ Open. 2021;11:e044640. doi: 10.1136/bmjopen-2020-044640. [DOI] [PMC free article] [PubMed] [Google Scholar]
- 3.Fajgenbaum DC, June CH. Cytokine storm. N Engl J Med. 2020;383:2255–2273. doi: 10.1056/NEJMra2026131. [DOI] [PMC free article] [PubMed] [Google Scholar]
- 4.Paliogiannis P, Zinellu A, Scano V, Mulas G, De Riu G, Pascale RM, Arru LB, Carru C, Pirina P, Mangoni AA, Fois AG. Laboratory test alterations in patients with COVID-19 and non COVID-19 interstitial pneumonia: a preliminary report. J Infect Dev Ctries. 2020;14:685–690. doi: 10.3855/jidc.12879. [DOI] [PubMed] [Google Scholar]
- 5.Gao YD, Ding M, Dong X, Zhang JJ, Kursat Azkur A, Azkur D, Gan H, Sun YL, Fu W, Li W, Liang HL, Cao YY, Yan Q, Cao C, Gao HY, Bruggen MC, van de Veen W, Sokolowska M, Akdis M, Akdis CA. Risk factors for severe and critically ill COVID-19 patients: a review. Allergy. 2021;76:428–455. doi: 10.1111/all.14657. [DOI] [PubMed] [Google Scholar]
- 6.Zinellu A, Paliogiannis P, Carru C, Mangoni AA. Serum amyloid A concentrations, COVID-19 severity and mortality: an updated systematic review and meta-analysis. Int J Infect Dis. 2021 doi: 10.1016/j.ijid.2021.03.025. [DOI] [PMC free article] [PubMed] [Google Scholar]
- 7.Zinellu A, Mangoni AA. Serum prealbumin concentrations, COVID-19 severity, and mortality: a systematic review and meta-analysis. Front Med (Lausanne) 2021;8:638529. doi: 10.3389/fmed.2021.638529. [DOI] [PMC free article] [PubMed] [Google Scholar]
- 8.Thakur V, Ratho RK, Kumar P, Bhatia SK, Bora I, Mohi GK, Saxena SK, Devi M, Yadav D, Mehariya S. Multi-organ involvement in COVID-19: beyond pulmonary manifestations. J Clin Med. 2021 doi: 10.3390/jcm10030446. [DOI] [PMC free article] [PubMed] [Google Scholar]
- 9.Farouk SS, Fiaccadori E, Cravedi P, Campbell KN. COVID-19 and the kidney: what we think we know so far and what we don't. J Nephrol. 2020;33:1213–1218. doi: 10.1007/s40620-020-00789-y. [DOI] [PMC free article] [PubMed] [Google Scholar]
- 10.Nadim MK, Forni LG, Mehta RL, Connor MJ, Jr, Liu KD, Ostermann M, Rimmele T, Zarbock A, Bell S, Bihorac A, Cantaluppi V, Hoste E, Husain-Syed F, Germain MJ, Goldstein SL, Gupta S, Joannidis M, Kashani K, Koyner JL, Legrand M, Lumlertgul N, Mohan S, Pannu N, Peng Z, Perez-Fernandez XL, Pickkers P, Prowle J, Reis T, Srisawat N, Tolwani A, Vijayan A, Villa G, Yang L, Ronco C, Kellum JA. COVID-19-associated acute kidney injury: consensus report of the 25th acute disease quality initiative (ADQI) workgroup. Nat Rev Nephrol. 2020;16:747–764. doi: 10.1038/s41581-020-00356-5. [DOI] [PMC free article] [PubMed] [Google Scholar]
- 11.Paliogiannis P, Mangoni AA, Dettori P, Nasrallah GK, Pintus G, Zinellu A. D-Dimer concentrations and COVID-19 severity: a systematic review and meta-analysis. Front Public Health. 2020;8:432. doi: 10.3389/fpubh.2020.00432. [DOI] [PMC free article] [PubMed] [Google Scholar]
- 12.Giordo R, Paliogiannis P, Mangoni AA, Pintus G. SARS-CoV-2 and endothelial cell interaction in COVID-19: molecular perspectives. Vasc Biol. 2021;3:R15–R23. doi: 10.1530/VB-20-0017. [DOI] [PMC free article] [PubMed] [Google Scholar]
- 13.Su H, Yang M, Wan C, Yi LX, Tang F, Zhu HY, Yi F, Yang HC, Fogo AB, Nie X, Zhang C. Renal histopathological analysis of 26 postmortem findings of patients with COVID-19 in China. Kidney Int. 2020;98:219–227. doi: 10.1016/j.kint.2020.04.003. [DOI] [PMC free article] [PubMed] [Google Scholar]
- 14.Puelles VG, Lutgehetmann M, Lindenmeyer MT, Sperhake JP, Wong MN, Allweiss L, Chilla S, Heinemann A, Wanner N, Liu S, Braun F, Lu S, Pfefferle S, Schroder AS, Edler C, Gross O, Glatzel M, Wichmann D, Wiech T, Kluge S, Pueschel K, Aepfelbacher M, Huber TB. Multiorgan and renal tropism of SARS-CoV-2. N Engl J Med. 2020;383:590–592. doi: 10.1056/NEJMc2011400. [DOI] [PMC free article] [PubMed] [Google Scholar]
- 15.Rossi GM, Delsante M, Pilato FP, Gnetti L, Gabrielli L, Rossini G, Re MC, Cenacchi G, Affanni P, Colucci ME, Picetti E, Rossi S, Parenti E, Maccari C, Greco P, Di Mario F, Maggiore U, Regolisti G, Fiaccadori E. Kidney Biopsy findings in a critically Ill COVID-19 patient with dialysis-dependent acute kidney injury: a case against "SARS-CoV-2 nephropathy". Kidney Int Rep. 2020;5:1100–1105. doi: 10.1016/j.ekir.2020.05.005. [DOI] [PMC free article] [PubMed] [Google Scholar]
- 16.Kar S, Paglialunga S, Islam R. Cystatin C is a more reliable biomarker for determining eGFR to support drug development studies. J Clin Pharmacol. 2018;58:1239–1247. doi: 10.1002/jcph.1132. [DOI] [PubMed] [Google Scholar]
- 17.Filler G, Bokenkamp A, Hofmann W, Le Bricon T, Martinez-Bru C, Grubb A. Cystatin C as a marker of GFR–history, indications, and future research. Clin Biochem. 2005;38:1–8. doi: 10.1016/j.clinbiochem.2004.09.025. [DOI] [PubMed] [Google Scholar]
- 18.Herget-Rosenthal S, Bokenkamp A, Hofmann W. How to estimate GFR-serum creatinine, serum cystatin C or equations? Clin Biochem. 2007;40:153–161. doi: 10.1016/j.clinbiochem.2006.10.014. [DOI] [PubMed] [Google Scholar]
- 19.Zi M, Xu Y. Involvement of cystatin C in immunity and apoptosis. Immunol Lett. 2018;196:80–90. doi: 10.1016/j.imlet.2018.01.006. [DOI] [PMC free article] [PubMed] [Google Scholar]
- 20.Werle B, Sauckel K, Nathanson CM, Bjarnadottir M, Spiess E, Ebert W, Abrahamson M. Cystatins C, E/M and F in human pleural fluids of patients with neoplastic and inflammatory lung disorders. Biol Chem. 2003;384:281–287. doi: 10.1515/BC.2003.031. [DOI] [PubMed] [Google Scholar]
- 21.Wells GA, Shea B, O’Connell D, Peterson J, Welch V, Losos M, Tugwell P (2013) The Newcastle-Ottawa Scale (NOS) for assessing the quality of nonrandomised studies in meta-analyses. http://www.ohri.ca/programs/clinical_epidemiology/oxford.asp.
- 22.Wan X, Wang W, Liu J, Tong T. Estimating the sample mean and standard deviation from the sample size, median, range and/or interquartile range. BMC Med Res Methodol. 2014;14:135. doi: 10.1186/1471-2288-14-135. [DOI] [PMC free article] [PubMed] [Google Scholar]
- 23.Bowden J, Tierney JF, Copas AJ, Burdett S. Quantifying, displaying and accounting for heterogeneity in the meta-analysis of RCTs using standard and generalised Q statistics. BMC Med Res Methodol. 2011;11:41. doi: 10.1186/1471-2288-11-41. [DOI] [PMC free article] [PubMed] [Google Scholar]
- 24.Higgins JP, Thompson SG. Quantifying heterogeneity in a meta-analysis. Stat Med. 2002;21:1539–1558. doi: 10.1002/sim.1186. [DOI] [PubMed] [Google Scholar]
- 25.Tobias A. Assessing the influence of a single study in the meta-analysis estimate. Stata Tech Bulletin. 1999;47:15–17. [Google Scholar]
- 26.Begg CB, Mazumdar M. Operating characteristics of a rank correlation test for publication bias. Biometrics. 1994;50:1088–1101. doi: 10.2307/2533446. [DOI] [PubMed] [Google Scholar]
- 27.Sterne JA, Egger M. Funnel plots for detecting bias in meta-analysis: guidelines on choice of axis. J Clin Epidemiol. 2001;54:1046–1055. doi: 10.1016/s0895-4356(01)00377-8. [DOI] [PubMed] [Google Scholar]
- 28.Duval S, Tweedie R. Trim and fill: a simple funnel-plot-based method of testing and adjusting for publication bias in meta-analysis. Biometrics. 2000;56:455–463. doi: 10.1111/j.0006-341x.2000.00455.x. [DOI] [PubMed] [Google Scholar]
- 29.Liberati A, Altman DG, Tetzlaff J, Mulrow C, Gotzsche PC, Ioannidis JP, Clarke M, Devereaux PJ, Kleijnen J, Moher D. The PRISMA statement for reporting systematic reviews and meta-analyses of studies that evaluate healthcare interventions: explanation and elaboration. BMJ. 2009;339:b2700. doi: 10.1136/bmj.b2700. [DOI] [PMC free article] [PubMed] [Google Scholar]
- 30.Cao J, Tu WJ, Cheng W, Yu L, Liu YK, Hu X, Liu Q. Clinical features and short-term outcomes of 102 patients with coronavirus disease 2019 in Wuhan, China. Clin Infect Dis. 2020;71:748–755. doi: 10.1093/cid/ciaa243. [DOI] [PMC free article] [PubMed] [Google Scholar]
- 31.Deng M, Qi Y, Deng L, Wang H, Xu Y, Li Z, Meng Z, Tang J, Dai Z. Obesity as a potential predictor of disease severity in young COVID-19 patients: a retrospective study. Obesity (Silver Spring) 2020;28:1815–1825. doi: 10.1002/oby.22943. [DOI] [PMC free article] [PubMed] [Google Scholar]
- 32.Li Y, Yang S, Peng D, Zhu HM, Li BY, Yang X, Sun XL, Zhang M. Predictive value of serum cystatin C for risk of mortality in severe and critically ill patients with COVID-19. World J Clin Cases. 2020;8:4726–4734. doi: 10.12998/wjcc.v8.i20.4726. [DOI] [PMC free article] [PubMed] [Google Scholar]
- 33.Tang Y, Li Y, Sun J, Pan H, Yao F, Jiao X. Selection of an optimal combination panel to better triage COVID-19 hospitalized patients. J Inflamm Res. 2020;13:773–787. doi: 10.2147/JIR.S273193. [DOI] [PMC free article] [PubMed] [Google Scholar]
- 34.Wang C, Deng R, Gou L, Fu Z, Zhang X, Shao F, Wang G, Fu W, Xiao J, Ding X, Li T, Xiao X, Li C. Preliminary study to identify severe from moderate cases of COVID-19 using combined hematology parameters. Ann Transl Med. 2020;8:593. doi: 10.21037/atm-20-3391. [DOI] [PMC free article] [PubMed] [Google Scholar]
- 35.Wang J, Guo S, Zhang Y, Gao K, Zuo J, Tan N, Du K, Ma Y, Hou Y, Li Q, Xu H, Huang J, Huang Q, Na H, Wang J, Wang X, Xiao Y, Zhu J, Chen H, Liu Z, Wang M, Zhang L, Wang W. Clinical features and risk factors for severe inpatients with COVID-19: a retrospective study in China. PLoS ONE. 2020;15:e0244125. doi: 10.1371/journal.pone.0244125. [DOI] [PMC free article] [PubMed] [Google Scholar]
- 36.Wu C, Chen X, Cai Y, Xia J, Zhou X, Xu S, Huang H, Zhang L, Zhou X, Du C, Zhang Y, Song J, Wang S, Chao Y, Yang Z, Xu J, Zhou X, Chen D, Xiong W, Xu L, Zhou F, Jiang J, Bai C, Zheng J, Song Y. Risk factors associated with acute respiratory distress syndrome and death in patients with coronavirus disease 2019 pneumonia in Wuhan, China. JAMA Intern Med. 2020;180:934–943. doi: 10.1001/jamainternmed.2020.0994. [DOI] [PMC free article] [PubMed] [Google Scholar]
- 37.Xiang HX, Fei J, Xiang Y, Xu Z, Zheng L, Li XY, Fu L, Zhao H. Renal dysfunction and prognosis of COVID-19 patients: a hospital-based retrospective cohort study. BMC Infect Dis. 2021;21:158. doi: 10.1186/s12879-021-05861-x. [DOI] [PMC free article] [PubMed] [Google Scholar]
- 38.Yang Z, Shi J, He Z, Lu Y, Xu Q, Ye C, Chen S, Tang B, Yin K, Lu Y, Chen X. Predictors for imaging progression on chest CT from coronavirus disease 2019 (COVID-19) patients. Aging (Albany NY) 2020;12:6037–6048. doi: 10.18632/aging.102999. [DOI] [PMC free article] [PubMed] [Google Scholar]
- 39.Yao Q, Wang P, Wang X, Qie G, Meng M, Tong X, Bai X, Ding M, Liu W, Liu K, Chu Y. A retrospective study of risk factors for severe acute respiratory syndrome coronavirus 2 infections in hospitalized adult patients. Pol Arch Intern Med. 2020;130:390–399. doi: 10.20452/pamw.15312. [DOI] [PubMed] [Google Scholar]
- 40.Zhang Q, Wei Y, Chen M, Wan Q, Chen X. Clinical analysis of risk factors for severe COVID-19 patients with type 2 diabetes. J Diabetes Complications. 2020;34:107666. doi: 10.1016/j.jdiacomp.2020.107666. [DOI] [PMC free article] [PubMed] [Google Scholar]
- 41.Zhang XB, Hu L, Ming Q, Wei XJ, Zhang ZY, Chen LD, Wang MH, Yao WZ, Huang QF, Ye ZQ, Cai YQ, Zeng HQ. Risk factors for mortality of coronavirus disease-2019 (COVID-19) patients in two centers of Hubei province, China: a retrospective analysis. PLoS ONE. 2021;16:e0246030. doi: 10.1371/journal.pone.0246030. [DOI] [PMC free article] [PubMed] [Google Scholar]
- 42.Zhao C, Bai Y, Wang C, Zhong Y, Lu N, Tian L, Cai F, Jin R. Risk factors related to the severity of COVID-19 in Wuhan. Int J Med Sci. 2021;18:120–127. doi: 10.7150/ijms.47193. [DOI] [PMC free article] [PubMed] [Google Scholar]
- 43.Cohen J. Statistical power analysis for the behavioral sciences. 2. Erlbaum; 1988. [Google Scholar]
- 44.Tangri N, Stevens LA, Schmid CH, Zhang YL, Beck GJ, Greene T, Coresh J, Levey AS. Changes in dietary protein intake has no effect on serum cystatin C levels independent of the glomerular filtration rate. Kidney Int. 2011;79:471–477. doi: 10.1038/ki.2010.431. [DOI] [PMC free article] [PubMed] [Google Scholar]
- 45.Baxmann AC, Ahmed MS, Marques NC, Menon VB, Pereira AB, Kirsztajn GM, Heilberg IP. Influence of muscle mass and physical activity on serum and urinary creatinine and serum cystatin C. Clin J Am Soc Nephrol. 2008;3:348–354. doi: 10.2215/CJN.02870707. [DOI] [PMC free article] [PubMed] [Google Scholar]
- 46.Mazur MJ, Heilman RL. Early detection of acute renal failure by serum cystatin C: a new opportunity for a hepatologist. Liver Transpl. 2005;11:705–707. doi: 10.1002/lt.20422. [DOI] [PubMed] [Google Scholar]
- 47.Ishibashi Y, Yamauchi M, Musha H, Mikami T, Kawasaki K, Miyake F. Impact of contrast-induced nephropathy and cardiovascular events by serum cystatin C in renal insufficiency patients undergoing cardiac catheterization. Angiology. 2010;61:724–730. doi: 10.1177/0003319710379108. [DOI] [PubMed] [Google Scholar]
- 48.Anavi S, Tirosh O. iNOS as a metabolic enzyme under stress conditions. Free Radic Biol Med. 2020;146:16–35. doi: 10.1016/j.freeradbiomed.2019.10.411. [DOI] [PubMed] [Google Scholar]
- 49.Karki R, Sharma BR, Tuladhar S, Williams EP, Zalduondo L, Samir P, Zheng M, Sundaram B, Banoth B, Malireddi RKS, Schreiner P, Neale G, Vogel P, Webby R, Jonsson CB, Kanneganti TD. Synergism of TNF-alpha and IFN-gamma triggers inflammatory cell death, tissue damage, and mortality in SARS-CoV-2 infection and cytokine shock syndromes. Cell. 2021;184(149–68):e17. doi: 10.1016/j.cell.2020.11.025. [DOI] [PMC free article] [PubMed] [Google Scholar]
- 50.Collins AR, Grubb A. Inhibitory effects of recombinant human cystatin C on human coronaviruses. Antimicrob Agents Chemother. 1991;35:2444–2446. doi: 10.1128/aac.35.11.2444. [DOI] [PMC free article] [PubMed] [Google Scholar]
- 51.Korant BD, Brzin J, Turk V. Cystatin, a protein inhibitor of cysteine proteases alters viral protein cleavages in infected human cells. Biochem Biophys Res Commun. 1985;127:1072–1076. doi: 10.1016/s0006-291x(85)80054-1. [DOI] [PubMed] [Google Scholar]
- 52.Ruzindana-Umunyana A, Weber JM. Interactions of human lacrimal and salivary cystatins with adenovirus endopeptidase. Antiviral Res. 2001;51:203–214. doi: 10.1016/s0166-3542(01)00154-1. [DOI] [PubMed] [Google Scholar]
- 53.Gu M, Haraszthy GG, Collins AR, Bergey EJ. Identification of salivary proteins inhibiting herpes simplex virus 1 replication. Oral Microbiol Immunol. 1995;10:54–59. doi: 10.1111/j.1399-302x.1995.tb00118.x. [DOI] [PubMed] [Google Scholar]
- 54.Delanaye P, Pieroni L, Abshoff C, Lutteri L, Chapelle JP, Krzesinski JM, Hainque B, Cavalier E. Analytical study of three cystatin C assays and their impact on cystatin C-based GFR-prediction equations. Clin Chim Acta. 2008;398:118–124. doi: 10.1016/j.cca.2008.09.001. [DOI] [PubMed] [Google Scholar]
- 55.Hossain MA, Emara M, El Moselhi H, Shoker A. Comparing measures of cystatin C in human sera by three methods. Am J Nephrol. 2009;29:381–391. doi: 10.1159/000168486. [DOI] [PubMed] [Google Scholar]
- 56.White CA, Rule AD, Collier CP, Akbari A, Lieske JC, Lepage N, Doucette S, Knoll GA. The impact of interlaboratory differences in cystatin C assay measurement on glomerular filtration rate estimation. Clin J Am Soc Nephrol. 2011;6:2150–2156. doi: 10.2215/CJN.00130111. [DOI] [PMC free article] [PubMed] [Google Scholar]
Associated Data
This section collects any data citations, data availability statements, or supplementary materials included in this article.
Data Availability Statement
The data that support the findings of this systematic review and meta-analysis with meta-regression are available from Angelo Zinellu upon reasonable request.
Not applicable.