

Abstract
Progressive accumulation of tau neurofibrillary tangles in the brain is a defining pathologic feature of Alzheimer’s disease (AD). Tau pathology exhibits a predictable spatiotemporal spreading pattern, but the underlying mechanisms of this spread are poorly understood. Although AD is conventionally considered a disease of the gray matter, it is also associated with pronounced and progressive deterioration of the white matter (WM). A link between abnormal tau and WM degeneration is suggested by findings from both animal and postmortem studies, but few studies demonstrated their interplay in vivo. Recent advances in diffusion magnetic resonance imaging and the availability of tau positron emission tomography (PET) have made it possible to evaluate the association of tau and WM degeneration (tau-WM) in vivo. In this study, we explored the spatial pattern of tau-WM associations across the whole brain to evaluate the hypothesis that tau deposition is associated with WM microstructural alterations not only in isolated tracts, but in continuous structural connections in a stereotypic pattern. Sixty-two participants, including 22 cognitively normal subjects, 22 individuals with subjective cognitive decline, and 18 with mild cognitive impairment were included in the study. WM characteristics were inferred by classic diffusion tensor imaging (DTI) and a complementary diffusion compartment model – neurite orientation dispersion and density imaging (NODDI) that provides a proxy for axonal density. A data-driven iterative searching (DDIS) approach, coupled with whole-brain graph theory analyses, was developed to continuously track tau-WM association patterns. Without applying prior knowledge of the tau spread, we observed a distinct spatial pattern that resembled the typical propagation of tau pathology in AD. Such association pattern was not observed between diffusion and amyloid-β PET signal. Tau-related WM degeneration is characterized by an increase in the mean diffusivity (with a dominant change in the radial direction) and a decrease in the intra-axonal volume fraction. These findings suggest that cortical tau deposition (as measured in tau PET) is associated with a lower axonal packing density and greater diffusion freedom. In conclusion, our in vivo findings using a data-driven method on cross-sectional data underline the important role of WM alterations in the AD pathological cascade with an association pattern similar to the postmortem Braak staging of AD. Future studies will focus on longitudinal analyses to provide in vivo evidence of tau pathology spreads along neuroanatomically connected brain areas.
Keywords: Tau PET, Diffusion MRI, WM degeneration, DTI, NODDI
1. Introduction
Progressive accumulations of amyloid-β and tau protein are hallmark pathologies of Alzheimer’s disease (AD) (Alzheimer et al., 1991; Goedert et al., 1991). While amyloid-β forms extracellular senile plaques in the brain gray matter (GM) (Haass and Selkoe, 2007), hyperphosphorylated tau protein forms intracellular neurofibrillary tangles (Bancher et al., 1989). Neurofibrillary tangles often co-occur with amyloid-β in the neocortex of the aging brain (Price and Morris 1999; Scholl et al., 2016). Nevertheless, because of differences in microscopic molecular pathways (Bancher et al., 1989; Haass and Selkoe 2007), the anatomic spread of amyloid-β and tau follow distinct temporal patterns across AD stages. Unlike amyloid-β, which is poorly correlated with clinical symptoms (Nelson et al., 2012), tau pathology is well-correlated with AD severity (Arriagada et al., 1992) and episodic memory decline (Mitchell et al., 2002), and has characteristic anatomic distributions that have been widely adopted for disease staging (Braak and Braak, 1991). Starting from the transentorhinal cortex (stages I and II), tau pathology extends to the adjacent limbic system in the medial and inferior temporal lobes and to the posterior cingulum cortex at stages III and IV (Braak and Braak 1991; Braak et al., 2006; Braak et al., 2011). At later Braak stages (i.e., V and VI), tau pathology spreads to the neocortex of the parietal lobes and frontal lobes (Braak and Braak 1991; Braak et al., 2006; Braak et al., 2011). Additional evidence for this clinicopathologic staging of AD was demonstrated in recent studies using in vivo tau positron emission tomography (PET) with [18F]Flortaucipir (Scholl et al., 2016; Schwarz et al., 2018).
The intracellular origination of tau protein and its distinct spread pattern suggest that white-matter (WM) deterioration plays a role in AD. One early pathoanatomic study reported changes in WM macro- and microstructures, including demyelination and axonal degeneration, in the brains of patients with AD (Brun and Englund, 1986). Postmortem studies of AD patients have also demonstrated that cortical tau pathology is associated with the WM Wallerian degeneration protease (i.e., calpain) (McAleese et al., 2017) and alterations in WM microstructural integrity detected by diffusion magnetic resonance imaging (dMRI) (Kantarci et al., 2017). A link between tau pathology and WM degeneration is also supported by a recent PET and genetic transcriptome study in which neurogenetic contributions to tau spreading were found to be ‘axon related’ (Sepulcre et al., 2018). Therefore, elucidating the associations between tau and WM degeneration in vivo will contribute to a better understanding of their interplay across the AD spectrum and their impact on clinical symptoms.
The development of tau PET tracers and advances in diffusion MRI enable assessment of the relationship between tau deposition in the GM and microstructural alterations in the WM in vivo. Recent neuroimaging studies reported detectable associations between tau and WM diffusion alterations in cognitively healthy older individuals, in atypical AD, as well as in individuals with pathologically-staged AD (Kantarci et al., 2017; Jacobs et al., 2018; Strain et al., 2018; Sintini et al., 2019). Particularly, in an antemortem MRI study, alterations in diffusion tensor imaging (DTI) were associated with postmortem Braak neurofibrillary tangle staging (Kantarci et al., 2017). This association pattern involved the crus of the fornix and ventral cingulum tracts. A similar association between DTI and tau deposition detected in vivo with tau PET was observed between the anterior temporal cortex and its WM projections in 59 cognitively healthy and 10 cognitively impaired participants (Strain et al., 2018). In a study of 256 cognitively healthy individuals (Jacobs et al., 2018), the spread of tau pathology from the medial temporal lobe to the posterior cingulate cortex of the brain via strategically located structural connections (i.e., hippocampal cingulum bundle) was revealed in vivo. Together, the initial evidence suggests an important association between tau and WM degeneration and encourages whole-brain data-driven analyses to validate the extent and scope of such an association pattern across the early AD disease spectrum.
Although both dMRI and tau PET provide whole brain information, previous studies utilizing both imaging modalities have focused on one or a few tracts that were preselected on the basis of prior knowledge. Few studies have taken advantage of the full potential of neuroimaging to investigate brain-wide patterns of associations between tau and WM. In the present study, we explored the overarching hypothesis that the association between tau deposition and WM microstructural alterations (tau-WM association) is present not only in isolated tracts, but in continuous structural connections. To this end, we developed a data-driven iterative searching (DDIS) approach to identify a pattern of associations between tau deposition in GM areas and WM integrity along the connecting tracts. We chose to include a cohort of participants consisting of cognitively normal, subjective cognitive decline, and mild cognitive impairment older adults that are in the early stage of the AD spectrum. Such a cohort likely contains a better gradient of tau deposition with slight, medium to severe tau deposition. Similar approaches were also applied to associations between amyloid-β and WM integrity. Metrics for the WM integrity and microstructure were derived from advanced multi-shell diffusion MRI techniques with classic DTI and a complementary diffusion compartment model – neurite orientation dispersion and density imaging (NODDI), that provides an image proxy for axonal density.
2. Materials and methods
2.1. Participants
Participants from the Indiana Alzheimer Disease Research Center (IADRC) who had tau PET imaging with [18F]Flortaucipir, amyloid PET imaging with either [18F]Florbetaben or [18F]Florbetapir and advanced diffusion MRI data were included in this study. The participants included cognitively normal individuals (CN), as well as individuals with subjective cognitive decline (SCD) and those with mild cognitive impairment (MCI). MCI subjects were identified based on a multidisciplinary clinical consensus panel review aligning with NIH-AA criteria (Albert et al., 2011). Briefly, MCI participants had significant self-reported or informant/clinician-reported complaints about their cognition, as well as a significant deficit (> 1.5 standard deviations below normal) in either memory or another cognitive domain (Albert et al., 2011). SCD participants were identified according to the following criteria: elevated levels of subjective memory concerns reflected by a score of 20 or more on the first 12 items of the 20-item Cognitive Change Index (CCI-20) (Rattanabannakit et al., 2016), with or without increased levels of informant-based concerns (Jessen et al., 2014) and without a measurable cognitive deficit. Older adults without significant memory concerns (12-item CCI total < 20) and without a measurable cognitive deficit were considered CN participants. Exclusion criteria for neuroimaging were significant cerebrovascular disease or malformations; a history of chemotherapy or radiation therapy; current major depression; a history of schizophrenia, bipolar disorder, developmental disability, Parkinson disease, brain surgery, brain infection, or significant head injury (loss of consciousness > 30 min); and/or excessive alcohol consumption. The final cohort included 62 participants: 22 CN, 22 SCD, and 18 MCI. All participants provided written informed consent according to procedures approved by the Institutional Committee for the Protection of Human Subjects at Indiana University School of Medicine.
2.2. PET
PET scans were performed using a Siemens Biograph mCT scanner. Emission data were recorded continuously (list mode) over the scan period at relative equilibrium (i.e., after a certain period of uptake time) and rebinned into 5-min frames. Standard PET image reconstruction (ordered-subset expectation maximization) was conducted using the scanner software platform (Siemens; Knoxville, TN, USA) with corrections for scatter and random coincidence events, attenuation (with acquired CT images), and radionuclide decay.
For tau PET, approximately 10mCi of [18F]Flortaucipir (18F-AV-1451) was administered intravenously and a 30 min scan was initiated after an uptake time of 75 min. The middle four 5-min frames (80–100 min) were spatially aligned to the subject’s T1-weighted anatomic image, motion-corrected, normalized to the Montreal Neurologic Institute (MNI) space before averaging to create a static image volume, and smoothed with an 8-mm full-width half maximum Gaussian kernel in Statistical Parametric Mapping 8 (SPM8). The smoothed images were intensity normalized to the cerebellar crus to create standardized uptake value ratio (SUVR) images. Median SUVR value was summarized in 84 cortical and subcortical regions-of-interest (ROI) generated by FreeSurfer v6.0 from each subject’s T1-weighted images (Salat et al., 2005) using the Desikan-Killiany atlas (Desikan et al., 2006). Tau positivity was defined as a tau SUVR > 1.23, denoted as “tau+” (Jack et al., 2017; Mishra et al., 2017), and the prevalence of tau+ was defined as the percentage of participants with an SUVR above the threshold in that ROI. Continuous variables for PET images (i.e., no thresholds or cutoffs) were used in the association analyses.
For amyloid PET scans, we used two tracers - [18F]Florbetapir (Amyvid, Eli Lilly and Co., Indianapolis, IN, USA) with a 50-min uptake or [18F]Florbetaben (Neuraceq, Piramal Ltd., Mumbai, India) with a 90-min uptake. Like tau PET, the data were pre-processed using SPM8 and intensity-normalized to the whole cerebellum to create SUVR images. Following the cutoffs values established by Landau et al. (2013), participants with SUVR for [18F]Florbetapir higher than 1.1 and participants with [18F]Florbetaben SUVR higher than 1.2 were considered amyloid-β positive. To combine the two PET tracers for the association with diffusion metrics, we converted the SUVR to centiloid unit. The whole cerebellum region of interest was taken from the Centiloid project (http://www.gaain.org/centiloid-project (Klunk et al., 2015)). Both [18F]Florbetapir and [18F]Florbetaben scans were processed with the Centiloid algorithm (a form of data normalization that permits grouping data from different amyloid tracers) at the voxel level (Klunk et al., 2015; Risacher et al., 2017). Similar to tau PET, the median [18F]Florbetapir and [18F]Florbetaben uptake values (centiloid unit) were summarized for each cortical and subcortical ROI.
2.3. MRI
MRI data were acquired on a single Siemens Prisma 3T scanner with a 64-channel RF receiver head coil. All participants underwent T1-weighted imaging and multi-shell diffusion MRI. T1-weighted anatomical imaging used a 3-dimensional magnetization rapid gradient echo (MPRAGE) sequence with imaging parameters matching the Alzheimer’s Disease Neuroimaging Initiative 2 protocols (http://adni.loni.usc.edu/methods/documents/mri-protocols/). The diffusion MRI protocol employed a single-shot spin-echo echo-planar imaging sequence with a hybrid diffusion imaging (HYDI)-encoding scheme that contained three zero diffusion-weighting (i.e., b-value=0 s/mm2) and five concentric diffusion-weighting shells (b-values = 250, 1000, 2000, 3250, and 5000 s/mm2) for a total of 142 diffusion-weighting gradient directions (Wu and Alexander, 2007; Wen et al., 2019). The field of view was 240 × 240 mm with an imaging matrix of 120 × 120 and 68 slices with a slice thickness of 2 mm, yielding 2-mm isotropic voxels. An additional b = 0 s/mm2 with reversed-phase encoding was acquired for geometric distortion correction. The T1-weighted images were used to generate ROIs for summarizing tau and amyloid deposits in the GM (described above in the PET section).
Diffusion MRI data were first pre-processed using previously described pipelines (Kodiweera et al., 2016; Wu et al., 2018; Wen et al., 2019) for noise reduction (Manjon et al., 2013), motion and distortion correction (FSL topup and eddy commands). The pre-processed diffusion data were then used to compute diffusion metrics of DTI and NODDI. The DTI metrics were computed on the first two shells (b-value = 250s/mm2 and 1000s/mm2), including fractional anisotropy (FA, the coherence of microstructure water diffusion), mean diffusivity (MD, the magnitude of overall water diffusion), and supplementary analyses of axial (Da, along the principal water diffusion direction (Kim et al., 2006)) and radial diffusivity (Dr, perpendicular to the principal water diffusion direction (Song et al., 2005)) (FSL dtifit command). All five shells were used in the NODDI analysis with the AMICO toolbox (https://github.com/daducci/AMICO (Daducci et al., 2015)). The NODDI approach provides complementary diffusion metrics that may be biologically more specific than DTI by modeling the water diffusion signal according to one of three different pools (Zhang et al., 2012): (i) free water diffusion (such as in cerebrospinal fluid); (ii) intracellular restricted diffusion inside dendrites and axons, and (iii) extracellular hindered diffusion. The resultant indices included in the analysis are the intracellular volume fraction (ICVF), a proxy of axonal density, and orientation dispersion (OD), a measure of the degree of fanning in axonal orientations (Kodiweera et al., 2016). Supplementary Table S1 summarizes the diffusion metric acronyms and their microstructure implications. The six diffusion maps were then used to extract tract-specific values after streamline tractography.
WM streamline tractography was performed using all 5-shell diffusion data with MRtrix3 guidelines (https://mrtrix.readthedocs.io/en/latest/quantitative_structural_connectivity/ismrm_hcp_tutorial.html (Tournier et al., 2012)). In brief, subject whole-brain streamlines were generated using the multi-shell, multi-tissue constrained spherical deconvolution and probabilistic tracking algorithm (maximum tract length = 250 mm, FA cutoff = 0.06). A structural connectivity matrix between 84 GM ROIs was generated, where each element indicates the number of streamlines connecting any pair of ROIs, or the strength of the connection between the two ROIs. Instead of performing the analysis on all connections, which would include noise connections, we restricted the analysis to a “backbone” connection structure where only strong connections that are common to all subjects were preserved. Fig. 1 illustrates the workflow for backbone generation. The subject-level connectivity matrixes were normalized by each subject’s whole-brain streamline counts and corrected for ROI sizes to remove variations arising from individual brain or ROI sizes. Afterwards, all subjects’ connectivity matrixes were averaged (Fig. 1C) and binarized with a threshold of 10% (of maximum streamline counts) (Fig. 1D). The final binarized connectivity (Fig. 1D) described a backbone connection structure (i.e., edges, Fig. 1E) used for the analysis that is common to all subjects. The per subject tract-specific diffusion measures (i.e. FA, MD, Da, Dr, ICVF, OD) were extracted on each connection of the backbone. The tau-PET signal in the GM ROIs (Fig. 1F) and diffusion metrics along the WM edges (Fig. 1E) were used in the pathway searching, where the “tau-WM” associations can be analyzed on the “node-edge” segments (Fig. 1H).
Fig. 1.

Establishing the backbone connection. The whole-brain streamlines (A) generated from tractography were classified according to their end-points (i.e., 84 cortical/subcortical ROIs (B)) to produce a structural connectivity matrix, where each element indicates the number of streamlines connecting any pair of ROIs. To eliminate false-positive connections arising from imaging noise, the mean connectivity matrix of all subjects (C) was binarized with a threshold of 10% (D). For each subject, tract-specific diffusion metrics were derived along all binarized connections, and tau-PET signals were summarized in all ROIs (H). Thus, “tau-WM” could be analyzed on “node-edge” pairs. Circle size in the brain illustration indicates the ROI size with a matching color code in (B, F, and G).
2.4. Data-driven iterative searching approach (DDIS)
DDIS was developed to search for tau-WM associations in continuous structural connections. The search started from seed ROIs with the highest tau+ prevalence (i.e., > 80%, defined as the percentage of subjects having tau+ in a given ROI, Fig. 2, Step1). Afterwards, all possible structural connections from the seeds were identified on the backbone (Fig. 2, Step2 gray sticks). For each connection, we applied two generalized liner regression models testing the following two hypotheses (Fig. 2 Step3):
if the tau-PET signal in a GM seed (TAUup: explanatory variable) is associated with a diffusion metric along its connecting WM tract (DiffWM: dependent variable); and
if the same diffusion metric along the WM tract (DiffWM: explanatory variable) is associated with tau-PET signal in the tract’s destination GM ROI (TAUdown: dependent variable).
Fig. 2.

Pathway searching pipeline. Step1 selects seed ROIs with high tau-PET signals among the subjects (i.e., tau+ prevalence > 80%). Step2 identifies all possible connections from the seeds (gray sticks). For each connection, two linear regressions were performed as shown in Step3. If both tests revealed significant results, the connection was considered an association pathway and was highlighted in Step4. Steps 2–4 were reiterated until no further pathways were detected.
An association pathway was deemed to exist if both regressions were significant (P < 0.05) (Fig. 2, Step4). The destination ROIs (Fig. 2, yellow ROIs) of the association pathways then became new seeds and the search continued by iterating Step2 to Step4 until no further pathways could be detected. The left and right hemisphere association patterns were analyzed independently. In addition, to avoid circulations within seeds during the search, connections among the seed ROIs were not considered. The directionality of Fig. 3 Step3 is necessary for the appropriate interpretation of the two hypotheses with the covariates (sex and age) on the right side of the general linear regression equation. This is also the building blocks of the iterative approach in DDIS.
Fig. 3.
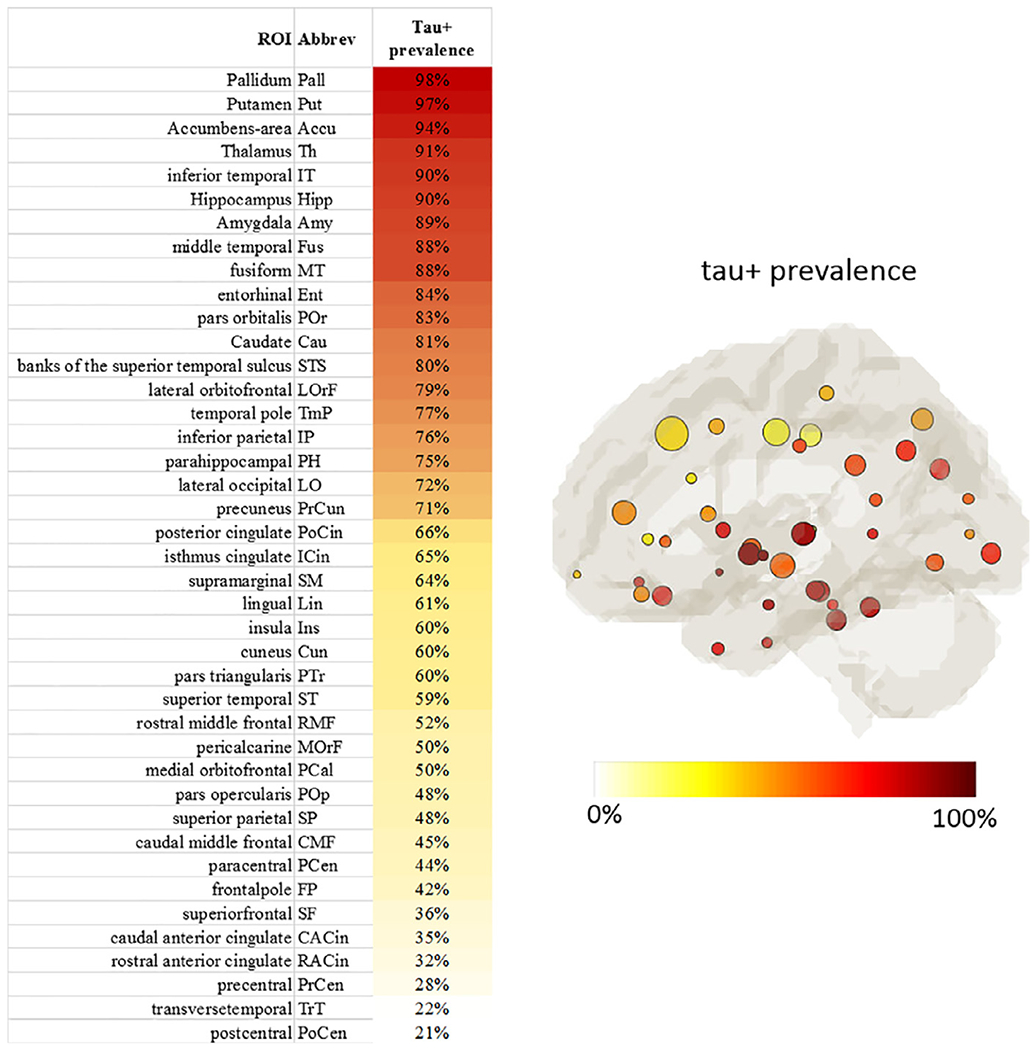
Tau+ prevalence of all ROIs. Left: ROIs sorted according to the Tau+ prevalence. Right: The map of ROIs color-coded by the tau+ prevalence level with circle size denoting the ROI size. Left and right hemispheres demonstrated very similar patterns and were averaged.
The diffusion data were used for two purposes. Firstly, it was used to perform WM streamline tractography to determine the connections between GM ROIs. Secondly, it was used to derive diffusion metrics that can probe microstructure properties along the WM connections. More specifically, the diffusion metrics were extracted from WM edges, not nodes. The nodes were generated with GM parcellation, and only tau deposition was quantified in the nodes. The connections (i.e. edges) between the nodes were determined with WM tractography. The integrity of the WM connection was interrogated by the diffusion metrics (i.e., the DTI metrics: FA, MD, Da, and Dr; and the NODDI metrics: ICVF and ODI). The same connectivity matrix (i.e., backbone connections or edges) was used for all the diffusion metrics. As DDIS applies linear regression between tau in the nodes and diffusion metric along the edges, DDIS produces an association pattern that is specific to a diffusion metric. For example, by saying “apply DDIS to MD”, it means MD is used in the regression to probe the WM integrity in the edges.
To test the stability and reproducibility of the DDIS framework, we performed additional analyses on the choice of thresholds and used a bootstrap method to assess the reproducibility and reliability. There are only two predetermined thresholds required in the DDIS approach (i.e., the threshold in creating binary backbone connection and the threshold in the seed selection). The purpose of the threshold in creating backbone connection is to minimize the false positive connection arising from the image noise in diffusion MRI while preserving the majority of the valid connections. To this end, we used a liberal threshold of 10% (of maximum streamline counts). Thresholding in creating binarized connection (i.e., edges) has been previously discussed and used in structural connectivity (Rubinov and Sporns, 2010; Mijalkov et al., 2017). Here, we demonstrated the distribution of streamline counts and assessed the results of the association pattern at difference thresholds with a 1% increment from 4% to 11% (Supplementary Fig. S1). The seed selection was performed by thresholding the prevalence of the tau positivity among the study population. The choice of the seed-selection threshold is to balance between the ratio of the seeds to the total number of nodes and the ratio of off-target nodes to the seeds. The effect of the number of initial seeds on the association pattern was evaluated (Supplementary Fig. S3). In addition, the number of seeds changes slightly with a different population composition. Such effect on the stability of the DDIS approach was evaluated in the bootstrap procedure described below.
To test the reproducibility of pathway searching and avoid type 1 error, bootstrap resampling with replacement was performed on the population, with fixed sample size (62 participants) in each bootstrap. For each bootstrap sample, the whole pipeline in Fig. 2 was repeated, including calculation of tau+ prevalence and seed selection. The discovered pathways of all bootstrap samples were combined and summarized through a voting system. Note that the bootstrap procedure is not part of the DDIS approach, but serves as a sanity check in this study to test the reproducibility and reliability of the DDIS approach. For a fixed population (i.e., sample), there is no randomness once the seed ROIs are selected. For a modest sample size, the observed pattern may be biased by the type 1 error. Therefore, the purpose of the bootstrapping in this study was to evaluate the stability of the association pattern when the population was randomly resampled.
2.5. Statistical analyses
In DDIS, regression analyses were controlled for possible confounders: age and sex. For demographic and cognitive variable comparisons, ANOVAs were employed with Tukey’s post-hoc or χ2 tests for categorical variables. A threshold of P < 0.05 was considered significant for all statistical models. Statistical analyses were conducted using R-3.5.1.
3. Results
3.1. Subject characteristics
Demographics and neuropsychological comparisons between the groups are shown in Table 1. No differences in age, sex, or education were detected between groups. Compared with the CN group, the SCD group had a higher self-reported Cognitive Change Index (CCI-self, 12 items) by design, but did not differ in other neuropsychological test scores. Individuals with MCI had significantly lower scores on the Rey Auditory Verbal Learning Test (RAVLT) immediate recall and delayed recall, and on the Montreal Cognitive Assessment (MoCA), as well as a significantly higher Clinical Dementia Rating scale (CDR) – sum of boxes and CCI.
Table 1.
Demographics and neuropsychological performance.
| CN (n = 22) | SCD (n = 22) | MCI (n = 18) | P value | Post-hoc (P < 0.05) | N | |
|---|---|---|---|---|---|---|
| Age (years) | 69.1 (7.7) | 68.9 (7.6) | 71.3 (9.3) | ns | ns | 22/22/18 |
| Sex (male, female) | 4, 18 | 8, 14 | 8, 10 | ns | ns | 22/22/18 |
| Education (years) | 17 (2.3) | 17.1 (2.7) | 16.4 (2.8) | ns | ns | 21/22/18 |
| Tau PET positive (−, +) † | 17, 5 | 18, 4 | 6, 12 | n/a | n/a | 22/22/18 |
| Aβ PET positive (−, +) ‡ | 20, 2 | 15, 7 | 6, 8 | n/a | n/a | 22/22/14 |
| APOE ε4 positive (−, +) | 18, 4 | 16, 6 | 7, 11 | n/a | n/a | 22/22/18 |
| RAVLT - immediate recall | 46.7 (9.4) | 44.5 (7) | 30.5 (7.4) | < 0.001 | CN,SCD > MCI | 18/20/17 |
| RAVLT - delayed recall | 10.2 (2.7) | 9 (2.7) | 2.6 (3) | < 0.001 | CN,SCD > MCI | 20/21/17 |
| MoCA total scrore | 27.3 (2.1) | 25.9 (2.2) | 21.3 (3.5) | < 0.001 | CN,SCD > MCI | 22/21/17 |
| CDR - sum of boxes | 0.1 (0.4) | 0.2 (0.5) | 1.8 (1.3) | < 0.001 | CN,SCD < MCI | 22/21/18 |
| CCI - self (12 items) | 15.4 (2.3) | 26.6 (5.5) | 35.2 (10.6) | < 0.001 | CN < SCD < MCI | 21/21/17 |
Abbreviations: Aβ, amyloid-β; APOE, apolipoprotein E; RAVLT, Rey Auditory Verbal Learning Test; MoCA, Montreal Cognitive Assessment; CDR, Clinical Dementia Rating scale; CCI, Cognitive Change Index; CN, cognitively normal; MCI, mild cognitive impairment; SCD, subjective cognitive decline.
Tau positivity: (+) = SUVR ≥ 1.23; SUVR = standard uptake value ratio.
Amyloid positivity: (+) = [18F]Florbetapir SUVR ≥ 1.1 or [18F]Florbetaben SUVR ≥ 1.2.
3.2. The prevalence of tau positivity
The tau+ prevalence across all subjects for each ROI is summarized in Fig. 3 with high tau PET SUVR localizing in the basal ganglia and medial temporal regions. Supplementary Fig. S2 lists the tau+ prevalence in each group. While all groups had a similar pattern of tau gradients across ROIs, the MCI group had a higher tau+ prevalence than the CN and SCD groups in almost every ROI. The ROIs with tau+ prevalence greater than 80% among all subjects were used as seeds for initiating the pathway searching process. The rationale for the threshold selection is discussed below (in Identified pathways session).
3.3. Identified pathways
The DDIS analysis was performed on all the diffusion metrics described above in Materials and Methods (also in Supplementary Table S1). Due to the similarity in the results, here we focus the description of the association patterns on DTI-derived mean diffusivity (MD). Nevertheless, results of all diffusion metrics are summarized below in the Diffusion metrics section.
Fig. 4 shows the detected pathways at each iteration. The searching analysis started from the seed ROIs (Fig. 4, red circles, tau+ prevalence > 80%) located in the basal ganglia and medial temporal lobe. The threshold for seed ROIs (i.e., 80% tau+ prevalence) is arbitrary. Similar results were observed for other seed thresholds explored in Supplementary Fig. S3. Although the seeds had WM tracts connecting to many brain areas (gray sticks and circles in Fig. 4, Iteration 1 top panel), only posterior pathways showed significant tau associations with WM integrity detected by MD (Fig. 4, Iteration 1 bottom). The association pathways identified in each iteration were assigned a color (bottom row). The colored destination ROIs (TAUdown) served as seed ROIs (TAUup) in the next iteration. Overall, the association pattern developed posteriorly, then superiorly, and eventually terminated anteriorly in the postcentral region. The searching continued for four iterations. In the fifth iteration (not shown), none of the connections from the brown-seeded ROIs showed significant associations in the downstream connections (P > 0.05).
Fig. 4.

An illustration of the iterative approach in DDIS. The searching started from initial 14 seed ROIs (red circles in Iteration 1) clustered mainly in the medial temporal lobe. All possible connections from the seed ROIs were initially colored gray (top row). Two linear regressions were performed on each connection (middle row) to determine TAUup-MD-TAUdown associations. The significant pathways were assigned colors (bottom row). The colored ROIs (TAUdown) served as seed ROIs (TAUup) in the next iteration. Note that the purpose of this figure is to illustrate the behind-the-scene process of the iterative approach. The identified/survived pathways and nodes were listed in Fig. 5 with full names and matched colors. The full form of the abbreviations is also listed in Fig. 3 left two columns.
Fig. 5 summarizes all the identified pathways for the tau-MD associations. Out of the 22 pathways, 14 were found in both hemispheres, indicated by a star (*). Higher tau levels were associated with increased MD in all pathways (P < 0.05). Some of the initial seed ROIs are known to have off-target tau binding (i.e., pallidum, caudate, putamen, thalamus, indicated by the red ⊗ in Fig. 4). These ROIs were treated the same way as the rest ROIs in the analysis. They consistently showed no significant pathways across the bootstrapping validation. Among the identified pathways (P < 0.05), quite a few associations had P values smaller than 0.01 (Table 2). Most of the earlier pathways that connect medial temporal lobe to the posterior part of the brain had lower P values (i.e., P < 0.001, blue). For example, the P value for the connection between inferior temporal and inferior parietal pathway had a P value of 0.00003 for the TAUup-DiffWM association and 0.00006 for the DiffWM - TAUdown association.
Fig. 5.

Summary of identified pathways for the tau-PET signal and MD association. Each colored pathway contains a dual association between tau-PET signal at both ends and MD in the tract. Involved GM ROIs are listed below with matching colors representing the stages/iterations in DDIS in Fig. 4. Out of 22 identified pathways, 14 were found in both hemispheres, indicated by a star (*) on the connections in the bottom figure. The red circles with a cross inside the circle, ⊗, denote those initial seed ROIs known to have off-target tau bindings. These ROIs were located in the basal ganglia, including the pallidum, caudate, putamen, and thalamus. STS: superior temporal sulcus. L: left hemisphere. R: right hemisphere.
Table 2.
A list of highly significant pathways (i.e., valid connection) with P values less than 0.01.
| Hemisphere | TAUup ROI | TAUdown ROI | p 1 | p 2 |
|---|---|---|---|---|
| L | middle temporal | inferior parietal | 0.00014 | 0.00007 |
| L | middle temporal | STS | 0.00012 | 0.00006 |
| L | inferior temporal | lateral occipital | 0.00025 | 0.00005 |
| L | inferior temporal | inferior parietal | 0.00003 | 0.00006 |
| L | fusiform | lingual | 0.00019 | 0.00019 |
| L | fusiform | lateral occipital | 0.00160 | 0.00025 |
| L | lateral occipital | superior parietal | 0.00016 | 0.00150 |
| L | lateral occipital | pericalcarine | 0.00170 | 0.00750 |
| L | lateral occipital | cuneus | 0.00076 | 0.00048 |
| L | inferior parietal | supramarginal | 0.00450 | 0.00370 |
| L | inferior parietal | superior parietal | 0.00240 | 0.00730 |
| L | STS | superior temporal | 0.00490 | 0.00270 |
| L | precuneus | isthmus cingulate | 0.00120 | 0.00091 |
| L | postcentral | paracentral | 0.00580 | 0.00720 |
| R | middle temporal | inferior parietal | 0.00036 | 0.00090 |
| R | middle temporal | STS | 0.00230 | 0.00150 |
| R | inferior temporal | lateral occipital | 0.00002 | 0.00030 |
| R | inferior temporal | inferior parietal | 0.00038 | 0.00100 |
| R | fusiform | lingual | 0.00009 | 0.00034 |
| R | fusiform | lateral occipital | 0.00014 | 0.00040 |
| R | lateral occipital | superior parietal | 0.00170 | 0.00610 |
| R | lateral occipital | cuneus | 0.00024 | 0.00002 |
| R | superior parietal | precuneus | 0.00460 | 0.00930 |
| R | superior parietal | postcentral | 0.00390 | 0.00044 |
| R | precuneus | isthmus cingulate | 0.00043 | 0.00040 |
P1 denotes the P value for the association between TAUup and DiffWM (i.e., tau in the seed ROI and the diffusion metric along its connecting WM tract) in that particular connection. In the same connection, P2 denotes the P value for the association between DiffWM and TAUdown (i.e., the diffusion metric along the WM tract and tau in the tract’s destination GM ROI). P values less than 0.001 are further highlighted in blue. L denotes the left hemisphere and R denotes the right hemisphere.
STS: banks of the superior temporal sulcus
3.4. Bootstrapping
Bootstrap sampling was performed 1000 times and the results are summarized in Fig. 6 for the tau-MD association. In each bootstrap sample, the subjects were randomly selected with replacement from the original pool, and thus the initial seed ROIs differed as well. While the detected pathways for each bootstrap sample (Fig. 6, top row) differed as expected, they followed a similar pattern that initiated from the medial temporal regions, posteriorly to occipital regions, and superiorly-anteriorly to the parietal or frontal regions. This pattern can be better appreciated in the summary map at the bottom of Fig. 6, where some persistent pathways appeared more than 90% of the time, including inferior temporal → inferior parietal → superior parietal, inferior temporal → lateral occipital → cuneus, and fusiform → lingual. To demonstrate the level of confidence for each established pathway in the main pattern (Fig. 5), the percentage of connections identified in bootstrap samples were summarized in Supplementary Fig. S4.
Fig. 6.

Bootstrapping results. Top row: Detected pathways for each bootstrap sample. Bottom row: The map summarizing the 1000 bootstrap results. The color scale denotes the percentage of bootstrap samples for which the TAUup-MD-TAUdown pathways were identified. Pathways with fewer than 30% are not shown.
3.5. Diffusion metrics
DDIS was applied to six diffusion metrics respectively and the association patterns are summarized in Fig. 7. For DTI-derived metrics, higher tau-PET signal is consistently associated with decreased FA and increased MD. Comparing the two components of MD, increased MD is driven by increased diffusivity along both radial (Dr) and axial (Da) directions in the early iterations (i.e. red-yellow), and is driven by increased diffusivity along the radial direction in the later iterations (i.e. yellow-green-purple-brown). For the NODDI metrics, independent DDIS on ICVF revealed a similar spatial pattern to that of MD, but with decreased ICVF (i.e., a proxy for axonal density). Increased OD was only detected in a few (i.e. 2) pathways. Fig. 7B summarizes the total number of detected pathways for each diffusion metric and corresponding r2diff (describing the additional variance of tau-PET signal explained by a diffusion metric in the linear regression) by iterations. As expected, r2diff are highest in the earliest iteration and becomes lower in the later iterations.
Fig. 7.

Summary of identified patterns (A) and statistics (B) for all the diffusion metrics. A. In the DTI-derived metrics, higher tau-PET signal is consistently associated with decreased FA and increased MD, Da and Dr. In the NODDI-derived metrics, higher tau-PET signal is associated with decreased intracellular volume fraction (ICVF) (i.e. a proxy for axonal density). Increased OD was detected in very few (i.e. 2) pathways. Independent DDIS on Da and ICVF revealed similar patterns to that of MD. B. Statistics of the association patterns. “# pathways” denotes the total number of detected pathways, each of which contains a dual association between tau in both ends and a diffusion metric in the connection (i.e. color-coded connections in A). Adjusted r2diff describes the additional variance of tau-PET signal explained by a diffusion metric in the multivariate regression model that controls for age and sex in the detected pathways. Only significant r2diff (i.e., p < 0.05) were listed here. “Direction of change” denotes the direction of change in the diffusion metrics when tau-PET signal increases in the adjacent GM ROIs.
3.6. Amyloid-diffusion (amy-diff) association patterns
As a supplementary analysis, DDIS framework was performed on amyloid-β PET data to investigate the amy-diff association patterns by replacing tau-PET signal with amyloid PET signal in the linear regression models. Seeds were selected based on the amyloid-β prevalence map (Supplementary Fig. S2) that includes precentral, pericalcarine, paracentral, lateralorbitofrontal, banks of the superior temporal sulcus, Pallidum, Putamen and Thalamus. None of the diffusion metrics were found to have major association patterns with amyloid-β (i.e., number of detected pathways ≤ 5, Supplementary Fig. 5).
4. Discussion
The present study investigated the relationship between GM tau deposition and WM degeneration using a whole-brain data-driven method on a cross-sectional sample. We found a high degree of association between GM tau-PET signal and WM integrity probed by both DTI and NODDI metrics. The distinct spatial association pattern initiated from the medial temporal lobe and developed posteriorly to the occipital brain regions and superiorly anteriorly to the parietal and frontal lobes, similar to what is described by Braak staging, a postmortem neuropathological staging method for AD (Braak and Braak 1991; Braak et al., 2011; Scholl et al., 2016). Such similarity suggests that WM may play an important role in facilitating the deposition of tau pathology. Our study also provides in vivo evidence that WM degeneration, as have been previously observed in patients with cognitive decline (McAleese et al., 2018; Mito et al. 2018a, b; Wen et al., 2019), could be tau related.
Our data-driven results support previous longitudinal studies, albeit with limited anatomical scope, that WM vulnerability facilitates tau propagation in AD. In a study of autosomal-dominant AD, the posterior parietal region was among the earliest affected regions showing degeneration approximately 5 to 10 years before the onset of clinical symptoms (Caballero et al., 2018). In a healthy older population, hippocampal cingulum bundle diffusivity predicted tau accumulation in the downstream-connected posterior cingulate cortex in the at-risk (i.e., amyloid-positive) subjects (Jacobs et al., 2018). Together, these previous findings and our results suggest that WM alterations are an intrinsic part of the AD pathophysiological cascade. Further validating WM diffusion metrics as a clinically relevant biomarker to monitor or even predict tau propagation may be achieved via longitudinal studies with the proposed whole-brain data-driven method.
The multi-shell HYDI diffusion acquisition enabled compartment model fitting to extract biologically relevant diffusion metrics that may provide more specific interpretation compared to DTI. In this study, the NODDI model provided complementary diffusion metrics that may clarify the underlying mechanisms of WM microstructural changes in association with the increased tau-PET signal. Our results demonstrated that tau-related WM degeneration was best characterized by increased mean and radial water diffusivity as probed by DTI-derived MD and Dr, and decreased axonal density as probed by NODDI-derived ICVF. The overall trend of these diffusion metrics suggested a lower axonal packing density accompanied by a high degree of radial diffusion freedom. The decrease in ICVF but lack of findings in OD suggested that the orientation of the degenerated WM tracts was unaffected in spite of decreasing density. Potential reasons for the tau-related WM alterations could be (1) hyperphosphorylation of tau decreases binding between microtubules, causing deterioration of intra-axonal cytoskeleton integrity (Alonso et al., 1996), and/or (2) Wallerian degeneration of axons and demyelination as a consequence of the increased cortical burden of tau pathology, as observed in a postmortem study (McAleese et al., 2017). Interestingly, the positive correlations of tau and Da were mainly concentrated along the pathways of early iterations. The concentrated association pattern indicated that these early pathways connecting the medial temporal lobe and parahippocampal or inferior parietal lobe sustained more extended WM deterioration in both radial and axial directions.
Similar tau and WM degeneration association pattern was observed in participants with positive amyloid PET signals, albeit with a small sample size (n = 17, Table 1). Compared to the full sample size (Fig. 8, top row), the tau-WM association pattern in the amyloid positive participants demonstrated similar pathways from medial temporal → occipital → parietal → paracentral regions (Fig. 8, bottom row). In the amyloid positive participants, the earlier pathways (i.e., iterations 1-red, 2-yellow, and 3-green) were preserved, whereas the later pathways (i.e., iterations 4-purple and 5-brown) were undetectable. The undetectable, insignificant associations may be caused by the small sample size, which can be observed in the scatter plots (Fig. 8, right panels). Despite with similar adjusted r2 values, the P values from all the participants (both red and blue dots) were much smaller (P = 0.00003 and 0.00006) than the amyloid positive participants (purple dots) (P = 0.01 and 0.02). Nevertheless, it is encouraging to observe similar results in the amyloid positive brain with such a small sample size. Future work will continue to focus on the interaction effect of amyloid positivity to the tau and WM degeneration pattern when a large sample becomes available.
Fig. 8.

The tau-WM association patterns between the full sample and amyloid positive participants. Top row left: the association pattern derived from all the participants. Top middle: the scatter plot for the tau-PET signal in the seed GM (TAUup) vs. mean diffusivity (MD) along the connecting WM tract in one of the early pathways (i.e., the inferior temporal to the inferior parietal ROI). Top right: in the same pathway, the scatter plot for MD along the WM tract vs. the tau-PET signal in the destination GM ROI (TAUdown). The black regression line represents all the participants including cognitively normal (CN, blue dots), individuals with subjective cognitive decline (SCD, blue dots), and with mild cognitive impairment (MCI, red dots). The r2 values are the adjusted r2 (coefficient of determination) describing additional variance explained by the independent variable in addition to the covariates (i.e., age and sex). P denotes the P value of the linear regression. Bottom row left: the association pattern derived from the amyloid positive participants (n = 17, Table 1). Bottom middle: the scatter plot for TAUup vs. MD in the same pathway (inferior temporal to the inferior parietal) in the amyloid positive participants (purple dots). Bottom right: the scatter plot for MD vs. TAUdown. The purple regression line represents the amyloid positive participants only.
Two negative control results were observed supporting the reliability of the positive findings. First, the tau-PET signal in GM ROIs with known off-target binding (Fig. 5) are not expected to have association with WM degenerations, as the PET signal with the 18F-flortaucipir tracer in these ROIs are related to iron load instead of tau tangles (Marquie et al., 2015). Nevertheless, we included these ROIs in the analyses to serve as negative controls. The negative findings in these ROIs supported our hypotheses. Since these off-target ROIs did not have any diffusion correlations, they did not contribute to the tau-diffusion association patterns. Thus, the results were the same with and without these ROIs. Second, in the supplementary analysis, similar searching analyses on amyloid-β did not identify strong association pattern with very few detectable pathways (≤ 5 as compared to tau ≤ 38) across the diffusion metrics. These findings support previous negative findings on the association between amyloid-β and WM degeneration in postmortem studies (McAleese et al., 2015, 2017) and between amyloid-β and DTI in an antemortem neuropathological study (Kantarci et al., 2017). A network analysis showed that tau, but not amyloid-β, was associated with WM integrity loss and multiple cognitive functions (Pereira et al., 2019). The lack of associations between amyloid-β and WM degeneration could be attributed to its genetic origins. A recent neurogenic study identified distinctive pathways for tau and amyloid-β accumulation, i.e., the tau-specific genetic profile was classified as ‘axon-related’ and the amyloid-β profile as ‘dendrite-related’ (Sepulcre et al., 2018). While not directly associated with WM integrity, a more complex interplay between amyloid-β and tau and their effects on WM degeneration could exist, such that amyloid-β accumulation may potentiate the propagation of tau (Khan et al., 2014; Pooler et al., 2015; Jacobs et al., 2018). Due to a small number of amyloid-positive subjects (17 of 58), this study is underpowered to infer the interaction effects of amyloid-β on the association pattern. Nevertheless, it may be interesting to investigate if the observed tau-WM association patterns may be enhanced with the presence of amyloid-β in future studies.
The emphasis of this study is to investigate the role of WM integrity in tau deposition, driven by the hypothesis that tau deposition in the GM ROIs is associated with WM integrity along their connections. With multi-shell diffusion MRI and higher-order streamline tractography model, we were able to resolve crossing fibers and establish cortex-to-cortex connections for any pair of ROIs. We performed the quantification directly along the tractography streamlines in the native scan space without the need for warping template tract ROIs to the subject space as performed in other tract-based studies (Jacobs et al., 2018; Strain et al., 2018). This approach overcame the partial volume issue and guaranteed the correspondence between tract and projected ROIs, as well as the subject specificity of the tract profile. Building upon the WM connectivity backbone, we demonstrated that the WM-tau association pattern resembles previously reported tau propagation patterns. Nevertheless, while WM degeneration may play an important role in tau deposition, the underlying mechanism of tau propagation could be multifactorial. Such complexity may partially explain why some of the GM ROIs (e.g., medial orbitofrontal cortex), despite demonstrating early tau deposition in the postmortem and tau-PET studies (Braak and Braak 1991; Braak et al., 2011; Scholl et al., 2016), did not appear in the WM-tau association patterns.
This study may be limited by the sample’s characteristics. While the pathway search approach is data driven, the results could be sample-dependent and susceptible to the sample size. To test the robustness of our findings, we performed bootstrap sampling and observed high consistency in the identified pathways. In addition, similar pathway patterns (either long or short) were detected across the diffusion metrics, indicating high reliability and reproducibility of the approach. Because of the small sample sizes preventing within group association analyses, global disease severity may contribute to the tau-WM associations. Nevertheless, the pathomechanistic relationships between tau and diffusion changes still play a significant role with P < 0.001 after adjusting for group memberships in the inferior temporal → inferior parietal pathway in a retrospective test (results not shown).
The seed selections have been rigorously investigated in this study with bootstrapping and with varying tau+ prevalence thresholds (Supplementary Fig. S3). To account for different distributions of tau-PET signals in different brain regions, alternative approaches may combine fine-tuned tau+ thresholds using z transformation in different GM ROIs (Cho et al., 2016; Vemuri et al., 2017). In addition, to increase the sensitivity of the tau-PET signal to neurofibrillary tangles (aggregates of hyperphosphorylated tau protein) in GM and increase the dynamic range of the association analyses, partial volume correction may be considered in future studies with the Rousset geometric transfer matrix method (Rousset et al., 1998; Baker et al., 2017; Maass et al., 2017).
5. Conclusion
This study demonstrated that WM degeneration is associated with the deposition of tau pathology in spatially selective pathways. A lower axonal packing density accompanied by a high degree of radial diffusion freedom along the WM connections were associated with high tau deposition in their projecting GM regions. Such tau-WM associations demonstrated a unique pattern that resembles tau propagation across AD stages. Future longitudinal studies with adequate sample sizes on amyloid-β+ populations may provide additional in-vivo evidence of WM-facilitated temporal propagation of tau pathology in preclinical AD.
Supplementary Material
Acknowledgments
We are grateful for the participation of the individuals in this research study without whom this research would not be possible.
Funding
This work was supported by the National Institutes of Health R01 AG053993, P30 AG010133, R01 AG019771, K01 AG049050, R01 AG061788, and by the Donors Cure foundation.
Abbreviations:
- AD
Alzheimer’s disease
- APOE
apolipoprotein E
- CCI
cognitive change index
- CDR
clinical dementia rating scale
- CN
cognitively normal
- Da
axial diffusivity
- Dr
radial diffusivity
- DTI
diffusion tensor imaging
- FA
fractional anisotropy
- FSL
FMRIB software library
- HYDI
hybrid diffusion imaging
- ICVF
intra-axonal volume fraction
- MCI
mild cognitive impairment
- MD
mean diffusivity
- MoCA
montreal cognitive assessment
- MRI
magnetic resonance imaging
- NODDI
neurite orientation dispersion and density imaging
- OD
orientation dispersion
- RAVLT
Rey auditory verbal learning test
- ROI
region of interest
- SCD
subjective cognitive decline
- SUVR
standardized uptake value ratio
Footnotes
Data and code sharing statement
The PET and MRI data used in this study was acquired via NIH-NIA funded R01 projects collected through the Indiana Alzheimer’s Disease Research Center (IADRC) (NIH P30). Therefore, we will comply with the NIH Data Sharing Policy and guidance (http://grants.nih.gov/grants/policy/data_sharing/data_sharing_guidance.htm) as well as the data sharing plan outlined in IADRC.
Briefly, we will make the data available as early as feasible to qualified researchers who have obtained IRB approval from their institution and who are willing to sign a data-sharing agreement. Requestors must agree to NIH policies regarding privacy, data security, and ethical practices including the requirement that no attempt will be made to determine the identities of participants or their relatives. The principal investigators will review requests for anonymized human imaging data. Requestors will be encouraged to develop collaborative analyses with the project investigators, but this will not be required for data access. The data processing and analysis codes used in this study that are from open-source software tools can be freely downloaded (please see the Methods section). The code developed in-house will be available upon request and follow aforementioned data sharing policy.
Declaration of Competing Interest
All authors report no competing interests.
Supplementary materials
Supplementary material associated with this article can be found, in the online version, at doi:10.1016/j.neuroimage.2020.117560.
Reference
- Albert MS, DeKosky ST, Dickson D, Dubois B, Feldman HH, Fox NC, Gamst A, Holtzman DM, Jagust WJ, Petersen RC, Snyder PJ, Carrillo MC, Thies B, Phelps CH, 2011. The diagnosis of mild cognitive impairment due to Alzheimer’s disease: recommendations from the national institute on aging-Alzheimer’s association workgroups on diagnostic guidelines for Alzheimer’s disease. Alzheimers Dement. 7 (3), 270–279. [DOI] [PMC free article] [PubMed] [Google Scholar]
- Alonso AC, Grundke-Iqbal I, Iqbal K, 1996. Alzheimer’s disease hyperphosphorylated tau sequesters normal tau into tangles of filaments and disassembles microtubules. Nat. Med 2 (7), 783–787. [DOI] [PubMed] [Google Scholar]
- Alzheimer A, Forstl H, Levy R, 1991. On certain peculiar diseases of old age. Hist. Psychiatry 2 (5 Pt 1), 71–101. [DOI] [PubMed] [Google Scholar]
- Caballero A, A. M, Suarez-Calvet M, Duering M, Franzmeier N, Benzinger T, Fagan AM, Bateman RJ, Jack CR, Levin J, Dichgans M, Jucker M, Karch C, Masters CL, Morris JC, Weiner M, Rossor M, Fox NC, Lee JH, Salloway S, Danek A, Goate A, Yakushev I, Hassenstab J, Schofield PR, Haass C, Ewers M, 2018. White matter diffusion alterations precede symptom onset in autosomal dominant Alzheimer’s disease. Brain 141 (10), 3065–3080. [DOI] [PMC free article] [PubMed] [Google Scholar]
- Arriagada PV, Growdon JH, Hedley-Whyte ET, Hyman BT, 1992. “Neurofibrillary tangles but not senile plaques parallel duration and severity of Alzheimer’s disease. Neurology 42 (3 Pt 1), 631–639. [DOI] [PubMed] [Google Scholar]
- Baker SL, Maass A, Jagust WJ, 2017. Considerations and code for partial volume correcting [(18)F]-AV-1451 tau PET data. Data Brief 15, 648–657. [DOI] [PMC free article] [PubMed] [Google Scholar]
- Bancher C, Brunner C, Lassmann H, Budka H, Jellinger K, Wiche G, Seitelberger F, Grundke-Iqbal I, Iqbal K, Wisniewski HM, 1989. Accumulation of abnormally phosphorylated tau precedes the formation of neurofibrillary tangles in Alzheimer’s disease. Brain Res. 477 (1–2), 90–99. [DOI] [PubMed] [Google Scholar]
- Braak H, Alafuzoff I, Arzberger T, Kretzschmar H, Del Tredici K, 2006. Staging of Alzheimer disease-associated neurofibrillary pathology using paraffin sections and immunocytochemistry. Acta Neuropathol. 112 (4), 389–404. [DOI] [PMC free article] [PubMed] [Google Scholar]
- Braak H, Braak E, 1991. “Neuropathological stageing of Alzheimer-related changes. Acta Neuropathol. 82 (4), 239–259. [DOI] [PubMed] [Google Scholar]
- Braak H, Thal DR, Ghebremedhin E, Del Tredici K, 2011. Stages of the pathologic process in Alzheimer disease: age categories from 1 to 100 years. J. Neuropathol. Exp. Neurol 70 (11), 960–969. [DOI] [PubMed] [Google Scholar]
- Brun A, Englund E, 1986. A white matter disorder in dementia of the Alzheimer type: a pathoanatomical study. Ann. Neurol 19 (3), 253–262. [DOI] [PubMed] [Google Scholar]
- Cho H, Choi JY, Hwang MS, Kim YJ, Lee HM, Lee HS, Lee JH, Ryu YH, Lee MS, Lyoo CH, 2016. “In vivo cortical spreading pattern of tau and amyloid in the Alzheimer disease spectrum. Ann. Neurol 80 (2), 247–258. [DOI] [PubMed] [Google Scholar]
- Daducci A, Canales-Rodriguez EJ, Zhang H, Dyrby TB, Alexander DC, Thiran JP, 2015. Accelerated microstructure i maging via convex optimization (AMICO) from diffusion MRI data. Neuroimage 105, 32–44. [DOI] [PubMed] [Google Scholar]
- Desikan RS, Segonne F, Fischl B, Quinn BT, Dickerson BC, Blacker D, Buckner RL, Dale AM, Maguire RP, Hyman BT, Albert MS, Killiany RJ, 2006. An automated labeling system for subdividing the human cerebral cortex on MRI scans into gyral based regions of interest. Neuroimage 31 (3), 968–980. [DOI] [PubMed] [Google Scholar]
- Goedert M, Spillantini MG, Crowther RA, 1991. Tau proteins and neurofibrillary degeneration. Brain Pathol. 1 (4), 279–286. [DOI] [PubMed] [Google Scholar]
- Haass C, Selkoe DJ, 2007. Soluble protein oligomers in neurodegeneration: lessons from the Alzheimer’s amyloid beta-peptide. Nat. Rev. Mol. Cell Biol 8 (2), 101–112. [DOI] [PubMed] [Google Scholar]
- Jack CR Jr., Wiste HJ, Weigand SD, Therneau TM, Lowe VJ, Knopman DS, Gunter JL, Senjem ML, Jones DT, Kantarci K, Machulda MM, Mielke MM, Roberts RO, Vemuri P, Reyes DA, Petersen RC, 2017. Defining imaging biomarker cut points for brain aging and Alzheimer’s disease. Alzheimers Dement. 13 (3), 205–216. [DOI] [PMC free article] [PubMed] [Google Scholar]
- Jacobs HIL, Hedden T, Schultz AP, Sepulcre J, Perea RD, Amariglio RE, Papp KV, Rentz DM, Sperling RA, Johnson KA, 2018. Structural tract alterations predict downstream tau accumulation in amyloid-positive older individuals. Nat. Neurosci 21 (3), 424–431. [DOI] [PMC free article] [PubMed] [Google Scholar]
- Jessen F, Amariglio RE, van Boxtel M, Breteler M, Ceccaldi M, Chetelat G, Dubois B, Dufouil C, Ellis KA, van der Flier WM, Glodzik L, van Harten AC, de Leon MJ, McHugh P, Mielke MM, Molinuevo JL, Mosconi L, Osorio RS, Perrotin A, Petersen RC, Rabin LA, Rami L, Reisberg B, Rentz DM, Sachdev PS, de la Sayette V, Saykin AJ, Scheltens P, Shulman MB, Slavin MJ, Sperling RA, Stewart R, Uspenskaya O, Vellas B, Visser PJ, Wagner MG Subjective Cognitive Decline Initiative Working, 2014. A conceptual framework for research on subjective cognitive decline in preclinical Alzheimer’s disease. Alzheimers Dement. 10 (6), 844–852. [DOI] [PMC free article] [PubMed] [Google Scholar]
- Kantarci K, Murray ME, Schwarz CG, Reid RI, Przybelski SA, Lesnick T, Zuk SM, Raman MR, Senjem ML, Gunter JL, Boeve BF, Knopman DS, Parisi JE, Petersen RC, Jack CR Jr., Dickson DW, 2017. White-matter integrity on DTI and the pathologic staging of Alzheimer’s disease. Neurobiol. Aging 56, 172–179. [DOI] [PMC free article] [PubMed] [Google Scholar]
- Khan UA, Liu L, Provenzano FA, Berman DE, Profaci CP, Sloan R, Mayeux R, Duff KE, Small SA, 2014. Molecular drivers and cortical spread of lateral entorhinal cortex dysfunction in preclinical Alzheimer’s disease. Nat. Neurosci 17 (2), 304–311. [DOI] [PMC free article] [PubMed] [Google Scholar]
- Kim JH, Budde MD, Liang HF, Klein RS, Russell JH, Cross AH, Song SK, 2006. Detecting axon damage in spinal cord from a mouse model of multiple sclerosis. Neurobiol. Dis 21 (3), 626–632. [DOI] [PubMed] [Google Scholar]
- Klunk WE, Koeppe RA, Price JC, Benzinger TL, Devous MD Sr., Jagust WJ, Johnson KA, Mathis CA, Minhas D, Pontecorvo MJ, Rowe CC, Skovronsky DM, Mintun MA, 2015. The centiloid project: standardizing quantitative amyloid plaque estimation by PET. Alzheimers Dement. 11 (1), 1–15 e11–14. [DOI] [PMC free article] [PubMed] [Google Scholar]
- Kodiweera C, Alexander AL, Harezlak J, McAllister TW, Wu YC, 2016. Age effects and sex differences in human brain white matter of young to middle-aged adults: a DTI, NODDI, and q-space study. Neuroimage 128, 180–192. [DOI] [PMC free article] [PubMed] [Google Scholar]
- Landau SM, Breault C, Joshi AD, Pontecorvo M, Mathis CA, Jagust WJ, Mintun MAI Alzheimer’s Disease Neuroimaging, 2013. Amyloid-beta imaging with Pittsburgh compound B and florbetapir: comparing radiotracers and quantification methods. J. Nucl. Med 54 (1), 70–77. [DOI] [PMC free article] [PubMed] [Google Scholar]
- Maass A, Landau S, Baker SL, Horng A, Lockhart SN, La Joie R, Rabinovici GD, Jagust WJI Alzheimer’s Disease Neuroimaging, 2017. Comparison of multiple tau-PET measures as biomarkers in aging and Alzheimer’s disease. Neuroimage 157, 448–463. [DOI] [PMC free article] [PubMed] [Google Scholar]
- Manjon JV, Coupe P, Concha L, Buades A, Collins DL, Robles M, 2013. Diffusion weighted image denoising using overcomplete local PCA. PLoS ONE 8 (9), e73021. [DOI] [PMC free article] [PubMed] [Google Scholar]
- Marquie M, Normandin MD, Vanderburg CR, Costantino IM, Bien EA, Rycyna LG, Klunk WE, Mathis CA, Ikonomovic MD, Debnath ML, Vasdev N, Dickerson BC, Gomperts SN, Growdon JH, Johnson KA, Frosch MP, Hyman BT, Gomez-Isla T, 2015. Validating novel tau positron emission tomography tracer [F-18]-AV-1451 (T807) on postmortem brain tissue. Ann. Neurol 78 (5), 787–800. [DOI] [PMC free article] [PubMed] [Google Scholar]
- McAleese KE, Firbank M, Dey M, Colloby SJ, Walker L, Johnson M, Beverley JR, Taylor JP, Thomas AJ, O’Brien JT, Attems J, 2015. Cortical tau load is associated with white matter hyperintensities. Acta Neuropathol. Commun 3, 60. [DOI] [PMC free article] [PubMed] [Google Scholar]
- McAleese KE, Walker L, Colloby SJ, Taylor JP, Thomas AJ, DeCarli C, Attems J, 2018. Cortical tau pathology: a major player in fibre-specific white matter reductions in Alzheimer’s disease? Brain 141 (6), e44. [DOI] [PubMed] [Google Scholar]
- McAleese KE, Walker L, Graham S, Moya ELJ, Johnson M, Erskine D, Colloby SJ, Dey M, Martin-Ruiz C, Taylor JP, Thomas AJ, McKeith IG, De Carli C, Attems J, 2017. Parietal white matter lesions in Alzheimer’s disease are associated with cortical neurodegenerative pathology, but not with small vessel disease. Acta Neuropathol. 134 (3), 459–473. [DOI] [PMC free article] [PubMed] [Google Scholar]
- Mijalkov M, Kakaei E, Pereira JB, Westman E, Volpe GI Alzheimer’s Disease Neuroimaging, 2017. BRAPH: a graph theory software for the analysis of brain connectivity. PLoS ONE 12 (8), e0178798. [DOI] [PMC free article] [PubMed] [Google Scholar]
- Mishra S, Gordon BA, Su Y, Christensen J, Friedrichsen K, Jackson K, Hornbeck R, Balota DA, Cairns NJ, Morris JC, Ances BM, Benzinger TLS, 2017. AV-1451 PET imaging of tau pathology in preclinical Alzheimer disease: defining a summary measure. Neuroimage 161, 171–178. [DOI] [PMC free article] [PubMed] [Google Scholar]
- Mitchell TW, Mufson EJ, Schneider JA, Cochran EJ, Nissanov J, Han LY, Bienias JL, Lee VM, Trojanowski JQ, Bennett DA, Arnold SE, 2002. Parahippocampal tau pathology in healthy aging, mild cognitive impairment, and early Alzheimer’s disease. Ann. Neurol 51 (2), 182–189. [DOI] [PubMed] [Google Scholar]
- Mito R, Raffelt D, Dhollander T, Vaughan DN, Tournier JD, Salvado O, Brodtmann A, Rowe CC, Villemagne VL, Connelly A, 2018a. Fibre-specific white matter reductions in Alzheimer’s disease and mild cognitive impairment. Brain 141 (3), 888–902. [DOI] [PubMed] [Google Scholar]
- Mito R, Raffelt D, Dhollander T, Vaughan DN, Tournier JD, Salvado O, Brodtmann A, Rowe CC, Villemagne VL, Connelly A, 2018b. Reply: cortical tau pathology: a major player in fibre-specific white matter reductions in Alzheimer’s disease? Brain 141 (6), e45. [DOI] [PubMed] [Google Scholar]
- Nelson PT, Alafuzoff I, Bigio EH, Bouras C, Braak H, Cairns NJ, Castellani RJ, Crain BJ, Davies P, Del Tredici K, Duyckaerts C, Frosch MP, Haroutunian V, Hof PR, Hulette CM, Hyman BT, Iwatsubo T, Jellinger KA, Jicha GA, Kovari E, Kukull WA, Leverenz JB, Love S, Mackenzie IR, Mann DM, Masliah E, McKee AC, Montine TJ, Morris JC, Schneider JA, Sonnen JA, Thal DR, Trojanowski JQ, Troncoso JC, Wisniewski T, Woltjer RL, Beach TG, 2012. Correlation of Alzheimer disease neuropathologic changes with cognitive status: a review of the literature. J. Neuropathol. Exp. Neurol 71 (5), 362–381. [DOI] [PMC free article] [PubMed] [Google Scholar]
- Pereira JB, Ossenkoppele R, Palmqvist S, Strandberg TO, Smith R, Westman E, Hansson O, 2019. Amyloid and tau accumulate across distinct spatial networks and are differentially associated with brain connectivity. Elife 8. [DOI] [PMC free article] [PubMed] [Google Scholar]
- Pooler AM, Polydoro M, Maury EA, Nicholls SB, Reddy SM, Wegmann S, William C, Saqran L, Cagsal-Getkin O, Pitstick R, Beier DR, Carlson GA, Spires-Jones TL, Hyman BT, 2015. Amyloid accelerates tau propagation and toxicity in a model of early Alzheimer’s disease. Acta Neuropathol. Commun 3, 14. [DOI] [PMC free article] [PubMed] [Google Scholar]
- Price JL, Morris JC, 1999. Tangles and plaques i n nondemented aging and “preclinical” Alzheimer’s disease. Ann. Neurol 45 (3), 358–368. [DOI] [PubMed] [Google Scholar]
- Rattanabannakit C, Risacher SL, Gao S, Lane KA, Brown SA, McDonald BC, Unverzagt FW, Apostolova LG, Saykin AJ, Farlow MR, 2016. The cognitive change index as a measure of self and informant perception of cognitive decline: relation to neuropsychological tests. J. Alzheimers Dis 51 (4), 1145–1155. [DOI] [PMC free article] [PubMed] [Google Scholar]
- Risacher SL, Tallman EF, West JD, Yoder KK, Hutchins GD, Fletcher JW, Gao S, Kareken DA, Farlow MR, Apostolova LG, Saykin AJ, 2017. Olfactory identification in subjective cognitive decline and mild cognitive impairment: association with tau but not amyloid positron emission tomography. Alzheimers Dement. Amst 9, 57–66. [DOI] [PMC free article] [PubMed] [Google Scholar]
- Rousset OG, Ma Y, Evans AC, 1998. Correction for partial volume effects in PET: principle and validation. J. Nucl. Med 39 (5), 904–911. [PubMed] [Google Scholar]
- Rubinov M, Sporns O, 2010. Complex network measures of brain connectivity: uses and interpretations. Neuroimage 52 (3), 1059–1069. [DOI] [PubMed] [Google Scholar]
- Salat DH, Tuch DS, Greve DN, van der Kouwe AJ, Hevelone ND, Zaleta AK, Rosen BR, Fischl B, Corkin S, Rosas HD, Dale AM, 2005. Age-related alterations in white matter microstructure measured by diffusion tensor imaging. Neurobiol. Aging 26 (8), 1215–1227. [DOI] [PubMed] [Google Scholar]
- Scholl M, Lockhart SN, Schonhaut DR, O’Neil JP, Janabi M, Ossenkoppele R, Baker SL, Vogel JW, Faria J, Schwimmer HD, Rabinovici GD, Jagust WJ, 2016. PET imaging of tau deposition in the aging human brain. Neuron 89 (5), 971–982. [DOI] [PMC free article] [PubMed] [Google Scholar]
- Schwarz AJ, Shcherbinin S, Slieker LJ, Risacher SL, Charil A, Irizarry MC, Fleisher AS, Southekal S, Joshi AD, Devous MD Sr., Miller BB, Saykin AJI Alzheimer’s Disease Neuroimaging, 2018. Topographic staging of tau positron emission tomography images. Alzheimers Dement. Amst 10, 221–231. [DOI] [PMC free article] [PubMed] [Google Scholar]
- Sepulcre J, Grothe MJ, d’Oleire Uquillas F, Ortiz-Teran L, Diez I, Yang HS, Jacobs HIL, Hanseeuw BJ, Li Q, El-Fakhri G, Sperling RA, Johnson KA, 2018. Neurogenetic contributions to amyloid beta and tau spreading in the human cortex. Nat. Med 24 (12), 1910–1918. [DOI] [PMC free article] [PubMed] [Google Scholar]
- Sintini I, Schwarz CG, Martin PR, Graff-Radford J, Machulda MM, Senjem ML, Reid RI, Spychalla AJ, Drubach DA, Lowe VJ, Jack CR Jr., Josephs KA, Whitwell JL, 2019. Regional multimodal relationships between tau, hypometabolism, atrophy, and fractional anisotropy in atypical Alzheimer’s disease. Hum. Brain Mapp 40 (5), 1618–1631. [DOI] [PMC free article] [PubMed] [Google Scholar]
- Song SK, Yoshino J, Le TQ, Lin SJ, Sun SW, Cross AH, Armstrong RC, 2005. Demyelination increases radial diffusivity in corpus callosum of mouse brain. Neuroimage 26 (1), 132–140. [DOI] [PubMed] [Google Scholar]
- Strain JF, Smith RX, Beaumont H, Roe CM, Gordon BA, Mishra S, Adeyemo B, Christensen JJ, Su Y, Morris JC, Benzinger TLS, Ances BM, 2018. Loss of white matter integrity reflects tau accumulation in Alzheimer disease defined regions. Neurology 91 (4), e313–e318. [DOI] [PMC free article] [PubMed] [Google Scholar]
- Tournier JD, Calamante F, Connelly A, 2012. MRtrix: diffusion tractography in crossing fiber regions. Int. J. Imaging Syst. Technol 22 (1), 53–66. [Google Scholar]
- Vemuri P, Lowe VJ, Knopman DS, Senjem ML, Kemp BJ, Schwarz CG, Przybelski SA, Machulda MM, Petersen RC, Jack CR Jr., 2017. Tau-PET uptake: regional variation in average SUVR and impact of amyloid deposition. Alzheimers Dement. Amst 6, 21–30. [DOI] [PMC free article] [PubMed] [Google Scholar]
- Wen Q, Mustafi SM, Li J, Risacher SL, Tallman E, Brown SA, West JD, Harezlak J, Farlow MR, Unverzagt FW, Gao S, Apostolova LG, Saykin AJ, Wu YC, 2019. White matter alterations in early-stage Alzheimer’s disease: a tract-specific study. Alzheimers Dement. Amst 11, 576–587. [DOI] [PMC free article] [PubMed] [Google Scholar]
- Wu YC, Alexander AL, 2007. Hybrid diffusion imaging. Neuroimage 36 (3), 617–629. [DOI] [PMC free article] [PubMed] [Google Scholar]
- Wu YC, Mustafi SM, Harezlak J, Kodiweera C, Flashman LA, McAllister TW, 2018. Hybrid diffusion imaging in mild traumatic brain injury. J. Neurotrauma 35 (20), 2377–2390. [DOI] [PMC free article] [PubMed] [Google Scholar]
- Zhang H, Schneider T, Wheeler-Kingshott CA, Alexander DC, 2012. NODDI: practical in vivo neurite orientation dispersion and density imaging of the human brain. Neuroimage 61 (4), 1000–1016. [DOI] [PubMed] [Google Scholar]
Associated Data
This section collects any data citations, data availability statements, or supplementary materials included in this article.