Abstract
Bacterial adaptive immune systems employ clustered regularly interspaced short palindromic repeats (CRISPR) along with their CRISPR-associated genes (Cas) to form CRISPR RNA (crRNA)-guided surveillance complexes, which target foreign nucleic acids for destruction. Cas9 is unique in that it is composed of a single polypeptide that utilizes both a crRNA and a trans-activating crRNA (tracrRNA) or a single guide RNA to create double-stranded breaks in sequences complementary to the RNA via the HNH and RuvC nuclease domains. Cas9 has become a revolutionary tool for gene-editing applications. Here, we describe methods for studying the cleavage activities of Cas9. We describe protocols for rapid quench-flow and stopped-flow kinetics and interpretation of the results. The protocols detailed here will be paramount for understanding the mechanistic basis for specificity of this enzyme, especially in efforts to improve accuracy for clinical use.
1. Introduction
Cas9 is an RNA-guided enzyme that cleaves foreign nucleic acids bearing sequence complementary to the RNA loaded into the enzyme during bacterial adaptive immunity. After the initial discovery of its ability to cleave DNA based on the sequence of a single guide RNA or guide RNA (Jinek et al., 2013), Cas9 was quickly repurposed for genome engineering technology. The applications for genome-editing based on Cas9 enzymes is seemingly endless. Cas9 has been broadly used in genetics studies to elucidate the role of specific genes, for disease modeling, and for demonstrating new therapeutics in models of genetic diseases (Hsu et al.) (Doudna and Charpentier, 2014)(Xiao-Jie et al., 2015). Cas9 applications are not limited to its nuclease activity. Cas9 enzymes can serve as a platform to recruit proteins to a target site, and it has been engineered into a powerful sequence-specific gene regulation tool (Gilbert et al.)(Qi et al., 2013)(Larson et al.)(Perez-Pinera et al.). dCas9 (nuclease-dead Cas9) maintains its ability to specifically target genes of interest. Fusing transcriptional activators and repressors to dCas9 turns it into a sequence-specific RNA-guided DNA-binding platform for these gene regulation studies. Cas9-based imaging approaches combine dCas9 with fluorescent probes for genomic imaging. dCas9 fused to enhanced GFP has been used to visualize the dynamics of coding and noncoding sequence loci in living cells (Chen et al.). One interesting application of this approach included fusing dCas9 to a HaloTag system and single-particle tracking to study the method of target search of Cas9 in living cells (Knight et al., 2015). Excitingly, therapeutic applications continue to become more common. Recently, Cas9 was used to correct mutations that cause Duchenne muscular dystrophy from patient cells (Long et al., 2018).
All of these applications rely on the ability of Cas9 to bind and unwind DNA to create an R-loop, where the target and non-target strands are funneled into and cleaved by the HNH and RuvC domains, respectively. The mechanisms behind Cas9 target recognition, R-loop formation, and cleavage activities are becoming clear. Crystal structures and electron microscopy structures of Cas9 show it has a bi-lobed architecture that undergoes dramatic structural rearrangements upon guide RNA-loading to form a DNA recognition-competent structure (Jinek et al., 2014). Later structures revealed how the target DNA is accommodated within the enzyme (Nishimasu et al., 2014, Anders et al., 2014, Nishimasu et al., 2015, Jiang et al., 2015). R-loop formation drives the repositioning and reorientation of the HNH domain into a cleavage-competent state as shown by a crystal structure of Cas9 with a partial R-loop and a cryo-EM reconstruction of a bona-fide R-loop structure (Jiang et al., 2016). While a great deal of structural, single molecule, and functional information exists on Cas9, there is little understanding of the mechanistic basis for enzyme specificity. Such information can only come from detailed kinetic analysis of Cas9 catalyzed reactions to established which steps in the pathway are rate-limiting and which determine specificity as these need not be the same (Kellinger and Johnson, 2010, Kellinger and Johnson, 2011). To address these questions, measurements need to be made on the timescale of a single enzyme reaction cycle. Cas9 is an unusual enzyme in that it catalyzes only a single enzyme turnover, so general methods of steady state kinetic analysis do not apply. Rather, we need to quantify the kinetics and thermodynamics of each step leading up to the irreversible cleavage steps.
By studying the kinetics of Streptococcus pyogenes Cas9 (SpCas9), the most widely used Cas9, higher-fidelity Cas9 variants, and Cas9 enzymes from different organisms, especially with respect to rate and fidelity, we have the opportunity to optimize these enzymes as they move closer and closer to clinical use. Here we describe methods for dissecting the kinetics of Cas9 enzymes. We provide step-by-step directions and reaction conditions for performing: (1) active site titration to establish the concentration of active enzyme, (2) rapid chemical quench-flow studies to measure the rates of the chemical reactions, and (3) stopped-flow fluorescence measurements to define the rates of DNA unwinding and R-loop formation. Finally, we describe methods of global data fitting of all of the data to ensure an entirely self-consistent interpretation based on a single unifying model. For each of these experiments, we show the exact conditions and results from our recently published kinetic analysis of Cas9 (Gong et al.). We also describe a simple active site titration that is easy to perform to estimate the concentration of active enzyme; this is a necessary first step before doing any other measurements.
2. Preparation of Cas9 and guide RNA complexes
Proper assembly of enzyme–RNA complexes and reconstitution with properly labeled substrate DNA is essential for these kinetic experiments.
2.1. Purification of Cas9
Purify Cas9 as previously described in detail (Anders and Jinek). In addition, include the following two steps before the final preparatory size-exclusion column.
Concentrate Cas9 after TEV cleavage to ~10mg/ml and load onto a heparin column (HiTrap Heparin HP, GE Healthcare.
Elute with a gradient up to 2M NaCl.
Pool fractions containing Cas9 and buffer exchange into 20mM HEPES, pH8.0, 150mM KCl, 0.5mM TCEP by dialysis
Concentrate the Heparin-purified Cas9 to ~5mg/ml and load onto an ion exchange column (HiTrap SP HP, GE Healthcare).
Elute with a gradient up to 1M NaCl.
2.2. In vitro transcription of guide RNA
Perform in vitro transcription of the guide RNA as previously described in detail (Anders and Jinek). Before each experiment, heat the guide RNA to 90°C and allow it to gradually cool to room temperature to ensure proper folding of the RNA.
2.3. Reconstitution of Cas9–guide RNA complexes
To form the DNA-binding-competent state (Cas9.gRNA, 200 nM), mix Cas9 protein and gRNA in a 1:1 ratio based on absorbance estimates of concentration in the absence of DNA, and incubate for 10 min at room temperature.
2.4. Substrate preparation
Purchase 55-nt DNA oligonucleotides (unmodified and 2-aminopurine (2-AP)-labeled) from Integrated DNA Technologies (IDT) and use polyacrylamide gel electrophoresis (PAGE) to purify these substrates before use.
For unmodified DNA oligonucleotides, label the target strand (TS) and non-target strand (NTS) separately with γ−32P on its 5’-end by T4 polynucleotide kinase (PNK). Then, anneal the radio labeled TS or NTS with the unlabeled complementary strand at a 1:1.15 molar ratio. Finally, transfer the sample to the heat block at 95°C (Thermolyne) and slowly cool it down to room temperature (~4 hours).
For 2-AP-labeled DNA experiments, 2-AP was incorporated at position −9 nt distal to the PAM on the NTS oligo. Again, anneal the fluorescently labeled DNA duplex with its unlabeled complementary strand using the protocol in step 2.
The oligonucleotides used in our experiments have complete complementarity to one another, specifically the TS is complementary to the 20-nt seed sequence of the gRNA, creating a perfectly matched target dsDNA.
3. General cleavage assay protocol
3.1. Cleavage, sample collection and separation
Prepare 5X cleavage buffer (100 mM Tris-Cl, pH 7.5, 500 mM KCl, 25% glycerol, 5 mM DTT).
After allowing Cas9–gRNA to react with substrate in 1X cleavage buffer under the conditions for the assay, quench each reaction by the addition of 0.5 M EDTA and DNA loading buffer (90% formamide, 50 mM EDTA, 0.1% bromophenol blue, 0.1% xylene cyanol FF)
Resolve the products by running a 16% denaturing urea PAGE gel (acrylamide (1:19 bisacrylamide) in 7M Urea) (38 × 50 cm; 0.4 mm thick) in 1X TBE buffer. Load 7 𝜇L of each sample and run at 100 W for ~3 hours until the bromophenol blue dye migrates two-thirds of the way down the gel.
3.2. Interpretation of the assay
The cleavage of the DNA duplex substrate by Cas9 leads to a mobility shift of the radioactive signal. For HNH cleavage assays, the uncleaved γ−32P-labeled TS DNA of the substrate has a length of 55 nt, while the cleaved product is 22-nt in length. For RuvC cleavage assays, the uncleaved γ−32P-labeled NTS DNA of the substrate has a length of 55 nt, while the cleaved product is 33-nt.
Scan and quantify the product formation using a Typhoon scanner with ImageQuant 6.0 software (Molecular® Dynamics).
4. Active site titration assay
4.1. Steady-state active site titration
The reaction preparation conditions are described in Table 1. To form the DNA-binding-competent state (Cas9.gRNA, 200 nM), mix Cas9 protein and gRNA using 1:1 molar ratio based on absorbance measurements in the absence of DNA, and incubate for 10 min at room temperature (Syringe A).
Initiate the active-site titration assay by taking 10 𝜇L aliquots of a fixed concentration of Cas9.gRNA to mix with 10 𝜇L aliquots containing variable concentrations of a γ−32P-labeled DNA target (Syringe B), and then allow the reaction to reach completion at 37°C. A reaction time of 30 min is sufficient for the reaction to go to completion for each enzyme site with wild-type Cas9. Longer times may be required for mutant forms of the enzyme. Because the enzyme catalyzes only one turnover, the concentration of product defines the concentration of active enzyme.
Stop the reaction and analyze the results using the protocol in 3.1 and 3.2.
Analyze data by nonlinear regression using the program GraFit5 (Erithacus Software, Surrey, UK), and fit to a quadratic equation (Equation 1) to obtain the active-site concentrations (E0) of Cas9.gRNA.
Table 1.
Active-site titration assay using the γ−32P-labeled TS DNA duplex
| Syringe A | Stock concentration | Final concentration | Volume (𝜇L) |
|---|---|---|---|
| DEPC-H2O | – | – | 66 |
| Cleavage Buffer | 5X | 1X | 20 |
| SpyCas9 | 10 𝜇M | 200 nM | 2 |
| Guild RNA | 10 𝜇M | 200 nM | 2 |
| MgCl2 | 100 mM | 10 mM | 10 |
| Total volume | 100 | ||
| Incubate for 10 min at room temperature. | |||
| Syringe B | Stock concentration | Final concentration | Volume (𝜇L) |
| DEPC-H2O | – | – | Variable |
| Cleavage Buffer | 5X | 1X | 2 |
| Duplex substrate | 0.5 𝜇M | Variable (0–200 nM) | Variable |
| MgCl2 | 100 mM | 10 mM | 1 |
| Total volume | 10 | ||
| Allow the reaction to proceed for 30 min. | |||
| (Equation 1) |
Where Y represents the concentration of product at the reaction endpoint, E0 represents the active-site concentration of Cas9.gRNA, and DNA represents the total concentration of DNA. Kd represents an apparent Kd for DNA binding, but this measurement does not provide an accurate measurement of the Kd for DNA binding because the irreversible cleavage reaction drives the DNA binding to completion. Nominally, a sub-nanomolar value is sufficient.
In our study, the fit of the results revealed that 28 nM Cas9.gRNA is active (Fig. 1). It also demonstrated that Cas9 is a single-turnover enzyme. For all subsequent experiments, use this calculated active-site concentration of Cas9 rather than one based on absorbance measurements to accurately design and execute experiments. It is particularly important to design experiments based upon known molar concentrations of enzyme and substrates.
Figure 1.
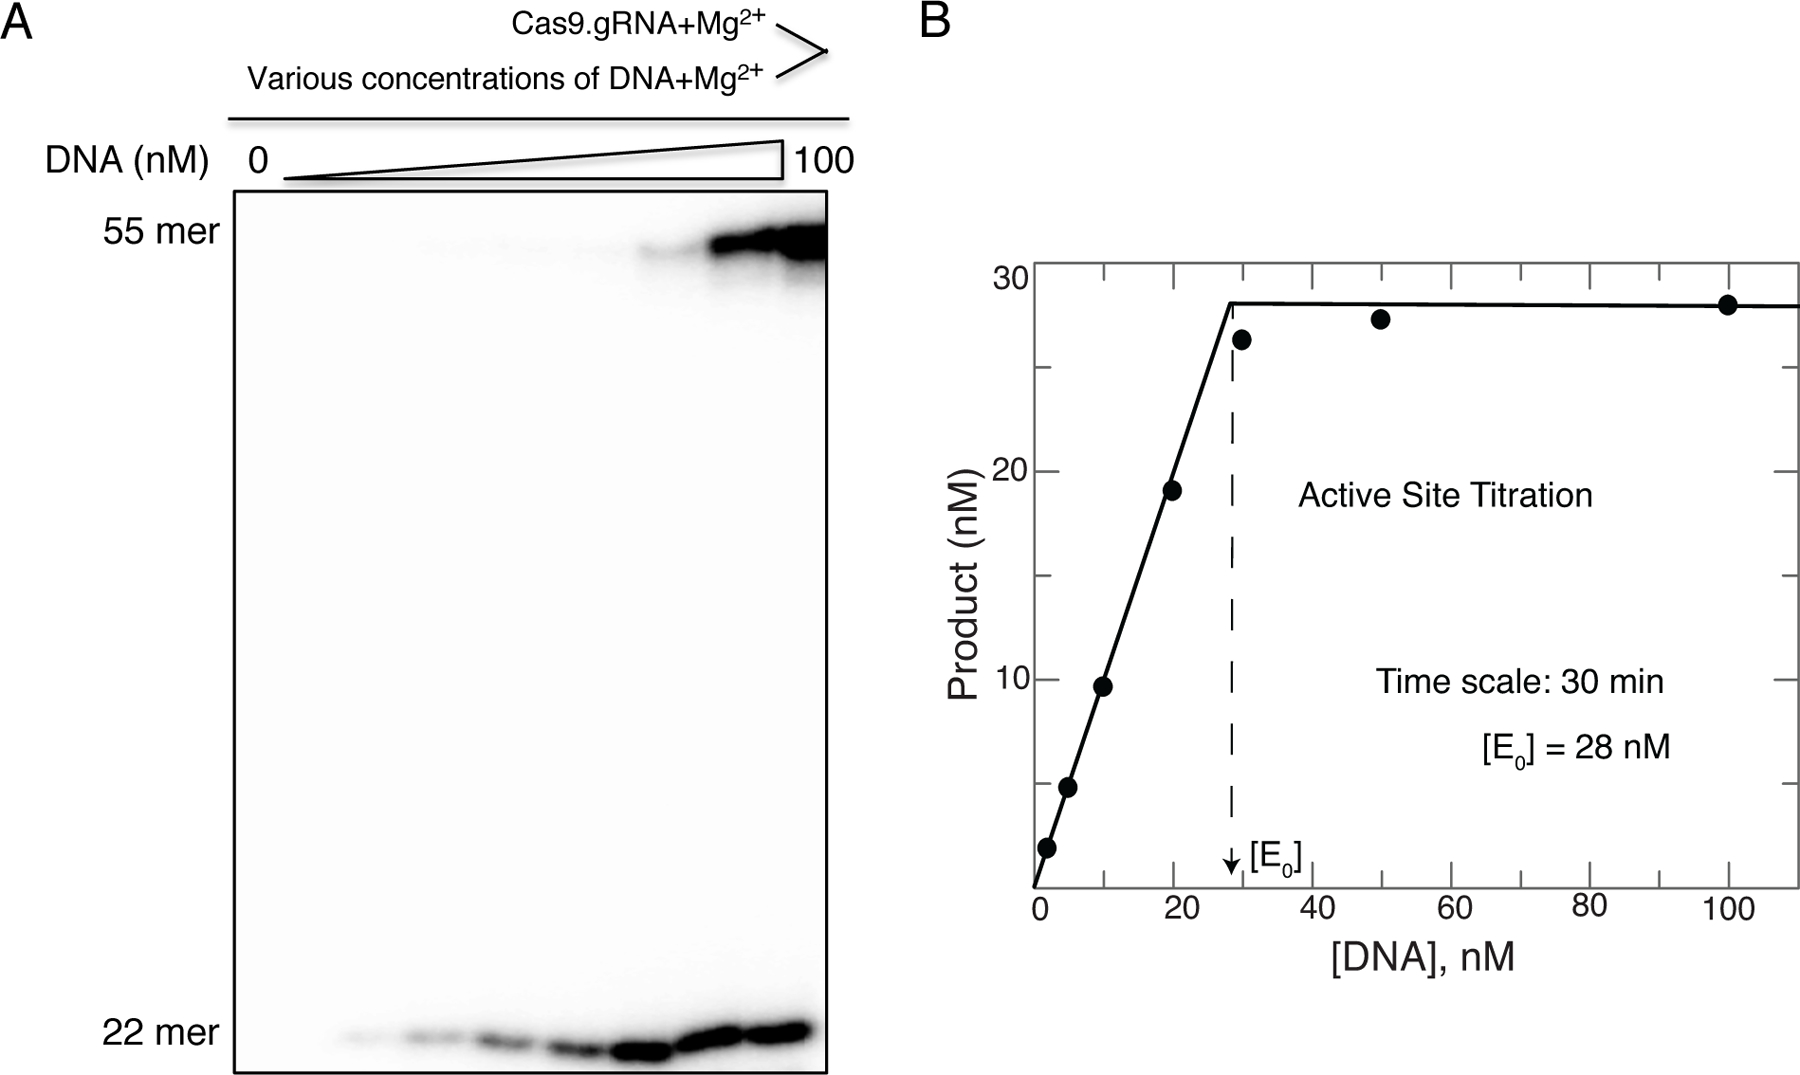
(A) Our active-site titration assay was carried out by mixing a fixed concentration (100 nM) Cas9.gRNA (1:1 ratio) with varying concentrations of γ−32P-labeled TS DNA duplex in the presence of Mg2+, then allowing the reaction to reach completion for 30 min. The scheme is shown above the gel image. (B) The plot of product formation as function of DNA concentration was fit using the quadratic equation. Our results showed 28 nM of Cas9.gRNA is active. The figure is adapted from Gong et al. 2018.
4.2. Transient state active site titration
Transient state active-site titration experiments are carried out using conditions in Table 2 and provide a Kd measurement for DNA binding by restricting the time of the reaction to allow only enough time for enzyme that has already bound DNA to react to form products. In this case the concentration of product formed defines the concentration of enzyme-DNA complex at the start of the measurement.
Table 2.
Transient state active-site titration assay using the γ−32P-labeled TS DNA duplex
| Syringe A | Stock concentration | Final concentration | Volume (𝜇L) |
|---|---|---|---|
| DEPC-H2O | – | – | 76 |
| Cleavage Buffer | 5X | 1X | 20 |
| SpyCas9 | 10 𝜇M | 400 nM | 4 |
| Guild RNA | 10 𝜇M | 400 nM | 4 |
| Total volume | 100 | ||
| Incubate for 10 min at room temperature. | |||
| Syringe B | Stock concentration | Final concentration | Volume (𝜇L) |
| DEPC-H2O | – | – | Variable |
| Cleavage Buffer | 5X | 1X | 2 |
| Duplex substrate | 0.5 𝜇M | Variable (0–400 nM) | Variable |
| Total volume | 10 | ||
| Incubate for 30 min at 37°C. | |||
| Syringe C | Stock concentration | Final concentration | Volume (𝜇L) |
| DEPC-H2O | – | – | 120 |
| Cleavage Buffer | 5X | 1X | 40 |
| MgCl2 | 100 mM | 20 mM | 40 |
| Total volume | 200 | ||
| Allow the reaction to proceed for 10 sec. | |||
After 10 min incubation of Cas9.gRNA (Syringe A), take 10 𝜇L aliquots of a fixed concentration of Cas9.gRNA and pre-incubate with 10 𝜇L aliquots of variable concentrations of a γ−32P-labeled DNA target (Syringe B) for 30 min at 37°C in the absence of Mg2+.
Initiate the reaction by adding 20 𝜇L MgCl2 (20 mM) (Syringe C).
Stop the reaction after 10 sec by adding 0.5 M EDTA.
Stop the reaction and analyze the results using the protocol in 3.1 and 3.2.
Fit the data using a quadratic equation to obtain the binding affinity (Kd) of DNA to Cas9.gRNA.
In our assay, the final active-site concentration of Cas9.gRNA was 28 nM, final DNA concentrations varied from 0–100 nM, and final MgCl2 in solution was 10 mM. Our results revealed the Kd for DNA binding equal to 4 nM (Fig 2).
Figure 2.
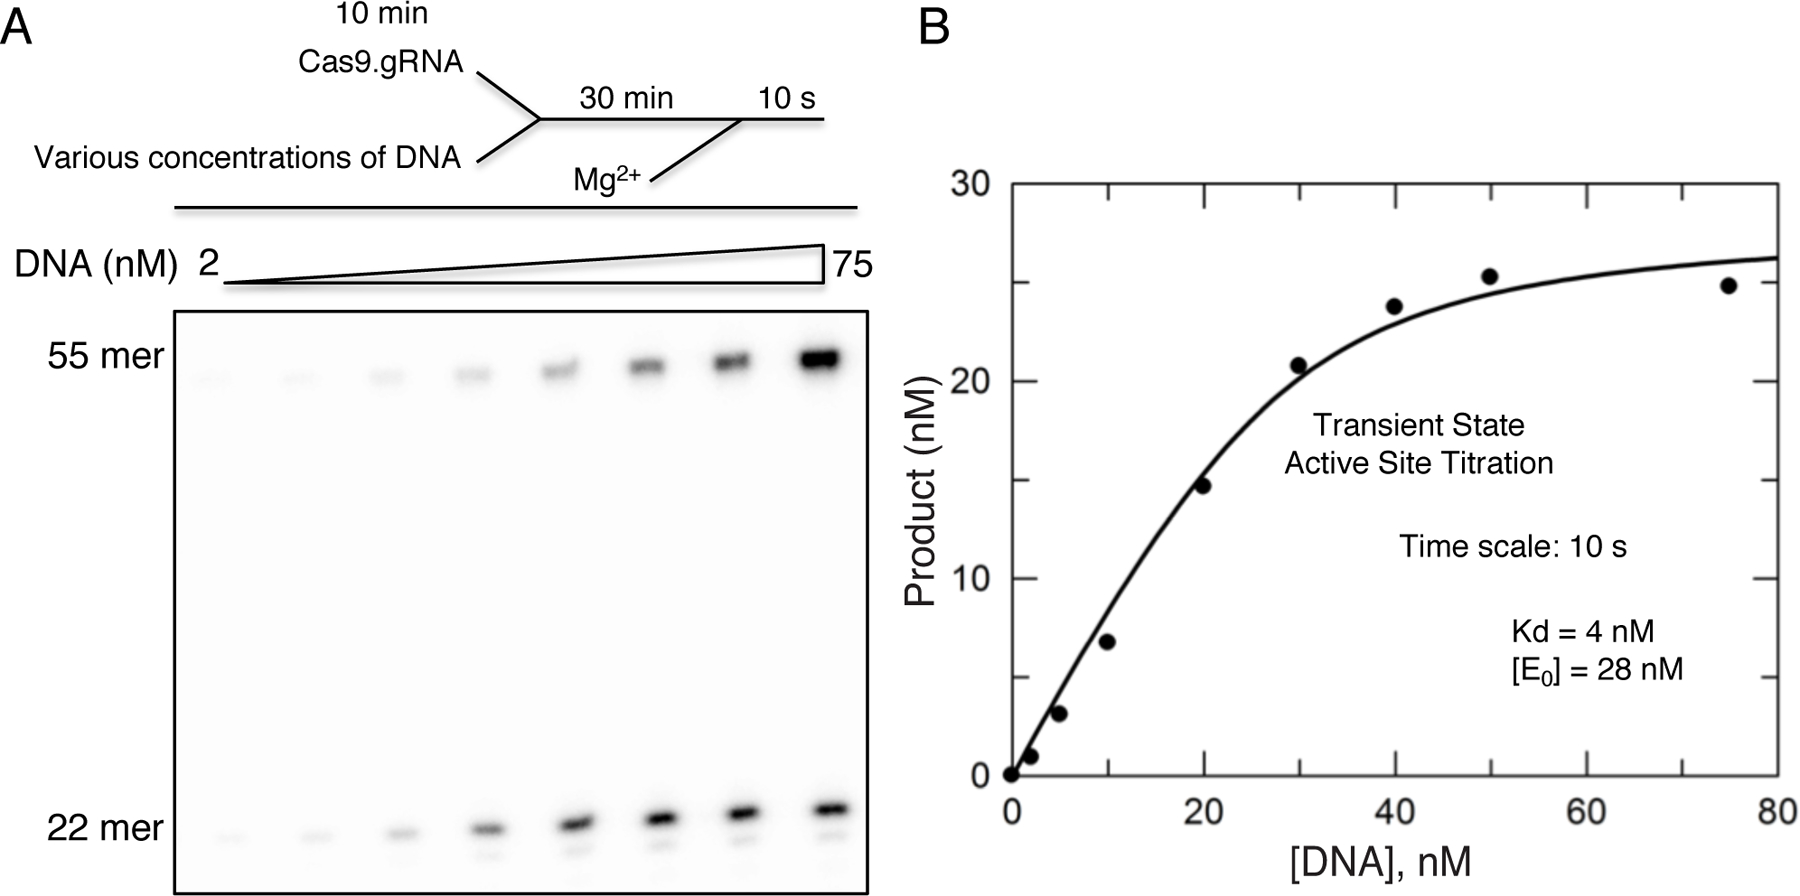
(A) Transient state active-site titration experiment was performed by pre-mixing a fixed concentration (100 nM) of Cas9.gRNA (1:1 ratio) with varying concentrations of γ−32P-labeled TS DNA duplex for 30 min in the absence of Mg2+ to allow the Cas9.gRNA.DNA to reach equilibrium. The reaction was initiated by the addition of Mg2+ and allowed to proceed for 10 s. The reaction scheme is shown above the gel image. (B) The plot of product formation as a function of DNA concentration was fit using the quadratic equation. The result revealed that the Kd for DNA binding was 4 nM and the active-site concentration was 28 nM of Cas9.gRNA. This figure is adapted from Gong et al. 2018.
5. Quench-flow method
For reactions occurring in less than 5 seconds, we use a rapid chemical-quench-flow instrument illustrated in Figure 3 (Johnson, 1995). In principle the experiment is conducted in the same manner as one performed by hand mixing: First mix enzyme with substrate and allow the reaction to proceed for the desired time, then quench the reaction by mixing with a reagent to stop the reaction. The amounts of products are then quantified based upon a method to separate substrate from product. In this case, we quench with 0.5 M EDTA to chelate Mg2+ ions to stop the reaction and then resolve substrate and product by PAGE. The only difference is that the plumbing in the instrument and the computer-controlled drive syringes allow reaction times as short as 2 ms.
Figure 3.
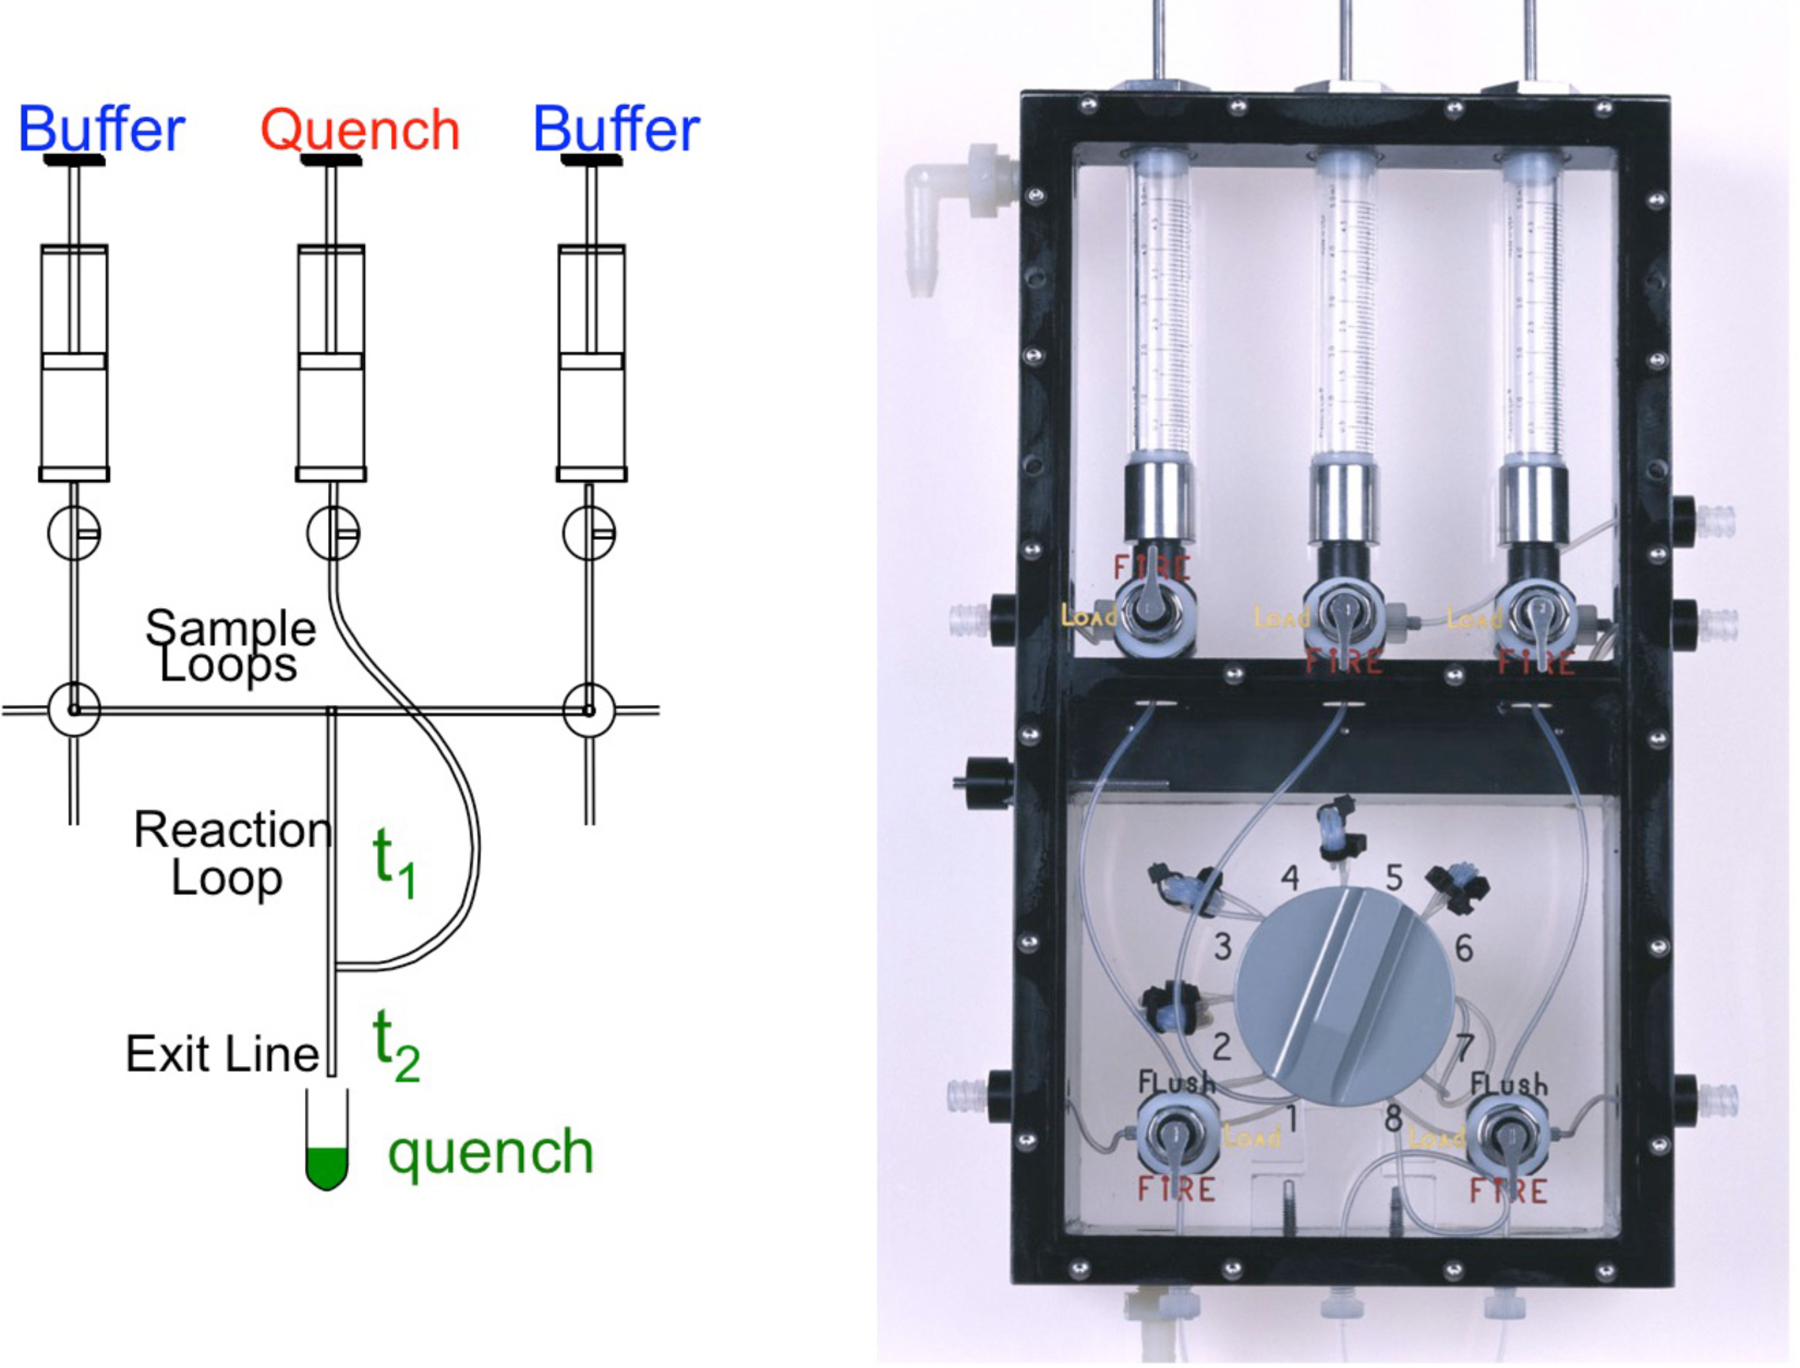
Rapid chemical-quench-flow apparatus. We show the schematic (left) and photograph of the syringe/valve chamber of a KinTek RQF-3 instrument. The two samples are loaded into the left and right hand Sample Loops, then after changing the valve position, a computer controlled motor drives the syringes containing Buffer to force the reactants to mix. Reaction occurs as the mixed samples flow through the Reaction Loop and is terminated by mixing with solution from the Quench syringe. The sample is then expelled into a collection tube so that it can be analyzed to determine the concentration of product for a particular time point. The time of reaction is varied by changing the length of the Reaction Loop using the 8-way valve shown in the photograph at the right, and by slightly altering the flow rate.
Based on the active-site titration assay, we considered Cas9 as an extreme case of a pre-steady-state burst because product release is exceedingly slow, allowing only a single turnover. Moreover, the irreversible cleavage reaction of Cas9 catalysis pulls all reversible DNA binding to completion until all of the active enzyme is consumed.
5.1. DNA off-rate measurements
To perform DNA off rate measurements, use the conditions in Table 3.
After 10 min incubation of Cas9.gRNA, add labeled DNA duplex to allow the formation of Cas9.gRNA.DNA complex (Syringe A).
Take 10 𝜇L aliquots of Cas9.gRNA.DNA to mix with 10 𝜇L aliquots 20-fold excess of unlabeled cold trap DNA (Syringe B) and incubate for various times at 37°C.
Initiate the reaction by adding 20 𝜇L MgCl2 (20 mM) (Syringe C) for 30 sec. The final concentrations of reactants is 28 nM active-site concentration of Cas9.gRNA, 10 nM radiolabeled DNA target, 200 nM cold trap DNA, and 10 mM MgCl2.
Stop the reaction and analyze the results using the protocol in 3.1 and 3.2.
Fit the data using a single-exponential decay equation (Equation 2) to obtain the dissociation rate (koff,DNA) of DNA form Cas9.gRNA.DNA.
Table 3.
DNA off rate measurement assay using the γ−32P-labeled TS DNA duplex
| Syringe A | Stock concentration | Final concentration | Volume (𝜇L) |
|---|---|---|---|
| DEPC-H2O | – | – | 64 |
| Cleavage Buffer | 5X | 1X | 20 |
| SpyCas9 | 10 𝜇M | 400 nM | 4 |
| Guild RNA | 10 𝜇M | 400 nM | 4 |
| Duplex substrate | 0.5 𝜇M | 40 nM | 8 |
| Total volume | 100 | ||
| Incubation Cas9.gRNA for 10 min at room temperature, and then adding DNA to incubate Cas9.gRNA.DNA for 30 min at 37°C. | |||
| Syringe B | Stock concentration | Final concentration | Volume (𝜇L) |
| DEPC-H2O | – | – | 64 |
| Cleavage Buffer | 5X | 1X | 20 |
| 20X cold trap DNA | 5 𝜇M | 800 nM | 16 |
| Total volume | 100 | ||
| Incubation at various time points (0–30 min) at 37°C. | |||
| Syringe C | Stock concentration | Final concentration | Volume (𝜇L) |
| DEPC-H2O | – | – | 120 |
| Cleavage Buffer | 5X | 1X | 40 |
| MgCl2 | 100 mM | 20 mM | 40 |
| Total volume | 200 | ||
| Allow the reaction to proceed for 30 sec. | |||
| (Equation 2) |
Fitting of our data revealed the koff,DNA is 0.0024 s−1 (Figure 4). This result suggests that Cas9.gRNA binds to DNA reversibly prior to cleavage, but with a very slow dissociation rate.
Figure 4.
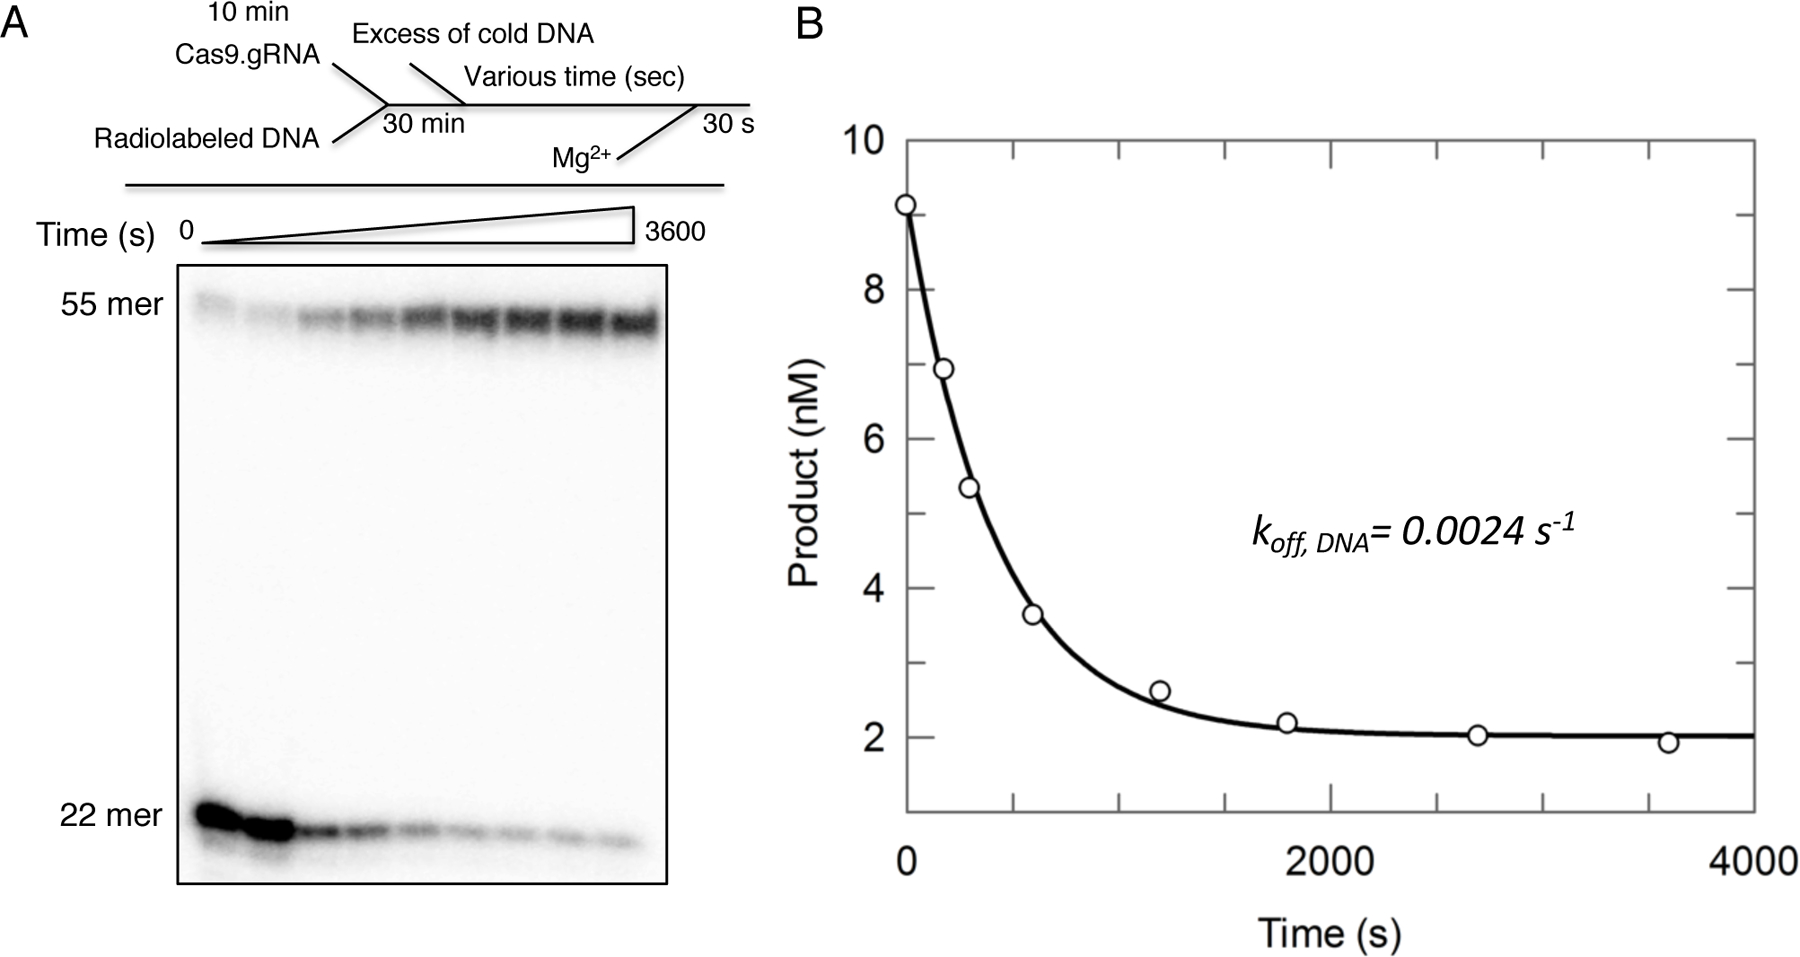
(A) The DNA dissociation rate measurement was conducted by preincubating radiolabeled DNA duplex and Cas9.gRNA for 30 min in the absence of Mg2+. Following by addition of 20X excess of cold trap DNA for varying incubation time points (0, 1, 5, 10 ,20, 30, 45, and 60 min), after adding Mg2+ to start the reaction for 30 sec. The scheme is shown above the gel image. (B) The plot of product formation as a function of time was fit by the single-exponential decay equation to define the DNA dissociation rate from Cas9.gRNA (koff,DNA = 0.0024 s−1). This figure is adapted from Gong et al. 2018.
5.3. Measuring the rate of catalysis
To better understand the reaction on the timescale of a single turnover, it is important to design experiments to accurately measure the rate of catalysis. For these measurements, we employed two complementary approaches. In the first case, we simultaneously mix DNA and Mg2+ with Cas9.gRNA and then measure the cleavage rate. In the second case, we first allow the formation of the Cas9.gRNA.DNA in the absence of Mg2+, and then directly measure the cleavage after the addition of Mg2+.
In the first case, the experiment is performed according to Table 4.
Table 4.
Time course cleavage assay using the γ−32P-labeled DNA duplex
| Syringe A | Stock concentration | Final concentration | Volume (𝜇L) |
|---|---|---|---|
| DEPC-H2O | – | – | 66 |
| Cleavage Buffer | 5X | 1X | 20 |
| SpyCas9 | 10 𝜇M | 200 nM | 2 |
| Guild RNA | 10 𝜇M | 200 nM | 2 |
| MgCl2 | 100 mM | 10 mM | 10 |
| Total volume | 100 | ||
| Incubation for 10 min at room temperature. | |||
| Syringe B | Stock concentration | Final concentration | Volume (𝜇L) |
| DEPC-H2O | – | – | 66 |
| Cleavage Buffer | 5X | 1X | 20 |
| Duplex substrate | 0.5 𝜇M | 20 nM | 4 |
| MgCl2 | 100 mM | 10 mM | 10 |
| Total volume | 100 | ||
-
1
Specifically, perform the time course of cleavage assay using a timescale of 5 min by mixing Cas9.gRNA (28nM) (Syringe A) with 10 nM DNA (Syringe B) at a 1:1 ratio in the presence of Mg2+ at 37°C via hand mixing.
-
2
Stop the reaction and analyze the results using the protocol in 3.1 and 3.2.
-
3
Fit the data to a double-exponential equation (Equation 3). The biphasic phase of the curve suggests the reaction has two phases.
| (Equation 3) |
In our study, the initial fast phase revealed ~85% of cleavage occurs at a rate of ~1 s−1, while the second slow phase revealed the remaining ~15% of cleavage occurs at a rate of ~0.03 s−1.
-
4
Follow the protocol in 5.2 by rapidly mixing two samples using KinTek RQF-3 instrument (KinTek Corporation, Austin, Texas, USA). Use a timescale from 0.25 to 10 sec and 1 to 20 sec for the HNH and RuvC cleavage assays, respectively.
-
5
Stop the reaction and analyze the results using the protocol in steps 3.1 and 3.2.
-
6
Fit the data to a single-exponential equation (Equation 4) to define the cleavage rates for the HNH and RuvC domains, respectively (Figure 6A–B). Time dependence of HNH cleavage and RuvC cleavage showed the cleavage rates of the HNH and RuvC domains are 1 s−1 and 0.2 s−1, respectively.
Figure 6.
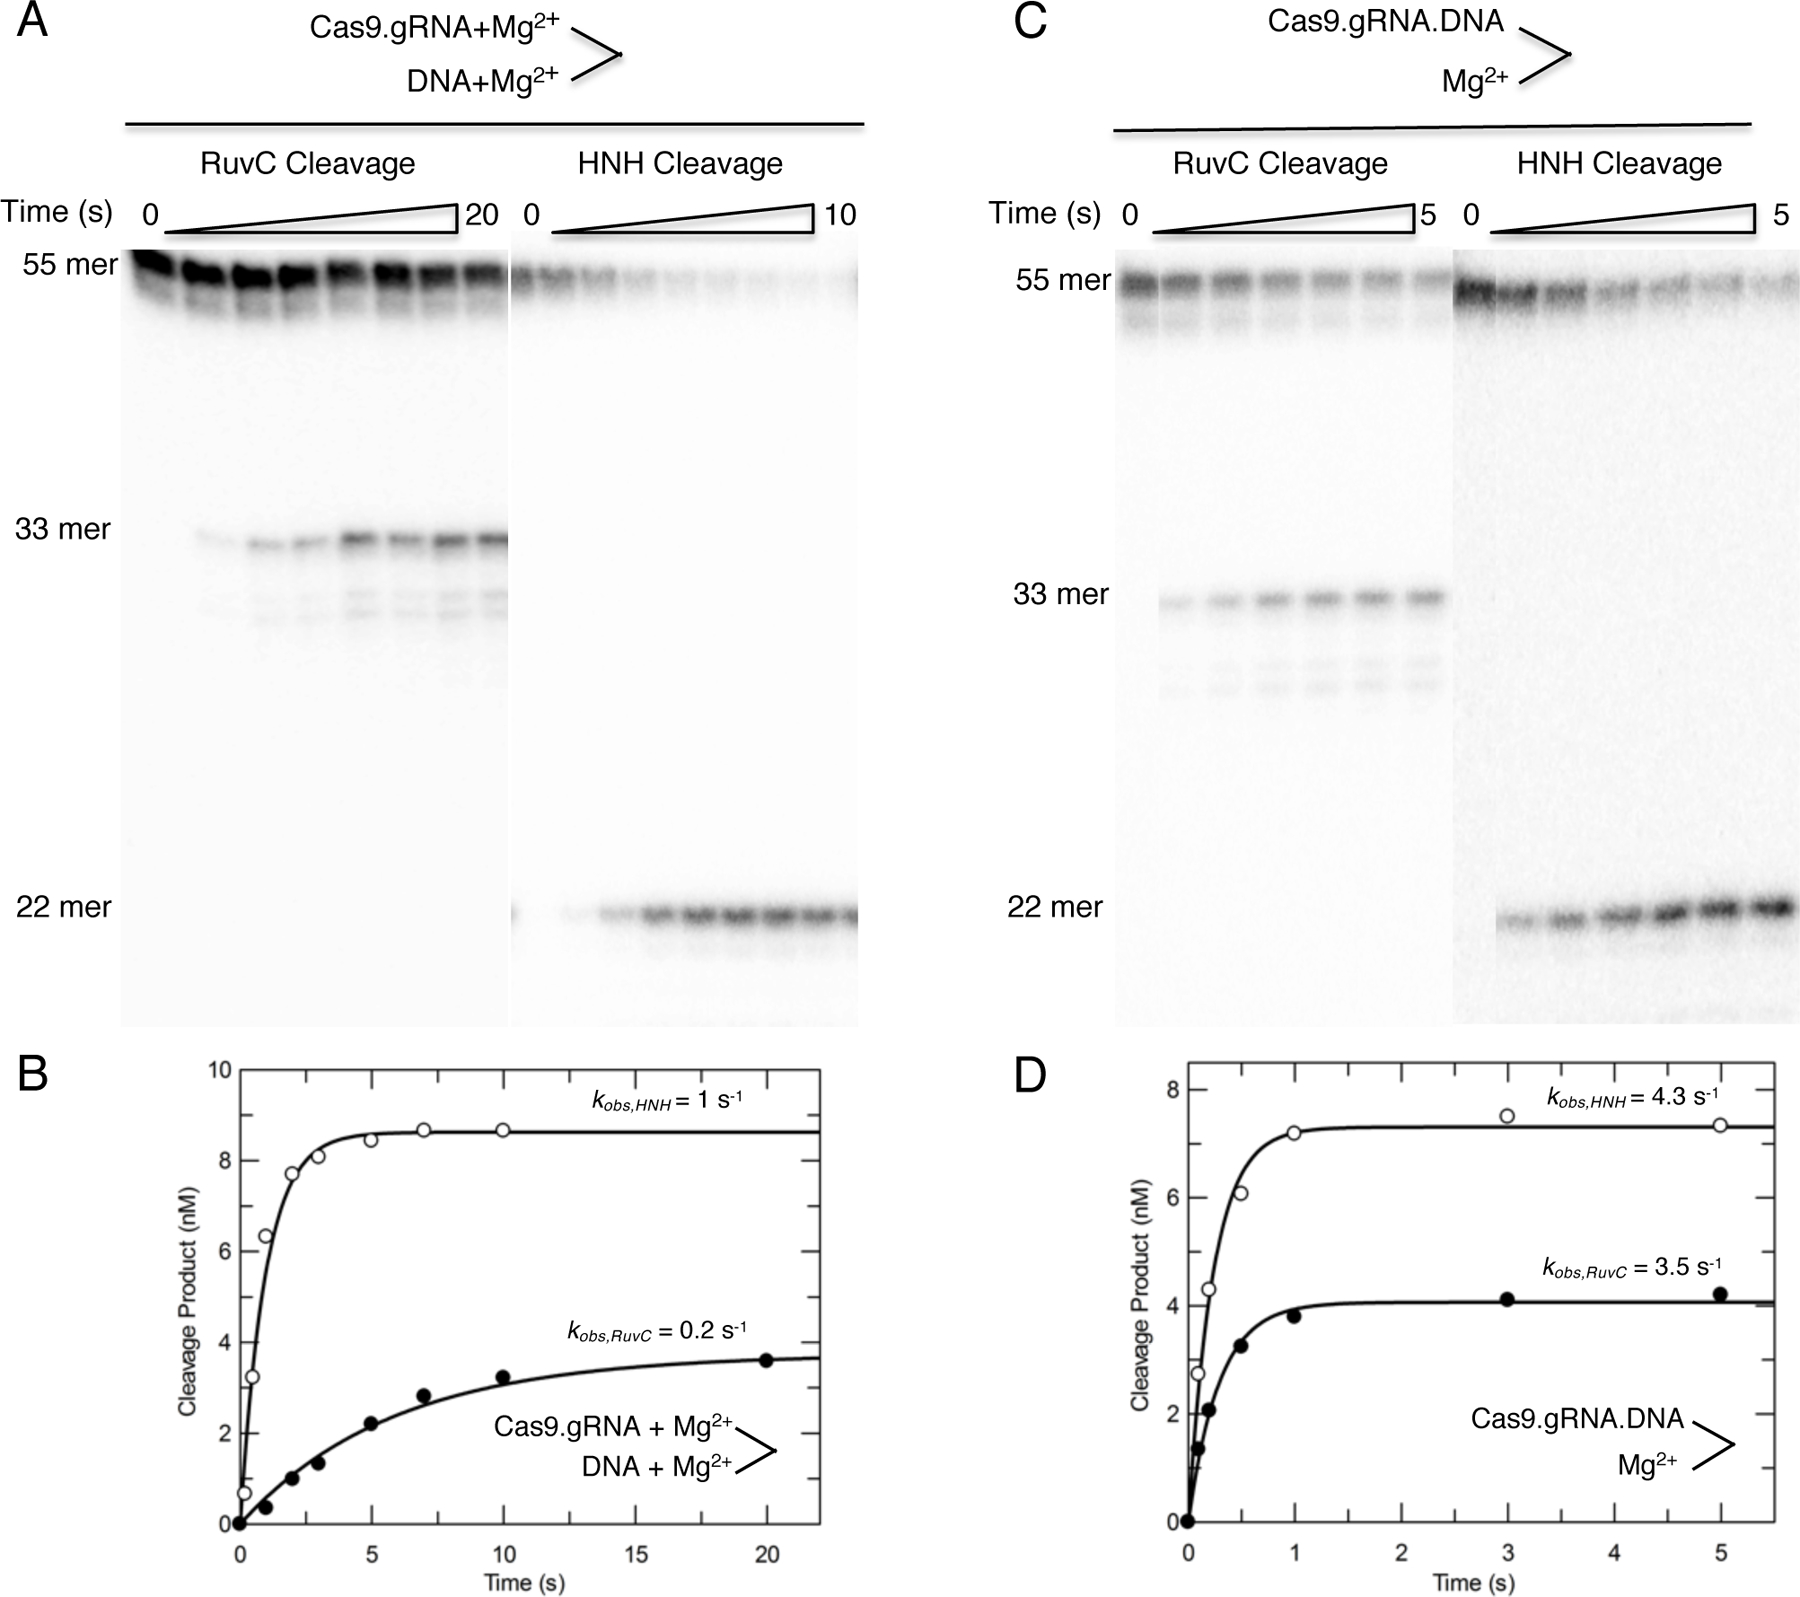
(A) The HNH and RuvC time dependence experiments in Figure 5 were repeated over a shorter time scale. Cas9.gRNA was mixed simultaneously with DNA and Mg2+ to initiate the cleavage reaction. The scheme is shown above the gel image. (B) The plot of product formation as function of time was fit by a single-exponential equation to define the cleavage rates of 1 s−1 and 0.2 s−1 for the HNH and RuvC domains, respectively. (C) The experiments in (A) were repeated; however, Cas9.gRNA was preincubated with DNA for 30 min in the absence of Mg2+ followed by addition of Mg2+ to initiate the reaction. The scheme is shown above the gel image. (D) The plot of product formation as function of time was fit by a single-exponential equation to define the cleavage rates of 4.3 s−1 and 3.5 s−1 for the HNH and RuvC domains, respectively. These figures are adapted from Gong et al. 2018.
| (Equation 4) |
In the second case, the experiment is performed according to Table 5.
Table 5.
Time dependence cleavage assay using the γ−32P-labeled DNA duplex
| Syringe A | Stock concentration | Final concentration | Volume (𝜇L) |
|---|---|---|---|
| DEPC-H2O | – | – | 66 |
| Cleavage Buffer | 5X | 1X | 20 |
| SpyCas9 | 10 𝜇M | 200 nM | 2 |
| Guild RNA | 10 𝜇M | 200 nM | 2 |
| Duplex substrate | 0.5 𝜇M | 20 nM | 4 |
| Total volume | 100 | ||
| Incubate Cas9.gRNA for 10 min at room temperature, and then add DNA and incubate Cas9.gRNA.DNA for 30 min at 37°C. | |||
| Syringe B | Stock concentration | Final concentration | Volume (𝜇L) |
| DEPC-H2O | – | – | 60 |
| Cleavage Buffer | 5X | 1X | 20 |
| MgCl2 | 100 mM | 20 mM | 20 |
| Total volume | 100 | ||
-
7
Specifically, preincubate Cas9.gRNA with DNA for 30 min to form Cas9.gRNA.DNA complex first in the absence of Mg2+.
-
8
Then, start the reaction by the addition of 10 mM Mg2+.
-
9
Use rapid mixing in the timescale from 0.125 to 5 sec for both HNH and RuvC cleavage assays.
-
10
Stop the reaction and analyze the results using the protocol in 3.1 and 3.2. Fit the data to a single-exponential equation to define the cleavage rates for the HNH and RuvC domains, respectively (Figure 6C–D).
Our time dependence of HNH and RuvC cleavages showed the cleavage rates of the HNH and RuvC domains are 4.3 s−1 and 3.5 s−1, respectively.
-
11
Compare the rates of cleavage observed after simultaneously mixing DNA, Mg2+ and Cas9.gRNA to initiation the reaction with the results of an experiment where Cas9.gRNA and DNA were allowed to equilibrate for 30 min prior to initiating the reaction by adding Mg2+.
We found that the observed faster HNH and RuvC cleavage rates if the Cas9.gRNA.DNA complex was allowed to equilibrate before adding Mg2+. These data suggests that R-loop formation, not the chemistry step, is rate-limiting step.
6. Stopped-flow method
We used a stopped-flow assay to directly measure the rate of R-loop formation or DNA unwinding.
Perform the stopped flow measurement according to Table 6 by rapidly mixing 500 nM Cas9.gRNA complex (Syringe A) with varying concentrations of 2-AP labeled DNA duplex (Syringe B) in the absence of Mg2+. The final concentrations of reactants are 500 nM Cas9.gRNA (A280 measured), and 100–500 nM variable concentrations of DNA substrate.
Because the 2-AP fluorescence signal is quenched by base stacking in the DNA duplex but not in its single-stranded form, we can measure the rate of R-loop formation by recording fluorescence intensity changes using an AutoSF-120 stopped-flow instrument (KinTek Corp., Austin, TX, USA).
Excite the fluorophore at 315 nm and monitor the fluorescence change at 340 (390) nm using a single band-pass filter with a 26 (18) nm bandwidth (Semrock).
Fit the data to a double-exponential equation to obtain R-loop formation rates of ~1 s−1 and 0.3 s−1 for the fast and slow phases, respectively (Fig 6). The trace of fluorescence change upon R-loop formation shows two sequential increases in fluorescence, suggesting two sequential unwinding events.
Table 6.
R-loop formation measurement using the 2-AP-labeled DNA duplex
| Syringe A | Stock concentration | Final concentration | Volume (𝜇L) |
|---|---|---|---|
| DEPC-H2O | – | – | 180 |
| Cleavage Buffer | 5X | 1X | 60 |
| SpyCas9 | 10 𝜇M | 1 𝜇M | 30 |
| Guild RNA | 10 𝜇M | 1 𝜇M | 30 |
| Total volume | 300 | ||
| Incubate for 10 min at room temperature. | |||
| Syringe B | Stock concentration | Final concentration | Volume (𝜇L) |
| DEPC-H2O | – | – | 234, 228, 222, 210 |
| Cleavage Buffer | 5X | 1X | 60 |
| Duplex substrate2-AP | 10 𝜇M | 0.2, 0.4, 0.6, 1 𝜇M | 6, 12, 18, 30 |
| Total volume | 300 | ||
7. Analyzing data using KinTek Explorer
There is insufficient space here to describe how to enter and fit data using KinTek Explorer software. Rather, the reader is referred to online tutorials and instruction manuals available at www.kintekexplorer.com and to prior publications (Johnson et al., 2009a, Johnson et al., 2009b). Basically, the method involves three steps: (a) enter a model using a simple text editor; (b) define each experiment by specifying the starting concentrations, order of addition of reactants, and then define an output observable function to express mathematically what is being measured; and (c) find a set of rate constants and output scaling factors that fit the data based on nonlinear regression. In essence, the methods parallel conventional data fitting in that one begins with a model that provides a set of equations to define the time course of reaction. However, by simulation the equations are solved numerically so we bypass the need to make approximations to derive equations. Moreover, we fit multiple experiments simultaneously and data fitting provides estimates for intrinsic rate constants based on the model. By simultaneously fitting fluorescence stopped-flow and rapid mixing quench-flow data we provide a rigorous interpretation of the fluorescence signal by showing how it is correlated with measurable chemical reaction. For example, in studies on HIV reverse transcriptase, such analysis resolved a 50-year old controversy over the role of induced-fit in enzyme specificity (Kellinger and Johnson, 2010, Kellinger and Johnson, 2011).
Enter each rate estimated from the above experiments into a single unifying model using global data fitting, and then evaluate critically how well each rate constant is constrained by the data. This is based on confidence contour analysis where the extent to which each rate constant and scaling factor is constrained by the data is rigorously evaluated.
It is often ambiguous to interpret the change of fluorescence signal, especially when reactions are seen to be biphasic. In order to overcome these limitations, we simultaneously fit the data in Figure 7 using KinTek Explorer. In the process of data fitting, the changes in fluorescence were correlated with measurable chemical reactions for HNH and RuvC cleavage. We also include the information from Fig 5C into our unifying model (scheme 1). If the DNA is allowed to equilibrate with enzyme before adding Mg2+, cleavage is faster than R-loop formation.
Figure 7.
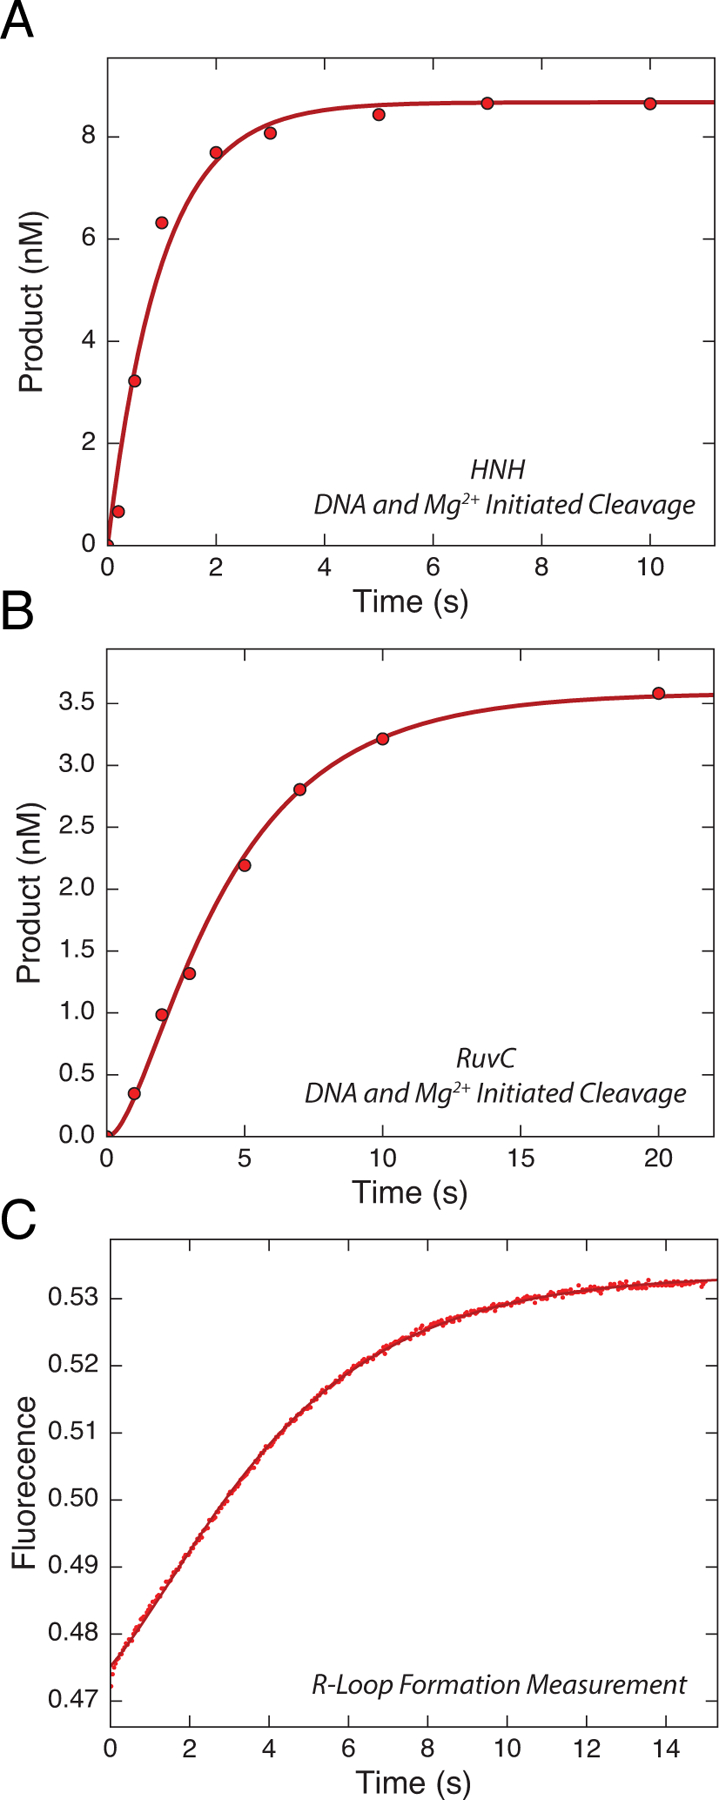
Analyzing and fitting the data globally using KinTek Explorer. (A) and (B) Time dependence of HNH and RuvC cleavage, measured in Fig 5A. (C) R-loop formation was measured by mixing Cas9.gRNA with DNA, where 2-AP was incorporated at position −9 nt distal to the PAM on the NTS, using stopped-flow fluorescence methods. The increase of fluorescence intensity as a function of time was biphasic defining two steps in R-loop formation. By inputting the rates of (A)-(C) into KinTek Explorer we were able to globally fit to the model shown in scheme 1. These figures are adapted from Gong et al. 2018. The KinTek Explorer mechanism file containing these data is included as a supplement.
Figure 5.
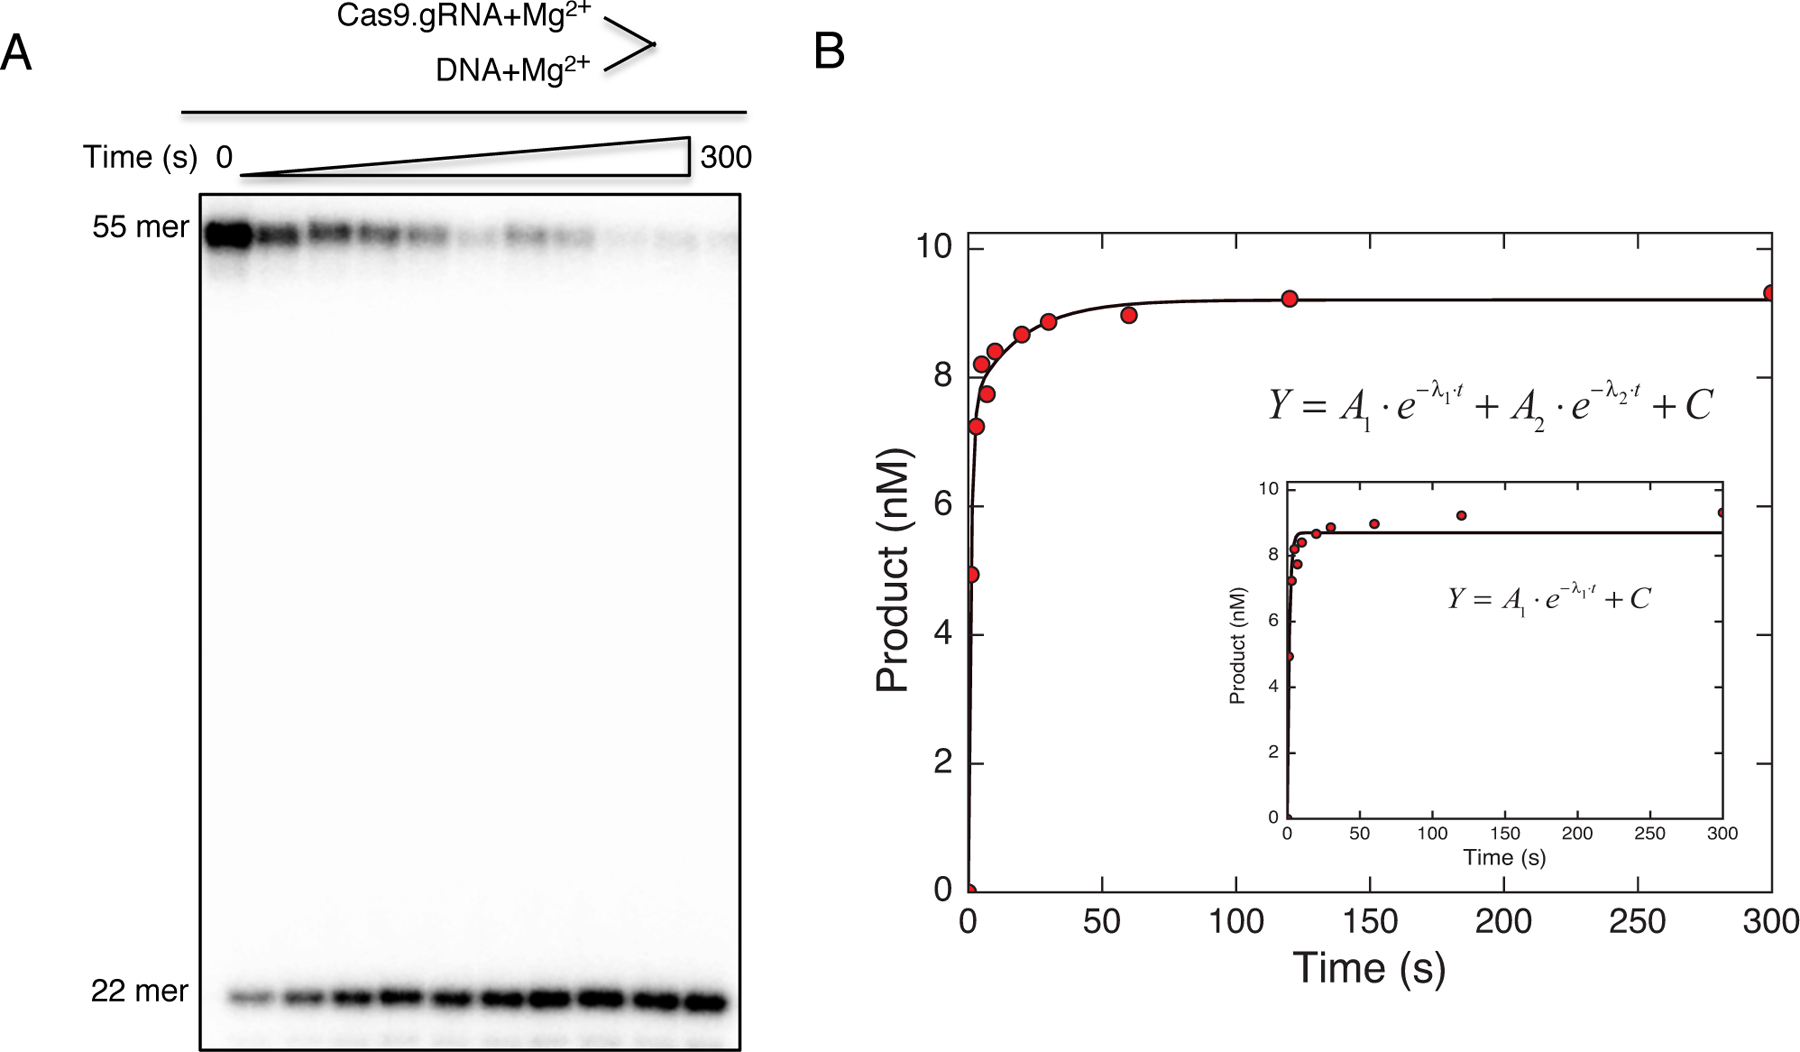
(A) Cas9 cleavage pioneer assay was started by mixing radiolabeled DNA duplex and Mg2+ simultaneously to Cas9.gRNA, and the reaction was stopped at various time points. The scheme is shown above the gel image. (B) The plot of product formation as a function of time was fit by the double-exponential equation to obtain the cleavage rates for the initial fast phase and slow phase. Therefore, the reaction is biphasic. This figure is adapted from Gong et al. 2018.
Scheme 1.
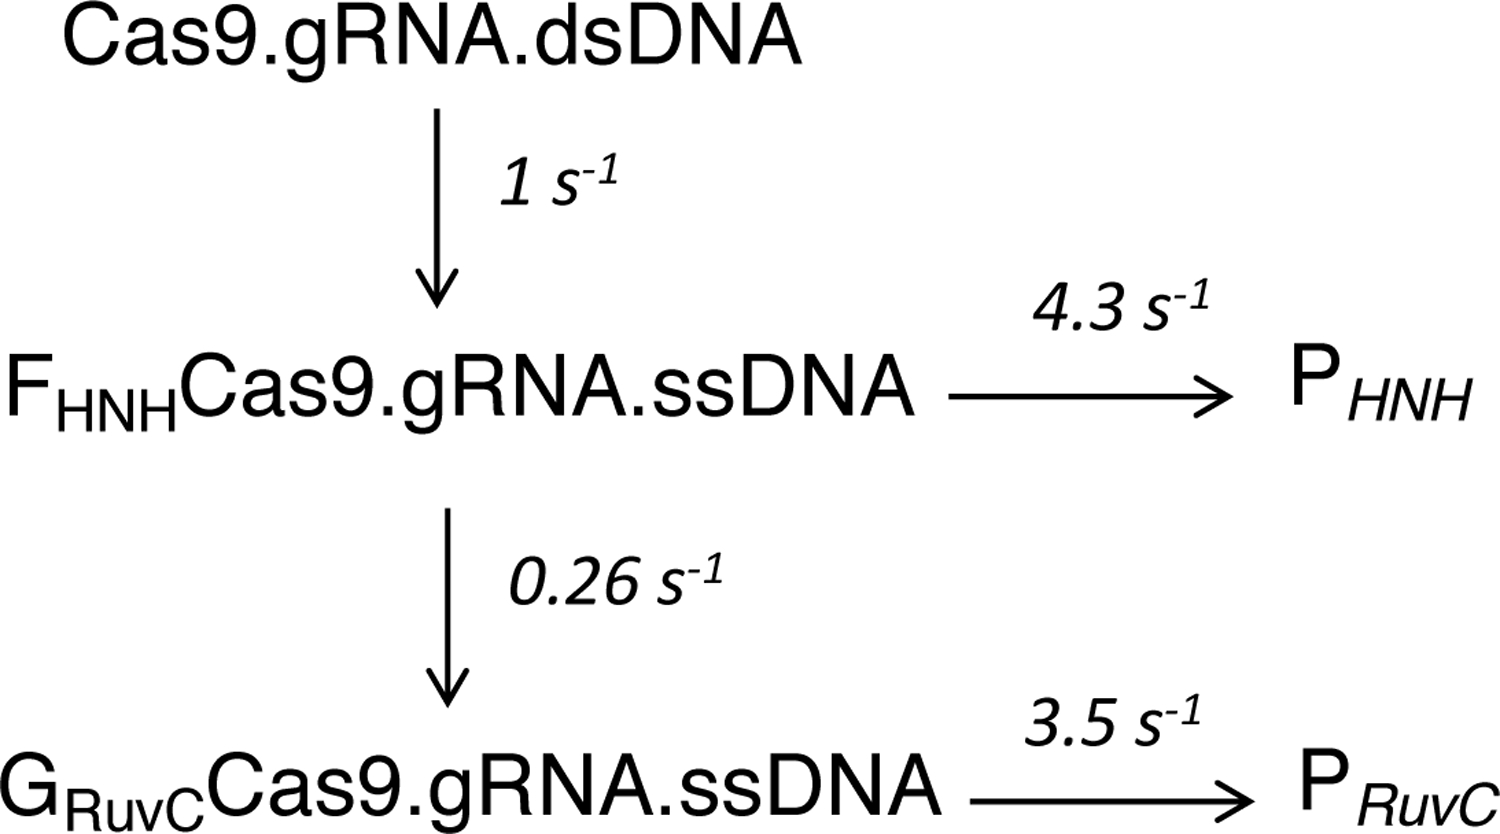
Model for two-step R-loop formation.
The kinetic constants defining Cas9 cleavage are shown in Scheme 1 derived by using the KinTek Explorer software (KinTek-Corp. Austin, TX, USA). Confidence contour analysis is used to investigate whether the parameters are well constrained by the data. The parameters were well constrained in our studies.
8. Conclusion
The comprehensive analysis provided here allows definition of each step in the reaction sequence of Cas9 and afforded quantitative estimates of the rates of each reaction. It is especially important to measure the rates of the DNA cleavage reactions in parallel with measurements of the rates of R-loop formation or other fluorescence-based signals. Otherwise, one is left to attempt to interpret the results of fluorescence measurements not knowing whether the signals represent changes occurring before or after the cleavage reaction. The data clearly define the kinetics of R-loop formation followed by HNH and RuvC cleavage. Kinetic measurements performed as described here will help define the specificity and cleavage rates of Cas9 orthologs and aid in the design of higher fidelity variants.
Supplementary Material
Acknowledgments:
This work was supported by Welch Foundation grants F-1604 (to K.A.J.) and F-1938 (to D.W.T.). D.W.T. is a CPRIT Scholar supported by the Cancer Prevention and Research Institute of Texas (RR160088).
Abbreviations:
- CRISPR
Clustered Regularly Interspaced Short Palindromic Repeats
- Cas
CRISPR associated
- Cas9
CRISPR associated protein 9
- gRNA
guide RNA
- HNH
an endonuclease domain named for characteristic histidine and asparagine residues
- RuvC
an endonuclease domain named for an E. coli protein involved in DNA repair
- 2-AP
2-aminopurine
- oligo
oligonucleotide
- nt
nucleotides
- dCas9
catalytically inactive Cas9
Footnotes
Financial conflict of interest statement: KAJ is President of KinTek Corporation, which provided the stopped-flow and quench-flow instruments and KinTek Explorer software used in this study.
References
- Anders C and Jinek M (2014) ‘In vitro enzymology of Cas9’, Methods Enzymol, 546, pp. 1–20. [DOI] [PMC free article] [PubMed] [Google Scholar]
- Anders C, Niewoehner O, Duerst A and Jinek M (2014) ‘Structural basis of PAM-dependent target DNA recognition by the Cas9 endonuclease’, Nature, 513(7519), pp. 569–73. [DOI] [PMC free article] [PubMed] [Google Scholar]
- Chen B, Gilbert LA, Cimini BA, Schnitzbauer J, Zhang W, Li GW, Park J, Blackburn EH, Weissman JS, Qi LS and Huang B (2013) ‘Dynamic imaging of genomic loci in living human cells by an optimized CRISPR/Cas system’, Cell, 155(7), pp. 1479–91. [DOI] [PMC free article] [PubMed] [Google Scholar]
- Doudna JA and Charpentier E (2014) ‘Genome editing. The new frontier of genome engineering with CRISPR-Cas9’, Science, 346(6213), pp. 1258096. [DOI] [PubMed] [Google Scholar]
- Gilbert LA, Larson MH, Morsut L, Liu Z, Brar GA, Torres SE, Stern-Ginossar N, Brandman O, Whitehead EH, Doudna JA, Lim WA, Weissman JS and Qi LS (2013) ‘CRISPR-mediated modular RNA-guided regulation of transcription in eukaryotes’, Cell, 154(2), pp. 442–51. [DOI] [PMC free article] [PubMed] [Google Scholar]
- Gong S, Yu HH, Johnson KA and Taylor DW (2018) ‘DNA Unwinding Is the Primary Determinant of CRISPR-Cas9 Activity’, Cell Rep, 22(2), pp. 359–371. [DOI] [PMC free article] [PubMed] [Google Scholar]
- Hsu PD, Lander ES and Zhang F (2014) ‘Development and applications of CRISPR-Cas9 for genome engineering’, Cell, 157(6), pp. 1262–78. [DOI] [PMC free article] [PubMed] [Google Scholar]
- Jiang F, Taylor DW, Chen JS, Kornfeld JE, Zhou K, Thompson AJ, Nogales E and Doudna JA (2016) ‘Structures of a CRISPR-Cas9 R-loop complex primed for DNA cleavage’, Science, 351(6275), pp. 867–71. [DOI] [PMC free article] [PubMed] [Google Scholar]
- Jiang F, Zhou K, Ma L, Gressel S and Doudna JA (2015) ‘STRUCTURAL BIOLOGY. A Cas9-guide RNA complex preorganized for target DNA recognition’, Science, 348(6242), pp. 1477–81. [DOI] [PubMed] [Google Scholar]
- Jinek M, East A, Cheng A, Lin S, Ma E and Doudna J (2013) ‘RNA-programmed genome editing in human cells’, Elife, 2, pp. e00471. [DOI] [PMC free article] [PubMed] [Google Scholar]
- Jinek M, Jiang F, Taylor DW, Sternberg SH, Kaya E, Ma E, Anders C, Hauer M, Zhou K, Lin S, Kaplan M, Iavarone AT, Charpentier E, Nogales E and Doudna JA (2014) ‘Structures of Cas9 endonucleases reveal RNA-mediated conformational activation’, Science, 343(6176), pp. 1247997. [DOI] [PMC free article] [PubMed] [Google Scholar]
- Johnson KA (1995) ‘Rapid quench kinetic analysis of polymerases, adenosinetriphosphatases, and enzyme intermediates’, Methods Enzymol, 249, pp. 38–61. [DOI] [PubMed] [Google Scholar]
- Johnson KA, Simpson ZB and Blom T (2009a) ‘FitSpace explorer: an algorithm to evaluate multidimensional parameter space in fitting kinetic data’, Anal Biochem, 387(1), pp. 30–41. [DOI] [PubMed] [Google Scholar]
- Johnson KA, Simpson ZB and Blom T (2009b) ‘Global kinetic explorer: a new computer program for dynamic simulation and fitting of kinetic data’, Anal Biochem, 387(1), pp. 20–9. [DOI] [PubMed] [Google Scholar]
- Kellinger MW and Johnson KA (2010) ‘Nucleotide-dependent conformational change governs specificity and analog discrimination by HIV reverse transcriptase’, Proc Natl Acad Sci U S A, 107(17), pp. 7734–9. [DOI] [PMC free article] [PubMed] [Google Scholar]
- Kellinger MW and Johnson KA (2011) ‘Role of induced fit in limiting discrimination against AZT by HIV reverse transcriptase’, Biochemistry, 50(22), pp. 5008–15. [DOI] [PMC free article] [PubMed] [Google Scholar]
- Knight SC, Xie L, Deng W, Guglielmi B, Witkowsky LB, Bosanac L, Zhang ET, El Beheiry M, Masson JB, Dahan M, Liu Z, Doudna JA and Tjian R (2015) ‘Dynamics of CRISPR-Cas9 genome interrogation in living cells’, Science, 350(6262), pp. 823–6. [DOI] [PubMed] [Google Scholar]
- Larson MH, Gilbert LA, Wang X, Lim WA, Weissman JS and Qi LS (2013) ‘CRISPR interference (CRISPRi) for sequence-specific control of gene expression’, Nat Protoc, 8(11), pp. 2180–96. [DOI] [PMC free article] [PubMed] [Google Scholar]
- Long C, Li H, Tiburcy M, Rodriguez-Caycedo C, Kyrychenko V, Zhou H, Zhang Y, Min YL, Shelton JM, Mammen PPA, Liaw NY, Zimmermann WH, Bassel-Duby R, Schneider JW and Olson EN (2018) ‘Correction of diverse muscular dystrophy mutations in human engineered heart muscle by single-site genome editing’, Sci Adv, 4(1), pp. eaap9004. [DOI] [PMC free article] [PubMed] [Google Scholar]
- Nishimasu H, Cong L, Yan WX, Ran FA, Zetsche B, Li Y, Kurabayashi A, Ishitani R, Zhang F and Nureki O (2015) ‘Crystal Structure of Staphylococcus aureus Cas9’, Cell, 162(5), pp. 1113–26. [DOI] [PMC free article] [PubMed] [Google Scholar]
- Nishimasu H, Ran FA, Hsu PD, Konermann S, Shehata SI, Dohmae N, Ishitani R, Zhang F and Nureki O (2014) ‘Crystal structure of cas9 in complex with guide RNA and target DNA’, Cell, 156(5), pp. 935–49. [DOI] [PMC free article] [PubMed] [Google Scholar]
- Perez-Pinera P, Kocak DD, Vockley CM, Adler AF, Kabadi AM, Polstein LR, Thakore PI, Glass KA, Ousterout DG, Leong KW, Guilak F, Crawford GE, Reddy TE and Gersbach CA (2013) ‘RNA-guided gene activation by CRISPR-Cas9-based transcription factors’, Nat Methods, 10(10), pp. 973–6. [DOI] [PMC free article] [PubMed] [Google Scholar]
- Qi LS, Larson MH, Gilbert LA, Doudna JA, Weissman JS, Arkin AP and Lim WA (2013) ‘Repurposing CRISPR as an RNA-guided platform for sequence-specific control of gene expression’, Cell, 152(5), pp. 1173–83. [DOI] [PMC free article] [PubMed] [Google Scholar]
- Xiao-Jie L, Hui-Ying X, Zun-Ping K, Jin-Lian C and Li-Juan J (2015) ‘CRISPR-Cas9: a new and promising player in gene therapy’, J Med Genet, 52(5), pp. 289–96. [DOI] [PubMed] [Google Scholar]
Associated Data
This section collects any data citations, data availability statements, or supplementary materials included in this article.


