

Abstract
Melanoma is a malignancy with poor prognosis. Its incidence rate has been on the rise and it poses high health and economic challenges to different populations. Photothermal therapy (PTT) served as an effective local therapy in treating various tumors, particularly cutaneous carcinoma like melanoma. To fully understand the mechanisms of tumor cell death induced by PTT, we investigated gene expression and immune cells compositions of B16-F10 tumors after PTT treatment. A total of 256 differentially expressed genes (DEGs) were identified, with 215 being downregulated and 41 upregulated by PTT. Functional annotation showed that most DEGs involved in immune response and inflammatory response. Immune cells compositions inference revealed changes in many immune cells including regulatory T cells, M2 macrophage and B cells after PTT treatment. Our results help delineate the mechanism of cell death at the transcriptional level triggered by non-invasive PTT treatment of melanoma without exogenous light absorbing agents.
Keywords: cell death, immune microenvironment, melanoma, photothermal therapy, transcriptome
Graphical Abstract
1 |. INTRODUCTION
Cutaneous melanoma is a deadly malignancy of melanocytes; it has shown an increasing incidence rate and has posed high medical and economic challenges among different populations [1, 2]. Progresses in diagnosis and treatment of melanoma have been made in the past decades [3, 4]. However, surgical removal, radiotherapy and chemotherapy are still the primary treatments [5]. Although those treatments have achieved magnificent successes, there are also some inadequacies and limitations. In most situations, the prioritized therapeutic goal is the surgical removal of the primary tumors. When direct surgical removal is not feasible, many modified treatments or a combination of different methods have been applied [6]. Photothermal therapy (PTT) has been an alternative for local treatment of melanoma [7].
PTT commonly transforms near-infrared (NIR) laser energy to heat using photothermal agents or nanoparticles to ablate tumor cells, which are more sensitive to the increased temperature than normal cells [8]. NIR light falls into the tissue optical window for biomedical imaging and therapy due to the low optical attenuation in this spectral range (700–900 nm). Because of the nature of melanin (in melanocytes), the melanoma cell itself can efficiently convert NIR irradiation energy to heat, similar in effect to nanoparticles and other exogenous light heat-conversion agents. Thus, NIR irradiation only causes heating within melanoma tissue, leading to precise treatment with little damage and irritation to the surrounding normal skin tissue. Our previous studies have demonstrated that PTT combined with immunological adjuvants can be a promising therapy to treat cutaneous granuloma and refractory cutaneous warts [9, 10]. Furthermore, PTT with or without immunological adjuvant obtained a similar effect in treating melanoma using a mouse model (under review). In addition to killing tumor cells directly, the tumor-specific antigen released from PTT-treated tumor can trigger a systemic immune response [11, 12]. Although PTT has been successfully applied in managing various diseases and cancers, the molecular mechanisms underlying cell death triggered by PTT have not been fully delineated.
To date, the possible modes of cell death induced by PTT, including necrosis and apoptosis, have been proposed [13]. Most studies suggested necrotic tumor cell death after NIR irradiation while some researchers proposed apoptosis as the primary cell death mechanism under certain NIR irradiations [14–16]. Necrosis leads to pro-inflammatory response due to the ruptured cell membranes, followed by the release of damage-associated molecular patterns (DAMPs) [17]. In contrast, cell membrane integrity is maintained in apoptotic cells, which can be anti-inflammatory [17]. However, cellular apoptosis will transform to necrosis, a process also known as secondary necrosis, when apoptotic cells were not phagocytized immediately by phagocytes [17]. While cell death and immune responses using PTT have been studied [18, 19], the cell death mechanism, particularly at the transcriptional level, involved in NIR irradiation without exogenous heat-conversion agents in melanoma treatment has not been fully investigated.
Here, we aim to delineate the cell death mechanism by NIR irradiation of melanoma in mice using transcriptome microarray in combination with bioinformatics analysis. We compared the genome-wide gene expression changes and demonstrated the processes and pathways in which differentially expressed genes (DEGs) were involved. Furthermore, we described the immune cells compositions before and after PTT treatment.
2 |. EXPERIMENTAL
2.1 |. Melanoma mouse model
All procedures involved in the animal studies comply with the protocol of Animal Ethics Committee of Shanghai Skin Disease Hospital. B16-F10 melanoma cells were purchased from Shanghai Cell Bank (Shanghai, China) and cultured in Roswell Park Memorial Institute 1640 medium (Gibco, Thermo Fisher Scientific, Shanghai, China), containing 10% fetal bovine serum, penicillin (100 IU/mL), and streptomycin (100 μg/mL). The cells were passaged using trypsin–EDTA solution (0.05%/ 0.02%). The melanoma mouse model was established using C57BL/6 mice, 7 weeks old, obtained from Shanghai Laboratory Animal Center (Shanghai, China) [20]. A total of 0.1 mL of B16-F10 cell suspension (6 × 10⁶ cells/ mL) was injected subcutaneously into the of back of the animals.
2.2 |. PTT treatment
Six B16-F10 tumor bearing mice were randomly divided into two groups: Control group and PTT treatment group with three mice in each group. In the treatment group, One-time non-invasive PTT treatment was applied by an 808 nm diode laser (FC-808–1Mw-10W, New Industries Optoelectronics Technology Co., China) via an optical fiber (ML0210, Pioneer Optics Co.) with an air gap of approximately 1 cm to the recently shaved skin of the mice (0.75 W/cm2 for 10 minutes). No skin penetrating optical fibers, instrumentation or other optical boundary enhancements were used to facilitate the delivery of the 808 nm laser energy into the tumors located in the subcutaneous environment.
2.3 |. Tissue collection and RNA extraction
Six hours after PTT treatment, solid tumor tissue was collected from each mouse and placed into microtubes, then stored in liquid nitrogen immediately. RNA was extracted using the extraction kits from Gminix (Shanghai, China) according to the standard RNA extraction protocol. RNA quantity was assessed by the optical density at 260 and 280 nm (A260/A280) using the NanoDrop spectro-photometer (Thermo Scientific), and the RNA integrity was visualized by agarose gel electrophoresis. The values of A260/A280 ranged from 2.07 to 2.09 and electrophoresis showed that all samples were qualified.
2.4 |. Genome-wide gene expression signature identification
The qualified RNA was hybridized by the Affymetrix GeneChip Mouse Transcriptome Assay 1.0 following the standard manufacturer protocol. The raw data (.cel format) were used for computing an expression signal including background correction, normalization and summary. Probe sets were annotated from probe set ID to gene symbol with referencing the annotation file downloaded from Affymetrix official website (MTA-1_0.r3.na36.mm10.a1. transcript.csv.zip). Protein coding genes were extracted from the total expression signal matrix. After quality control, DEGs identification was conducted using limma package with log 2 transformed expression signal matrix. Gene with a 2-fold or greater expression change (|log2FC| > 1), and a P value less than .05, was considered as a DEG.
2.5 |. Functional annotation and pathway enrichment
For PTT treatment, gene ontology (GO) functional annotation regarding biological process (BP, 18577 terms/20 793 genes), molecular function (MF, 5333 terms/20 360 genes) and cellular component (CC, 1937 terms/20 819 genes) was performed using the ClueGO tools (v2.5.7) [21] implemented in Cytoscape (v3.5.0). Then, Kyoto encyclopedia of genes and genomes (KEGG, 324 pathways/8760 genes) pathway database and REACTOME (1666 pathways/8584 genes and 8650 reactions/8994 genes) database were used for pathway enrichment, which also enriched by ClueGO tools. The term and pathway with P value less than .05 were considered statistically significant. All databases in these annotation and enrichment were released on 8 May 2020. After annotation and enrichment, CluePedia tools (v1.5.7) was used for visualization [22].
2.6 |. PPI network analysis
To uncover the interactions among the identified DEGs, protein–protein interaction (PPI) network was constructed by Search Tool for Retrieval of Interacting Genes/Proteins (STRING, v11.0) online database. Interaction score was set to be a medium confidence of 0.4 and disconnected nodes were removed during the network construction. The network was then visualized by Cytoscape (v3.5.0). cytoHubba plugin (v0.1) in Cytoscape was used to search the hub genes from the constructed interaction network [23]. Furthermore, MCODE plugin (v1.4.2) was employed to construct hub modules with setting node score threshold of 0.2, k score of 2, and max depth of 100 [24].
2.7 |. Inference of immune cells compositions
As PTT treatment triggers systematic immune responses, depicting the change of immune cells compositions in B16-F10 tumors before and after PTT is critical to understand the immune responses. Immune cell compositions were deconvoluted by ImmuCC software [25]. Briefly, a gene expression signature matrix, consisting of 511 genes and 25 types of immune cells, including six major cell types, granulocytes, B cells, T cells, natural killer cells, dendritic cells and mono/macrophages, was downloaded from the website (https://github.com/chenziyi/ImmuCC). Then, the cells compositions of the current study were inferenced using the linear support vector regression method with 100 permutations. The composition difference of each cell type between control and PTT group was tested by Student’s t test.
3 |. RESULTS
3.1 |. DEGs identification
In order to investigate the effect of PTT on tumor cells at the transcriptional level, the whole-genome wide expression states among these two groups (control and PTT) were investigated. Each group has three samples. Average Pearson correlation coefficients were 0.991 and 0.986 within-group and hierarchical heatmap indicated a distinct expression difference between control and PTT groups (Figure 1A). After removing non-coding genes, a total of 22 451 protein coding genes were annotated for DEG identification from MTA probe sets. When comparing the PTT group with control group, a total of 256 DEGs were identified, including 215 downregulated and 41 upregulated DEGs (Figure 1B). DAMPs of various heat shock proteins (HSPs), including Dnaja4, Dnajb1, Hspa1a, Hspa1b, Hspb1 and Hsph1, were upregulated when compared with the control group (Figure 2). However, all the identified differentially expressed chemokines, including Cxcr4, Ccl5, Ccl8, Cxcl9 and Ccl12, were downregulated (Figure 1C). Moreover, toll-like receptors (TLRs), including Tlr3, Tlr7 and Tlr8, were also downregulated (Figure 1C, Table S1).
FIGURE 1.

Differentially expressed genes (DEGs) identification. A, Overview of gene expression states estimated by Pearson correlation coefficients among different samples. B, DEGs (photothermal therapy [PTT] vs control). C, Volcano plots with all analyzed coding genes. Black dotted lines indicate the thresholds of fold change and P value, respectively. D, Heatmap of DEGs. Red and Blue colors represent upregulated and downregulated gens, respectively
FIGURE 2.

Gene ontology functional annotation at three different levels. A, biological process (BP), B, molecular function (MF), and C, cellular component (CC), for differentially expressed genes (DEGs) identified from photothermal therapy (PTT) vs control group. Each node represents a gene ontology (GO) term, and nodes with the same color were in the same group. Edge between two nodes mirrors two GO terms shared same DEGs
3.2 |. Functional annotation and pathway enrichment of DEGs
In order to demonstrate functions of DEGs, GO functional annotation was performed at three levels, including BP, MF and CC. In the BP level, 77 significant GO terms were classified into 14 groups, including defense response to virus (31.35%), immunoglobulin receptor activity (13.54%), inflammatory response (11.46%), regulation of leukocyte apoptotic process (9.38%), myeloid leukocyte activation (9.38%), chaperone-mediated protein folding (5.21%), neutrophil chemotaxis (4.17%) and innate immune response (1.04%), (Figure 2A, Table S2). In particular, inflammatory response (39 DEGs) and innate immune response (37 DEGs) were the top two annotated terms with P value of 2.74 × 10⁻¹⁶ and 1.10 × 10⁻¹², respectively (Table 1). GO analysis of MF showed that 14 significant DEGs were annotated, which mainly included immunoglobulin receptor activity, chemokine activity, pattern recognition receptor activity and negative regulation of MAP kinase activity (Figure 2B, Table S2). Finally, 10 significant GO terms were identified, including lysosome, lytic vacuole and intrinsic/ integral component of endoplasmic reticulum membrane at the CC level.
TABLE 1.
Top 15 GO terms in BP level
| GO ID (BP) | GO Term | P value | % Genesa | Numberb |
|---|---|---|---|---|
| GO:0006954 | Inflammatory response | 2.74 × 10⁻¹⁶ | 5.11 | 39 |
| GO:0045087 | Innate immune response | 1.10 × 10⁻¹² | 4.14 | 37 |
| GO:0071219 | Cellular response to molecule of bacterial origin | 1.47 × 10−07 | 5.73 | 15 |
| GO:0071216 | Cellular response to biotic stimulus | 4.73 × 10−07 | 5.23 | 15 |
| GO:0071222 | Cellular response to lipopolysaccharide | 5.82 × 10−07 | 5.53 | 14 |
| GO:0032103 | Positive regulation of response to external stimulus | 8.44 × 10−07 | 4.20 | 18 |
| GO:0051607 | Defense response to virus | 8.44 × 10−07 | 5.36 | 14 |
| GO:0019763 | Immunoglobulin receptor activity | 1.50 × 10−06 | 44.44 | 4 |
| GO:0061077 | Chaperone-mediated protein folding | 2.08 × 10−06 | 12.50 | 7 |
| GO:0009615 | Response to virus | 2.70 × 10−06 | 4.55 | 15 |
| GO:0050727 | Regulation of inflammatory response | 2.82 × 10−06 | 4.27 | 16 |
| GO:0002221 | Pattern recognition receptor signaling pathway | 4.26 × 10−06 | 6.76 | 10 |
| GO:0019770 | IgG receptor activity | 4.70 × 10−06 | 75.00 | 3 |
| GO:0045356 | Positive regulation of interferon-alpha biosynthetic process | 4.70 × 10−06 | 75.00 | 3 |
| GO:0006954 | Inflammatory response | 7.79 × 10−06 | 10.29 | 7 |
Abbreviations: BP, biological process; DEG, differentially expressed genes; GO, gene ontology.
The percentage of DEGs in the GO term.
Annotated DEGs number in the GO term.
Kyoto Encyclopedia of Genes and Genomes (KEGG) and REACTOME pathway enrichments were analyzed. Fourteen significant KEGG pathways were enriched (Figure 3A), including viral protein interaction with cytokine and cytokine receptor, protein processing in endoplasmic reticulum, N-Glycan biosynthesis and toll-like receptor signaling pathway, Fc gamma R-mediated phagocytosis, and Complement and coagulation cascades. Compared with KEGG, more REACTOME pathways were enriched (Figure 3B), with nine groups of 47 pathways, which concentrated mainly on sequestering and phosphorylation Fc gamma receptors in the lipid rafts, activation of C1s, and ATP hydrolysis by HSP70. Specifically, the top two significant pathways were innate immune system including toll-like receptor cascades, complement cascade, and so on. (1.05 × 10−08 with 37 DEGs) and neutrophil degranulation (2.03 × 10−06 with 37 DEGs).
FIGURE 3.

KEGG and REACTOME pathway enrichments. Enrichments analysis regarding to A, Kyoto encyclopedia of genes and genomes (KEGG) pathways and B, REACTOME pathways. Each node represents a pathway term, and nodes with the same color were in the same group. Edge between two nodes mirrors two pathway terms shared same differentially expressed genes (DEGs)
3.3 |. PPI network construction and module analysis
In order to study the protein–protein interactions and illuminate PTT mechanisms in treating melanoma, PPI network analysis was performed in STRING online database and graphical depiction was provided using the Cytoscape tools. A PPI network with 169 nodes and 688 edges was constructed from 256 DEGs (Figure 4A). Then, the top 20 proteins, including 165 edges, were screened by cytoHubba plugin, which included Tlr7, Cd68, Ly86 and other genes (Figure 4B). Finally, the top three significant modules with MCODE scores of 17.1, 8.4 and 5.1 were identified by MCODE plugin (Figure 4C). The first module was relatively huge, nesting 19 nodes and 154 edges, and the second module included 11 nodes and 42 edges. All the genes in the first two modules were downregulated, including Tlr7, Tlr8, Cd68, Cxcl9 and so on, while five upregulated HSP-related genes were interacted in the third module.
FIGURE 4.

Protein–protein interaction (PPI) network analysis of differentially expressed genes (DEGs) identified from photothermal therapy (PTT) group. A, PPI network constructed from all DEGs of PTT group. B, Top 20 highly connected proteins. C, The first three major modules. Blue and red points represent proteins encoded by downregulated and upregulated genes, respectively
3.4 |. Immune cells compositions
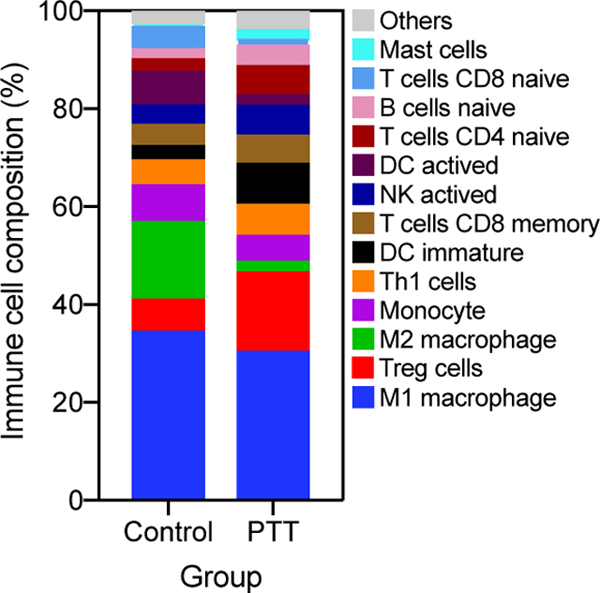
In the functional annotation and the pathway enrichment, many DEGs were enriched in immune-related processes and pathways, which prompts us to investigate the compositions of immune cells before and after PTT treatment. Among the 25 types of immune cells, 21 were detected in at least one mouse (Figure 5A, Table S3). M1 macrophage accounted for a high value ranging from 23.7% to 38.5%, and there was no difference between these two groups. However, M2 macrophage composition was significantly decreased after PTT treatment (Figure 5B). In addition, the compositions of naïve B cell (P < .05), regulatory T (Treg) cells (P = .092), CD4+ naïve T cells (P = .27) and immature dendritic cells (DC, P = .085) were trending up after PTT treatment. Furthermore, T helper 1 (Th1) cells and activated natural killer (NK) cells compositions also increased except in one PTT treated sample. Activated DC was detected in one sample with a large percentage (20.4%) compared to the other two samples (0%) in the control group. Moreover, the activated DC composition in two PTT treated samples reached 4.4% and 2.0%, respectively, indicating an increasing tendency in most samples after PTT treatment.
FIGURE 5.

Immune cells compositions deconvoluted from expression signal matrix. A, Average immune cells compositions between control and photothermal therapy (PTT) groups. B, Representative immune cells change between control and PTT groups. Data are presented as the means ± SEM. *P < .05; **P < .01
4 |. DISCUSSION
Among the various anti-tumor therapies, such as radiotherapy, molecular-targeted therapy and immunotherapy, which have been developed rapidly in recent years, PTT has become a promising modality for treating melanoma since endogenous light absorbing chromophores such as melanin in melanocytes can convert laser to heat with high efficiency [26, 27]. However, the mechanisms of PTT without exogenous agents for treating melanoma have not been fully studied. Gene expression profile can be a straightforward approach to search for responsible genes for observed immune responses. In the present study, we captured the relevant DEGs and demonstrated the associated signal pathways after PTT treatment in a melanoma bearing mice using transcriptome microarray and bioinformatics. We further determined the changes of various immune cells before and after PTT treatment.
In the present study, many HSPs coding genes, including Hsph1 (HSP105) Hsp1a and Hspa1b (HSP70), Dnaja4 and Dnajb1 (HSP40) and Hspb1 (HSP27), were significantly upregulated by PTT treatment. HSPs are proteins with protective effects, which overexpress when cells undergo stresses, such as heat, toxins, and heavy metal, to prevent apoptosis [28, 29]. Thus, the overexpressed HSPs help tumor cells resist heat, which hampers the death of tumor cells induced by PTT. Therefore, PTT in combination with HSPs inhibitors may improve the curative effect of PTT [30]. Many studies have been carried out to evaluate the combinational effect with either HSP inhibitors or RNA interference [31, 32]. Yang et al. and Chatterjee et al. have found that the inhibition of HSP90 could conversely increase the expression of HSP70, while inhibition of HSP70 could not increase HSP90 [33, 34]. In our study, HSP90 was not upregulated after PTT treatment, which indicates that PTT combined with HSP70 inhibitor would be a more efficient way to treat melanoma. In addition to HSPs, many hemoglobin-related genes were also upregulated, including Hbb-a1, Hbb-bs, Hbb-bt, Cyp2e1, Cyp2f1, Slc4a1 and Ahsp. We hypothesize that the upregulation of hemoglobin-related genes can be caused by the oxygen deficiency in tumor microenvironment caused by PTT treatment.
Compared with the weak immune response of traditional therapy [35], such as surgery, PTT-induced hyperthermia, can elicit systemic immune response by activating immune cells and upregulating HSP expression [36]. In our study, functional annotation and pathway analysis revealed that many genes were involved in immune responses induced by PTT treatment. A total of 37 DEGs were enriched in the innate compartment. Fc gamma receptor signaling pathway and toll-like signaling pathway were enriched, which play a critical role in response to external molecular patterns. When tumor cells were damaged by laser irradiation, tumor-associated antigens were released, which in turn activate the innate and the adaptive immune responses. In PPI network analysis, most DEGs were interacted with each other, indicating a huge biological process network, among which most of the top 20 hub genes are involved in the immune responses.
In order to further depict the immune responses after PTT treatment, we inferenced the immune cell compositions. A larger population of macrophages were found in mice both before and after PTT treatment, which was reported as the most common immune cells in solid tumors [37, 38]. Macrophages can be classified to M1 and M2 macrophages, among which M1 macrophages promote inflammation and inhibit cell proliferation, whereas M2 macrophages show a dichotomous function [39]. In tumor microenvironment, tumor-associated macrophages (TAMs) with a specific pathological context and polarization status are often M2-like macrophages. However, studies also showed that TAMs are not uniquely M2 macrophages; they can also share M1 and M2 signature polarization [40, 41]. Researchers have proved that TAMs will contribute to tumor growth and invasion by release different enzymes [42, 43]. In our study, M2 macrophages decreased remarkably after PTT treatment, indicating TAMs may be ablated by thermal effect. Dendritic cells (DCs), as the most potent antigen-presenting cells, can process tumor-associated antigens. Activated DCs composition showed an increasing trend after PTT treatment, except for a high activated DCs composition in one control mouse. We also observed an increase in activated NK cells in PTT-treated tumors, indicating that PTT is able to induce NK recruitment to activate adaptive immune response [44]. Treg cells were regarded as pro-tumor immune cells with cytotoxic T lymphocyte-associated antigen 4 (CTLA-4). In this study, we observed a large expansion of Treg after PTT treatment, which was consistent with the report by Wang et al., that PTT with single-walled carbon nanotubes increased the composition of CD4 T cells, most of which are Treg cells [19]. It may be a protection mechanism of organism to avoid strong immune response. PTT may increase Treg cells, and also upregulate other anti-tumor genes. However, the overall anti-tumor effect of PTT has been proven to be positive. Therefore, it is desirable to combine PTT with checkpoint inhibitors, such as anti-CTLA-4 to improve the efficacy of PTT in treating tumors.
5 |. CONCLUSION
In summary, a total of 256 DEGs were identified in melanoma bearing mice after PTT treatment, among which many HSPs and hemoglobin-related genes were upregulated. Using bioinformatics analysis, we found that many DEGs were enriched for immune response and immunological receptor activation. In addition, M2 macrophages composition decreased remarkably, indicating a PTT-potentiated anti-tumor effect, which is believed to balance the PTT-induced Treg cell increase. Therefore, this study provides further evidence the anti-tumor effects induced by PTT through the cell death mechanism at the transcriptional level in treating melanoma.
Supplementary Material
Photothermal therapy (PTT) exhibited a good outcome on melanoma.
Genes expressions and Immune cell compositions were quantified after PTT treatment.
Most of differentially expressed genes involved in immune response and inflammatory response.
M2 macrophage composition was decreased after PTT treatment.
ACKNOWLEDGMENTS
This work was supported in part by the National Natural Science Foundation of China (81472796, 81872212), General project of Shanghai Municipal Science and Technology Commission (20ZR1449400), the U.S. National Cancer Institute (R01CA205348), and the Oklahoma Center for the Advancement of Science and Technology (HR16-085).
Funding information
General project of Shanghai Municipal Science and Technology Commission, Grant/Award Number: 20ZR1449400; National Natural Science Foundation of China, Grant/Award Numbers: 81472796, 81872212; Oklahoma Center for the Advancement of Science and Technology, Grant/Award Number: HR16-085; the US. National Cancer Institute, Grant/ Award Number: R01CA205348
Footnotes
DATA AVAILABILITY STATEMENT
The data that support the findings of this study are available from the corresponding author upon reasonable request.
SUPPORTING INFORMATION
Additional supporting information may be found online in the Supporting Information section at the end of this article.
CONFLICTS OF INTEREST
The authors declare no potential conflict of interest.
REFERENCES
- [1].Garbe C, Eigentler TK, Keilholz U, Hauschild A, Kirkwood JM, Oncologist 2011, 16, 5. [DOI] [PMC free article] [PubMed] [Google Scholar]
- [2].Karimkhani C, Green AC, Nijsten T, Weinstock MA, Dellavalle RP, Naghavi M, Fitzmaurice C, Br. J. Dermatol 2017, 177, 134. [DOI] [PMC free article] [PubMed] [Google Scholar]
- [3].Schadendorf D, Fisher DE, Garbe C, Gershenwald JE, Grob JJ, Halpern A, Herlyn M, Marchetti MA, McArthur G, Ribas A, Roesch A, Hauschild A, Nat. Rev. Dis. Primers 2015, 1, 15003. [DOI] [PubMed] [Google Scholar]
- [4].Landi MT, Bishop DT, MacGregor S, Machiela MJ, Stratigos AJ, Ghiorzo P, Brossard M, Calista D, Choi J, Fargnoli MC, Zhang T, Rodolfo M, Trower AJ, Menin C, Martinez J, Hadjisavvas A, Song L, Stefanaki I, Scolyer R, Yang R, Goldstein AM, Potrony M, Kypreou KP, Pastorino L, Queirolo P, Pellegrini C, Cattaneo L, Zawistowski M, Gimenez-Xavier P, Rodriguez A, Elefanti L, Manoukian S, Rivoltini L, Smith BH, Loizidou MA, Del Regno L, Massi D, Mandala M, Khosrotehrani K, Akslen LA, Amos CI, Andresen PA, Avril MF, Azizi E, Soyer HP, Bataille V, Dalmasso B, Bowdler LM, Burdon KP, Chen WV, Codd V, Craig JE, Debniak T, Falchi M, Fang S, Friedman E, Simi S, Galan P, Garcia-Casado Z, Gillanders EM, Gordon S, Green A, Gruis NA, Hansson J, Harland M, Harris J, Helsing P, Henders A, Hocevar M, Hoiom V, Hunter D, Ingvar C, Kumar R, Lang J, Lathrop GM, Lee JE, Li X, Lubinski J, Mackie RM, Malt M, Malvehy J, McAloney K, Mohamdi H, Molven A, Moses EK, Neale RE, Novakovic S, Nyholt DR, Olsson H, Orr N, Fritsche LG, Puig-Butille JA, Qureshi AA, Radford-Smith GL, Randerson-Moor J, Requena C, Rowe C, Samani NJ, Sanna M, Schadendorf D, Schulze HJ, Simms LA, Smithers M, Song F, Swerdlow AJ, van der Stoep N, Kukutsch NA, Visconti A, Wallace L, Ward SV, Wheeler L, Sturm RA, Hutchinson A, Jones K, Malasky M, Vogt A, Zhou W, Pooley KA, Elder DE, Han J, Hicks B, Hayward NK, Kanetsky PA, Brummett C, Montgomery GW, Olsen CM, Hayward C, Dunning AM, Martin NG, Evangelou E, Mann GJ, Long G, Pharoah PDP, Easton DF, Barrett JH, Cust AE, Abecasis G, Duffy DL, Whiteman DC, Gogas H, De Nicolo A, Tucker MA, Newton-Bishop JA, Geno MELC, Investigators MQ,Q, Group AMS, andMe, Group SDHS, Investigators IB, Essen-Heidelberg I, Investigators A, MelaNostrum C, Peris K, Chanock SJ, Demenais F, Brown KM, Puig S, Nagore E, Shi J, Iles MM, Law MH, Nat. Genet 2020, 52, 494. [DOI] [PMC free article] [PubMed] [Google Scholar]
- [5].Luke JJ, Schwartz GK, Clin. Dermatol 2013, 31, 290. [DOI] [PMC free article] [PubMed] [Google Scholar]
- [6].Scheetz L, Park KS, Li Q, Lowenstein PR, Castro MG, Schwendeman A, Moon JJ, Nat. Biomed. Eng 2019, 3, 768. [DOI] [PMC free article] [PubMed] [Google Scholar]
- [7].Zhou F, Li X, Naylor MF, Hode T, Nordquist RE, Alleruzzo L, Raker J, Lam SS, Du N, Shi L, Wang X, Chen WR, Cancer Lett. 2015, 359, 169. [DOI] [PMC free article] [PubMed] [Google Scholar]
- [8].Goldberg SN, Gazelle GS, Mueller PR, AJR Am. J. Roentgenol 2000, 174, 323. [DOI] [PubMed] [Google Scholar]
- [9].Shi L, Luo M, Chen WR, Hu C, Zhang G, Zhang F, Chen J, Mo X, Cai Q, Yang L, Wang X, Dermatol. Ther 2016, 29, 353. [DOI] [PubMed] [Google Scholar]
- [10].Shi L, Luo M, Zhang F, Zhang L, Wang B, Liu P, Zhang Y, Zhang H, Yang D, Zhang G, Zhou F, Stepp H, Sroka R, Chen WR, Wang X, J. Biophotonics 2019, 12, e201800149. [DOI] [PubMed] [Google Scholar]
- [11].den Brok MH, Sutmuller RP, van der Voort R, Bennink EJ, Figdor CG, Ruers TJ, Adema GJ, Cancer Res. 2004, 64, 4024. [DOI] [PubMed] [Google Scholar]
- [12].Slovak R, Ludwig JM, Gettinger SN, Herbst RS, Kim HS, J. Immunother. Cancer 2017, 5, 78. [DOI] [PMC free article] [PubMed] [Google Scholar]
- [13].Melamed JR, Edelstein RS, Day ES, ACS Nano 2015, 9, 6. [DOI] [PubMed] [Google Scholar]
- [14].Mocan T, Matea CT, Cojocaru I, Ilie I, Tabaran FA, Zaharie F, Iancu C, Bartos D, Mocan L, Cancer J. 2014, 5, 679. [DOI] [PMC free article] [PubMed] [Google Scholar]
- [15].Huang X, Kang B, Qian W, Mackey MA, Chen PC, Oyelere AK, El-Sayed IH, El-Sayed MA, J. Biomed. Opt 2010, 15, 058002. [DOI] [PubMed] [Google Scholar]
- [16].Tong L, Cheng JX, Nanomedicine 2009, 4, 265. [DOI] [PubMed] [Google Scholar]
- [17].Martin SJ, Henry CM, Cullen SP, Mol Cell 2012, 46, 387. [DOI] [PubMed] [Google Scholar]
- [18].Cherukula K, Park MS, Sontyana AG, Mathew AP, Vijayan V, Bae WK, Park IK, J. Korean Med. Sci 2019, 34, e272. [DOI] [PMC free article] [PubMed] [Google Scholar]
- [19].Wang C, Xu L, Liang C, Xiang J, Peng R, Liu Z, Adv. Mater 2014, 26, 8154. [DOI] [PubMed] [Google Scholar]
- [20].Mead MJ, Nathanson SD, Lee M, Peterson E, J. Surg. Res 1985, 38, 319. [DOI] [PubMed] [Google Scholar]
- [21].Bindea G, Mlecnik B, Hackl H, Charoentong P, Tosolini M, Kirilovsky A, Fridman WH, Pages F, Trajanoski Z, Galon J, Bioinformatics 2009, 25, 1091. [DOI] [PMC free article] [PubMed] [Google Scholar]
- [22].Bindea G, Galon J, Mlecnik B, Bioinformatics 2013, 29, 661. [DOI] [PMC free article] [PubMed] [Google Scholar]
- [23].Chin CH, Chen SH, Wu HH, Ho CW, Ko MT, Lin CY, BMC Syst. Biol 2014, 8(suppl 4), S11. [DOI] [PMC free article] [PubMed] [Google Scholar]
- [24].Bader GD, Hogue CW, BMC Bioinformatics 2003, 4, 2. [DOI] [PMC free article] [PubMed] [Google Scholar]
- [25].Chen Z, Huang A, Sun J, Jiang T, Qin FX, Wu A, Sci. Rep 2017, 7, 40508. [DOI] [PMC free article] [PubMed] [Google Scholar]
- [26].Li X, Naylor MF, Le H, Nordquist RE, Teague TK, Howard CA, Murray C, Chen WR, Cancer Biol. Ther 2010, 10, 1081. [DOI] [PMC free article] [PubMed] [Google Scholar]
- [27].Zhou B, Song J, Wang M, Wang X, Wang J, Howard EW, Zhou F, Qu J, Chen WR, Nanoscale 2018, 10, 21640. [DOI] [PMC free article] [PubMed] [Google Scholar]
- [28].Takaki H, Cornelis F, Kako Y, Kobayashi K, Kamikonya N, Yamakado K, Diagn. Interv. Imaging 2017, 98, 651. [DOI] [PubMed] [Google Scholar]
- [29].Fan W, Yung B, Huang P, Chen X, Chem. Rev 2017, 117, 13566. [DOI] [PubMed] [Google Scholar]
- [30].Chen WH, Luo GF, Lei Q, Hong S, Qiu WX, Liu LH, Cheng SX, Zhang XZ, ACS Nano 2017, 11, 1419. [DOI] [PubMed] [Google Scholar]
- [31].Wang Z, Li S, Zhang M, Ma Y, Liu Y, Gao W, Zhang J, Gu Y, Adv. Sci 2017, 4, 1600327. [DOI] [PMC free article] [PubMed] [Google Scholar]
- [32].Yang Y, Zhu W, Dong Z, Chao Y, Xu L, Chen M, Liu Z, Adv. Mater 2017, 29, 1703588. [DOI] [PubMed] [Google Scholar]
- [33].Yang L, Tseng YT, Suo G, Chen L, Yu J, Chiu WJ, Huang CC, Lin CH, ACS Appl. Mater. Interfaces 2015, 7, 5097. [DOI] [PubMed] [Google Scholar]
- [34].Chatterjee M, Andrulis M, Stuhmer T, Muller E, Hofmann C, Steinbrunn T, Heimberger T, Schraud H, Kressmann S, Einsele H, Bargou RC, Haematologica 2013, 98, 1132. [DOI] [PMC free article] [PubMed] [Google Scholar]
- [35].Ng CS, Lee TW, Wan S, Wan IY, Sihoe AD, Arifi AA, Yim AP, J. Invest. Surg 2005, 18, 81. [DOI] [PubMed] [Google Scholar]
- [36].Toraya-Brown S, Fiering S, Int. J. Hyperthermia 2014, 30, 531. [DOI] [PMC free article] [PubMed] [Google Scholar]
- [37].Muller S, Kohanbash G, Liu SJ, Alvarado B, Carrera D, Bhaduri A, Watchmaker PB, Yagnik G, Di Lullo E, Malatesta M, Amankulor NM, Kriegstein AR, Lim DA, Aghi M, Okada H, Diaz A, Genome Biol. 2017, 18, 234. [DOI] [PMC free article] [PubMed] [Google Scholar]
- [38].Peng DJ, Sun BF, Chen CY, Zhou JY, Chen YS, Chen H, Liu L, Huang D, Jiang J, Cui GS, Yang Y, Wang W, Guo D, Dai M, Guo J, Zhang T, Liao Q, Liu Y, Zhao YL, Han L, Zhao Y, Yang YG, Wu W, Cell Res. 2019, 29, 725. [DOI] [PMC free article] [PubMed] [Google Scholar]
- [39].Chavez-Galan L, Olleros ML, Vesin D, Garcia I, Front. Immunol 2015, 6, 263. [DOI] [PMC free article] [PubMed] [Google Scholar]
- [40].Mantovani A, Schioppa T, Porta C, Allavena P, Sica A, Cancer Metastasis Rev. 2006, 25, 315. [DOI] [PubMed] [Google Scholar]
- [41].Sica A, Schioppa T, Mantovani A, Allavena P, Eur. J. Cancer 2006, 42, 717. [DOI] [PubMed] [Google Scholar]
- [42].Gocheva V, Wang HW, Gadea BB, Shree T, Hunter KE, Garfall AL, Berman T, Joyce JA, Genes Dev. 2010, 24, 241. [DOI] [PMC free article] [PubMed] [Google Scholar]
- [43].Wang R, Zhang J, Chen S, Lu M, Luo X, Yao S, Liu S, Qin Y, Chen H, Lung Cancer 2011, 74, 188. [DOI] [PubMed] [Google Scholar]
- [44].Chen Q, Xu L, Liang C, Wang C, Peng R, Liu Z, Nat. Commun 2016, 7, 13193. [DOI] [PMC free article] [PubMed] [Google Scholar]
Associated Data
This section collects any data citations, data availability statements, or supplementary materials included in this article.