

Abstract
Purpose
Myelofibrosis (MF) may serve as a poor prognostic factor in myelodysplastic syndromes (MDS). This study explored the impact of allogeneic hematopoietic stem cell transplantation (allo-HSCT) on the outcome of MDS patients with MF.
Patients and Methods
Three hundred and sixteen MDS patients were enrolled in this retrospective study. Based on the degree of MF, we divided the patients into 2 groups: grade 0–1 (MF-0/1) and grade 2–3 (MF-2/3) groups. The clinical features, treatments, and prognosis in MDS patients with MF were analyzed.
Results
Forty-three (13.6%) patients were diagnosed as MF-2/3. Complex karyotypes were more common in the MF-2/3 compared to MF-0/1 groups (P = 0.002). The overall response rate (ORR) of cytoreduction was 49.0%, along with 53.3% in the MF-0/1 and 16.7% in MF-2/3 groups (P = 0.017). In total, 141 patients underwent allo-HSCT, including 121 in the MF-0/1 and 20 in MF-2/3 groups. The median time to neutrophil reconstruction was 12 (range: 7–34) and 14 (range: 10–45) days (P = 0.005), and platelet reconstruction was 14 (range: 8–68) and 18 (range: 8–65) days (P = 0.045) in the MF-0/1 and MF-2/3 groups, respectively. However, the cumulative incidence of neutrophil and platelet engraftment achieved at day + 30 was not different between the two groups (P = 0.107, P = 0.303, respectively). Non-relapse mortality, relapse, and acute and chronic graft-versus-host disease were similar between the two groups (all P > 0.05). Among patients with allo-HSCT, the 2-year overall survival (OS) was 68.5% (95% CI: 60.1–76.9%) and 68.4% (95% CI: 47.4–89.4%) in the MF-0/1 and MF-2/3 groups, respectively, (P = 0.636). Among patients without allo-HSCT, the 2-year OS was 49.9% (95% CI: 40.7–59.1%) and 19.2% (95% CI: 0–39.6%) in the MF-0/1 and MF-2/3 groups, respectively, (P = 0.002). In multivariate cox analysis, complex karyotype was an unfavorable factor for relapse (HR, 4.16; P = 0.006), disease-free survival (DFS) (HR, 2.16; P = 0.020), and OS (HR, 2.47; P = 0.009) post-transplantation.
Conclusion
Patients with MF-2/3 have more complex karyotypes and lower ORR of cytoreduction in MDS. Among patients without allo-HSCT, patients with MF-2/3 have a worse prognosis than those with MF-0/1. However, the adverse impact of MF on prognosis may be overcome by allo-HSCT.
Keywords: Myelodysplastic syndrome, Myelofibrosis, Prognosis, Hematopoietic cell transplantation
Introduction
Myelodysplastic syndromes (MDSs) are a group of myeloid clonal hemopathies with a relatively heterogeneous spectrum of presentation, characterized by varying degrees of cytopenias and a predisposition to acute myeloid leukemia (AML) [1]. Several scoring systems, such as International Prognostic Scoring System (IPSS) and its revised version (IPSS-R), have been developed to stratify MDS. However, these scoring systems depend mainly on the percentage of the myeloblasts, karyotypic abnormalities, and the number of peripheral blood cytopenias [2]. Myelofibrosis (MF) is observed in approximately 13–35% of MDS patients [3–5]. Increasing evidence suggests that MF is an adverse factor in MDS, which is associated with early bone marrow failure and shorter survival [3, 6, 7], although this risk feature is not captured by IPSS-R.
MF is characterized by variable degrees of cytopenias, a leukoerythroblastic blood picture, and extramedullary hematopoiesis resulting in progressive splenomegaly and debilitating disease-related constitutional symptoms, compromising quality of life [8–10]. MF can present as primary myelofibrosis (PMF), or accompanied by / arise from a pre-existing diagnosis of MDS, polycythemia vera or essential thrombocythemia and so on [11]. The most important difference between PMF and MDS with MF is the apparent multilineage lineage dysplasia observed in the latter [12]. What’s more, there are less heteromorphic and broken erythrocytes and there is no obvious hepatosplenomegaly in MDS with MF [13]. There are a group of diseases shares both dysplastic and proliferative features at the time of initial presentation which has been recognized as Myelodysplastic/Myeloproliferative Neoplasms (MDS/MPN), and includes chronic myelomonocyic leukaemia (CMML), atypical chronic myeloid leukaemia (aCML), juvenile myelomonocytic leukaemia (JMML) and MDS/MPN unclassified (MDS/MPN-U) [12]. These diseases can also present with cytopenias, MDS-like blood cell dysplasia and MF, but they are often accompanied by prominent myeloproliferative features, such as persistent peripheral blood monocytosis > 1 × 10⁹/L, increased proliferation of neutrophils or platelets and splenomegaly and so on [14]. At the molecular level, MDS/MPN disorders are more likely to carry gene mutations associated with the activation of growth factor signaling pathways in conjunction with mutations in epigenetic regulators or splicing factors associated with morphologic dysplasia [15–18]. In this study, we only enrolled patients with MDS with MF for analysis.
Allogeneic hematopoietic stem cell transplantation (allo-HSCT) is a unique curative option for MDS. Whether MF affects the outcomes post-transplantation remains controversial. Some studies suggested that MF was not an adverse factor on survival following allo-HSCT [19]. Still, other studies were suggesting MF might affect survival, especially those with moderate-to-severe MF [3, 5, 7, 20]. In this study, we aimed to explore the impact of MF on MDS outcomes. We retrospectively analyzed the clinical features, treatments, and prognosis in MDS patients with MF, as well as the main events post-transplantation, such as engraftment, graft-versus-host disease (GVHD), and survival.
Patients and methods
Study design and patients
This retrospective study cohort collected all primary MDS patients with known bone marrow histology at diagnosis from October 2012 to June 2019 at our institution. Patients with PMF or overlap syndromes, such as MDS/MPN, were excluded from the study. Details of follow-up data came from medical records and telephone follow-up. Diagnostic criteria were based on the World Health Organization (WHO) [12], while risk stratification was categorized according to the IPSS-R [2], and response evaluation was performed according to the International Working Group (IWG) [21].
Cytogenetics and myelofibrosis assessment
Bone marrow (BM) specimens were used for cytogenetic analysis by conventional chromosome banding techniques and/or fluorescence in situ hybridization. Twenty metaphases were analyzed, and the results were reported using the current International System for Human Cytogenetic Nomenclature [22].
Sections of formalin-fixed and paraffin-embedded BM biopsies were stained with hematoxylin and eosin for morphology studies. The sections were also stained with Gomori silver-impregnation method to assess the reticulin fibers, amount of collagen deposition, and degree of osteosclerosis. According to the European MF network criteria [23], MF-0 is defined as “scattered linear reticulin with no intersections (crossovers) corresponding to normal BM”. MF-1 is defined as a “loose network of reticulin with many intersections, especially in perivascular areas”. MF-2 is defined as “diffuse and dense increase in reticulin with extensive intersections, occasionally with focal bundles of thick fibers mostly consistent with collagen, and/or focal osteosclerosis”. MF-3 is defined as “diffuse and dense increase in reticulin with extensive intersections and coarse bundles of thick fibers consistent with collagen, usually associated with osteosclerosis”. Cases with MF-2/3 were considered to be moderate-to-severe MF. Patients were diagnosed as “MDS with MF” when they meeted the diagnostic criteria of MDS and BM biopsy indicated MF > 0, in the absence of other prominent myeloproliferative features.
Treatment algorithm
Based on the clinical practice guidelines [1, 24–26] for MDS, patients with lower-risk MDS were treated with either immunoregulatory therapy (including lenalidomide and cyclosporine) or supportive care alone (including transfusion, erythropoiesis-stimulating agents and iron chelation). If patients had transfusion dependence, they would be given hypomethylating agents (HMA) or allo-HSCT when appropriate donors existed. The patients with higher-risk MDS were treated with allo-HSCT if they were candidates for the treatment and had the appropriate donors, with or without pre-transplantation cytoreductive treatments (including HMA, chemotherapy combined with HMA, and traditional AML-like chemotherapy). If they were not suitable for HSCT, they would be given cytoreductive treatments or only supportive care according to their physical condition [27–29].
Definitions and statistical analysis
Overall survival (OS) was calculated from the date of diagnosis to the date of death. By contrast, OS post-transplantation was calculated from the date of transplantation to the date of death. Surviving patients were censored at the date on which they were last known to be alive. Disease-free survival (DFS) was calculated from the time of transplantation to the date of relapse or death and was censored at the last date known to be alive and disease-free. Non-relapse mortality (NRM) was defined as death due to any cause without relapse. The overall response rate (ORR) was expressed as the percentage of patients achieving complete remission (CR) (including marrow CR), partial remission, or hematology improvement.
Comparison of numerical variables between groups was carried out using a Student’s t-test or a nonparametric approach (Mann–Whitney test). Comparing the distribution of categorical variables in different groups was performed with either Fisher’s exact test (2 × 2 tables) or the χ2 test (larger tables). Curves were constructed for OS using the Kaplan–Meier method and compared using a log-rank test (if no competing risk were involved) or computed in a competing risk framework by the method of Fine and Gray. Univariable and multivariable analyses were performed using a Cox proportional hazards regression model. P values were two-sided and considered significant if less than 0.05. SPSS 21.0 (SPSS, Inc, Chicago, Illinois) and R version 4.0.3 (R Development Core Team, Vienna, Austria) were used for data analysis.
Results
Patients’ baseline and treatment characteristics
A total of 316 hospitalized patients with newly diagnosed MDS were enrolled in this study. There were 108 females and 208 males, with a median age of 52 (range: 14–83) years. Finally, 43 (13.6%) patients were diagnosed as MF-2/3, including 28 MF-2 and 15 MF-3. Based on the degree of MF, we divided the patients into 2 groups: MF-0/1 and MF-2/3 groups. The patients’ baseline characteristics at diagnosis and treatments are detailed in Table 1, which show no differences except for the cytogenetics between the two groups (all P > 0.05). Aberrant karyotypes were more common in the MF-2/3 than the MF-0/1 group (P = 0.001). Further analysis showed complex karyotype was different between the two groups (P = 0.002). At the same time, no significant statistical differences were observed in + 8, -7, -Y, del(20q), del(7q), del(5q), double including del(5q-), double including -7/del(7q), and i(17q) between the two groups (all P > 0.05). In the MF-2/3 group, the baseline characteristics at diagnosis were compared between patients treated with allo-HSCT and those without allo-HSCT. The results showed patients treated with allo-HSCT were yonger than those without allo-HSCT (P = 0.003) (Table 2).
Table 1.
The patients’ characteristics at diagnosis according to myelofibrosis (n = 316)
| MF = 0/1 (n = 273) | MF = 2/3 (n = 43) | P | |
|---|---|---|---|
| Age (years), median, range | 52 (14–83) | 52 (21–79) | 0.705 |
| Gender, no. (%) | |||
| Male | 181 (66.3%) | 27 (62.8%) | 0.652 |
| Female | 92 (33.7%) | 16 (37.2%) | |
| Median WBC (range), × 109/L | 2.66 (0.27–13.47) | 2.73 (1.10–12.00) | 0.609 |
| Median NE (range), × 109/L | 0.99 (0.02–11.34) | 0.85 (0.04–4.92) | 0.794 |
| Median HGB (range), g/L | 69 (26–150) | 67 (30–138) | 0.291 |
| Median PLT (range), × 109/L | 53 (1–408) | 47 (3–282) | 0.911 |
| MDS subtypes (WHO, 2016), no. (%) | 0.243 | ||
| MDS-SLD | 11 (4.0%) | 2 (4.7%) | |
| MDS-MLD | 52 (19.1%) | 4 (9.3%) | |
| MDS-RS-SLD | 2 (0.7%) | 2 (4.7%) | |
| MDS-RS-MLD | 8 (2.9%) | 3 (7.0%) | |
| MDS with isolated 5q-deletion | 2 (0.7%) | 0 (0.0%) | |
| MDS-EB-1 | 70 (25.7%) | 10 (23.2%) | |
| MDS-EB-2 | 118 (43.2%) | 21 (48.8%) | |
| MDS-U | 10 (3.7%) | 1 (2.3%) | |
| Cytogenetic | 0.001 | ||
| Normal karyotype | 148 (54.2%) | 12 (27.9%) | |
| Aberrant karyotype | 125 (45.8%) | 31 (72.1%) | |
| IPSS-R risk group, no. (%) | 0.859 | ||
| Very low | 4 (1.5%) | 0 (0.0%) | |
| Low | 29 (10.6%) | 5 (11.6%) | |
| Intermediate | 65 (23.8%) | 9 (20.9%) | |
| High | 84 (30.8%) | 12 (27.9%) | |
| Very high | 91 (33.3%) | 17 (39.6%) | |
| Treatment, no. (%) | 0.170 | ||
| Allogeneic HSCT | 121 (44.3%) | 20 (46.5%) | |
| Cytoreductive treatments without HSCT | 90 (33.0%) | 12 (27.9%) | |
| HMA | 68 (25.0%) | 10 (23.2%) | |
| Chemotherapy combined with HMA | 20 (7.3%) | 2 (4.7%) | |
| AML-like chemotherapy | 2 (0.7%) | 0 (0.0%) | |
| Immunoregulatory | 11 (4.0%) | 5 (11.6%) | |
| Supportive care | 51 (18.7%) | 6 (14.0%) | |
| Leukemia transformation, no. (%) | 50 (18.3%) | 8 (18.6%) | 0.964 |
| Median time from diagnosis to leukemia transformation, months (range) | 12 (2–31) | 7 (1–20) | 0.043 |
MF myelofibrosis, WBC white blood cell count, NE neutrophils, HGB hemoglobin, PLT platelet, MDS-SLD MDS with single-lineage dysplasia, MDS-MLD MDS with ring sideroblasts with multilineage dysplasia, MDS-RS-SLD MDS with ring sideroblasts with single-lineage dysplasia, MDS-RS-MLD MDS with ring sideroblasts with multilineage dysplasia, MDS-EB MDS with excess of blasts, MDS-U MDS unclassifiable, HSCT hematopoietic stem cell transplantation, HMA hypomethylating agents, AML acute myeloid leukemia
Table 2.
The baseline characteristics at diagnosis of MDS patients with MF-2/3 (n = 43)
| Transplant (n = 20) | Non-transplant (n = 23) | P | |
|---|---|---|---|
| Age (years), median, range | 42 (27–60) | 58 (21–79) | 0.003 |
| Gender, no. (%) | 0.106 | ||
| Male | 10 (50.0%) | 17 (73.9%) | |
| Female | 10 (50.0%) | 6 (26.1%) | |
| Median WBC (range), × 109/L | 2.73 (1.10–12.00) | 2.91 (1.34–7.36) | 0.759 |
| Median NE (range), × 109/L | 0.85 (0.04–2.27) | 0.92 (0.16–4.92) | 0.439 |
| Median HGB (range), g/L | 65 (30–138) | 69 (36–84) | 0.706 |
| Median PLT (range), × 109/L | 41.5 (3–234) | 82 (8–282) | 0.179 |
| MDS subtypes (WHO, 2016), no. (%) | 0.290 | ||
| MDS-SLD | 2 (10.0%) | 0 (0.0%) | |
| MDS-MLD | 3 (15.0%) | 1 (4.3%) | |
| MDS-RS-SLD | 0 (0.0%) | 2 (8.7%) | |
| MDS-RS-MLD | 1 (5.0%) | 2 (8.7%) | |
| MDS with isolated 5q-deletion | 0 (0.0%) | 0 (0.0%) | |
| MDS-EB-1 | 5 (25.0%) | 5 (21.8%) | |
| MDS-EB-2 | 8 (40.0%) | 13 (56.5%) | |
| MDS-U | 1 (5.0%) | 0 (0.0%) | |
| Cytogenetic | 0.692 | ||
| Normal karyotype | 5 (25.0%) | 7 (30.4%) | |
| Aberrant karyotype | 15 (75.0%) | 16 (69.6%) | |
| IPSS-R risk group, no. (%) | 0.128 | ||
| Very low | 0 (0.0%) | 0 (0.0%) | |
| Low | 2 (10.0%) | 3 (13.0%) | |
| Intermediate | 7 (35.0%) | 2 (8.7%) | |
| High | 6 (30.0%) | 6 (26.1%) | |
| Very high | 5 (25.0%) | 12 (52.2%) | |
| Treatment, no. (%) | |||
| Cytoreductive treatments pre-transplantation | 11 (55.0%) | 0 (0.0%) | |
| Cytoreductive treatments without HSCT | 0 (0.0%) | 12 (52.2%) | |
| Immunoregulatory | 0 (0.0%) | 5 (21.7%) | |
| Supportive care | 0 (0.0%) | 6 (26.1%) | |
| Leukemia transformation, no. (%) | 6 (30.0%) | 2 (8.3%) | 0.115 |
| Median time from diagnosis to leukemia transformation, months (range) | 7 (1–20) | 12 (9–15) | 0.249 |
In total, 102 patients received cytoreductive treatments without allo-HSCT, which included 78 patients receiving HMA, 22 patients receiving chemotherapy combined with HMA, and 2 patients receivving traditional AML-like chemotherapy (Table 1). The other 141 patients received allo-HSCT (including 66 without cytoreduction and 75 with cytoreduction pre-transplantation), 16 patients received immunoregulatory, and 57 patients received only supportive care. There was no significant difference in the treatments between the two groups (P = 0.170) (Table 3).
Table 3.
The patients’ characteristics at transplantation according to myelofibrosis (n = 141)
| MF = 0/1 (n = 121) | MF = 2/3 (n = 20) | P | |
|---|---|---|---|
| Median age of recipient at HSCT (range) | 44 (18–66) | 42 (27–60) | 0.747 |
| Recipient sex | 0.511 | ||
| Male | 70 (57.9%) | 10 (50.0%) | |
| Female | 51 (42.1%) | 10 (50.0%) | |
| Recipient cytogenetic | 0.743 | ||
| Non-complex karyotypes | 102 (84.3%) | 16 (80.0%) | |
| Complex karyotypes | 19 (15.7%) | 4 (20.0%) | |
| BM blasts at HSCT | 0.016 | ||
| ≤ 5% | 29 (24.0%) | 10 (50.0%) | |
| > 5% | 92 (76.0%) | 10 (50.0%) | |
| Time to HSCT from diagnosis | 0.529 | ||
| ≤ 6 months | 87 (71.9%) | 13 (65.0%) | |
| > 6 months | 34 (28.1%) | 7 (35.0%) | |
| Previous therapy for MDS | 0.861 | ||
| No cytoreductive treatments | 57 (47.1%) | 9 (45.0%) | |
| Cytoreductive treatments | 64 (52.9%) | 11 (55.0%) | |
| HMA | 27 (22.3%) | 4 (20.0%) | |
| Chemotherapy combined with HMA | 34 (28.1%) | 7 (35%) | |
| AML-like chemotherapy | 3 (2.5%) | 0 (0.0%) | |
| Median age of donor (range) | 37 (10–63) | 40 (26–60) | 0.181 |
| Donor sex | 0.323 | ||
| Male | 77 (63.6%) | 15 (75.0%) | |
| Female | 44 (34.2%) | 5 (25.0%) | |
| Donor source | 0.838 | ||
| HID | 51 (42.1%) | 8 (40%) | |
| MUD | 10 (8.3%) | 1 (5%) | |
| MSD | 60 (49.6%) | 11 (55%) | |
| Stem cell source | 0.605 | ||
| PB | 62 (51.2%) | 9 (45.0%) | |
| PB + BM | 59 (48.8%) | 11 (55.0%) | |
|
Median mononuclear cells per graft × 108/kg, (range) |
10.2 (7.21–13.9) | 10.4 (8.3–14.0) | 0.479 |
|
Median CD34 + cells per graft × 106/kg, (range) |
9.5 (6.8–13.1) | 9.8 (8.1–13.7) | 0.246 |
| Conditioning regimens | 0.051 | ||
| BUCY | 56 (46.3%) | 3 (15.0%) | |
| DAC + BUCY | 48 (39.7%) | 13 (65.0%) | |
| BUCY + others | 9 (7.4%) | 3 (15.0%) | |
| BF | 8 (6.6%) | 1 (5.0%) | |
| GVHD prophylaxis | 0.870 | ||
| CsA + MTX + MMF | 60 (49.6%) | 11 (55.0%) | |
| CsA + MTX + ATG | 5 (4.1%) | 1 (5.0%) | |
| CsA + MTX + ATG + MMF | 56 (46.3%) | 8 (40.0%) | |
BM bone marrow, HID haploidentical donor, MUD matched unrelated donor, MSD HLA-matched sibling donor, PB peripheral blood, BUCY busulfan + cyclophosphamide, DAC decitabine, BF busulfan + fludarabine; GVHD graft-versus-host disease, CsA cyclosporin A, MTX methotrexate, MMF mycophenolate, ATG antithymocyte globulin
Leukemia transformation
With a median follow-up of 30 months (range: 1–142) post-diagnosis, 58 (18.4%) patients developed leukemia, including 50 (18.3%) cases in the MF-0/1 and 8 (18.6%) in the MF-2/3 group (P = 0.964) (Table1). The median transformation time was 11 months (range: 1–31), along with 12 months (range: 2–31) in the MF-0/1 and 7 months (range: 1–20) in the MF-2/3 group (P = 0.043).
Cytoreductive treatments and outcomes
Of the 102 patients who received cytoreductive treatments without allo-HSCT, there were 90 cases in the MF-0/1, including 68 HMA and 20 chemotherapy combined with HMA and 2 traditional AML-like chemotherapy, and 12 in the MF-2/3 group, including 10 HMA and 2 chemotherapy combined with HMA. The ORR of cytoreduction was 49.0%, along with 53.3% in the MF-0/1 and 16.7% in the MF-2/3 group (P = 0.017) (Table 4), with a median cycle of 5 (range: 1–10) and 3 (range: 1–7), respectively (P = 0.111).
Table 4.
The evaluation of the response to cytoreductive trearments in MDS patients (n = 102)
| Response | MF-0/1 (n = 90) | MF-2/3 (n = 12) | P |
|---|---|---|---|
| ORR | 48 (53.3%) | 2 (16.7%) | 0.017 |
| CR | 30 (33.3%) | 1 (8.3%) | – |
| PR | 11 (12.2%) | 1 (8.3%) | – |
| HI | 7 (7.8%) | 0 (0.0%) | – |
| NR | 42 (46.7%) | 10 (83.3%) | – |
| SD | 6 (6.7%) | 2 (16.6%) | – |
| PD | 36 (40.0%) | 8 (66.7%) | – |
ORR overall response rates, CR complete remission (including marrow CR), PR partial remission, HI hematological Improvement, NR no response, SD stable disease, PD progressive disease
Twenty-seven patients experienced relapse at a median time of 9 months (range: 1–35) after CR, including 26/30 cases in the MF-0/1 and 1/1 in the MF-2/3 group. The cumulative incidence of relapse at 2 years after CR was 88.3% (95% CI: 65.9–96.4%).
Transplantation and outcomes
Of the 141 patients who received allo-HSCT, including 121 in the MF-0/1 and 20 in the MF-2/3 group, 71 patients received HLA-matched sibling donors (MSD) (MF-0/1, n = 60; MF-2/3, n = 11), 11 matched unrelated donors (MUD) (MF-0/1, n = 10; MF-2/3, n = 1), and 59 haploidentical donors (HID) (MF-0/1, n = 51; MF-2/3, n = 8) (P = 0.838). All patients received busulfan (BU)-based myeloablative conditioning (MAC) regimens as described previously [27]. Cyclosporin A (CsA) + methotrexate (MTX) + mycophenolate (MMF) were administered to patients undergoing MSD transplantation, and CsA + MTX + antithymocyte globulin (ATG) and/or MMF were administered to patients undergoing MUD or HID transplantation for GVHD prophylaxis [30]. The patients’ characteristics at transplantation are detailed in Table 3.
The cumulative incidence of neutrophil reconstruction (absolute neutrophil count > 0.5 × 10⁹/L) at day + 30 was 97.8% (95% confidence interval (CI): 92.8–99.4%), along with 98.3% (95% CI: 92.3–99.7%) in the MF-0/1 and 95.0% (95% CI: 53.0–99.6%) in the MF-2/3 group (P = 0.107). The median time to neutrophil reconstruction was 12 (range: 7–34) and 14 (range: 10–45) days in the MF-0/1 and MF-2/3 groups, respectively (P = 0.005) (Table 5). The cumulative incidence of platelet reconstruction (platelet > 20 × 109/L) at day + 30 was 86.5% (95% CI: 79.6–91.2%), along with 87.6% (95% CI: 80.1–92.4%) in the MF-0/1 and 80.0% (95% CI: 52.8–92.5%) in the MF-2/3 group (P = 0.303). The median time to platelet reconstruction was 14 (range: 8–68) and 18 (range: 8–65) days in the MF-0/1 and MF-2/3 groups, respectively (P = 0.045) (Table 5).
Table 5.
Results of stem cell transplantation in MDS patients with MF = 0/1 or MF = 2/3 (n = 141)
| MF = 0/1) (n = 121) | MF = 2/3 (n = 20) | P | |
|---|---|---|---|
| Cumulative incidence of neutrophil reconstruction at day + 30 | 98.3% | 95.0% | 0.107 |
| Cumulative incidence of platelet reconstruction at day + 30 | 87.6% | 80.0% | 0.303 |
| Median days to neutrophil reconstruction(> 0.5 × 10⁹/L) (range) | 12(7–34) | 14(10–45) | 0.005 |
| Median days to platelet reconstruction(> 20X109/L) (range) | 14(8–68) | 18(8–65) | 0.045 |
| Acute GVHD grade II–IV | 45(37.2%) | 6(30%) | 0.535 |
| Chronic GVHD | 67(55.4%) | 10(50%) | 0.655 |
| 2 year cumulative incidence of relapse | 12.0% | 16.8% | 0.910 |
| 2 year non-replase mortality | 26.0% | 21.7% | 0.441 |
Fifty-one (36.2%) patients were diagnosed with acute GVHD (grades II–IV), along with 45 (37.2%) in the MF-0/1 and 6 (30.0%) in the MF-2/3 group (P = 0.535). Seventy-seven (54.6%) patients were diagnosed with chronic GVHD, along with 67 (55.4%) in the MF-0/1 and 10 (50%) in the MF-2/3 group (P = 0.655) (Table 5).
For the whole cohort, 146 patients died during follow-up, including 123 cases in the MF-0/1 and 23 in the MF-2/3 group. The causes of death are shown in Table 6. The 2-year OS for the whole cohort was 57.1% (95% CI: 51.2–63.0%), along with 59.0% (95% CI: 52.7–65.3%) in the MF-0/1 and 53.6% (95% CI: 38.1–69.1%) in the MF-2/3 group (P = 0.211) (Fig. 1). The 2-year OS was 68.5% (95% CI: 60.7–76.3%) and 45.2% (95% CI: 36.8–53.6%) in the patients with and without allo-HSCT, respectively (P < 0.0001) (Fig. 2). Among patients with allo-HSCT, the 2-year OS was 68.5% (95% CI: 60.1–76.9%) and 68.4% (95% CI: 47.4–89.4%) in the MF-0/1 and MF-2/3 groups, respectively (P = 0.636) (Fig. 3). Among patients without allo-HSCT, the 2-year OS was 49.9% (95% CI: 40.7–59.1%) and 19.2% (95% CI: 0–39.6%) in the MF-0/1 and MF-2/3 groups, respectively (P = 0.002) (Fig. 4). The OS of patients with allo-HSCT was longer than those without allo-HSCT in the MF-2/3 group (P = 0.001) (Fig. 5).
Table 6.
The causes of death(n = 146)
| MF = 0/1) (n = 123) | MF = 2/3 (n = 23) | P | |
|---|---|---|---|
| Disease progression | 52 (42.3%) | 10 (43.5%) | 0.324 |
| Infections | 24 (19.5%) | 5 (21.7%) | |
| Bleeding | 7 (5.7%) | 4 (17.4%) | |
| Multiple organ failure | 11 (8.9%) | 1 (4.3%) | |
| Transplantation-related complications | 10 (8.1%) | 2 (8.7%) | |
| Others | 19(15.4%) | 1(4.3%) |
Fig. 1.

Overal survival of MDS patients classified by MF (MF-0/1 VS. MF-2/3)
Fig. 2.
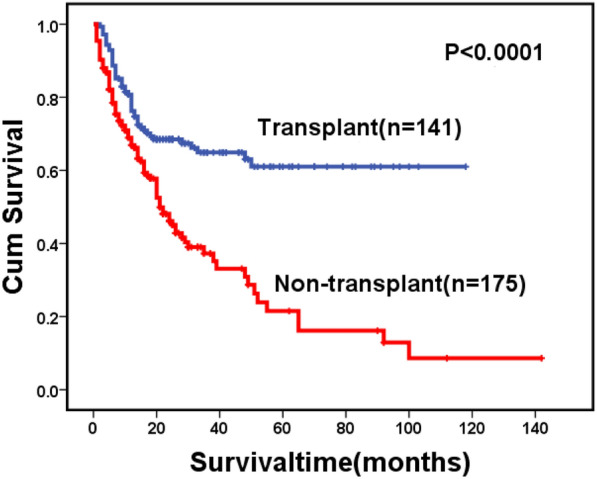
Overal survival of MDS patients classified by treatment (transplant VS. non-transplant)
Fig. 3.

Overal survival of MDS patients with allo-HSCT, classified by MF (MF-0/1 VS. MF-2/3)
Fig. 4.
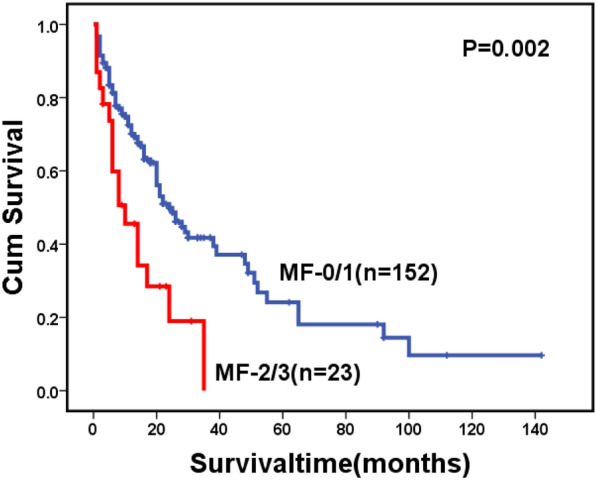
Overal survival of MDS patients without allo-HSCT, classified by MF (MF-0/1 VS. MF-2/3)
Fig. 5.

Overal survival of MDS patients with MF-2/3 classified by treatment (transplant VS. non-transplant)
Of 141 patients who underwent transplantation, 19 patients experienced relapse at a median time of 26 months (range: 1–97) post-transplantation, including 16 cases in the MF-0/1 and 3 in the MF-2/3 group. The cumulative incidence of relapse at 2 years post-transplantation was 12.9% (95% CI: 7.8–19.4%), along with 12.0% (95% CI: 6.9–18.7%) in the MF-0/1 and 16.8% (95% CI: 3.7–38.1%) in the MF-2/3 group (P = 0.910) (Fig. 6). By the time of follow-up, 48 patients died after transplantation, including 10 patients died of relapse and 38 patients died without relapse. The cumulative incidence of non-relapse mortality (NRM) at 2 years post-transplantation was 25.3% (95% CI: 18.4–32.9%), along with 26.0% (95% CI: 18.5–34.2%) in the MF-0/1 and 21.7% (95% CI: 6.4–42.8%) in the MF-2/3 group (P = 0.441) (Fig. 7). The 2-year DFS post-transplantation was 61.8% (95% CI: 53.6–70.0%), along with 62.0% (95% CI: 53.2–70.8%) in the MF-0/1 and 61.5% (95% CI: 40.3–82.7%) in the MF-2/3 group (P = 0.477) (Fig. 8). The 2-year OS post-transplantation was 65.8% (95% CI: 61.6–74.0%), along with 65.3% (95% CI: 56.3–74.3%) in the MF-0/1 and 68.1% (95% CI: 46.9–89.3%) in the MF-2/3 group (P = 0.562) (Fig. 9).
Fig. 6.
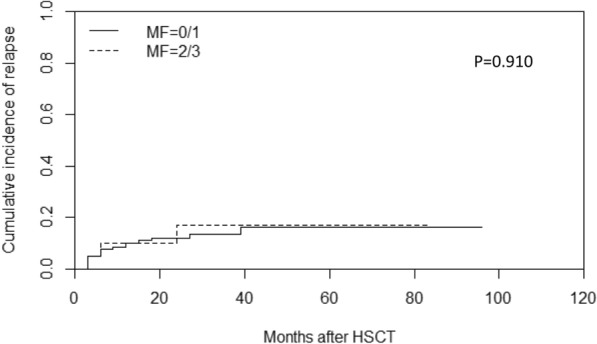
Cumulative incidence of relapse classified by MF (MF-0/1 VS. MF-2/3)
Fig. 7.
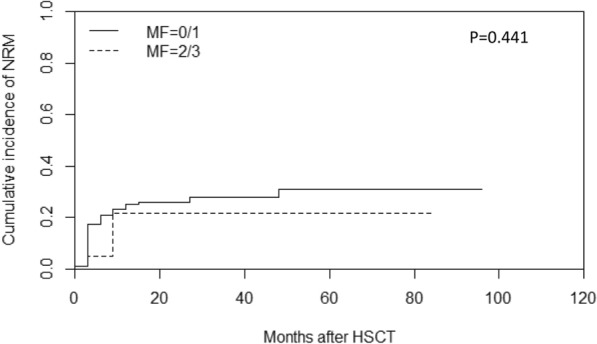
Cumulative incidence of non-replase mortality (NRM) classified by MF (MF-0/1 VS. MF-2/3)
Fig. 8.

Disease-free survival of MDS patients with allo-HSCT classified by MF (MF-0/1 VS. MF-2/3)
Fig. 9.

Overal survival after allo-HSCT of MDS patients classified by MF (MF-0/1 VS. MF-2/3)
In univariate and multivariate analysis, complex karyotype was an unfavorable factor for relapse (HR 3.51, P = 0.012 and HR 4.16, P = 0.006, respectively), DFS (HR 2.24, P = 0.012 and HR 2.16, P = 0.020, respectively), and OS (HR 2.28, P = 0.014 and HR 2.47, P = 0.009, respectively) post-transplantation (Table 7).
Table 7.
Risk features of myelofibrosis in MDS patients underwent HSCT by Cox regression analysis (n = 141)
| Variable | Relapse | NRM | DFS | OS | ||||
|---|---|---|---|---|---|---|---|---|
| Univariate | Multivariate | Univariate | Multivariate | Univariate | Multivariate | Univariate | Multivariate | |
| P | P | P | P | |||||
| HR (95% CI) | HR (95% CI) | HR (95% CI) | HR (95% CI) | |||||
| Age | 0.988 | – | 0.169 | – | 0.21 | – | 0.21 | – |
| 1.00 (0.96–1.04) | 1.02 (0.99–1.05) | 1.02 (0.99–1.04) | 1.02 (0.99–1.04) | |||||
| Sex | – | – | – | – | ||||
| Male | Ref. | Ref. | Ref. | Ref. | ||||
| Female | 0.566 | 0.304 | 0.245 | 0.319 | ||||
| 0.76 (0.30–1.93) | 0.70 (0.36–1.38) | 0.72 (0.42–1.25) | 0.74 (0.41–1.34) | |||||
| Cytogenetics | ||||||||
| Non–complex karyotypes | Ref. | Ref. | Ref. | Ref. | Ref. | Ref. | Ref. | Ref. |
| Complex karyotypes | 0.012 | 0.006 | 0.328 | 0.347 | 0.012 | 0.020 | 0.014 | 0.009 |
| 3.51 (1.32–9.34) | 4.16 (1.51–11.45) | 1.51 (0.66–3.46) | 1.51 (0.64–3.55) | 2.24 (1.19–4.20) | 2.16 (1.13–4.12) | 2.28 (1.18–4.42) | 2.47 (1.25–4.90) | |
| BM blasts at HSCT | ||||||||
| ≤ 5% | Ref. | Ref. | Ref. | Ref. | Ref. | Ref. | Ref. | Ref. |
| > 5% | 0.349 | 0.253 | 0.343 | 0.245 | 0.782 | 0.773 | 0.763 | 0.73 |
| 1.80 (0.53–6.20) | 2.08 (0.59–7.31) | 0.72 (0.36–1.43) | 0.66 (0.33–1.33) | 0.92 (0.51–1.66) | 0.92 (0.51–1.66) | 0.91 (0.48–1.72) | 0.89 (0.47–1.69) | |
| Myelofibrosis | ||||||||
| MF = 0/1 | Ref. | Ref. | Ref. | Ref. | Ref. | Ref. | Ref. | Ref. |
| MF = 2/3 | 0.964 | 0.914 | 0.986 | 0.286 | 0.459 | 0.396 | 0.569 | 0.444 |
| 0.97 (0.28–3.34) | 1.07 (0.31–3.76) | 1.02 (0.13–8.15) | 0.56 (0.20–1.62) | 0.74 (0.34–1.64) | 0.71 (0.32–1.58) | 0.78 (0.33–1.84) | 0.71 (0.30–1.70) | |
| Time to HSCT from diagnosis | ||||||||
| ≤ 6 months | Ref. | Ref. | Ref. | Ref. | Ref. | Ref. | Ref. | Ref. |
| > 6 months | 0.77 | 0.888 | 0.56 | 0.709 | 0.952 | 0.678 | 0.741 | 0.526 |
| 0.86 (0.31–2.39) | 1.08 (0.38–3.08) | 0.63 (0.13–3.02) | 1.15 (0.56–2.34) | 1.02 (0.58–1.80) | 1.13 (0.63–2.04) | 1.11 (0.60–2.04) | 1.23 (0.65–2.31) | |
| Previous therapy for MDS | ||||||||
| No cytoreductive treatments | Ref. | Ref. | Ref. | Ref. | Ref. | Ref. | Ref. | Ref. |
| Cytoreductive treatments | 0.468 | 0.327 | 0.337 | 0.642 | 0.902 | 0.856 | 0.794 | 0.627 |
| 1.41 (0.56–3.60) | 1.61 (0.62–4.19) | 1.97 (0.49–7.89) | 0.86 (0.45–1.64) | 0.97 (0.57–1.63) | 1.05 (0.62–1.79) | 1.08 (0.61–1.91) | 1.16 (0.64–2.07) | |
| Donor source | ||||||||
| HID | Ref | – | Ref | – | Ref | – | Ref | – |
| MUD | 0.806 | 0.277 | 0.709 | 0.903 | ||||
| 0.77 (0.09–6.50) | 2.49 (0.48–12.81) | 0.82 (0.28–2.37) | 1.07 (0.37–3.13) | |||||
| MSD | 0.393 | 0.374 | 0.646 | 0.717 | ||||
| 1.54 (0.57–4.11) | 0.48 (0.09–2.45) | 0.88 (0.51–1.51) | 0.90 (0.50–1.62) | |||||
| Stem cell source | ||||||||
| PB | Ref | – | Ref | – | Ref | – | Ref | – |
| PB + BM | 0.325 | 0.628 | 0.899 | 0.666 | ||||
| 1.60 (0.63–4.07) | 0.85 (0.45–1.62) | 1.03 (0.61–1.74) | 1.13 (0.64–2.00) | |||||
NRM non-replase mortality, RI relapse incidence, DFS disease-free survival, OS overall survival (after allo-HSCT), MF myelofibrosis
Discussion
In this retrospective study, we analyzed the biological characteristics of MDS patients with different degrees of MF and assessed the impact of MF on the prognosis of these patients. The results showed that patients with MF-2/3 have more complex karyotypes and lower ORR of cytoreduction. Among patients without allo-HSCT, patients with MF-2/3 have shorter survival than those with MF-0/1. Fortunately, allo-HSCT might overcome the adverse factor of MF.
MF is considered a poor prognostic factor in patients with MDS. Our results indicated that the 2-year OS was only 19.2% in the MF-2/3 group if allo-HSCT was not performed. Why MF affects the survival of MDS patients remains unclear. Buesche G [6] considered some correlation between MF and multilineage dysplasia, excess of blasts, and increased risk of early bone marrow failure. Melody M [20] reported that more patients with MF-3 were classified as MDS with excess of blasts and with higher IPSS-R risk categories than those with MF-0/1/2. Our study found complex karyotypes were more common in the MF-2/3 than in the MF-0/1 group, which was consistent with the previous study [20]. Moreover, some studies suggested that poor-risk cytogenetics is often accompanied by worse survivals in MDS [2, 31–33], which might partially explain the shorter OS observed in the MF-2/3 group. In line with the previous studies [3, 34], our data showed that MF did not add additional risk to leukemia transformation. However, we found the median transformation time was shorter in the MF-2/3 than in the MF-0/1 group. Besides, patients who failed to respond to HMA treatment often display significantly worse OS [35, 36], and a lower ORR of cytoreduction was observed in the MF-2/3 compared with the MF-0/1 group in our study. These factors all might be the causes of the poor prognosis in the MF-2/3 group.
It remains controversial whether allo-HSCT can overcome the adverse factor of MF. Some studies suggested that MF did not affect the outcomes of allo-HSCT in the patients with MDS [19, 37], while others indicated that MF might be associated with lower engraftment rate, higher relapse, and NRM [5, 38, 39]. In this study, we observed a delay in neutrophil and platelet reconstruction in the MF-2/3 group. Still, there was no difference in the cumulative incidence of neutrophil and platelet engraftment achieved at day + 30 between the two groups. This observation might be related to the MAC regimens and ATG because some studies reported that MAC regimens or receiving ATG along with a conditioning regimen were protective against graft failure [40, 41]. Moreover, the addition of bone marrow stem cells and the relatively large number of transfused cells might also partially explain the high engraftment rate in this study.
Regarding the relapse incidence, Kröger N, et al. reported a significantly higher risk of relapse in the group with severe fibrosis, but only in univariate analysis [5]. Our study found complex karyotype, not MF, that affected the relapse post-transplantation. Discrepant results had been reported regarding the impact of MF on NRM, with some studies suggesting no influences [19], while other studies reported that higher degrees of fibrosis in the marrow were paralleled by a greater likelihood of fibrosis in other organs (e.g., liver and lungs), making these organs more susceptible to regimen-related toxicity after HSCT and thus increasing NRM [39]. In our study, we did not observe a higher NRM in the MF-2/3 group. Additionally, our results also demonstrated that MF did not influence the incidence of acute or chronic GVHD. Considering the above factors, it is not surprising that patients with MF-2/3 can achieve the comparable DFS and OS of patients with MF-0/1.
In summary, patients with MF-2/3 have more complex karyotypes and lower ORR of cytoreduction in MDS. Among patients without allo-HSCT, patients with MF-2/3 have a worse prognosis than those with MF-0/1. However, the adverse impact of MF on prognosis may be overcome by allo-HSCT.
Limitations
Inevitably, there were limitations to our study. First, the sample size of patients with MF-2/3 who received HSCT was relatively small. Second, we lacked the data of MF in patients after HSCT, so we could not analyze the impact of HSCT on MF in BM. Finally, because retrospective nature of analyses and subjects enrolled in this study were only dependent on hospitalized patients, there was an inevitable selection bias in our study.
Acknowledgements
We sincerely thank all colleagues in the Department of Hematology, Nanfang Hospital, for their help in this study. We thank LetPub (www.letpub.com) for its linguistic assistance during the preparation of this manuscript.
Authors' contributions
QL and MD conceived the idea; XZ, LX, ZF, YZ, KZ, YZ, and JX collected the data and gave critical suggestions; XZ performed statistical analysis and wrote the original draft. QL and MD revised the manuscript. All authors read and approved the final manuscript.
Funding
This work was supported by the Key Research and Development Projects of Guangdong Province (Grant No. 2019B020236004), the National Key Research and Development Projects (Grant Nos. 2017YFA0105500 and 2017YFA0105504), and the National Natural Science Foundation of China (Grant Nos. 81970161 and 81500149).
Availability of data and materials
All data generated or analyzed during this study are included in this manuscript.
Declarations
Ethics approval and consent to participate
The data described in this manuscript were approved by the Ethics Committee of Nanfang Hospital, Southern Medical University (Ethical approval No. NCT04692376) and conducted in accordance with the Helsinki declaration. All patients gave written informed consent to participate in the study.
Consent for publication
Not applicable.
Competing interests
All authors in this article declare that they have no conflict of interest.
Footnotes
Publisher's Note
Springer Nature remains neutral with regard to jurisdictional claims in published maps and institutional affiliations.
Contributor Information
Qifa Liu, Email: liuqifa628@163.com.
Min Dai, Email: berrydai2003@aliyun.com.
References
- 1.Greenberg PL, Stone RM, Al-Kali A, Barta SK, Bejar R, Bennett JM, et al. Myelodysplastic syndromes, version 2.2017, NCCN clinical practice guidelines in oncology. J Natl Compr Canc Netw. 2017;15(1):60–87. doi: 10.6004/jnccn.2017.0007. [DOI] [PubMed] [Google Scholar]
- 2.Greenberg PL, Tuechler H, Schanz J, Sanz G, Garcia-Manero G, Solé F, et al. Revised international prognostic scoring system for myelodysplastic syndromes. Blood. 2012;120(12):2454–2465. doi: 10.1182/blood-2012-03-420489. [DOI] [PMC free article] [PubMed] [Google Scholar]
- 3.Fu B, Jaso JM, Sargent RL, Goswami M, Verstovsek S, Medeiros LJ, et al. Bone marrow fibrosis in patients with primary myelodysplastic syndromes has prognostic value using current therapies and new risk stratification systems. Mod Pathol. 2014;27(5):681–689. doi: 10.1038/modpathol.2013.187. [DOI] [PubMed] [Google Scholar]
- 4.Su T, Zhang PH, Xu ZF, Chen HS, Qin TJ, Zhang Y, et al. Analysis of clinical features and prognosis of primary myelodysplastic syndromes with myelofibrosis patients. Zhonghua Xue Ye Xue Za Zhi. 2012;33(5):378–382. [PubMed] [Google Scholar]
- 5.Kröger N, Zabelina T, Van Biezen A, Brand R, Niederwieser D, Martino R, et al. Allogeneic stem cell transplantation for myelodysplastic syndromes with bone marrow fibrosis. Haematologica. 2011;96(2):291–297. doi: 10.3324/haematol.2010.031229. [DOI] [PMC free article] [PubMed] [Google Scholar]
- 6.Buesche G, Teoman H, Wilczak W, Ganser A, Hecker H, Wilkens L, et al. Marrow fibrosis predicts early fatal marrow failure in patients with myelodysplastic syndromes. Leukemia. 2008;22(2):313–322. doi: 10.1038/sj.leu.2405030. [DOI] [PubMed] [Google Scholar]
- 7.Wang N, Xu H, Li Q, Fang X. Patients of myelodysplastic syndrome with mild/moderate myelofibrosis and a monosomal karyotype are independently associated with an adverse prognosis: long-term follow-up data. Cancer Manag Res. 2020;12:5881–5891. doi: 10.2147/CMAR.S258875. [DOI] [PMC free article] [PubMed] [Google Scholar]
- 8.Venugopal S, Mascarenhas J. Novel therapeutics in myeloproliferative neoplasms. J Hematol Oncol. 2020;13(1):162. doi: 10.1186/s13045-020-00995-y. [DOI] [PMC free article] [PubMed] [Google Scholar]
- 9.Mesa RA, Niblack J, Wadleigh M, Verstovsek S, Camoriano J, Barnes S, et al. The burden of fatigue and quality of life in myeloproliferative disorders (MPDs): an international Internet-based survey of 1179 MPD patients. Cancer. 2007;109(1):68–76. doi: 10.1002/cncr.22365. [DOI] [PubMed] [Google Scholar]
- 10.Reilly JT, Mcmullin MF, Beer PA, Butt N, Conneally E, Duncombe A, et al. Guideline for the diagnosis and management of myelofibrosis. Br J Haematol. 2012;158(4):453–471. doi: 10.1111/j.1365-2141.2012.09179.x. [DOI] [PubMed] [Google Scholar]
- 11.Zahr AA, Salama ME, Carreau N, Tremblay D, Verstovsek S, Mesa R, et al. Bone marrow fibrosis in myelofibrosis: pathogenesis, prognosis and targeted strategies. Haematologica. 2016;101(6):660–671. doi: 10.3324/haematol.2015.141283. [DOI] [PMC free article] [PubMed] [Google Scholar]
- 12.Arber DA, Orazi A, Hasserjian R, Thiele J, Borowitz MJ, Le Beau MM, et al. The 2016 revision to the World Health Organization classification of myeloid neoplasms and acute leukemia. Blood. 2016;127(20):2391–2405. doi: 10.1182/blood-2016-03-643544. [DOI] [PubMed] [Google Scholar]
- 13.Yap YY, Law KB, Sathar J, Lau NS, Goh AS, Chew TK, et al. The epidemiology and clinical characteristics of myeloproliferative neoplasms in Malaysia. Exp Hematol Oncol. 2018;7:31. doi: 10.1186/s40164-018-0124-7. [DOI] [PMC free article] [PubMed] [Google Scholar]
- 14.Smith BN, Savona M, Komrokji RS. Challenges in myelodysplastic/myeloproliferative neoplasms (MDS/MPN) Clin Lymphoma Myeloma Leuk. 2019;19(1):1–8. doi: 10.1016/j.clml.2018.11.019. [DOI] [PMC free article] [PubMed] [Google Scholar]
- 15.Tanaka TN, Bejar R. MDS overlap disorders and diagnostic boundaries. Blood. 2019;133(10):1086–1095. doi: 10.1182/blood-2018-10-844670. [DOI] [PubMed] [Google Scholar]
- 16.Greenfield G, Mcmullin MF, Mills K. Molecular pathogenesis of the myeloproliferative neoplasms. J Hematol Oncol. 2021;14(1):103. doi: 10.1186/s13045-021-01116-z. [DOI] [PMC free article] [PubMed] [Google Scholar]
- 17.Yu J, Li Y, Li T, Li Y, Xing H, Sun H, et al. Gene mutational analysis by NGS and its clinical significance in patients with myelodysplastic syndrome and acute myeloid leukemia. Exp Hematol Oncol. 2020;9:2. doi: 10.1186/s40164-019-0158-5. [DOI] [PMC free article] [PubMed] [Google Scholar]
- 18.Li B, Rampal RK, Xiao Z. Targeted therapies for myeloproliferative neoplasms. Biomark Res. 2019;7:15. doi: 10.1186/s40364-019-0166-y. [DOI] [PMC free article] [PubMed] [Google Scholar]
- 19.Scott BL, Storer BE, Greene JE, Hackman RC, Appelbaum FR, Deeg HJ. Marrow fibrosis as a risk factor for posttransplantation outcome in patients with advanced myelodysplastic syndrome or acute myeloid leukemia with multilineage dysplasia. Biol Blood Marrow Transplant. 2007;13(3):345–354. doi: 10.1016/j.bbmt.2006.10.030. [DOI] [PubMed] [Google Scholar]
- 20.Melody M, Al Ali N, Zhang L, Ramadan H, Padron E, Sallman D, et al. Decoding Bone Marrow Fibrosis in Myelodysplastic Syndromes. Clin Lymphoma Myeloma Leuk. 2020;20(5):324–328. doi: 10.1016/j.clml.2020.01.003. [DOI] [PubMed] [Google Scholar]
- 21.Cheson BD, Greenberg PL, Bennett JM, Lowenberg B, Wijermans PW, Nimer SD, et al. Clinical application and proposal for modification of the International Working Group (IWG) response criteria in myelodysplasia. Blood. 2006;108(2):419–425. doi: 10.1182/blood-2005-10-4149. [DOI] [PubMed] [Google Scholar]
- 22.Yu S, Huang F, Fan Z, Xuan L, Nie D, Xu Y, et al. Haploidentical versus HLA-matched sibling transplantation for refractory acute leukemia undergoing sequential intensified conditioning followed by DLI: an analysis from two prospective data. J Hematol Oncol. 2020;13(1):18. doi: 10.1186/s13045-020-00859-5. [DOI] [PMC free article] [PubMed] [Google Scholar]
- 23.Thiele J, Kvasnicka HM, Facchetti F, Franco V, Van Der Walt J, Orazi A. European consensus on grading bone marrow fibrosis and assessment of cellularity. Haematologica. 2005;90(8):1128–1132. [PubMed] [Google Scholar]
- 24.Steensma DP. Myelodysplastic syndromes current treatment algorithm 2018. Blood Cancer J. 2018;8(5):47. doi: 10.1038/s41408-018-0085-4. [DOI] [PMC free article] [PubMed] [Google Scholar]
- 25.Schroeder T, Wegener N, Lauseker M, Rautenberg C, Nachtkamp K, Schuler E, et al. Comparison between upfront transplantation and different pretransplant cytoreductive treatment approaches in patients with high-risk myelodysplastic syndrome and secondary acute myelogenous leukemia. Biol Blood Marrow Transplant. 2019;25(8):1550–1559. doi: 10.1016/j.bbmt.2019.03.011. [DOI] [PubMed] [Google Scholar]
- 26.Tartaglione I, Origa R, Kattamis A, Pfeilstöcker M, Gunes S, Crowe S, et al. Two-year long safety and efficacy of deferasirox film-coated tablets in patients with thalassemia or lower/intermediate risk MDS: phase 3 results from a subset of patients previously treated with deferasirox in the ECLIPSE study. Exp Hematol Oncol. 2020;9:20. doi: 10.1186/s40164-020-00174-2. [DOI] [PMC free article] [PubMed] [Google Scholar]
- 27.Chen Y, Huang F, Xuan L. Upfront transplantation may have better outcomes than pretransplant cytoreductive therapy for treating patients with MDS-EB-1 or MDS-EB-2. Int J Cancer. 2021;149(5):1109–1120. doi: 10.1002/ijc.33608. [DOI] [PubMed] [Google Scholar]
- 28.Wei G, Ni W, Chiao JW, Cai Z, Huang H, Liu D. A meta-analysis of CAG (cytarabine, aclarubicin, G-CSF) regimen for the treatment of 1029 patients with acute myeloid leukemia and myelodysplastic syndrome. J Hematol Oncol. 2011;4:46. doi: 10.1186/1756-8722-4-46. [DOI] [PMC free article] [PubMed] [Google Scholar]
- 29.Jilg S, Hauch RT, Kauschinger J, Buschhorn L, Odinius TO, Dill V, et al. Venetoclax with azacitidine targets refractory MDS but spares healthy hematopoiesis at tailored dose. Exp Hematol Oncol. 2019;8:9. doi: 10.1186/s40164-019-0133-1. [DOI] [PMC free article] [PubMed] [Google Scholar]
- 30.Xuan L, Wang Y, Huang F, Fan Z, Xu Y, Sun J, et al. Sorafenib maintenance in patients with FLT3-ITD acute myeloid leukaemia undergoing allogeneic haematopoietic stem-cell transplantation: an open-label, multicentre, randomised phase 3 trial. Lancet Oncol. 2020;21(9):1201–1212. doi: 10.1016/S1470-2045(20)30455-1. [DOI] [PubMed] [Google Scholar]
- 31.Ren Y, Mei C, Ye L, Luo Y, Zhou X, Yang H, et al. Analysis of clinical and molecular features of MDS patients with complex karyotype in China. Blood Cells Mol Dis. 2019;75:13–19. doi: 10.1016/j.bcmd.2018.11.006. [DOI] [PubMed] [Google Scholar]
- 32.Schanz J, Tüchler H, Solé F, Mallo M, Luño E, Cervera J, et al. New comprehensive cytogenetic scoring system for primary myelodysplastic syndromes (MDS) and oligoblastic acute myeloid leukemia after MDS derived from an international database merge. J Clin Oncol. 2012;30(8):820–829. doi: 10.1200/JCO.2011.35.6394. [DOI] [PMC free article] [PubMed] [Google Scholar]
- 33.Della Porta MG, Malcovati L, Boveri E, Travaglino E, Pietra D, Pascutto C, et al. Clinical relevance of bone marrow fibrosis and CD34-positive cell clusters in primary myelodysplastic syndromes. J Clin Oncol. 2009;27(5):754–762. doi: 10.1200/JCO.2008.18.2246. [DOI] [PubMed] [Google Scholar]
- 34.Marisavljević D, Rolović Z, Cemerikić V, Bosković D, Colović M. Myelofibrosis in primary myelodysplastic syndromes: clinical and biological significance. Med Oncol. 2004;21(4):325–331. doi: 10.1385/MO:21:4:325. [DOI] [PubMed] [Google Scholar]
- 35.Santini V, Prebet T, Fenaux P, Gattermann N, Nilsson L, Pfeilstöcker M, et al. Minimizing risk of hypomethylating agent failure in patients with higher-risk MDS and practical management recommendations. Leuk Res. 2014;38(12):1381–1391. doi: 10.1016/j.leukres.2014.09.008. [DOI] [PubMed] [Google Scholar]
- 36.Liu H. Emerging agents and regimens for AML. J Hematol Oncol. 2021;14(1):49. doi: 10.1186/s13045-021-01062-w. [DOI] [PMC free article] [PubMed] [Google Scholar]
- 37.Soll E, Massumoto C, Clift RA, Buckner CD, Appelbaum FR, Storb R, et al. Relevance of marrow fibrosis in bone marrow transplantation: a retrospective analysis of engraftment. Blood. 1995;86(12):4667–4673. doi: 10.1182/blood.V86.12.4667.bloodjournal86124667. [DOI] [PubMed] [Google Scholar]
- 38.Rajantie J, Sale GE, Deeg HJ, Amos D, Appelbaum F, Storb R, et al. Adverse effect of severe marrow fibrosis on hematologic recovery after chemoradiotherapy and allogeneic bone marrow transplantation. Blood. 1986;67(6):1693–1697. doi: 10.1182/blood.V67.6.1693.1693. [DOI] [PubMed] [Google Scholar]
- 39.Deeg HJ, Gooley TA, Flowers ME, Sale GE, Slattery JT, Anasetti C, et al. Allogeneic hematopoietic stem cell transplantation for myelofibrosis. Blood. 2003;102(12):3912–3918. doi: 10.1182/blood-2003-06-1856. [DOI] [PubMed] [Google Scholar]
- 40.Kröger N, Holler E, Kobbe G, Bornhäuser M, Schwerdtfeger R, Baurmann H, et al. Allogeneic stem cell transplantation after reduced-intensity conditioning in patients with myelofibrosis: a prospective, multicenter study of the Chronic Leukemia Working Party of the European Group for Blood and Marrow Transplantation. Blood. 2009;114(26):5264–5270. doi: 10.1182/blood-2009-07-234880. [DOI] [PubMed] [Google Scholar]
- 41.Hernández-Boluda JC, Pereira A, Kröger N, Beelen D, Robin M, Bornhäuser M, et al. Determinants of survival in myelofibrosis patients undergoing allogeneic hematopoietic cell transplantation. Leukemia. 2021;35(1):215–224. doi: 10.1038/s41375-020-0815-z. [DOI] [PubMed] [Google Scholar]
Associated Data
This section collects any data citations, data availability statements, or supplementary materials included in this article.
Data Availability Statement
All data generated or analyzed during this study are included in this manuscript.