

Abstract
Objective
The pediatric Appendicitis Risk Calculator (pARC) is a validated clinical tool for assessing a child’s probability of appendicitis. We aimed to assess the performance of the pARC in community emergency departments (EDs), and to compare the performance of pARC with the Pediatric Appendicitis Score (PAS).
Methods
We conducted a prospective validation study from 10/1/16 to 4/30/18 in 11 community EDs serving general populations. Patients 5–20.9 years old with a chief complaint of abdominal pain and ≤5 days of right-sided or diffuse abdominal pain were eligible for study enrollment. Our primary outcome was the presence or absence of appendicitis within 7 days of the index visit. We reported performance characteristics and secondary outcomes by pARC risk strata and compared the receiver operator characteristic (ROC) curves of the PAS and pARC.
Results
We enrolled 2,089 patients with a mean age of 12.4 years, 46% of whom were male. Appendicitis was confirmed in 353 patients (16.9%), of whom 55 (15.6%) were perforated. Fifty-four percent of patients were very low (<5%) or low (5 – 14%) predicted risk, 43% were intermediate-risk (15 – 84%), and 4% were high-risk (≥85%). In the very low- and low-risk groups, 1.4% and 3.0% of patients had appendicitis, respectively. The area under the ROC curve was 0.89 (95% CI 0.87–0.92) for the pARC compared to 0.80 (95% CI 0.77–0.82) for the PAS.
Conclusion
The pARC accurately assessed appendicitis risk for children 5 years and older in community EDs and the pARC outperformed the PAS.
Introduction
Pathological inflammation of the appendix—appendicitis—is the most common surgical emergency in children.1 While treatment of appendicitis is effective, making the diagnosis in children can be challenging.2–5 This diagnostic dilemma fuels practice variability and potentially increases unnecessary imaging.6–10 Of specific concern, increased use of computed tomography (CT) scans exposes children to ionizing radiation and the potential risk of future malignancies without adequate evidence of improved appendicitis outcomes.11–15 High utilization of CT is of particular concern in the community setting, where in a 2008–2012 review of over 2,500 pediatric patients, more than half of patients who underwent appendectomy had a CT scan; and those in general EDs were about 8 times more likely to undergo CT imaging than a child evaluated in a facility with specialized pediatric resources.16 Ultrasound use shows promise and may mitigate overuse of CT, but its performance is operator- and facility-dependent.17 Reliably identifying a patient’s risk of appendicitis could improve care and reduce unnecessary imaging as well as associated costs and complications. To this end, appendicitis risk scores have been developed and studied.
The pediatric appendicitis risk calculator (pARC) is one such tool.18 Variables include sex, age, duration of pain, guarding, pain migration, maximal tenderness in the right-lower quadrant, and absolute neutrophil count (ANC). The pARC incorporates subtle and previously observed interactions by age and gender regarding appendicitis risk and utilizes ANC on a continuous scale. Thus, the pARC requires use of an online or electronic health record (EHR) integrated calculator, differing from integer-tally scores such as the Alvarado or the Pediatric Appendicitis Score (PAS).19,20 In its prior validation in an academic children’s hospital cohort with a 35% baseline risk for appendicitis, the pARC was able to accurately sort nearly half of patients into either a low (<15%) or high (≥85%) probability of appendicitis category.18 This ability to discriminate high- and low-risk strata is an improvement over other scores, since accurate classification at either end of the risk spectrum may obviate the need for imaging. Yet, like many pediatric clinical decision tools, those for pediatric appendicitis have rarely been studied in the community setting in which they are most likely to be used.21,22 Validation in the setting in which a tool is employed is a core tenet of a robust decision tool.22 The aims of the current study were to evaluate the performance of pARC when used in a community emergency department (ED) setting and to compare its performance to the PAS.
Methods
Study Design and Setting
We conducted this multicenter, prospective, observational cohort validation study of the pARC from 10/1/2016 to 4/20/2018 in 11 community EDs serving general populations in Kaiser Permanente Northern California (KPNC). These study centers are a subset of a larger 17-center cluster-randomized trial of electronic clinical decision support to aid in the diagnostic evaluation of children with acute abdominal pain (NCT02633735). KPNC is an integrated healthcare delivery system that provides comprehensive medical care for more than 4 million members, who are representative of the ethnic and socioeconomic diversity of the surrounding population.23 KPNC is a learning healthcare system with an applied research agenda, and is supported by a comprehensive integrated EHR (Epic, Verona, WI), which includes inpatient, outpatient, emergency, pharmacy, laboratory and imaging data.24,25 The KPNC Institutional Review Board approved the study with a waiver of informed consent.
The 2017 cumulative annual census of the 11 participating EDs was 793,000 with over 136,000 (17.2%) patients in our study age range of 5 to 20.9 years. None of these facilities are university-based, but 5 have academic emergency medicine affiliations and 4 are referral centers for pediatric appendectomies. Referral centers staffed pediatric surgeons, and non-referral centers varied in the age at which they would transfer patients to KPNC referral centers for appendectomy. All EDs were staffed by general emergency medicine residency-trained (board-certified or board-eligible) physicians. EDs had 24-hour access to CT imaging and variable but daily access to ultrasonography.
Selection of Participants
We included ED patients aged 5–20.9 years with a chief complaint of recent-onset (≤120 hours) generalized or right-sided abdominal pain. Physicians were trained by a local study-champion to enroll eligible patients into a web-services based clinical decision support system (CDSS) from within the ED Navigator menu of the EHR. This KPNC CDSS has been successfully used in other clinical applications.26,27 In addition to CDSS familiarity from prior studies and ongoing education by a study-champion, we began sending electronic text alerts to physician smartphones three months into the study period to notify them that a patient assigned to them in the EHR might be study-eligible.28
As in the derivation and validation studies, patients were ineligible for enrollment if they had any of the following: abdominal trauma within 7 days, current pregnancy, history of prior abdominal surgery including appendectomy, inflammatory bowel disease, chronic pancreatitis, sickle cell anemia, cystic fibrosis, and other conditions that might affect the ability to obtain an accurate history or physical exam (comprehensive exclusion list available upon request). In cases of multiple enrollments due to more than one visit, only the first enrollment was included. The CDSS was open to advanced practitioners and trainees, but we limited data inclusion to that entered by attending physicians.
Data Collection
After opening the CDSS, physicians were presented with pre-populated patient-specific eligibility criteria for editing and confirmation (screenshots of the CDSS are in Figure E1, available online at http://www.annemergmed.com). If the patient met study criteria, the physician advanced the CDSS to the data collection screen to input seven variables from the history and physical examination. For this analysis, pARC scores were calculated post-hoc in patients for whom a white blood cell count (WBC) was obtained in the ED and where pARC CDSS clinical data were otherwise complete. At this point as part of the parent study, physicians at certain intervention sites were presented the pARC score, and others at control sites were not.
Outcome Measures
Our primary outcome measure was the presence or absence of acute appendicitis within 7 days of the index visit. Acute appendicitis was identified by screening for 7 days from the index visit for an ED or hospital diagnosis of appendicitis and/or Current Procedural Terminology (CPT®) code for appendectomy. Our outcomes verification process reflected principles established for robustness in research involving chart review.29 Outcome reviewers were blinded to the pARC score and the PAS. If operative and pathology reports were available, outcome verification was performed by text string search algorithms and manual chart review. If these two methods were discordant or ambiguous then a second reviewer assessed the data. Discordant manual assessments were adjudicated by a third reviewer. If manual review confirmed that no operative or pathology reports were available, then the chart, imaging, and discharge medication list were reviewed to identify the impression of acute appendicitis with a non-operative treatment plan. An imaging or ED diagnosis alone of appendicitis was insufficient to determine the outcome as appendicitis.
Our secondary outcomes were appendiceal perforation, negative appendectomy, and missed appendicitis within 7 days of the index visit. Appendiceal perforation for those undergoing appendectomy was determined by the surgeon’s intra-operative note for keywords such as: presence of abscess, peritonitis, complex appendicitis, or purulent material. Enrolled patients who were discharged after their index ED visit and subsequently met our study definition of acute appendicitis within 7 days were considered to be a missed appendicitis case. We searched our claims database for potential missed appendicitis-related healthcare visits outside of KPNC whose index visit may have been within KPNC. Cases of missed appendicitis were adjudicated by four study investigators (AK, EK, DB, LS). Negative appendectomies were defined as appendectomies in which the pathology revealed no evidence of appendiceal inflammation.
We tracked appendectomy procedures and principal diagnosis of appendicitis for patients who were eligible to be enrolled but were not enrolled. We report the size of this cohort and the presumed appendicitis rate.
pARC and PAS
For each patient, we calculated the pARC score and the PAS (see Table E2 for pARC and PAS variables, available online at http://www.annemergmed.com). The pARC variables include sex, age, duration of pain, guarding, pain migration, maximal tenderness in the right-lower quadrant, and ANC.18 When ANC was unavailable (5% of cases), it was estimated from the WBC (see Table E5, available online at http://www.annemergmed.com).18,28 The PAS variables include cough / percussion / hopping tenderness in the right lower quadrant (RLQ), anorexia, pyrexia, nausea / emesis, tenderness over the right iliac fossa, leukocytosis, neutrophilia, and migration of pain to the RLQ.30 The pARC differs from the PAS in that it provides the risk of appendicitis on a continuous scale. The pARC was developed in a sample of children with suspected appendicitis defined as undergoing laboratory testing, diagnostic imaging, or a surgical consultation for appendicitis in patients 5 to 18 years old, with a 40% rate of appendicitis.18 The pARC equation can be found in Table E5 (available online at http://www.annemergmed.com).
We sorted pARC into one of seven clinically-actionable risk strata: <5%, 5–14%, 15–24%, 25–49%, 50–74%, 75–84%, and ≥85%. Qualitatively, we described the <5% group as very low-risk, 5–14% as low-risk, 15–84% as intermediate-risk, and ≥85% as high-risk. These strata were chosen by multidisciplinary study-team consensus as having distinct diagnostic or management approaches.
Validation
We report discriminatory performance features (sensitivity, specificity, positive predictive value, negative predictive value, and positive and negative likelihood ratios) and secondary outcomes (missed appendicitis, perforation, and negative appendectomy) by risk strata. Overall discriminatory performance was evaluated and compared for the pARC and the PAS by generating the receiver operating characteristic (ROC) curve and the area under the curve (AUC) statistic. We also report the AUC statistic range by facility. In order to best represent the discriminatory performance of the pARC, we initially excluded patients transferred outside of KPNC. In sensitivity analysis, we included these transfer patients with a presumed diagnosis of appendicitis. As part of validating the pARC in this newly-studied population, we estimated the calibration intercept and slope. This was achieved by regressing the logit of pARC values to the observed appendicitis outcome using logistic regression,31 plotting the observed and predicted appendicitis risk from pARC and calibrating pARC according to a decile partition of the distribution of pARC (calibration plot), and computing the Hosmer and Lemeshow Goodness of Fit (H-L GOF) test statistic. In addition, we estimated the H-L GOF test for the PAS.32,33 The data analysis was generated using SAS/STAT software, Version 9.4, SAS Institute Inc, Cary, NC, USA.
Very Low pARC Score with Appendicitis
We manually reviewed all cases with a very low pARC score (<5%) who were diagnosed with appendicitis. We present the collected variables for each of these cases as well as the pARC score and the presence of perforation or missed appendicitis.
Results
Study Population
Over the 18-month study period, our study included 2,089 patients from 11 community facilities with a median of 151 patients (interquartile range [IQR] 107–283) per facility. Four hundred and fifteen providers enrolled patients with a median of 4 enrollees per provider (IQR 2–7). The median patient age was 12 years (IQR 9–16). Clinical characteristics and study flow are provided in Table 1 and Figure 1, respectively. Of enrolled patients, 46% were male and 56% presented with <24 hours of pain. The most commonly reported symptoms were nausea or vomiting (69%). The median white blood cell count was 9.9 (IQR 7.5–13.5). Appendicitis was confirmed in 353 cases (16.9%).
Table 1.
Study population characteristics
| Characteristic | Cohort, n (%) N = 2,089 |
|---|---|
| Median age, y (IQR) | 12 (9–16) |
| Sex and age, y, n (%) | |
| Male | 963 (46) |
| 5–7.9 | 221 (11) |
| 8–13.9 | 446 (21) |
| 14–20.9 | 296 (14) |
| Female | 1,026 (54) |
| 5–7.9 | 173 (8) |
| 8–11.9 | 300 (14) |
| 12–20.9 | 653 (31) |
| Reported clinical presentation, n (%) | |
| Duration of abdominal pain, h | |
| <24 | 1,179 (56) |
| 24–47 | 307 (15) |
| 48–120 | 603 (29) |
| Nausea or vomiting | 1,436 (69) |
| Pain with walking or hopping | 1,004 (48) |
| Migration of pain to RLQ | 660 (32) |
| Findings on examination, n (%) | |
| Maximal tenderness in RLQ | 1,009 (48) |
| Abdominal guarding | 524 (25) |
| Median laboratory results (IQR) | |
| WBC (x10^3/μL) | 9.9 (7.5–13.5) |
| ANC (x10^3/μL) | 6.8 (4.43–10.53) |
| Appendicitis confirmed, n (%) | 353 (17) |
ANC = absolute neutrophil count, pARC = pediatric appendicitis risk calculator RLQ = right lower quadrant, WBC = white blood cell count
Figure 1.
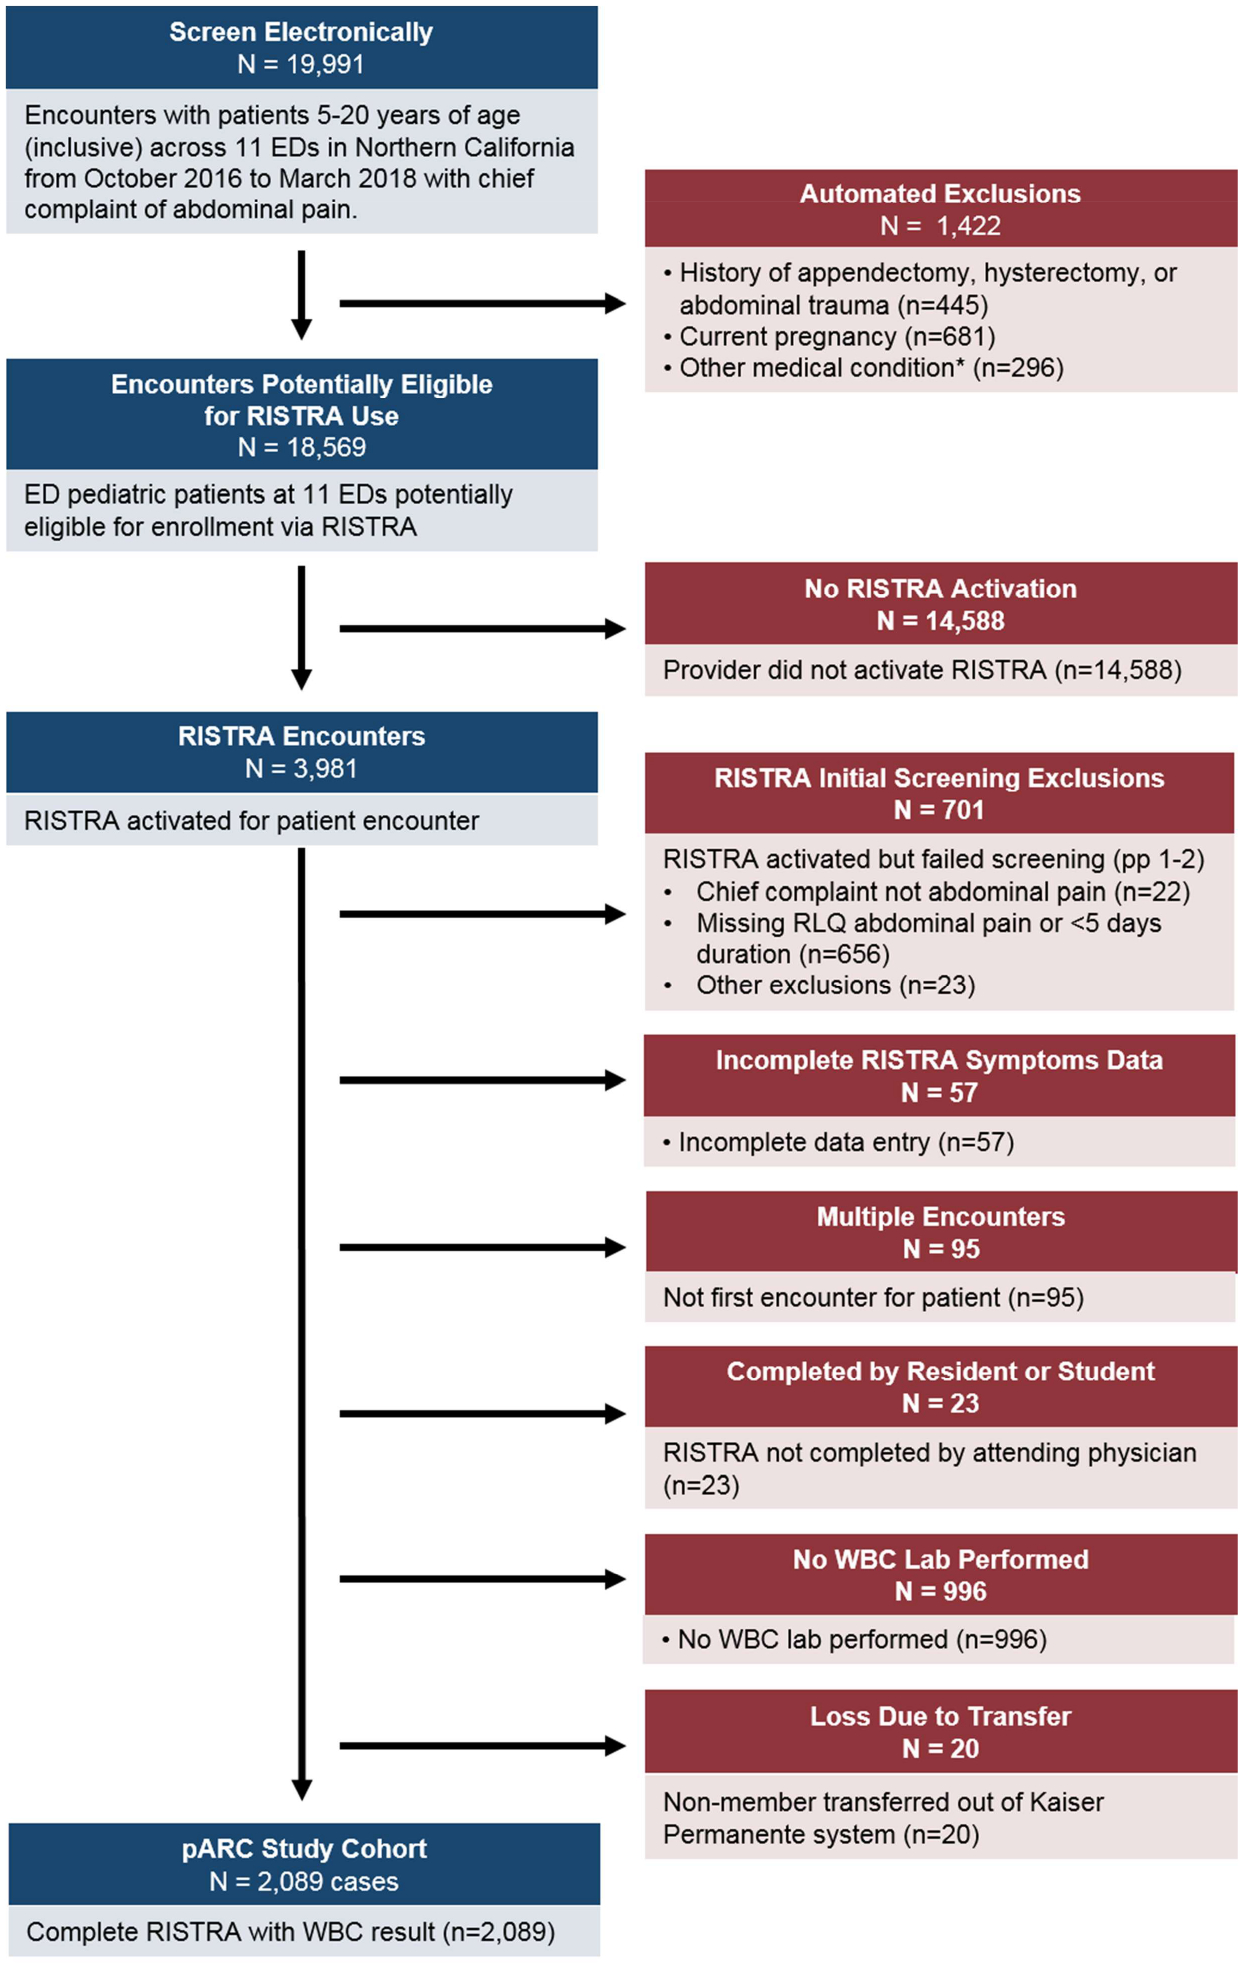
Flow diagram
pARC = pediatric Appendicitis Risk Calculator, RISTRA = A clinical decision support system RISk STRAtification tool embedded in the electronic health record, RLQ = right lower quadrant, WBC = white blood cell count
Score Validation
Performance characteristics for the pARC are shown in Table 2 and Table E3 (available online at http://www.annemergmed.com). Fifty-four percent of patients had a low- or very low-risk score and 4% had a high-risk score. The observed rate of appendicitis was 1.4% and 3.0% within the very low- and low-risk strata respectively, and 84.8% in the high-risk strata. The two lowest pARC strata had very high sensitivity, 100.0% and 97.5% for pARC <5% and 5–14%, respectively. The two highest pARC strata had very high specificity, 97.8% and 99.3% for pARC 65–84% and ≥85%, respectively.
Table 2.
pARC performance and safety outcomes by predicted probability of appendicitis
| pARC score*, % | Number of enrollees (% of total) | Appendicitis cases | Appendicitis prevalence, % (95% CI) | Sensitivity†, % (95% CI) | Specificity†, % (95% CI) | Missed appendicitis‡, n (%) | Perforation, n (%) | Negative appendectomy, n (%) | |
|---|---|---|---|---|---|---|---|---|---|
| <5% | Very low | 661 (32) | 9 | 1.4 (0.5–2.3) | 100.0 | 0 | 2 (0.3) | 0 | 4 (30.8) |
| 5–14% | Low | 462 (22) | 14 | 3.0 (1.4–4.6) | 97.5 (95.9–99.1) | 37.6 (35.3–39.9) | 0 | 0 | 4 (22.2) |
| 15–24% | Intermediate | 247 (12) | 19 | 7.7 (4.4–11.0) | 93.5 (90.9–96.1) | 63.4 (61.1–65.7) | 1 (0.4) | 1 (5.3) | 3 (13.6) |
| 25–49% | 335 (16) | 80 | 23.9 (19.3–28.5) | 88.1 (84.7–91.5) | 76.5 (74.5–78.5) | 2 (0.6) | 10 (12.5) | 8 (9.1) | |
| 50–74% | 230 (11) | 115 | 50.0 (43.5–56.5) | 65.4 (60.4–70.4) | 91.2 (89.9–92.5) | 4 (1.7) | 23 (20.0) | 3 (2.5) | |
| 75–84% | 75 (4) | 49 | 65.3 (54.5–76.1) | 32.9 (28.0–37.8) | 97.8 (97.1–98.5) | 0 (0.0) | 9 (18.4) | 0 (0.0) | |
| >=85% | High | 79 (4) | 67 | 84.8 (76.8–92.8) | 19.0 (14.9–23.1) | 99.3 (98.9–99.7) | 1 (1.3) | 12 (17.9) | 1 (1.5) |
| Total | 2,089 | 353 | 10 | 55 | 23 | ||||
pARC = pediatric Appendicitis Risk Calculator
Predicted probability of appendicitis
The test result was positive if the score was greater than or equal to the cut point ≥0, ≥5, ≥15, ≥25, ≥50, ≥75, ≥85
Missed appendicitis % as missed appendicitis cases per total number of patients in that risk strata
The overall pARC discriminatory performance was high, with an AUC of 0.89 (95% CI 0.87–0.92), which was better than the PAS AUC of 0.80 (95% CI 0.77–0.82). When compared to the PAS at any specificity, pARC sensitivity was higher (Figure 2). We also calculated discriminatory performance for both scores treating all patients transferred out of system (20 patients) as presumed appendicitis cases, instead of excluding them. No change in discriminatory performance was noted. Across facilities, the pARC AUC ranged from 0.85 to 0.94. The pARC demonstrated adequate calibration as seen in Figure 3. Calibration intercept was −.615, slope was 1.10, and H-L GOF test 11.81 (8 df, p=.16). The PAS H-L GOF test was 2.4 (5 df, p= .78).
Figure 2.
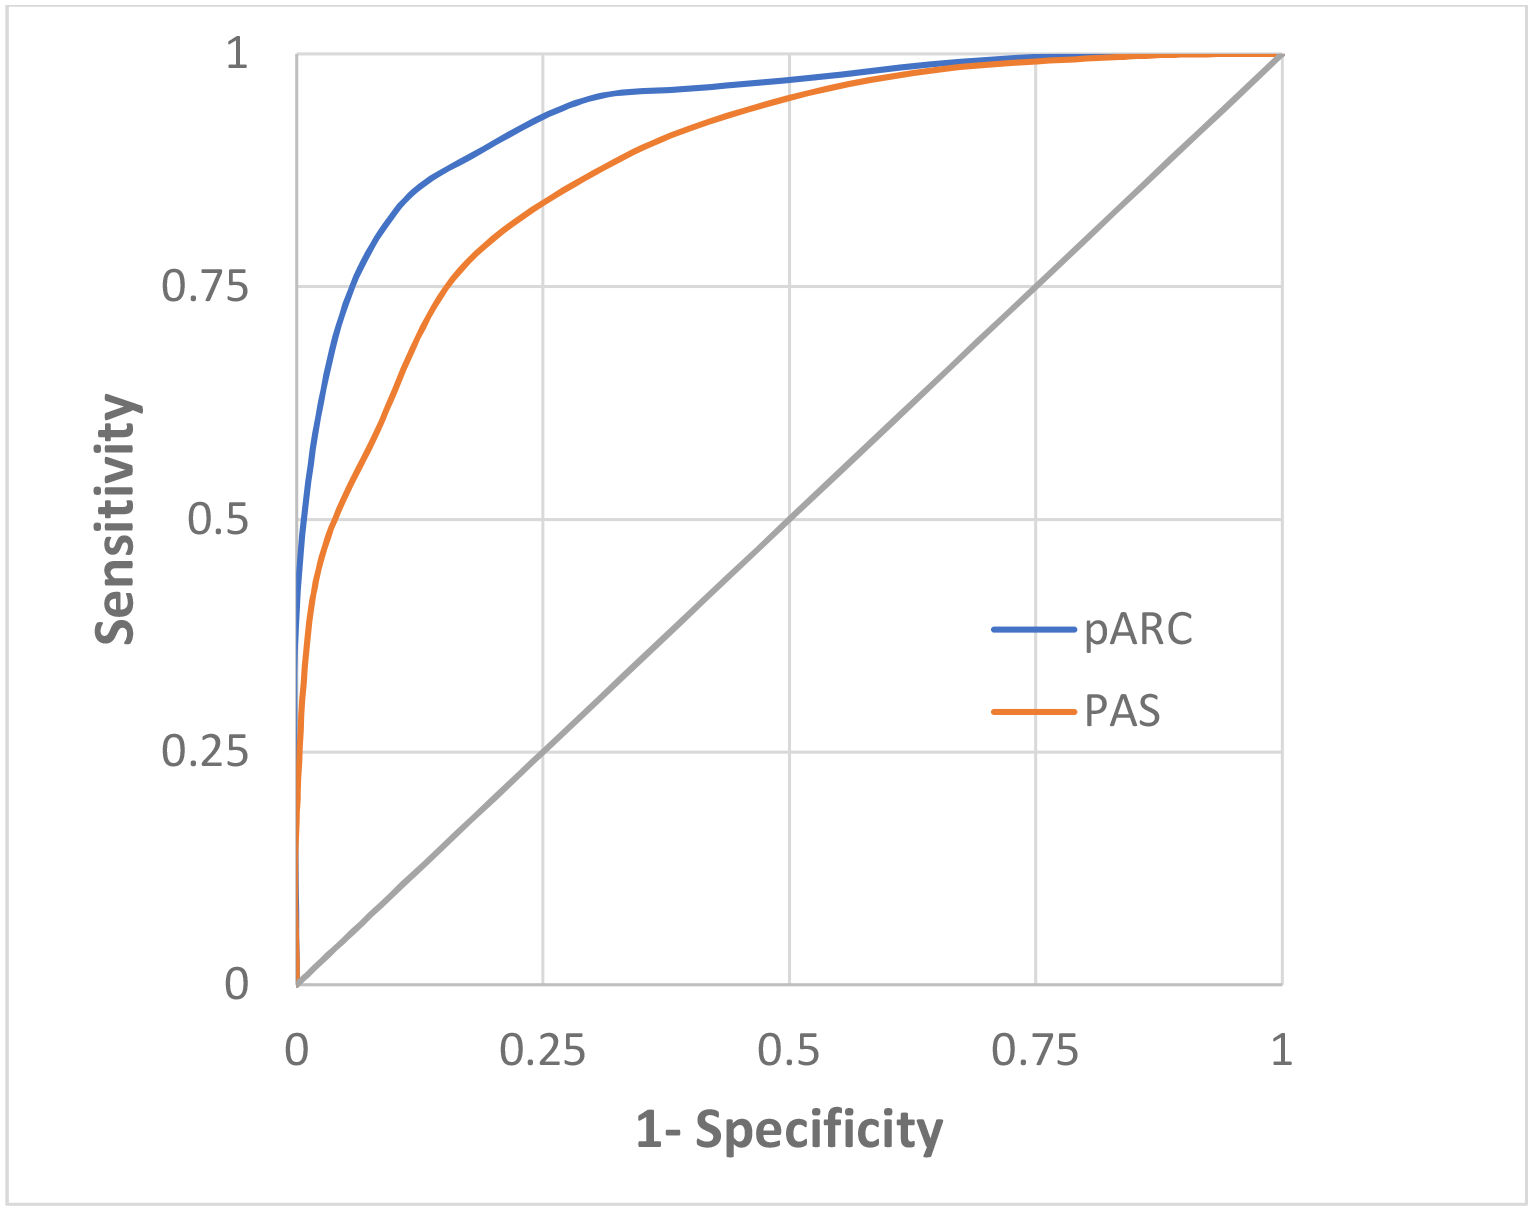
Receiver operator curve for pARC and PAS
pARC = pediatric Appendicitis Risk Calculator; PAS = Pediatric Appendicitis Score
pARC area under the curve 0.89 (95% CI 0.87–0.92), PAS area under the curve 0.80 (95% CI 0.77–0.82)
Figure 3.
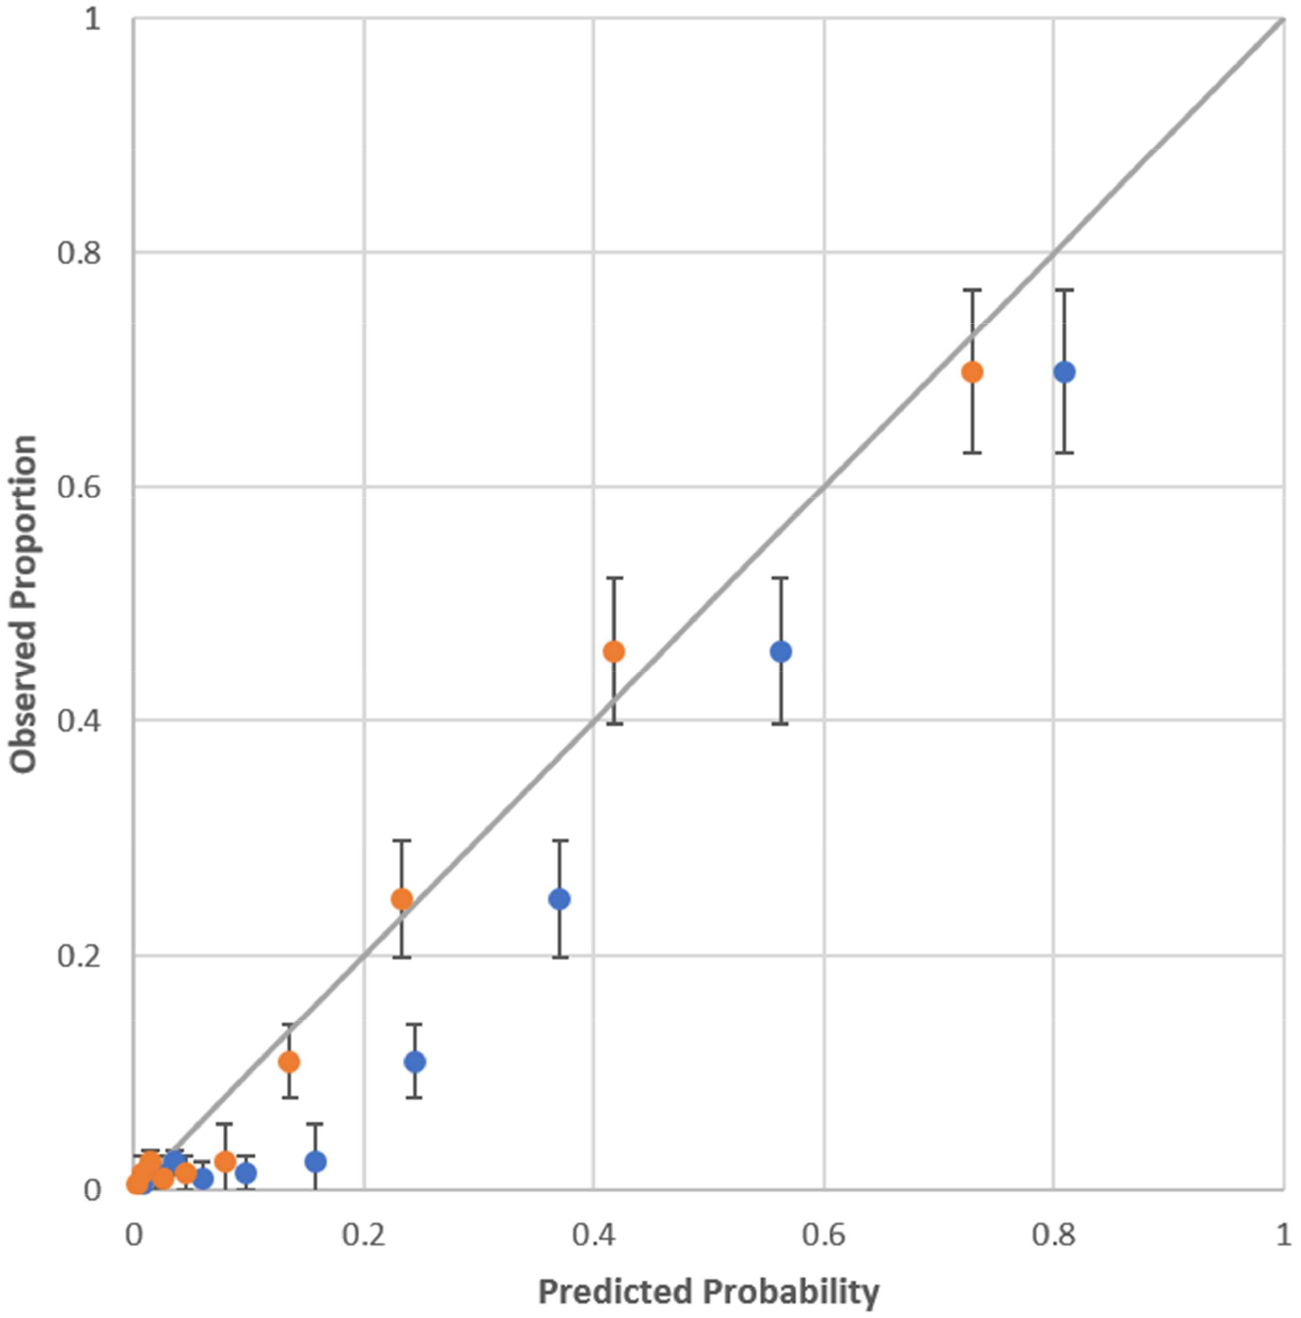
Calibration plot for pARC
Blue plot is pARC
Orange plot is pARC after calibration
Hosmer-Lemeshow goodness of fit 11.81 (p=0.160)
Calibration intercept and slope on the logit scale was −0.615 (SE 0.76, p<0.0001) and 1.10 (SE .057, p<0.0001)
Secondary Outcomes
The negative appendectomy rate (NAR) was 6.5%. The NAR was highest in the very low and low pARC scores (30.8% and 22.2% respectively) and 0.9% in our two highest risk strata combined (Table 2). The overall perforation rate was 15.6% and there were no perforations in the two lowest risk strata. There were 9 cases of missed appendicitis, 2 of which were in the very low-risk pARC strata.
Patients Not-Enrolled
During our study period there were 14,589 patients 5–20.9 years of age with a chief complaint of abdominal pain who received care in our 11 participating EDs but were not enrolled in our study. Of these, 126 (0.86%) had appendicitis. Demographic data comparing the enrolled and not-enrolled cohorts is available in Table E4 (available online at http://www.annemergmed.com).
Very Low pARC Score
Nine patients (1.4%) with pARC scores <5% had appendicitis (Table 3). Six of these patients were female, and 6 patients reported <24 hours of abdominal pain at the time of presentation. Several patients had post-enrollment documentation that suggested a progressing examination, but only one had clear documentation that would have moved the patient to an intermediate-risk pARC score, if recalculated. All nine patients had a normal WBC (3.7–11.1 ×10³/μL) and ANC (1.8–7.9 ×10³/μL) for our system reference. Two of these cases were missed appendicitis; both patients had <24 hours of symptoms. There were no cases of appendiceal perforation among those with a very low pARC score.
Table 3.
Characteristics of 9 patients with very low pARC scores who were diagnosed with appendicitis
| Case number | Age (y) | Sex | Duration of pain (h) | Walking | Migration | Maximal tenderness in the RLQ | Guarding | WBC (ANC) | Perforation | Missed appendicitis | pARC score*, % |
|---|---|---|---|---|---|---|---|---|---|---|---|
| 1 | 13 | F | <24 | No | Yes | Yes | No | 7.1 (3.4) | No | Yes | 2.1 |
| 2 | 19 | M | <24 | Yes | No | No | No | 5.0 (3.0) | No | No | 3.6 |
| 3 | 16 | F | 48–120 | Yes | Yes | Yes | No | 5.6 (2.1) | No | No | 3.4 |
| 4 | 7 | M | 48–120 | No | No | No | No | 6.5 (5.7) | No | No | 2.3 |
| 5 | 17 | F | <24 | No | Yes | No | No | 6.9 (3.9) | No | No | 0.9 |
| 6 | 19 | F | <24 | Yes | No | No | No | 8.8 (6.3) | No | No | 4.0 |
| 7 | 12 | M | <24 | No | No | No | No | 7.0 (4.3) | No | Yes | 2.2 |
| 8 | 20 | F | 48–120 | No | Yes | Yes | Yes | 7.1 (3.3) | No | No | 4.3 |
| 9 | 8 | F | <24 | No | No | No | No | 9.4 (7.2) | No | No | 3.7 |
ANC = absolute neutrophil count, pARC = pediatric appendicitis risk calculator, RLQ = right lower quadrant, WBC = white blood cell count
Predicted probability of appendicitis
Limitations
There are several limitations specific to our study. Although we have established that the pARC is accurate and safe for sorting patients into risk strata for appendicitis, we have not yet shown that it can be used to improve clinical care, such as lowering the rate of CT scans. Work to demonstrate improved imaging utilization is ongoing by our study team. Additionally, in contrast to previously studied integer-tally risk scores such as the PAS, the pARC requires the use of a calculator. Although these calculations could be achieved via integration with the EHR or web-based tools, it may prove a barrier in some clinical environments.34 If implementation hurdles can be overcome, there is evidence of substantial benefit supporting the efficacy of CDSS.27,35–38
Although the size of our cohort and the setting from which it was derived represent a substantial sample, our results may not be applicable to unique practice environments. As in the original pARC validation study, we did not include patients younger than 5 years of age, due to the inconsistent and protean manifestations of appendicitis in the very young.18,39,40 Despite these limitations, our pARC validation would apply to the majority of pediatric patients in the United States presenting to the ED with possible appendicitis.23
Discussion
In this study of the pARC performance within an integrated community-based health care system, pARC was validated as a reliable tool for classifying patients with suspected appendicitis into clinically relevant risk strata. The risk score did so while outperforming the PAS in terms of discrimination and overall model performance. This validation study may provide clinicians working in community EDs serving a general population with confidence that the pARC can be used to reliably estimate appendicitis risk.
Multiple clinical decision tools to aid in the diagnosis of pediatric appendicitis have been described.41,42 They vary widely in their congruence to published criteria for rigor in clinical decision rules.22,43 Two of the more well-studied scores include the PAS and Alvarado scores.8,44–49 Investigations of these tools have shown methodological or performance features that limit clinical application.20,50–52 Specifically, these tools generally place the majority of patients into intermediate-risk categories that indicate imaging utilization; this is in contrast to the pARC in which the majority of patients are sorted into low- and high-risk categories that could help mitigate imaging utilization. In addition, these decisions tools have rarely been studied in the setting in which the majority of children present – in community EDs.21
Another common shortcoming of clinical decision tools is capturing only a subset of the intended study population. This is frequently seen in studies of pediatric appendicitis which enroll patients already admitted to the hospital or after appendectomy has already been decided upon, far past a point where diagnostic decisions have been made by the initial provider.49 Such selection biases may miss true appendicitis cases, affect the performance characteristics of the tool, limit its generalizability, and likely contribute meaningfully to the heterogeneity of reported rates of appendicitis.53 Previous work has demonstrated that our triage identification of patients by a chief complaint of abdominal pain has a sensitivity of 97% for pediatric appendicitis cases presenting to the ED.54 Many of our study-eligible patients were not enrolled into the CDSS by the physician, possibly due to low suspicion for appendicitis, given this eligible but not enrolled cohort had a very low appendicitis rate of 0.86%. Since our triage identification is highly sensitive and our missed eligible appendicitis rate is very low, we believe we captured the majority of appendicitis cases presenting to the ED during the study period.
Our study adds to the existing literature on this topic in several ways. First, we studied a diverse group of pediatric patients, representative of the spectrum of pediatric patients presenting for acute care in the United States. Second, the discriminatory performance of the pARC was found to be higher than the previously studied PAS. Third, we described how the pARC provided more clinically actionable information than the PAS by stratifying the majority of patients into low- or high-risk strata. Finally, and importantly, the pARC provided these performance characteristics while maintaining patient safety, demonstrated by a negative appendectomy rate of 6.5% and perforation rate of 15.6%, which are comparable to published reviews of pediatric populations.5,12,55,56
There are exciting opportunities for further work to improve the pARC. One is to leverage the pARC’s dependence on an electronic calculator to allow for dynamic calibration of the score based on the appendicitis prevalence or practice setting in which a patient is being assessed for appendicitis. For example, when initiating the calculator, a user might select an academic children’s hospital setting (as in the original validation study) or community setting (as in this study) to set the calibration.31 Such dynamic calibration is not necessary for utility, as we have shown the pARC’s clinically useful performance without it, but it may offer a path to further improve the tool’s risk assessment. Other avenues may include risk stratifying patients for antibiotic-only treatment of appendicitis or studying pARC performance in non-ED settings such as urgent care.57
In this external validation study of more than 2,000 pediatric patients presenting for care in 11 community EDs, we have shown the pARC safely and accurately assesses appendicitis risk for children aged 5 years and over who may have appendicitis. Further study is needed to understand the impact of pARC on the clinical care of patients with suspected appendicitis.
Supplementary Material
Response Table 1.
pARC validation exclusions
| Diagnosis | ICD 9 Code | ICD 10 Code |
|---|---|---|
| Sickle cell disease | D57.0-.8xx | |
| Inflammatory bowel disease | 555, 555.x, 556, 556.x | K50.x |
| Cystic fibrosis | E84.x | |
| Acute pancreatitis | 577 | K85.x |
| Chronic pancreatitis | 577.1 | K85.x, K86 |
| Volvulus | 560.2 | K56.2 |
| Intestinal atresia/stenosis | 751.1, 751.2 | Q41.8, Q41.9 |
| Hirschsprung’s | 751.3 | Q43.1 |
| Cancer | 140–209 | C00-C96.Z |
| Bone marrow transplant | 41.0, 41.0x, | T86.00-.09, Z48.290, Z94.81 |
| Lupus | 710 | D68.62, M32.8-.10, M32.14-.15, M33.19 |
| Henoch-Schoenlein purpura | 287 | D69.0 |
| Juvenile rheumatoid arthritis | 714.3 | M08.00–99 |
| HIV | 42 | B20, B97.35 |
| Mental retardation | 317–319 | F72, F73 |
| Down’s and other chromosomal anomalies | 758.x | Q90, Q91, Q92, Q93 |
| Abdominal trauma | 863–868 | S36, S37, S38, S39 |
| Diverticulitis | K57.x | |
| Ulcerative enterocolitis | K51.0-.3xx | |
| Colitis | K51.5–9x, K52.0, K55 | |
| Hysterectomy | N993 | |
| ESRD/Dialysis | N18, N19, T82.4x, T85.6x, T85.7x, Y62.2, Y84.1, Z49.x, Z91.15, Z99.2 | |
| Transplant (heart, lung, liver, kidney) | T86.1x-.4x | |
| Pregnancy | O00-O99, O9A.x | |
| Appendicitis | K35, K36, K37, K38 | |
| Medication Type | GPI | |
| Anti-metabolite | 213000, 662500 | |
| Immunosuppressive | 994060, 994040, 994020, 994030, 994040, 130000 | |
| Growth factors | 824015 | |
| Antiretrovirals | 121060, 121050, 121080, 121085 | |
| NRTIs | 121090 | |
| Protease inhibitors | 121045, 121099 | |
| Others | 121025, 121020, 121030, 121099, 121030, 121095 | |
| Cystic fibrosis treatment | 512000 | |
| Sickle cell treatment | 828030 | |
| Inflammatory bowel disease treatment | 525050, 662700, 525000 | |
| Surgical Procedure | CPT | |
| Appendectomy | 44950–44979 | |
| ESRD/Dialysis | 90918–90999 | |
| Cholecystectomy | see intra-abdominal | |
| Colon Surgery | see intra-abdominal | |
| Gastric Bypass | 43843–43848 | |
| Hysterectomy | 58150–58573 | |
| Kidney transplant | 50220–50380 | |
| Liver transplant | 47010–47370 | |
| Heart transplant | 33930–33945 | |
| Intra-abdominal surgery | ||
CPT = current procedural terminology, ESRD = end-stage renal disease, GPI = generic product identifier, HIV = human immunodeficiency virus, ICD= international classification of disease, NRTI = nucleoside reverse transcriptase inhibitors
Funding Source:
Supported by the National Institutes of Health (R01 HD079463 [Kharbanda]). This study is registered on clinicaltrials.gov NCT02633735.
Footnotes
Publisher's Disclaimer: This is a PDF file of an unedited manuscript that has been accepted for publication. As a service to our customers we are providing this early version of the manuscript. The manuscript will undergo copyediting, typesetting, and review of the resulting proof before it is published in its final form. Please note that during the production process errors may be discovered which could affect the content, and all legal disclaimers that apply to the journal pertain.
Meetings
Presented in part at American College of Emergency Physicians, October 2018 (San Diego, CA)
Conflict of interest
All authors have nothing to disclose.
References
- 1.Scholer SJ, Pituch K, Orr DP, et al. Clinical outcomes of children with acute abdominal pain. Pediatrics. 1996;98(4 Pt 1):680–685. [PubMed] [Google Scholar]
- 2.Rothrock SG, Skeoch G, Rush JJ, et al. Clinical features of misdiagnosed appendicitis in children. Ann Emerg Med. 1991;20(1):45–50. [DOI] [PubMed] [Google Scholar]
- 3.Rasmussen T, Fonnes S, Rosenberg J. Long-term complications of appendectomy: a systematic review. Scand J Surg. 2018:1457496918772379. [DOI] [PubMed] [Google Scholar]
- 4.Hale DA, Molloy M, Pearl RH, et al. Appendectomy: a contemporary appraisal. Ann Surg. 1997;225(3):252–261. [DOI] [PMC free article] [PubMed] [Google Scholar]
- 5.Becker T, Kharbanda A, Bachur R. Atypical clinical features of pediatric appendicitis. Acad Emerg Med. 2007;14(2):124–129. [DOI] [PubMed] [Google Scholar]
- 6.Russell WS, Schuh AM, Hill JG, et al. Clinical practice guidelines for pediatric appendicitis evaluation can decrease computed tomography utilization while maintaining diagnostic accuracy. Pediatr Emerg Care. 2013;29(5):568–573. [DOI] [PubMed] [Google Scholar]
- 7.Bachur RG, Hennelly K, Callahan MJ, et al. Advanced radiologic imaging for pediatric appendicitis, 2005–2009: trends and outcomes. J Pediatr. 2012;160(6):1034–1038. [DOI] [PubMed] [Google Scholar]
- 8.Kobayashi E, Johnson B, Goetz K, et al. Does the implementation of a pediatric appendicitis pathway promoting ultrasound work outside of a children’s hospital? Am J Surg. 2018;215(5):917–920. [DOI] [PubMed] [Google Scholar]
- 9.Kharbanda AB, Madhok M, Krause E, et al. Implementation of electronic clinical decision support for pediatric appendicitis. Pediatrics. 2016;137(5). [DOI] [PubMed] [Google Scholar]
- 10.Garcia Peña BM, Cook EF, Mandl KD. Selective imaging strategies for the diagnosis of appendicitis in children. Pediatrics. 2004;113(1):24–28. [DOI] [PubMed] [Google Scholar]
- 11.Stephen AE, Segev DL, Ryan DP, et al. The diagnosis of acute appendicitis in a pediatric population: to CT or not to CT. J Pediatr Surg. 2003;38(3):367–371; discsussion 367–371. [DOI] [PubMed] [Google Scholar]
- 12.Partrick DA, Janik JE, Janik JS, et al. Increased CT scan utilization does not improve the diagnostic accuracy of appendicitis in children. J Pediatr Surg. 2003;38(5):659–662. [DOI] [PubMed] [Google Scholar]
- 13.Lee SL, Walsh AJ, Ho HS. Computed tomography and ultrasonography do not improve and may delay the diagnosis and treatment of acute appendicitis. Arch Surg. 2001;136(5):556–562. [DOI] [PubMed] [Google Scholar]
- 14.Miglioretti DL, Johnson E, Williams A, et al. The use of computed tomography in pediatrics and the associated radiation exposure and estimated cancer risk. JAMA Pediatr. 2013;167(8):700–707. [DOI] [PMC free article] [PubMed] [Google Scholar]
- 15.Brenner D, Elliston C, Hall E, et al. Estimated risks of radiation-induced fatal cancer from pediatric CT. AJR Am J Roentgenol. 2001;176(2):289–296. [DOI] [PubMed] [Google Scholar]
- 16.Kotagal M, Richards MK, Flum DR, et al. Use and accuracy of diagnostic imaging in the evaluation of pediatric appendicitis. J Pediatr Surg. 2015;50(4):642–646. [DOI] [PMC free article] [PubMed] [Google Scholar]
- 17.Kotagal M, Richards MK, Chapman T, et al. Improving ultrasound quality to reduce computed tomography use in pediatric appendicitis: the Safe and Sound campaign. Am J Surg. 2015;209(5):896–900; discussion 900. [DOI] [PMC free article] [PubMed] [Google Scholar]
- 18.Kharbanda AB, Vazquez-Benitez G, Ballard DW, et al. Development and validation of a novel pediatric appendicitis risk calculator (pARC). Pediatrics. 2018;141(4). [DOI] [PMC free article] [PubMed] [Google Scholar]
- 19.Bachur RG, Hennelly K, Callahan MJ, et al. Diagnostic imaging and negative appendectomy rates in children: effects of age and gender. Pediatrics. 2012;129(5):877–884. [DOI] [PubMed] [Google Scholar]
- 20.Mandeville K, Pottker T, Bulloch B, et al. Using appendicitis scores in the pediatric ED. Am J Emerg Med. 2011;29(9):972–977. [DOI] [PubMed] [Google Scholar]
- 21.Gausche-Hill M, Schmitz C, Lewis RJ. Pediatric preparedness of US emergency departments: a 2003 survey. Pediatrics. 2007;120(6):1229–1237. [DOI] [PubMed] [Google Scholar]
- 22.Maguire JL, Kulik DM, Laupacis A, et al. Clinical prediction rules for children: a systematic review. Pediatrics. 2011;128(3):e666–677. [DOI] [PubMed] [Google Scholar]
- 23.Gordon N, Lin T. The Kaiser Permanente Northern California adult member health survey. Perm J. 2016;20(4):34–42. [DOI] [PMC free article] [PubMed] [Google Scholar]
- 24.Bornstein S An integrated EHR at Northern California Kaiser Permanente: Pitfalls, challenges, and benefits experienced in transitioning. Applied clinical informatics. 2012;3(3):318–325. [DOI] [PMC free article] [PubMed] [Google Scholar]
- 25.Lieu TA, Platt R. Applied Research and Development in Health Care - Time for a Frameshift. The New England journal of medicine. 2017;376(8):710–713. [DOI] [PubMed] [Google Scholar]
- 26.Ballard DW, Vemula R, Chettipally UK, et al. Optimizing Clinical Decision Support in the Electronic Health Record. Clinical Characteristics Associated with the Use of a Decision Tool for Disposition of ED Patients with Pulmonary Embolism. Appl Clin Inform. 2016;7(3):883–898. [DOI] [PMC free article] [PubMed] [Google Scholar]
- 27.DR V, DG M, UK C, et al. Increasing safe outpatient management for emergency department patients with pulmonary embolism: a controlled pragmatic trial.: Ann Intern Med. 2018;169(12):855–865. [DOI] [PubMed] [Google Scholar]
- 28.Simon L, AS R, UK C, et al. Real-time text message alerts to emergency physicians identifying potential study candidates increases clinical trial enrollment. J Patient Cent Res Rev. 2018;5(S1):57 [abstract OA1.03]. [DOI] [PMC free article] [PubMed] [Google Scholar]
- 29.Kaji AH, Schriger D, Green S. Looking through the retrospectoscope: reducing bias in emergency medicine chart review studies. Ann Emerg Med. 2014;64(3):292–298. [DOI] [PubMed] [Google Scholar]
- 30.Samuel M Pediatric appendicitis score. J Pediatr Surg. 2002;37(6):877–881. [DOI] [PubMed] [Google Scholar]
- 31.Steyerberg EW, Borsboom GJ, van Houwelingen HC, et al. Validation and updating of predictive logistic regression models: a study on sample size and shrinkage. Stat Med. 2004;23(16):2567–2586. [DOI] [PubMed] [Google Scholar]
- 32.Altman DG, Vergouwe Y, Royston P, et al. Prognosis and prognostic research: validating a prognostic model. BMJ. 2009;338:b605. [DOI] [PubMed] [Google Scholar]
- 33.Altman DG, Royston P. What do we mean by validating a prognostic model? Stat Med. 2000;19(4):453–473. [DOI] [PubMed] [Google Scholar]
- 34.Jamoom E, Hing E. Progress with electronic health record adoption among emergency and outpatient departments: United States, 2006–2011. NCHS data brief. 2015(187):1–8. [PubMed] [Google Scholar]
- 35.Bennett P, Hardiker NR. The use of computerized clinical decision support systems in emergency care: a substantive review of the literature. J Am Med Inform Assoc. 2017;24(3):655–668. [DOI] [PMC free article] [PubMed] [Google Scholar]
- 36.Varghese J, Kleine M, Gessner SI, et al. Effects of computerized decision support system implementations on patient outcomes in inpatient care: a systematic review. J Am Med Inform Assoc. 2018;25(5):593–602. [DOI] [PMC free article] [PubMed] [Google Scholar]
- 37.Parikh RB, Kakad M, Bates DW. Integrating predictive analytics into high-value care: the dawn of precision delivery. JAMA. 2016;315(7):651–652. [DOI] [PubMed] [Google Scholar]
- 38.Stiell IG, Wells GA. Methodologic standards for the development of clinical decision rules in emergency medicine. Ann Emerg Med. 1999;33(4):437–447. [DOI] [PubMed] [Google Scholar]
- 39.Almaramhy HH. Acute appendicitis in young children less than 5 years: review article. Ital J Pediatr. 2017;43(1):15. [DOI] [PMC free article] [PubMed] [Google Scholar]
- 40.Hamid KA, Mohamed MA, Salih A. Acute appendicitis in young children: a persistent diagnostic challenge for clinicians. Cureus. 2018;10(3):e2347. [DOI] [PMC free article] [PubMed] [Google Scholar]
- 41.Altali K, Ruiz-Artacho P, Trenchs V, et al. [Hospital emergency room diagnosis of acute appendicitis in patients aged 2 to 20 years: the INFURG-SEMES score from the emergency infections study of the Spanish Society of Emergency Medicine]. Emergencias. 2017;29(4):231–236. [PubMed] [Google Scholar]
- 42.Aydin D, Turan C, Yurtseven A, et al. Integration of radiology and clinical score in pediatric appendicitis. Pediatr Int. 2018;60(2):173–178. [DOI] [PubMed] [Google Scholar]
- 43.Green SM, Schriger DL, Yealy DM. Methodologic standards for interpreting clinical decision rules in emergency medicine: 2014 update. Ann Emerg Med. 2014;64(3):286–291. [DOI] [PubMed] [Google Scholar]
- 44.Benabbas R, Hanna M, Shah J, et al. Diagnostic accuracy of history, physical examination, laboratory tests, and point-of-care ultrasound for pediatric acute appendicitis in the emergency department: a systematic review and meta-analysis. Acad Emerg Med. 2017;24(5):523–551. [DOI] [PubMed] [Google Scholar]
- 45.Bhatt M, Joseph L, Ducharme FM, et al. Prospective validation of the pediatric appendicitis score in a Canadian pediatric emergency department. Acad Emerg Med. 2009;16(7):591–596. [DOI] [PubMed] [Google Scholar]
- 46.Ebell MH, Shinholser J. What are the most clinically useful cutoffs for the Alvarado and Pediatric Appendicitis Scores? A systematic review. Ann Emerg Med. 2014;64(4):365–372.e362. [DOI] [PubMed] [Google Scholar]
- 47.Escriba A, Gamell AM, Fernandez Y, et al. Prospective validation of two systems of classification for the diagnosis of acute appendicitis. Pediatr Emerg Care. 2011;27(3):165–169. [DOI] [PubMed] [Google Scholar]
- 48.Goldman RD, Carter S, Stephens D, et al. Prospective validation of the pediatric appendicitis score. J Pediatr. 2008;153(2):278–282. [DOI] [PubMed] [Google Scholar]
- 49.Pogorelic Z, Rak S, Mrklic I, et al. Prospective validation of Alvarado score and Pediatric Appendicitis Score for the diagnosis of acute appendicitis in children. Pediatr Emerg Care. 2015;31(3):164–168. [DOI] [PubMed] [Google Scholar]
- 50.Dahabreh IJ, Adam GP, Halladay CW, et al. Diagnosis of Right Lower Quadrant Pain and Suspected Acute Appendicitis. Comparative Effectiveness Reviews. 2015;157. [PubMed] [Google Scholar]
- 51.Kulik DM, Uleryk EM, Maguire JL. Does this child have appendicitis? A systematic review of clinical prediction rules for children with acute abdominal pain. J Clin Epidemiol. 2013;66(1):95–104. [DOI] [PubMed] [Google Scholar]
- 52.Ohmann C, Yang Q, Franke C. Diagnostic scores for acute appendicitis. Abdominal Pain Study Group. Eur J Surg. 1995;161(4):273–281. [PubMed] [Google Scholar]
- 53.Carmelli G, Grock A, Picart E, et al. The nitty-gritty of clinical decision rules. Ann Emerg Med. 2018;71(6):711–713. [DOI] [PubMed] [Google Scholar]
- 54.Ekstrom HL, Kharbanda EO, Ballard DW, et al. Development of a clinical decision support system for pediatric abdominal pain in emergency department settings across two health systems within the Healthcare Systems Research Network. eGEMs. 2019. [DOI] [PMC free article] [PubMed] [Google Scholar]
- 55.Bendeck SE, Nino-Murcia M, Berry GJ, et al. Imaging for suspected appendicitis: negative appendectomy and perforation rates. Radiology. 2002;225(1):131–136. [DOI] [PubMed] [Google Scholar]
- 56.Kosloske AM, Love CL, Rohrer JE, et al. The diagnosis of appendicitis in children: outcomes of a strategy based on pediatric surgical evaluation. Pediatrics. 2004;113(1 Pt 1):29–34. [DOI] [PubMed] [Google Scholar]
- 57.Xu J, Adams S, Liu YC, et al. Nonoperative management in children with early acute appendicitis: A systematic review. J Pediatr Surg. 2017;52(9):1409–1415. [DOI] [PubMed] [Google Scholar]
Associated Data
This section collects any data citations, data availability statements, or supplementary materials included in this article.