

Abstract
Lung cancer is the leading cause of cancer‐related death worldwide, with an estimated 1.2 million deaths each year. Despite advances in lung cancer treatment, 5‐year survival rates are lower than ~15%, which is attributes to diagnosis limitations and current clinical drug resistance. Recently, more evidence has suggested that epigenome dysregulation is associated with the initiation and progress of cancer, and targeting epigenome‐related molecules improves cancer symptoms. Interestingly, some groups reported that the level of methylation of histone 3 lysine 4 (H3K4me3) was increased in lung tumors and participated in abnormal transcriptional regulation. However, a mechanistic analysis is not available. In this report, we found that the SET domain containing 1A (SETD1A), the enzyme for H3K4me3, was elevated in lung cancer tissue compared to normal lung tissue. Knockdown of SETD1A in A549 and H1299 cells led to defects in cell proliferation and epithelial‐mesenchymal transition (EMT), as evidenced by inhibited WNT and transforming growth factor β (TGFβ) pathways, compared with the control group. Xenograft assays also revealed a decreased tumor growth and EMT in the SETD1A silenced group compared with the control group. Mechanistic analysis suggested that SETD1A might regulate tumor progression via several critical oncogenes, which exhibited enhanced H3K4me3 levels around transcriptional start sites in lung cancer. This study illustrates the important role of SETD1A in lung cancer and provides a potential drug target for treatment.
Keywords: A549, H1299, H3K4me3, non‐small cell lung cancer, SETD1A
SETD1A was increased in lung cancer tissues compared with adjacent nontumor tissues and inversely correlated with overall survival status. Further research showed that STED1A silencing resulted in defects in cancer growth and EMT in vitro and in vivo. Mechanistic analysis suggested that SETD1A might regulate multiple critical oncogenes in lung cancer via global H3K4me3 levels.
INTRODUCTION
In the United States (US), a total of 228 150 estimated new lung cancer cases (men, 116 440 and women, 111 710) will be diagnosed in 2019, which is the second highest incidence rate among all types of cancer; lung cancer causes 142 670 estimated deaths (men, 76 650, women, 66 020).1 This number is over 1.2 million globally.2 Despite advances in research on lung cancer, 25% of cancer deaths are attributed to lung cancer, and the high mortality has been steady for more than 25 years.1 In contrast to other cancers, over 50% of lung cancer patients were diagnosed at a distant stage with locally or widely metastatic tumors, resulting in a poor 5‐year survival of ~15%.1, 3 In addition, current clinical drugs for lung cancer are often effective initially, with a later loss of function in the majority of patients, owing to drug resistance of the tumor cells.4 Therefore, it is urgent to identify novel biomarkers or molecular targets for early diagnosis and treatment.5
Recently, more evidence has suggested that epigenome dysregulation is associated with the initiation and progression of cancer.6 Epigenetic mechanisms include DNA methylation, noncoding RNA regulation, and histone modification, which mediates transcription of downstream genes by modification of nucleosomal histone proteins (H2A, H2B, H3, and H4), including acetylation, phosphorylation, ADP‐ribosylation, biotinylation, ubiquitination, and methylation.7 Indeed, recent studies demonstrated that aberrant histone methylation was often present in carcinoma and played an important role in tumorigenesis. For example, a genome‐wide study indicated that histone 3 lysine 27 methylation modification (H3K27me3) is more frequent in human cancer cells, including colon, breast, and prostate cancer cell lines, than in normal cells.8 Enhanced H7K79me2/3 promoted the transcription of HOXA9 and MEIS1, which are important drivers for leukemogenesis.9 In breast cancer cells, abnormal histone 4 arginine 3 methylation modification (H4R3me2a) of the ZEB1 promoter region activated ZEB1 expression and enhanced the epithelial‐mesenchymal transition (EMT) and cellular senescence in cancer.10 A meta‐analysis suggested that the expression of histone 3 lysine 4 methylation (H3K4me) was associated with the prognosis of patients with cancers, including lung, colon, pancreas, esophagus, liver, and cervical tumors.11 Interestingly, other research also indicated that an increased H4K4me3 level was present in lung adenocarcinoma cell lines and participated in abnormal transcriptional regulation. However, the mechanism is not clear.12, 13
In mammals, the methylation of H3K4 is mainly catalyzed by the SET1/KMT2 family of methyltransferase,14 whereas demethylation is performed by LSD1/2 and KDM5 family proteins.15, 16, 17, 18, 19 Recent evidence also demonstrated the close correlation between methyltransferase/demethylase and cancer processes.20 In this report, we found that SET domain containing 1A (SETD1A), a member of the SET1 family, was increased in lung tumors, and the knockdown of SETD1A with short hairpin RNA (shRNA) led to defects in cell proliferation and EMT, as evidenced by Western blots of the related proteins. Xenograft experiments also suggested that SETD1A silencing in A549 and H1299 lung cancer cells prevented tumorigenesis and EMT in nude mice. Mechanistic analysis indicated that SETD1A might regulate tumor progression via several critical oncogenes, which exhibited enhanced H3K4me3 levels around transcriptional start sites in lung cancer.
RESULTS
SETD1A participates in lung cancer progression in clinical cases
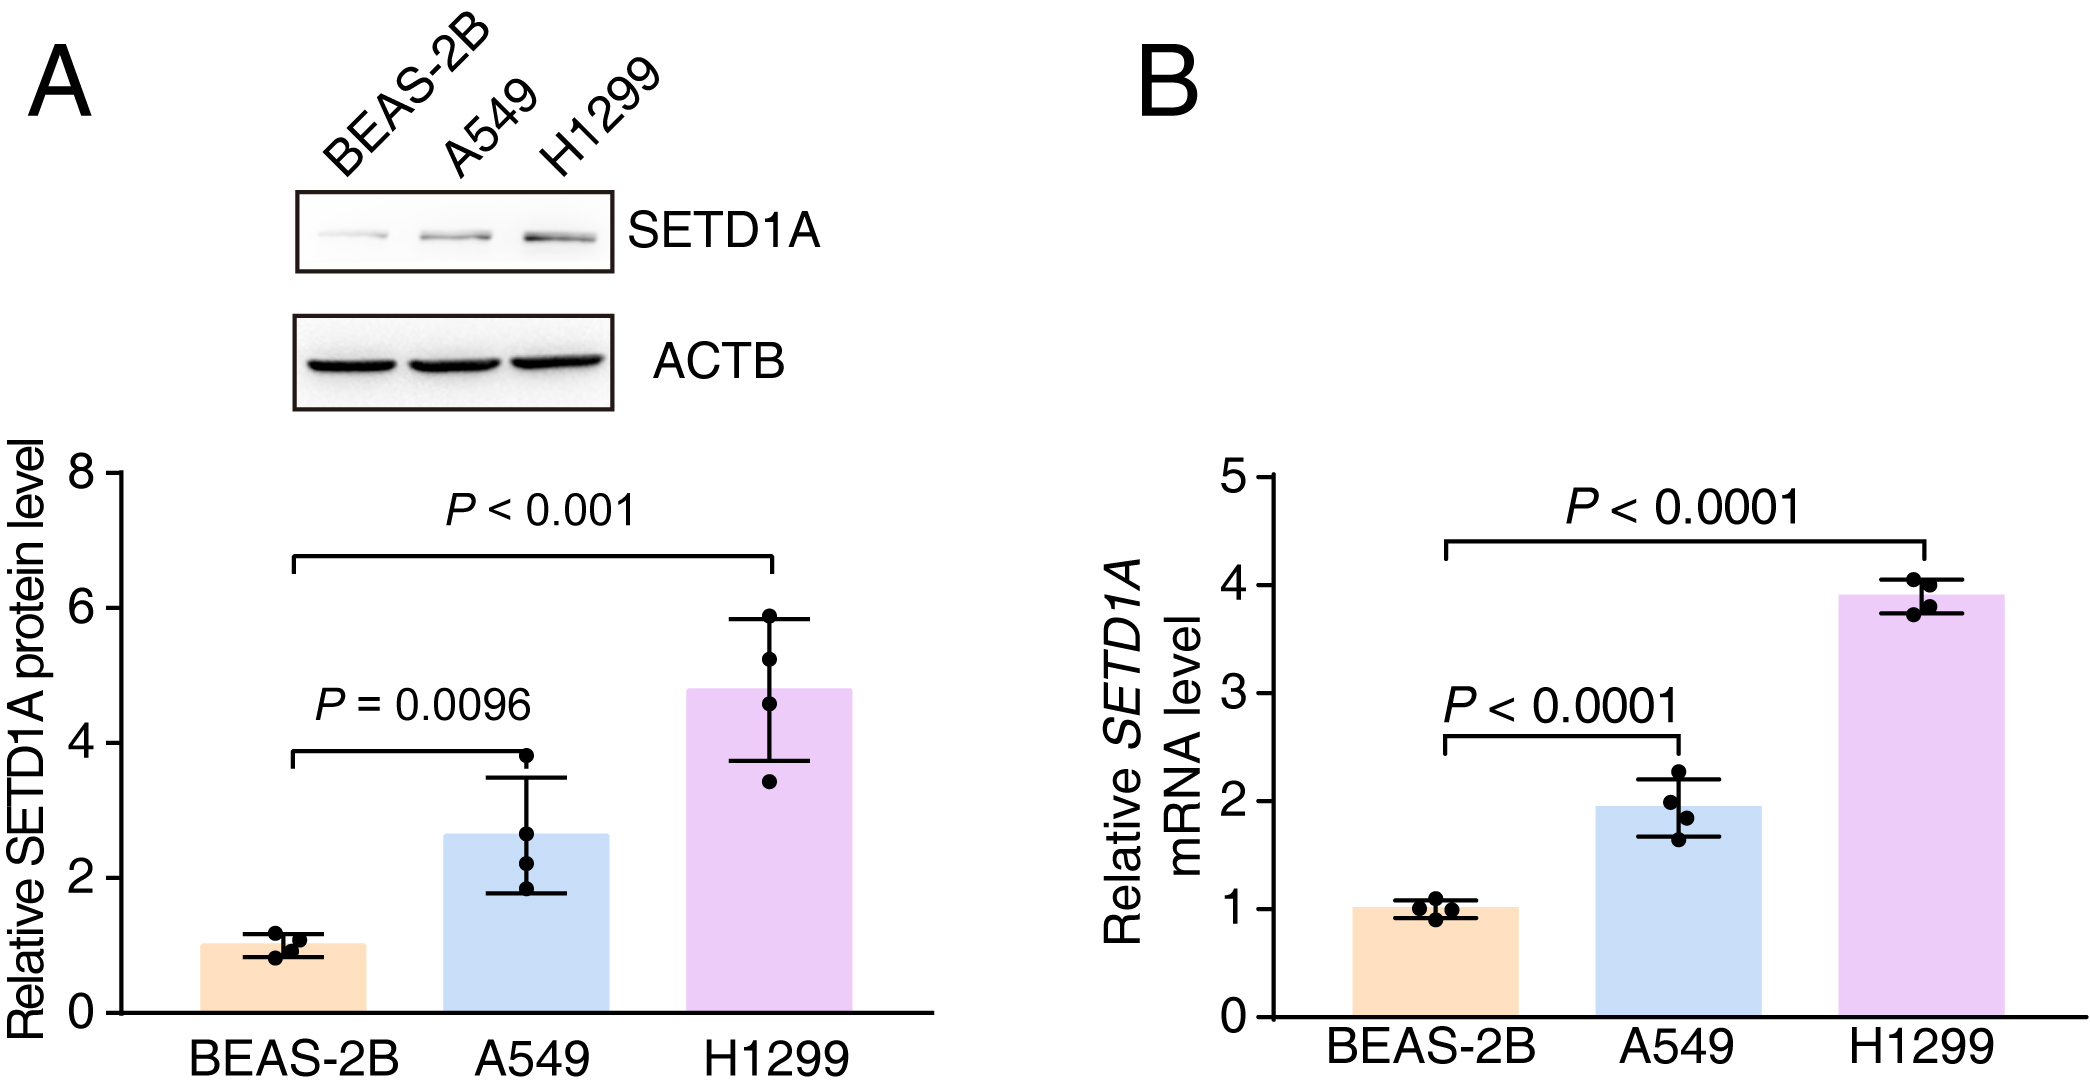
It was reported that SETD1A was associated with tumor progression in breast and colorectal cancer.21, 22 We analyzed changes in the copy numbers of the SETD1A gene among different cancers in The Cancer Genome Atlas (TCGA) database (7460 samples/7421 patients) and found that the amplification mutation was frequent in non‐small cell lung cancer (NSCLC) (Figure S1). Further analysis suggested that the SETD1A mRNA level was significantly elevated in samples, as either gain or amplification in copy number of SETD1A, compared to samples with shallow deletion or diploid mutations, which indicated that the amplification mutation of SETD1A loci led to upregulated SETD1A transcription in lung cancer (Figure 1(a)). The microarray data from other independent research groups also revealed that enhanced SETD1A messenger RNA (mRNA) was present in lung cancer tissue and gradually increased with the degree of malignancy of the lung tumors (Figure 1(b) and (c)).23 In addition, compared to small airway epithelial cells (SAEC), upregulated SETD1A was also found in nearly all lung adenocarcinoma cell lines (25/26)12 (Figure 1(d)). We also confirmed the enhanced expression of SETD1A in A549 and H1299 cell lines compared with BEAS‐2B cell, the normal human airway epithelium cell line (Figure S2). Moreover, Kaplan–Meier analysis on the OncoLnc website (data from TCGA) showed a high inverse correlation between the SETD1A level and survival rate of lung cancer patients (Figure 1(e)). The function of other components related to SETD1A methylation were also increased, and these changes were partly correlated with overall survival status (Figure S3). These results suggested that SETD1A was associated with tumor progression in lung cancer.
FIGURE 1.
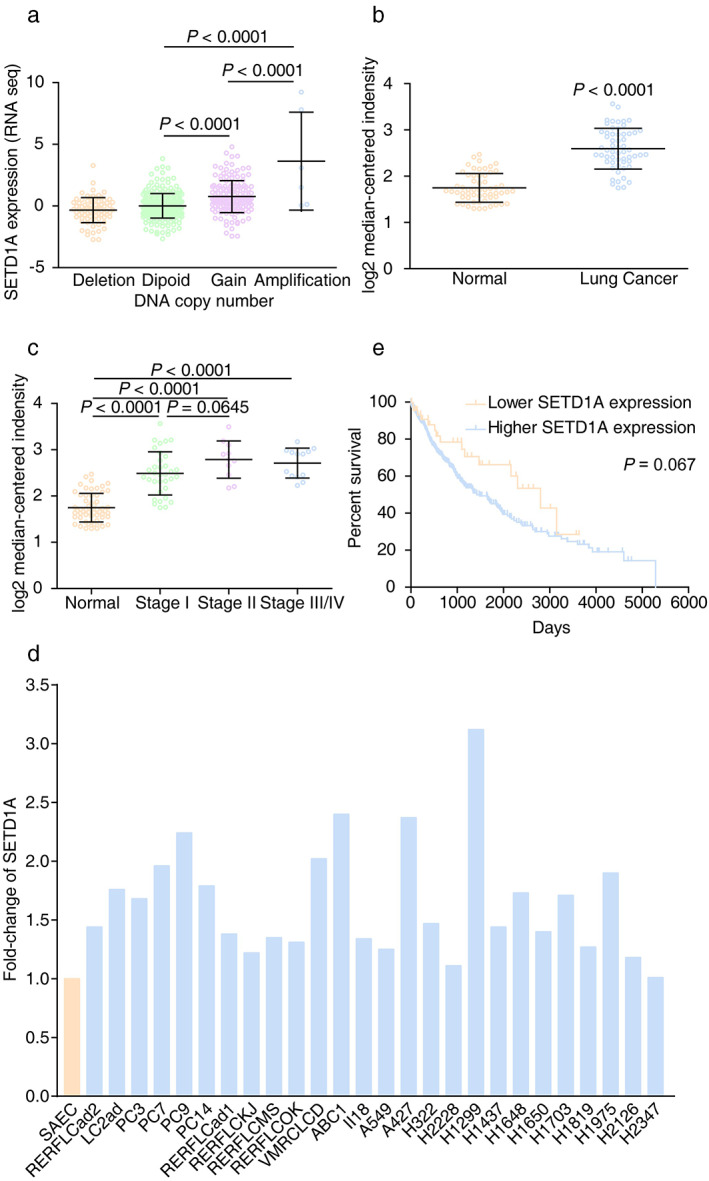
Upregulated SETD1A is associated with the disease process in lung cancer. (a) The mRNA levels of SETD1A with different SETD1A DNA copy numbers in lung cancer. (Shallow deletion, n = 79; diploid, n = 260; gain, n = 158; amplification, n = 6). Data were from the cBioportal database. (b) Lung adenocarcinoma and adjacent nontumor lung tissue were analyzed using the Illumina human WG‐6 v3.0 expression Beadchip and the expression of SETD1A between the two groups was determined (GEO DataSets, GSE32863, n = 58). (c) SETD1A mRNA levels in different stages of lung adenocarcinoma from a public dataset (GEO DataSets, GSE32863. Normal, n = 58; stage I, n = 34; stage II, n = 11; stage III/IV, n = 13). (d) Fold‐change of SETD1A levels in lung cancer cell lines compared to small airway epithelial cell (SAEC). Data were from previous reports.12 (e) Kaplan–Meier plot of cumulative overall survival of patients with lung carcinoma in the TCGA database. Patients in the 90% (SETD1A higher expression group, blue line, n = 440) were compared with patients in the lower 10% (SETD1A lower expression group, yellow line, n = 48). The p‐value of the log‐rank test comparing the two survival curves was 0.067. Statistical test of (a)–(c) were analyzed by using the Welch's t‐test after log transformation. n means independent biological sample
SETD1A promotes lung cancer cell proliferation and EMT
To address the role of elevated SETD1A in lung cancer, we selected the A549 and H1299 cell lines for functional analysis, which exhibited modest and enhanced SETD1A overexpression, respectively (Figure 1(d), Figure S2(a),(b)). We stably knocked down SETD1A in the human lung cancer cell lines A549 and H1299 with lentivirus‐encoded shRNAs (Figure 2(a),(b)). The cell viability assay revealed that SETD1A silencing in A549 or H1299 led to a quick and significant inhibition of cell proliferation, as evidenced by a two‐thirds reduction in cell number after 6 days in culture (Figure 2(c),(d)). Because the WNT pathway plays a critical role in stimulating lung cancer cell cycle progression,24 we assessed activated β‐catenin (non‐P‐CTNNB1) and cell cycle protein PCNA and found a robust decrease in the SETD1A silenced group compared with the control group (Figure 2(a),(b),(e),(f)). In addition, Western blotting of several important proteins associated with cell growth in lung cancer25, 26 also revealed significant reductions in SETD1A knockdown cells, including decreases in AKT1 and phosphorylated STAT3 (P‐STAT3) but not ERK signaling (P‐MAPK1) (Figure 2(e),(f)).
FIGURE 2.
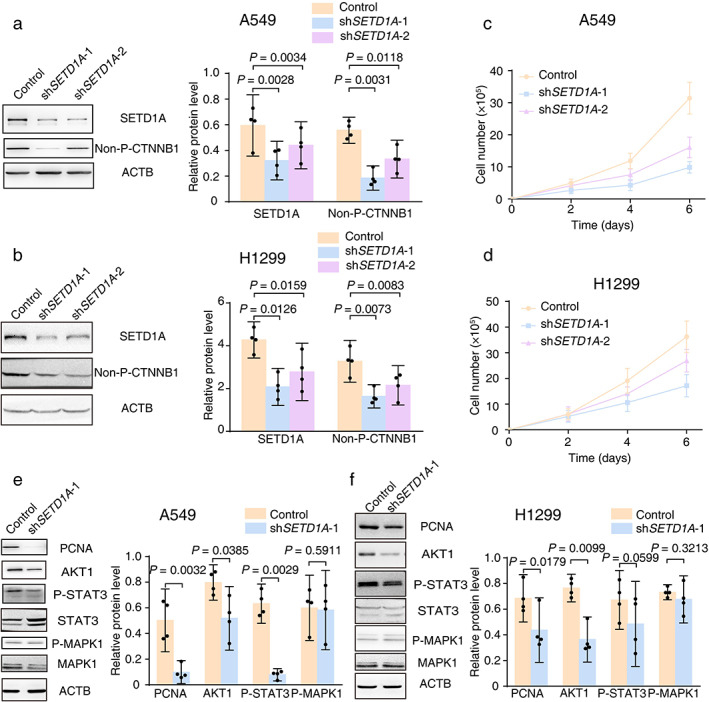
SETD1A silencing leads to a proliferative defect in the NSCLC cell line. (a) Stable knockdown of SETD1A in human lung adenocarcinoma cells was generated by transfection of lentiviral‐encoded shRNA into the A549 cell line. Western blotting of A549 treated with different shRNA was performed and the quantification results are listed in the right panel (n = 4). (b) Stable knockdown of SETD1A in the H1299 NSCLC cell line. The efficiency of knockdown tested with Western blots and quantification results are listed in the right panel (n = 4). (c),(d) Cell number of A549 (c) or H1299 (d) with shRNA‐SETD1A (shSETD1A‐1/2) and shRNA‐scrambled (control) were recorded at indicated time points (n = 5). (e),(f) Western blots of cell cycle‐related proteins were tested and the quantification results are listed in the right panel (n = 4). Control, A549/ H1299 with lentivirus packaged shRNA for the scrambled sequence. shSETD1A‐1 or 2, A549/ H1299 with lentivirus packaged shRNA for SETD1A mRNA at different binding sites. Statistical tests were analyzed by using paired t‐test after log transformation. n means independent biological sample
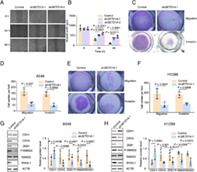
Migration ability is another important index of tumor severity. In light of the positive correlation between SETD1A expression and the degree of malignancy of lung cancer (Figure 1(c)), we first performed a wound healing assay to test directional motility of A549 cells. The results showed that the cells A549 lacking SETD1A moved more slowly compared with the control group (Figure 3(a)). Quantification analysis of wound width revealed that the migration ability was ~1.5‐ to 2‐fold faster in control A549 cells compared to knockdown cells (Figure 3(b)). In addition, we also monitored cell migration with a Transwell chamber experiment. Fewer A549 or H1299 cells passed through the porous membrane in the SETD1A knockdown group compared with the control group (Figure 3(c)–(f)), indicating that SETD1A could increase lung cancer cell migration. Next, the role of SETD1A in cell invasion was tested. Knockdown of SETD1A in A549 or H1299 significantly decreased the number of cells that passed through the Matrigel and porous supporting membrane, as evidenced by fewer cells stained with crystal violet (Figure 3(c)–(f)) compared with the control cells. In summary, these experiments indicated that SETD1A facilitated both cellular motility and invasiveness in lung cancer cells.
FIGURE 3.
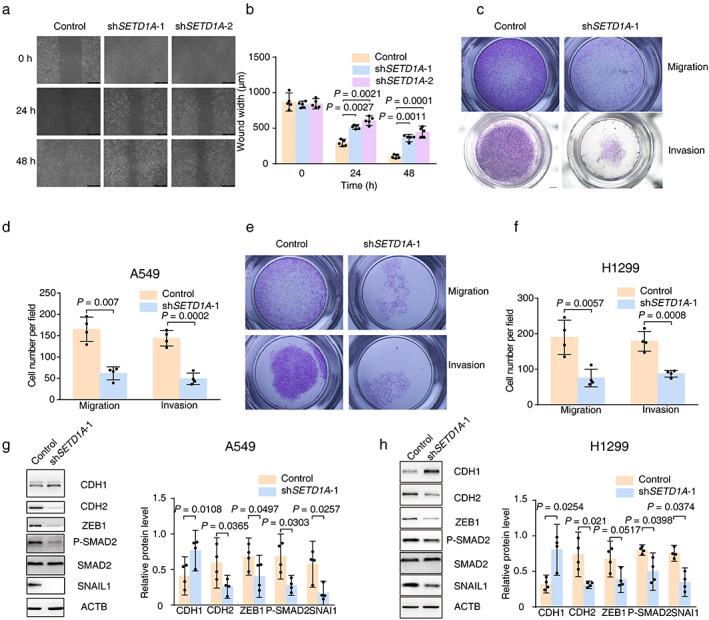
Downregulation of SETD1A in NSCLC cells suppresses cancer EMT. (a),(b), the images of A549 cells with different expression of SETD1A were captured after wound injury. Scale bar was 200 μm. The motility of lung cancer cells was measured at the indicated time points (n = 5). (c)–(f), the same number of A549 or H1299 cells (shSETD1A‐1 or control) were seeded in Transwell chambers and the cells that passed through the porous membrane were stained and captured (A549, (c) upper row; H1299, (e) upper row). In addition, the cells that passed through the Matrigel and porous membrane were also stained and captured (A549, (c) lower row; H1299, (e) lower row). The number of stained cells in five random fields was counted (A549, D; H1299, F) (n = 3). (g),(h) Western blot to detect EMT‐related proteins in SETD1A silenced A549 (g) or H1299 (h) cell lines (n = 4). Statistical tests were analyzed by using paired t test after log transformation. n means independent biological sample
Lung cancer cells often undergo EMT and invade blood vessels, migrating to tissues including brain, bone, or liver to form new metastases; therefore, the EMT is the first step in lung tumor invasion and migration. It is reported that transforming growth factor β (TGF‐β) signaling is crucial for EMT,27 so we measured molecules in the TGFβ pathway to determine the role of SETD1A in EMT. The upregulated CDH1 and reduced mesenchymal cell markers (CDH2, ZEB1, phosphorylated SMAD2 [P‐SMAD2], and SNAI1) indicated that A549 and H1299 maintained their epithelial character in SETD1A silenced cells compared with the control group (Figure 3(g),(h)). Therefore, enhanced SETD1A expression in lung cancer accelerated the cell transition from epithelial‐like to mesenchymal character.
SETD1A facilitates tumor growth and EMT in vivo
To verify our results in cultured cancer cells, we performed a xenograft assay and monitored tumor growth. It is not surprising that SETD1A silenced cells grew much more slowly than the control cells in tumor size and weight (A549, Figure 4(a)–(c); H1299, Figure 4(d)–(f)). In addition, quantitative polymerase chain reaction (qPCR) analysis of xenograft tumors also suggested that downregulation of SETD1A resulted in a dramatic reduction in the expression of several critical oncogenes, such as tumor malignancy genes (MYC, GLI1, FOXM1, STAT3, and FAK), epigenetic modification enzymes (DNMT1, SETDB1, and HDAC1) and mesenchymal cell markers (CDH2, VIM, ZEB1, and SNAIL1). Meanwhile, the expression of CDH1, the epithelial character marker, sharply increased in SETD1A silenced xenograft tumors (Figure 4(g)–(j)) compared with control tumors, which indicated that downregulation of SETD1A inhibited EMT in xenograft tumors. In brief, reduced SETD1A could prevent tumorigenesis and EMT of lung cancer.
FIGURE 4.
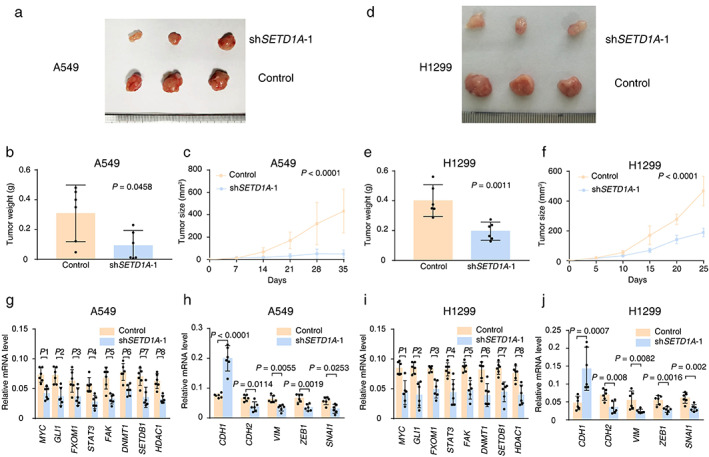
SETD1A silencing prevents tumorigenesis and EMT of NSCLC cells in nude mice. (a) The image of tumor tissue from nude mice with A549 cell transplantation at the end point (35 days after inoculation). (b) Average tumor weight of A549 xenografts with SETD1A knockdown at the end point (n = 6). (c) Tumor volumes of A549 xenografts with SETD1A knockdown in nude mice (n = 6). (d) The tumor images from nude mice with H1299 cell transplantation at the end point (25 days after inoculation). (e),(f) Tumor weight and volumes of H1299 xenografts with SETD1A knockdown in nude mice (n = 6). (g),(h) qPCR results for mRNA levels of oncogenes and EMT‐related genes in A549 xenografts (n = 6). P1 = 0.0017, P2 = 0.005, P3 = 0.0201, P4 = 0.005, P5 = 0.0015, P6 = 0.0012, P7 = 0.005, P8 = 0.0001. (i),(j) qPCR results for mRNA levels of oncogenes and EMT‐related genes in H1299 xenografts (n = 6). P1 = 0.0089, P2 = 0.0157, P3 = 0.0056, P4 = 0.0138, P5 = 0.0063, P6 = 0.0055, P7 = 0.0158, P8 = 0.0062. Statistical tests were analyzed by using the Welch's t‐test after log transformation (b),(e),(g)–(j) or two‐way ANOVA (c),(f). n means independent biological sample
SETD1A regulates oncogene expression in lung cancer
SETD1A is an important methyltransferase to catalyze H3K4me3. Because more H3K4me3 was present in lung cancer cell lines,12, 13 we monitored the level of H3K4me3 in SETD1A knockdown A549 cells. Immunofluorescence showed that SETD1A silencing did not result in an obvious signal reduction of H3K4me3 in the global nucleus (Figure 5(a),(b)). H3K4me3 modification could promote transcription of downstream genes28; therefore, we analyzed Chromatin immunoprecipitation (ChIP) data in the ENCODE database (https://www.encodeproject.org/). Interestingly, enhanced H3K4me3 levels are frequently localized upstream of several oncogenes that are critical to the growth and metastasis of lung tumors (Figures S4 and S5).29, 30, 31, 32, 33, 34 ChIP assay also suggested methylation of H3K4me3 is a promoter of several oncogenes (Figure 5(c)–(h)). Indeed, Western blotting suggested that SETD1A silencing reduced the expression of these oncogenes, including MYC, GLI1, FOXM1, DNMT1, SETDB1, and HDAC1 (Figure 5(i),(j)), which indicated that SETD1A might be a master gene to regulate lung cancer progression via H3K4me3 levels.
FIGURE 5.
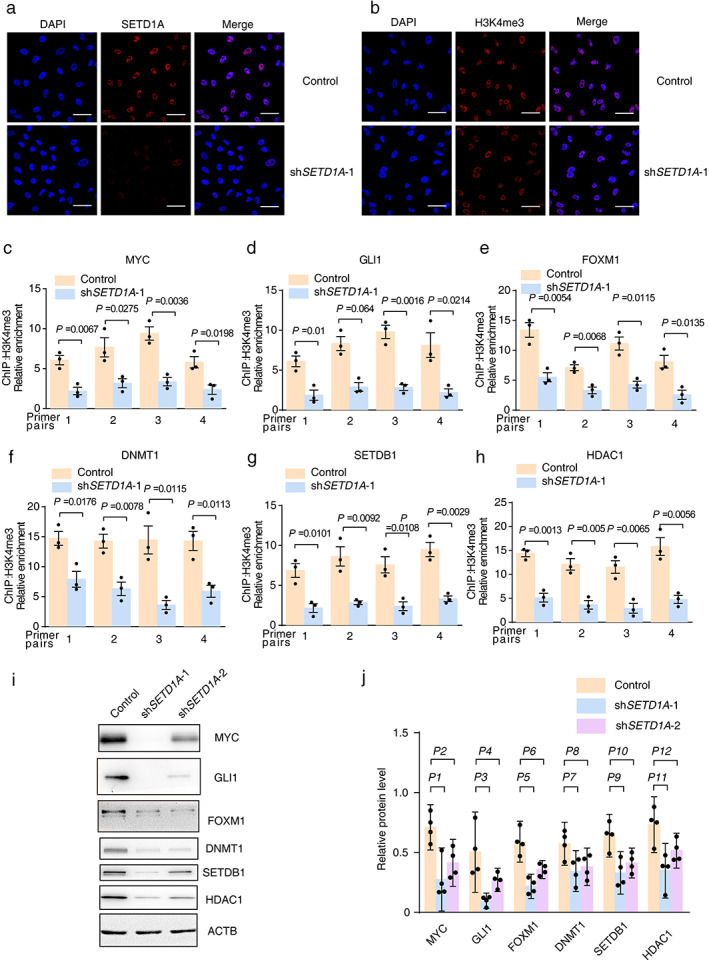
SETD1A knockdown in NSCLC cells decreases the expression of several critical oncogenes in lung cancer. (a),(b) Immunofluorescence of A549 cells (shSETD1A‐1 or control) with antibody to SETD1A or H3K4me3. The scale bar was 50 μm. (c)–(h) ChIP assay to detect location of H3K4me3 methylation in genomics. (i) Western blot for critical oncogenes with H3K4me3 methylation at the transcriptional start site. (j) Relative protein levels of oncogenic proteins in I. ACTB was used as the internal control (n = 4). P1 = 0.0193, P2 = 0.0385, P3 = 0.003, P4 = 0.0238, P5 = 0.0212, P6 = 0.0317, P7 = 0.0047, P8 = 0.0358, P9 = 0.0079, P10 = 0.0799, P11 = 0.0191, P12 = 0.0183. Statistical tests were analyzed by using paired t‐test after log transformation. n means independent biological sample
Discussion
It is reported that enhanced SETD1A is associated with tumorigenesis and metastasis in colorectal and breast cancer.21, 22 Here, we found that SETD1A was increased in lung cancer tissues compared with adjacent nontumor tissues and inversely correlated with overall survival status. Further research showed that STED1A silencing resulted in defects in cancer growth and EMT in vitro and in vivo. Mechanistic analysis suggested that SETD1A might regulate multiple critical oncogenes in lung cancer via global H3K4me3 levels.
The methylation and of H3K4 is performed by histone methylases (SETD1A/B and KMT2 family).14, 15, 16, 17, 18, 19 Enhanced H3K4me3 was confirmed in lung cancer,12, 13 which was attributed to upregulated SETD1A, owing to no differences in other histone methylases between lung cancer tissues and adjacent nontumor tissues (Figure S6). However, the downstream effects of SETD1A are different in different tumors. In colorectal carcinoma, enhanced SETD1A elevated H3K4me3 levels globally and activated multiple gene transcription in WNT signaling,22 whereas upregulated SETD1A catalyzed H3K4me3 upstream of matrix metalloproteinase (MMP) genes and promoted breast cancer metastasis, although SETD1A silencing does not result in the downregulation of global H3K4me3.21 In lung cancer, we found that globally downregulated H3K4me3 and several critical oncogenes were reduced in SETD1A knockdown A549 cells. In addition, ChIP‐seq analysis also showed enhanced H3K4me3 levels around transcriptional start sites in lung cancer cell lines. Therefore, we speculated that SETD1A might regulate lung tumor growth and EMT via the transcriptional activation of multiple oncogenes that are involved in various pathways.
Several important gene mutants are confirmed in lung cancer and used as therapeutic targets for clinical treatment, such as epidermal growth factor receptor (EGFR) (gefitinib, erlotinib, afatinib, and osimertinib), anaplastic lymphoma kinase (ALK) (crizotinib, ceritinib, alectinib, and brigatinib), and ROS proto‐oncogene 1 (ROS1) (crizotinib).4 However, the curative effect is unsatisfactory owing to 5‐year survival index of less than ~15% and the drug resistance of tumor cells.4 Therefore, it is urgent to find new therapeutic strategies for lung cancer. Recently, some groups have focused on histone methylation. EPZ‐5676, the inhibitor for DOT1L, which is essential to H3K79 methylation, has completed a phase I clinical trial for leukemia (ClinicalTrials.gov identifier: NCT02141828). Enhancer of zeste homologue 2 (EZH2) is the catalytic component of the polycomb repressive complex 2 (PRC2) and regulates H3K27 modification; some inhibitors for EZH2 have been tested for cancer therapy in animals and have been tested in clinical trials (ClinicalTrials.gov identifier: NCT 02082977, NCT 01897571, NCT 02601937, NCT 02601950, and NCT 02395601). Our research suggested that SETD1A is a master gene to drive the expression of several critical oncogenes in lung cancer, such as MYC, DNMT1, and HDAC1, which could accelerate malignancy of lung tumors in proliferation and invasion. Inhibitors of specific oncogene have been tested in clinical experiments. However, the curative effect is not ideal because single oncogene obstruction cannot fully impede cancer progress. Therefore, SETD1A may be a better drug target for lung tumor treatment, owing to it's switch for down‐stream activation of many oncogenes.
Recently, combination epigenetic therapy is widespread and exhibits potential advantage. For example, inhibitor combination of DNMT and HDAC could enhance cancer immune therapy.35 Application of histone deacetylase inhibitors (HDACi) with doxorubicin or retinoic acid exhibited better antitumor effect, compared to single regent to treat solid tumor.36 As an epigenetic modification enzyme, SETD1A may be also a new candidate for combined treatment of tumors, because of the remarkable antitumor effect.
MATERIALS AND METHODS
Cell lines
All cells were from Cell Bank of Chinese Academy of Sciences. HEK 293 T (SCSP‐502) cells are grown in Dulbecco's modified Eagle's medium (DMEM; Gibco, 11 965 118) containing 10% fetal bovine serum (FBS) supplemented with penicillin (Sangon Biotech, A603460, 100 U/ mL) and streptomycin (Sangon Biotech A100382, 100 μg/mL). A549 cells are cultured in 10%FBS‐F12K medium (Sigma‐Aldrich, N3520) supplemented with penicillin (Sangon Biotech, A603460, 100 U/mL) and streptomycin (Sangon Biotech A100382, 100 μg/mL). H1299 cells (SCSP‐589) are grown in 10% FBS‐RPMI 1640 Medium (Gibco, 11 875 093) with penicillin (Sangon Biotech, A603460, 100 U/mL) and streptomycin (Sangon Biotech A100382, 100 μg/mL). Cells were cultured in 37°C incubator (Thermo Scientific, BB150) with a humidified atmosphere containing 5% CO2.
Generation of SETD1A silenced cell line
HEK 293 T cells were co‐transfected with pLKO.1‐puro cloning vector (addgene, no. 8453) encoding SETD1A‐specific shRNA (GenScript, shSETD1A‐1: CCGGCGGAAGAAGAAGCTCCGATTTCTCGAGAAATCGGAGCTTCTTCTTCCGTTTTTTG, shSETD1A‐2: CCGGCTTTGCGGAGAAGAAGCTGTACTCGAGTACAGCTTCTTCTCCGCAAAGTTTTTTG), Gal‐pol, and the pCMV‐VSV‐G vector (Addgene, no. 8454) using polyethylenimine (PEI). Forty‐eight hours later, the supernatant of medium was filtered by 0.45 μm filter, mixed with polybrene (10 μg/mL) and infected A549/ H1299 cells. Forty‐eight hours later, selected cells with 1 μg/mL puromycin (Gibco, A1113803) and survival cells were harvested after 3 days.
Western blot
Cells were washed by phosphate‐buffered saline (PBS) saline and lysed with radioimmunoprecipitation assay (RIPA) buffer (150 mM NaCl, 2 mM EDTA (pH 8.0), 50 mM tris–HCl (pH 7.4), 0.1% sodium dodecyl sulfate (SDS), 1% Nonidet P‐40, 1 mM Na3VO4, 50 mM NaF, and protease inhibitor cocktail (Roche, 05892791001). Protein concentration was measured by bicinchoninic acid (BCA) Protein Assay Kit (Pierce, 23 227) and ~ 20 μg protein amount for each well of gel. Protein was separated by 10% sodium dodecyl sulfate‐polyacrylamide gel electrophoresis (SDS‐PAGE) gel (GenScript, M00664) and electrotransferred to polyvinylidene fluoride (PVDF) membrane (Millipore, IPVH00005). Next, the membrane was blocked by blocking buffer with 5% non‐fat milk in tris‐buffered saline (TBS) and 0.1% Tween 20 (Sangon Biotech, A100777) for 1 hour and incubated overnight at 4°C with primary antibody diluted in TBS and 0.1% Tween 20. On the second day, the membrane was incubated for 1 hour at room temperature with the secondary antibody diluted in blocking buffer (1:1000) combined with substrate (Tanon, no. 180–5001) and xposed with digital imager (Tanon 4600). Image J software was used for immunoblot densitometric analysis. The primary antibodies were β‐Actin (Cell Signaling Technology, no. 3700. 1:10 000), SET1A (Cell Signaling Technology, no. 61702. 1:1000), SNAIL (Cell Signaling Technology, no. 3879. 1:1000), p‐SMAD2 (Cell Signaling Technology, no. 18338. 1:1000, phosphorylated at Ser465/467), SMAD2 (Cell Signaling Technology, no. 5339. 1:1000), HDAC1 (Cell Signaling Technology, no. 5356. 1:2000), DNMT1 (Cell Signaling Technology, no. 5032. 1:2000), FOXM1 (Cell Signaling Technology, no. 5436. 1:2000), p‐STAT3 (Cell Signaling Technology, no. 9145. 1:1000, phosphorylated at Tyr405), STAT3 (Cell Signaling Technology, no. 9139. 1:2000), PCNA (Cell Signaling Technology, no. 13110. 1:3000), AKT1 (Cell Signaling Technology, no. 75692. 1:2000), p‐ERK1/2 (Cell Signaling Technology, no. 4370. 1:3000, phosphorylated at Thr202/Tyr204), E‐cadherin (Cell Signaling Technology, no. 3195. 1:1000), N‐Cadherin (Cell Signaling Technology, no. 13116.1:1000), ZEB1 (Cell Signaling Technology, no. 3396. 1:1000), GLI1 (Cell Signaling Technology, no. 3538. 1:1000), c‐Myc (Cell Signaling Technology, no. 5605. 1:3000), and SETDB1 (Cell Signaling Technology, no. 2196. 1:1000). Secondary antibodies conjugated with horseradish peroxidase (HRP) were from Thermo Fisher (31 460 and 31 430).
Cell proliferation assay
Cells were seeded at a density of 1 × 10⁵ cells in one 10‐cm dish. The number of viable cells was counted every other day.
Wound healing analysis
The same number of A549 or H1299 cells was seeded in a 6‐cm dish to ensure >90% density the next day. The cells were wounded with a sterile pipette tip, and new culture medium was added. The images of wound healing were randomly captured at the indicated time points (24 hours and 48 hours). The speed of wound healing was quantified by the wound width. Lecia DM2500 microscope (5×) and Image J software was used to analyzed wound width.
Migration and invasion assay
A Transwell chamber with a porous membrane (Corning, catalog no. 3422) was placed in a 24‐well plate. The same number (1 × 10⁵) of A549 or H1299 cells in 200 μL of serum‐free culture medium was added to the upper chamber, and the lower chamber contained 500 μL of growth medium containing 10% FBS. After 12 hours, non‐migrated cells on the top of the porous membrane were removed by a cotton swab, and the migrated A549 or H1299 cells on the bottom surface were fixed (4% paraformaldehyde [PFA]) and stained with 0.5% crystal violet. The cells that passed through the membrane were visualized by the size of the colored area. Each experiment was repeated three times.
For the invasion assay, the Matrigel (Corning, catalog no. 354234) was diluted (1:8) with PBS and poured into chambers above which were placed in 24‐well plates. Next, 1 × 10⁶ cells were placed on the Matrigel, and the lower chamber contained 500 μL of growth medium containing 10% FBS. The cells were cultured at 37°C. Twenty‐four hours later, the cells that passed through the Matrigel and porous membrane were visualized with the same protocol as in the migration assay. Each experiment was repeated three times. An OLYMPUS SZX10 microscope (8×) and Image J software was used to analyzed cell number.
Mouse xenograft models
Six‐week‐old male nude mice were purchased from The Laboratory Animal Center (Shandong University, Jinan, China) and randomly divided into two groups. Next, 5 × 10⁶ A549 or H1299 cells in 100 μL PBS were injected subcutaneously in the back of each mouse, and the tumor size was calculated as length × width2 /2 at the indicated day. At the end point (A549, 35 days; H1299, 25 days), the tumors were collected for weighing and RNA expression analysis. The mice were housed in specific‐pathogen‐free (SPF) condition with 12 hour day/12 hour night. All experiments were performed according to the guidelines of the Institutional Animal Care and Use Committee of the Shandong University.
Immunofluorescence
Cells were washed with PBS three times and fixed with 4% PFA in PBS for 15 minutes, then cells were permeabilized with 0.1% Triton X‐100 in PBS for 10 minutes, blocked with 0.2% fish skin gelatin (Sigma‐Aldrich, no. G7041) in PBS for 30 minutes at room temperature, and incubated with primary antibody diluted in PBS at 4°C overnight. 12 hours later, second antibody diluted in PBS was used to combine primary antibody at room temperature for 1 hour and the location was detected with ZEISS LMF880 laser scanning confocal microscope. The primary antibodies were SET1A (CST, no. 61702. 1:400) and H3K4me3 (Abcam, no. ab1012.1:200). The secondary antibody was Cy3‐conjugated anti‐rabbit IgG (Sigma‐Aldrich, no. C2306. 1:1000). Cell nuclei were counterstained with DAPI.
ChIP
SETD1A binding and H3K4me3 methylation of MYC, GLI1, FOXM1, SETDB1, DNMT1, and HDAC1 were analyzed using ChIP. The genomic regions were chosen on the basis of the H3K4me3 profiles obtained from the ENCODE database. ChIP was performed with A549 cells infected with vehicle or lentivirus containing shSETD1A according to conventional methods. Fresh formaldehyde solution was added to the culture medium to a final 1% concentration to crosslink protein‐DNA complexes for 10 minutes at room temperature. Crosslinking was stopped for 5 minutes by adding 125 mM glycine. After washing twice with cold PBS, cells were collected into 1 mL of lysis buffer (5 mM PIPES, 85 mM KCl and 0.5% NP‐40, and protease inhibitors). Nuclei were collected and incubated in nuclear lysis buffer (50 mM tris [pH 8.0], 0.2% EDTA, and v protease inhibitors). The crosslinked chromatin was sonicated into DNA fragments of ∼300–500 bp in length. Protein G beads were first incubated at 4°C for 6 hours with 4 μg each of the following antibodies against histone H3 (Abcam, ab1791), histone H3 trimethyl K4 (Abcam, ab1012), SETD1A (CST, no. 61702), and control IgG (Cell Signaling, 2729S). Protein G magnetic beads conjugated with antibodies was incubated with chromatin solution (100 μg) overnight at 4°C. After six washes, the beads were eluted with elution buffer (50 mM NaHCO3, 140 mM NaCl, and 1% SDS). Following both RNaseA and proteinase K treatments, and reverse crosslinking, DNA was purified and analyzed with qPCR using primers against the relevant targets listed in Table S1.
Bioinformatics analysis
Data of SETD1A DNA copy number in lung cancer is from cBioportal (https://www.cbioportal.org). Gene expression data from GEO DataSets (https://www.ncbi.nlm.nih.gov/gds/) and the accession number is listed in figure legends. The data of cumulative overall survival of patients with lung carcinoma is from TCGA database. SETD1A expression in different cell line is from a previous report12. Enhanced H3K4me3 signaling in cell line of lung cancer was confirmed with ENCODE (https://www.encodeproject.org/); the database collects and verifies ChIP‐seq results.
Statistical analysis
Data are presented as the mean ± SD, except for description in figure legends. The number of biological repetitions are also stated in figure legends. The difference between unpaired groups was confirmed with two‐tailed Welch's t‐test. Log‐rank (Mantel‐Cox) test was performed in analysis of survival curves. For comparison of cell number and ratio, log transformation was used for statistical test. The confidence level was 95%. All statistical analysis was performed by GraphPad Prime 7.00 software.
CONFLICT OF INTEREST
The authors declare no conflicts of interest.
AUTHOR CONTRIBUTIONS
M.D. and X.W.W. conceived of the study, designed the study and collected the data. All authors analyzed the data and were involved in writing the manuscript.
CONSENT FOR PUBLICATION
Written informed consent for publication was obtained from all participants.
ETHICS STATEMENT
The animal experiments were approved by the medical ethics committee of Qilu Hospital of Shandong University.
Supporting information
FIGURE S1 SETD1A copy number alternations and mutation status in different types of cancer. Data were from the cBioportal database.
FIGURE S2 Enhanced expression of SETD1A is present in lung cancer cell lines. (a) SETD1A protein level in BEAS‐2B (human bronchial epithelial cell line), A549, and H1299 cell lines. (b) qRT‐PCR to detect SETD1A mRNA level in BEAS‐2B, A549, and H1299 cell lines.
FIGURE S3 The components of the SETD1A methylation complex may be associated with the lung cancer process. (a)–(d), mRNA level of ASH2L, DPY30, WDR5, and HCFC1 between lung cancer and non‐tumor lung tissue. Data were from the GEO DataSets (ASH2L, GSE83227, normal n = 17, lung cancer n = 21; DPY30 and WDR5 GSE19188, normal n = 65, lung cancer n = 45; HCFC1, GSE3398, normal n = 5, lung cancer n = 4). (e) Kaplan–Meier plot of cumulative overall survival of patients with lung carcinoma in the TCGA database. Patients in the 80% (WDR5 higher expression group, yellow line, n = 391) were compared with patients in the lower 20% (WDR5 lower expression group, blue line, n = 97). The p‐value from the log‐rank test comparing the two survival curves was 0.0329. (f) Kaplan–Meier plot of cumulative overall survival of patients with lung carcinoma in the TCGA database. Patients in the 70% (HCFC1 higher expression group, yellow line, n = 342) were compared with patients in the lower 30% (HCFC1 lower expression group, blue line, n = 146). The p‐value from the log‐rank test comparing the two survival curves was 0.0473. Statistical tests were analyzed by using the Welch's t‐test. n means independent biological sample.
FIGURE S4 CHIP‐sequence analysis for H3K4me3 in the A549 cell line. Data from the ENCODE database. The red frame suggested enhanced H3K4me3 signaling was present in related oncogenes upstream. The enrichment fragment was emphasized with pink. Three independent biological replication were performed.
FIGURE S5 CHIP‐sequence analysis for H3K4me3 in the PC‐9 cell line. Data from the ENCODE database. The red frame suggested enhanced H3K4me3 signaling was present in related oncogenes upstream. The enrichment fragment was emphasized with pink.
FIGURE S6 The expression of methylases between lung cancer and nontumor lung tissue. (a) SETD1B level in lung cancer and nontumor lung tissue. Data from a public data set (GEO, GSE10072, normal, n = 49; 1, lung cancer, n = 58). (b)–(e) KMT2 family level in lung cancer and nontumor lung tissue. Data from a public data set (GEO, GSE32863, normal, n = 58; 1, lung cancer, n = 58). Statistical tests were analyzed by using the Welch's t‐test. n means independent biological sample.
TABLE S1 Primer for ChIP‐seq assay.
ACKNOWLEDGMENTS
We would like to thank the staff of the animal houses at The Laboratory animal center of Shandong University for their great care of hundreds of mice. We also thank Xiaozhen Liu for advice on the experiments and critical reading of the manuscript. This work was supported by grants from the National Natural Science Foundation of China (81874044 and 81502615).
Du M, Gong P, Zhang Y, et al. Histone methyltransferase SETD1A participates in lung cancer progression. Thorac Cancer. 2021;12:2247–2257. 10.1111/1759-7714.14065
Funding information National Natural Science Foundation of China, Grant/Award Numbers: 81502615, 81874044
DATA AVAILABILITY STATEMENT
The datasets used or analyzed during the current study are available from the corresponding author on reasonable request.
REFERENCES
- 1.Siegel RL, Miller KD, Jemal A. Cancer statistics, 2019. CA Cancer J Clin. 2019;69:7–34. [DOI] [PubMed] [Google Scholar]
- 2.Global Burden of Disease Cancer Collaboration , Fitzmaurice C, Allen C, Barber RM, Barregard L, Bhutta ZA, et al. Global, regional, and National Cancer Incidence, mortality, years of life lost, years lived with disability, and disability‐adjusted life‐years for 32 cancer groups, 1990 to 2015: a systematic analysis for the global burden of disease study. JAMA Oncol. 2017;3:524–48. [DOI] [PMC free article] [PubMed] [Google Scholar]
- 3.Herbst RS, Morgensztern D, Boshoff C. The biology and management of non‐small cell lung cancer. Nature. 2018;553:446–54. [DOI] [PubMed] [Google Scholar]
- 4.Mayekar MK, Bivona TG. Current landscape of targeted therapy in lung cancer. Clin Pharmacol Ther. 2017;102:757–64. [DOI] [PubMed] [Google Scholar]
- 5.Jamal‐Hanjani M, Wilson GA, McGranahan N, Birkbak NJ, Watkins TBK, Veeriah S, et al. Tracking the evolution of non‐small‐cell lung cancer. N Engl J Med. 2017;376:2109–21. [DOI] [PubMed] [Google Scholar]
- 6.Widschwendter M, Jones A, Evans I, Reisel D, Dillner J, Sundstrom K, et al. Epigenome‐based cancer risk prediction: rationale, opportunities and challenges. Nat Rev Clin Oncol. 2018;15:292–309. [DOI] [PubMed] [Google Scholar]
- 7.Smith E, Shilatifard A. The chromatin signaling pathway: diverse mechanisms of recruitment of histone‐modifying enzymes and varied biological outcomes. Mol Cell. 2010;40:689–701. [DOI] [PMC free article] [PubMed] [Google Scholar]
- 8.Takeshima H, Wakabayashi M, Hattori N, Yamashita S, Ushijima T. Identification of coexistence of DNA methylation and H3K27me3 specifically in cancer cells as a promising target for epigenetic therapy. Carcinogenesis. 2015;36:192–201. [DOI] [PubMed] [Google Scholar]
- 9.Kuntimaddi A, Achille NJ, Thorpe J, Lokken AA, Singh R, Hemenway CS, et al. Degree of recruitment of DOT1L to MLL‐AF9 defines level of H3K79 Di‐ and tri‐methylation on target genes and transformation potential. Cell Rep. 2015;11:808–20. [DOI] [PMC free article] [PubMed] [Google Scholar]
- 10.Gao Y, Zhao Y, Zhang J, Lu Y, Liu X, Geng P, et al. The dual function of PRMT1 in modulating epithelial‐mesenchymal transition and cellular senescence in breast cancer cells through regulation of ZEB1. Sci Rep. 2016;6:19874. [DOI] [PMC free article] [PubMed] [Google Scholar]
- 11.Li S, Shen L, Chen KN. Association between H3K4 methylation and cancer prognosis: a meta‐analysis. Thoracic Cancer. 2018;9:794–9. [DOI] [PMC free article] [PubMed] [Google Scholar]
- 12.Kikutake C, Yahara K. Identification of epigenetic biomarkers of lung adenocarcinoma through multi‐omics data analysis. PLoS One. 2016;11:e0152918. [DOI] [PMC free article] [PubMed] [Google Scholar]
- 13.Suzuki A, Makinoshima H, Wakaguri H, Esumi H, Sugano S, Kohno T, et al. Aberrant transcriptional regulations in cancers: genome, transcriptome and epigenome analysis of lung adenocarcinoma cell lines. Nucleic Acids Res. 2014;42:13557–72. [DOI] [PMC free article] [PubMed] [Google Scholar]
- 14.Shilatifard A. The COMPASS family of histone H3K4 methylases: mechanisms of regulation in development and disease pathogenesis. Annu Rev Biochem. 2012;81:65–95. [DOI] [PMC free article] [PubMed] [Google Scholar]
- 15.Shi Y, Lan F, Matson C, Mulligan P, Whetstine JR, Cole PA, et al. Histone demethylation mediated by the nuclear amine oxidase homolog LSD1. Cell. 2004;119:941–53. [DOI] [PubMed] [Google Scholar]
- 16.Secombe J, Li L, Carlos L, Eisenman RN. The Trithorax group protein lid is a trimethyl histone H3K4 demethylase required for dMyc‐induced cell growth. Genes Dev. 2007;21:537–51. [DOI] [PMC free article] [PubMed] [Google Scholar]
- 17.Tahiliani M, Mei P, Fang R, Leonor T, Rutenberg M, Shimizu F, et al. The histone H3K4 demethylase SMCX links REST target genes to X‐linked mental retardation. Nature. 2007;447:601–5. [DOI] [PubMed] [Google Scholar]
- 18.Yamane K, Tateishi K, Klose RJ, Fang J, Fabrizio LA, Erdjument‐Bromage H, et al. PLU‐1 is an H3K4 demethylase involved in transcriptional repression and breast cancer cell proliferation. Mol Cell. 2007;25:801–12. [DOI] [PubMed] [Google Scholar]
- 19.Lee MG, Norman J, Shilatifard A, Shiekhattar R. Physical and functional association of a trimethyl H3K4 demethylase and Ring6a/MBLR, a polycomb‐like protein. Cell. 2007;128:877–87. [DOI] [PubMed] [Google Scholar]
- 20.Morera L, Lubbert M, Jung M. Targeting histone methyltransferases and demethylases in clinical trials for cancer therapy. Clin Epigenetics. 2016;8:57. [DOI] [PMC free article] [PubMed] [Google Scholar]
- 21.Salz T, Deng C, Pampo C, Siemann D, Qiu Y, Brown K, et al. Histone methyltransferase hSETD1A is a novel regulator of metastasis in breast cancer. Mol Cancer Res. 2015;13:461–9. [DOI] [PubMed] [Google Scholar]
- 22.Salz T, Li G, Kaye F, Zhou L, Qiu Y, Huang S. hSETD1A regulates Wnt target genes and controls tumor growth of colorectal cancer cells. Cancer Res. 2014;74:775–86. [DOI] [PMC free article] [PubMed] [Google Scholar]
- 23.Selamat SA, Chung BS, Girard L, Zhang W, Zhang Y, Campan M, et al. Genome‐scale analysis of DNA methylation in lung adenocarcinoma and integration with mRNA expression. Genome Res. 2012;22:1197–211. [DOI] [PMC free article] [PubMed] [Google Scholar]
- 24.Rapp J, Jaromi L, Kvell K, Miskei G, Pongracz JE. WNT signaling ‐ lung cancer is no exception. Respir Res. 2017;18:167. [DOI] [PMC free article] [PubMed] [Google Scholar]
- 25.Jiang R, Jin Z, Liu Z, Sun L, Wang L, Li K. Correlation of activated STAT3 expression with clinicopathologic features in lung adenocarcinoma and squamous cell carcinoma. Mol Diagn Ther. 2011;15:347–52. [DOI] [PubMed] [Google Scholar]
- 26.Linnerth‐Petrik NM, Santry LA, Petrik JJ, Wootton SK. Opposing functions of Akt isoforms in lung tumor initiation and progression. PLoS One. 2014;9:e94595. [DOI] [PMC free article] [PubMed] [Google Scholar]
- 27.Eser PO, Janne PA. TGFbeta pathway inhibition in the treatment of non‐small cell lung cancer. Pharmacol Ther. 2018;184:112–30. [DOI] [PubMed] [Google Scholar]
- 28.Zaidi SK, Frietze SE, Gordon JA, Heath JL, Messier T, Hong D, et al. Bivalent epigenetic control of Oncofetal gene expression in cancer. Mol Cell Biol. 2017;37:e00352‐17. [DOI] [PMC free article] [PubMed] [Google Scholar]
- 29.Zhang J, Zhang J, Cui X, Yang Y, Li M, Qu J, et al. FoxM1: a novel tumor biomarker of lung cancer. Int J Clin Exp Med. 2015;8:3136–40. [PMC free article] [PubMed] [Google Scholar]
- 30.Bragelmann J, Bohm S, Guthrie MR, Mollaoglu G, Oliver TG, Sos ML. Family matters: how MYC family oncogenes impact small cell lung cancer. Cell Cycle. 2017;16:1489–98. [DOI] [PMC free article] [PubMed] [Google Scholar]
- 31.Cao LL, Song X, Pei L, Liu L, Wang H, Jia M. Histone deacetylase HDAC1 expression correlates with the progression and prognosis of lung cancer: a meta‐analysis. Medicine (Baltimore). 2017;96:e7663. [DOI] [PMC free article] [PubMed] [Google Scholar]
- 32.Lai Q, Xu YH, Chen Q, Tang L, Li AG, Zhang LF, et al. The loss‐of‐function of DNA methyltransferase 1 by siRNA impairs the growth of non‐small cell lung cancer with alleviated side effects via reactivation of RASSF1A and APC in vitro and vivo. Oncotarget. 2017;8:59301–11. [DOI] [PMC free article] [PubMed] [Google Scholar]
- 33.Sun QY, Ding LW, Xiao JF, Chien W, Lim SL, Hattori N, et al. SETDB1 accelerates tumourigenesis by regulating the WNT signalling pathway. J Pathol. 2015;235:559–70. [DOI] [PMC free article] [PubMed] [Google Scholar]
- 34.Mastrangelo E, Milani M. Role and inhibition of GLI1 protein in cancer. Lung Cancer (Auckl). 2018;9:35–43. [DOI] [PMC free article] [PubMed] [Google Scholar]
- 35.Topper MJ, Vaz M, Chiappinelli KB, DeStefano Shields CE, Niknafs N, Yen RC, et al. Epigenetic therapy ties MYC depletion to reversing immune evasion and treating lung cancer. Cell. 2017;171:1284–300. e21. [DOI] [PMC free article] [PubMed] [Google Scholar]
- 36.Merino VF, Cho S, Nguyen N, Sadik H, Narayan A, Talbot C Jr, et al. Induction of cell cycle arrest and inflammatory genes by combined treatment with epigenetic, differentiating, and chemotherapeutic agents in triple‐negative breast cancer. Breast Cancer Res. 2018;20:145. [DOI] [PMC free article] [PubMed] [Google Scholar]
Associated Data
This section collects any data citations, data availability statements, or supplementary materials included in this article.
Supplementary Materials
FIGURE S1 SETD1A copy number alternations and mutation status in different types of cancer. Data were from the cBioportal database.
FIGURE S2 Enhanced expression of SETD1A is present in lung cancer cell lines. (a) SETD1A protein level in BEAS‐2B (human bronchial epithelial cell line), A549, and H1299 cell lines. (b) qRT‐PCR to detect SETD1A mRNA level in BEAS‐2B, A549, and H1299 cell lines.
FIGURE S3 The components of the SETD1A methylation complex may be associated with the lung cancer process. (a)–(d), mRNA level of ASH2L, DPY30, WDR5, and HCFC1 between lung cancer and non‐tumor lung tissue. Data were from the GEO DataSets (ASH2L, GSE83227, normal n = 17, lung cancer n = 21; DPY30 and WDR5 GSE19188, normal n = 65, lung cancer n = 45; HCFC1, GSE3398, normal n = 5, lung cancer n = 4). (e) Kaplan–Meier plot of cumulative overall survival of patients with lung carcinoma in the TCGA database. Patients in the 80% (WDR5 higher expression group, yellow line, n = 391) were compared with patients in the lower 20% (WDR5 lower expression group, blue line, n = 97). The p‐value from the log‐rank test comparing the two survival curves was 0.0329. (f) Kaplan–Meier plot of cumulative overall survival of patients with lung carcinoma in the TCGA database. Patients in the 70% (HCFC1 higher expression group, yellow line, n = 342) were compared with patients in the lower 30% (HCFC1 lower expression group, blue line, n = 146). The p‐value from the log‐rank test comparing the two survival curves was 0.0473. Statistical tests were analyzed by using the Welch's t‐test. n means independent biological sample.
FIGURE S4 CHIP‐sequence analysis for H3K4me3 in the A549 cell line. Data from the ENCODE database. The red frame suggested enhanced H3K4me3 signaling was present in related oncogenes upstream. The enrichment fragment was emphasized with pink. Three independent biological replication were performed.
FIGURE S5 CHIP‐sequence analysis for H3K4me3 in the PC‐9 cell line. Data from the ENCODE database. The red frame suggested enhanced H3K4me3 signaling was present in related oncogenes upstream. The enrichment fragment was emphasized with pink.
FIGURE S6 The expression of methylases between lung cancer and nontumor lung tissue. (a) SETD1B level in lung cancer and nontumor lung tissue. Data from a public data set (GEO, GSE10072, normal, n = 49; 1, lung cancer, n = 58). (b)–(e) KMT2 family level in lung cancer and nontumor lung tissue. Data from a public data set (GEO, GSE32863, normal, n = 58; 1, lung cancer, n = 58). Statistical tests were analyzed by using the Welch's t‐test. n means independent biological sample.
TABLE S1 Primer for ChIP‐seq assay.
Data Availability Statement
The datasets used or analyzed during the current study are available from the corresponding author on reasonable request.