

Abstract
Background:
The properties of neurophysiological processes related to addiction have received much attention in the literature. However, empirical evidence of meaningful and useful characterization of these processes is limited. Recent studies have found that electrophysiological responses to emotional and drug-related cues can be used to create profiles that reliably predict smoking relapse.
New method:
This paper evaluates the validity of classifying electrophysiological responses into distinct profiles using a Bayesian dirichlet process mixture (DPM) model. The DPM is a Bayesian nonparametric (BNP) method to modeling unknown number of profiles characterized by uncertainty in cluster membership and in cluster number.
Results:
The DPM model confirmed previously identified neuroaffective reactivity profiles, but also revealed a finer level of granularity in the clustering. Specifically, in addition to the two clusters previously identified in the literature, the BNP methods identified a cluster of individuals showing similar responses to smoking, pleasant, neutral and unpleasant cues.
Comparison with existing methods:
BNP models provide an alternative to the k-mean clustering approach to modeling EEG-based neuroaffective profiles. Unlike k-means clustering, BNP models compute the probability that a subject belongs to a cluster while taking into consideration uncertainty in the number of clusters.
Conclusions:
Our results confirm the reliability of the two clusters previously identified in these data, but also provide new insights by revealing a cluster that presented similar responses to stimuli with different contents. This finding may be related to the uncertainty in classification or overlapping brain-reactivity profiles.
Keywords: smoking, drug addiction, relapse clinical outcome, cues, incentive salience, ERPs, LPP, biomarker, endophenotype, Bayesian, clustering
INTRODUCTION
Relapse, returning to use a drug after a period of abstinence, is one of the most common outcomes that individuals with addiction face when trying to quit. The early identification of patients that are most likely to relapse can provide clinicians the opportunity to to develop new and more successful personalized treatments for substance use disorders.
Previous attempts at estimating relapse vulnerability by classifying individuals using self-reports of addiction-related symptoms such as cravings or withdrawal have had limited success1. An alternative to symptom-based classifications is the identification of biomarkers: objectively measured characteristics that can be used as indicators of normal or pathological processes2. Neuroimaging techniques such as electroencephalography (EEG) and functional magnetic resonance imaging (fMRI) are particularly promising for this endeavor because they give researchers the opportunity to identify biomarkers associated with addiction’s underlying neurobiological contributors. Clinicians could use these biomarkers to predict treatment outcomes among more homogeneous group of patients3–5.
Relapse is often triggered by the presence of drug-related cues6. According to the incentive sensitization theory of drug addiction7–9 drug-related cues trigger relapse because, by having had been associated with the highly rewarding effects of the drug, they acquired high levels of incentive salience. Incentive salience refers to the motivational properties that make a stimulus wanted10. Once imbued with incentive salience, drug-related cues attract attention, trigger irresistible cravings and, ultimately, elicit compulsive drug seeking and relapse8. Pre-clinical models show that there is considerable variability in the extent to which animals end up attributing incentive salience to cues predicting rewards, and, importantly, these individual differences predict vulnerability to cue-induced compulsive behaviors that are strikingly similar to human cue-induced addictive behaviors11–14. In line with these preclinical findings, we15,16 found that smokers that at baseline (i.e., when still smoking at their regular rate) show larger brain responses to cigarette-related cues than non-nicotine-related pleasant stimuli (C>P) (C=cigarette stimuli & P=pleasant stimuli) are more likely to relapse when trying to quit than smokers with the opposite brain reactivity profile (i.e., larger brain responses to non-nicotine-related pleasant than to cigarette-related cues, P>C). We hypothesized that these individual differences could be used as a reliable biomarker to predict vulnerability to cue-induced relapse and improve personalized smoking cessation treatments17.
We identified these two neurophysiological reactivity profiles by applying k-means clustering to the neuroaffective responses evoked by cigarette-related, pleasant, neutral, and unpleasant stimuli. The rationale for hypothesizing a k=2 cluster solution stemmed from results emerging from preclinical studies using Pavlovian conditioning. During Pavlovian conditioning, if discrete cues predict food delivery at a different location, two distinct behavioral phenotypes emerge: “sign-tracking” (the tendency to approach the “sign”, i.e., the cue predicting food delivery), and “goal-tracking” (the tendency to approach the location where the food is delivered, the “goal”)14. Drug researchers interpreted sign-tracking as the behavioral consequence of the tenecy to attribute high levels of incentive salience to cues predicting rewards18 and showed that animals that sign-track to cued predicting food are particularly vulnerable to developing behaviors with striking similarities with human addictive behaviors13,19,20,14. Guided by these findings, we hypothesized that a 2-cluster solution would have been appropriate to capture a latent construct related to individual differences in the tendency to attribute incentive salience to cues and rewards. Post classification analyses21,22 confirmed that a 2-cluster solution was a good approximation of the latent structure under investigation, yet the true cluster solution is unobserved (and as such unknown). Furthermore, preclinical findings also highlighted that some animals might not be easily classified as sign- or goal-trackers because their behavior oscillates between approaching the sign and the goal23. These observation gave impetus to the idea of using a probabilistic, data-driven method to test the replicability of the reactivity profiles isolated using k-means clustering. A probabilistic evaluation of the quality of the classification would contribute to overcome some of the limitations of k-means clustering. K-means algorithms relie on arbitrary choices about the number of clusters in the data, cannot handle data with unbalanced clusters (i.e. substantial variation in the proportion of subject across clusters), do not provide clear criteria for choosing a distance measure, and not being probabilistic models, they do not provide a measure of uncertainty of cluster membership. A probabilistic evaluation of the quality of the classification would allow us to evaluate alternative models and integrate uncertainty in inferences and predictions.
The primary novel contribution of this work will be to address the shortcomings affecting k-means clustering by applying nonparametric Bayesian (NPB) models to the specific problem of characterizing smokers’ electrophysiological heterogeneity in responses to emotional images. Bayesian methods provide a transparent way to extract clusters from a dataset without making arbitrary choices about the number of clusters. Specifically, with the Dirichlet Process Mixture (DPM) model, a NPB model, we can automatically infer the number of clusters without the need to explicitly conduct comparison of models with different cluster sizes, since the number of clusters is not fixed a priori, but instead inferred from the data. In addition, contrary to hard clustering techniques, DPM models assign probabilities on individuals of being members of different clusters.
A central idea in personalized medicine is that patients are assigned to diagnostic categories and treatments based, implicitly, on the probability of correct classification to a diagnostic group and on the probability of success in treating the disease24. DPM explicitly optimize individual diagnosis and treatment by applying a Bayesian automated identification of the number of diagnostic groups, and by probabilistically ranking individuals into diagnostic categories. Individuals with high probabilities of membership in a diagnostic category are more likely to be responsive to treatments indicated for the specific diagnosis than individuals with higher uncertainty in diagnosis.
In this paper we describe an approach that automatically clusters individuals with similar electrophysiological affective responses (the late positive potential or LPP, a robust electrophysiological index of the motivational relevance of external stimuli25–29) based on Bayesian nonparametrics and Dirichlet process mixtures. In addition, we compare the DPM approach to k-means analyses of the same LPP data that we used to classify smokers in our previous published work15,24. The use of the DPM approach in this study aims to validate the extent to which the underline structure solution of the two brain reactivity profiles we have identified previously is independent of the methodology employed to discover these profiles.
METHODS
Dirichlet Process Mixtures Model
The Dirichlet process (DP) introduced by Ferguson (1973)30 is a discrete distribution over probability distributions defined by DP(α, G0) where α is a precision parameter and G0 is a base distribution defining the expectation of E(G) = G0. A DP can represented by:
| (1) |
where θκ represents a set of points drawn independent and identically distributed (i.i.d.) from the base distribution G0, and is the Dirac delta and is applied as a probability measure concentrated at θκ. The weights βk are sampled through a stick-breaking process31:
| (2) |
The sequence of the probability weights βk satisfies the constraint , i.e. the weights add up to 1. The stick-breaking process involves breaking a unit length stick into, theoretically, infinite pieces repeatedly. The first piece (first cluster) is randomly determined with a probability v1, the probability of the first cluster. After the first break, the next piece of the stick, κ = 2, has the probability (1 − v1)* v2, and are left with a stick of length (1 − v2)(1 − v1) which we continue breaking off. The process of breaking the stick (creating new clusters) continues until the data are adequately represented. This way clustering is a data driven process and it does not rely on a priori assumptions. Since we are using the stick breaking process, it follows that any draw G from DP(α, G0) is discrete and can be represented as a mixture of point masses . The parameter α plays a role in determining how many classes are associated with a non-negligible probability and controls the distribution of the prior weight applied to each cluster. In the Dirichlet process mixture model we use the Dirichlet process as a prior on the parameters. Specifically, we have a number of observations with yi ~ F(θι) and we generate a set of parameters from an unknown mixture distribution G that is drawn from a Dirichlet process G ~ DP(α, Go). Thus given our data on the four LPP measurements and the DP prior our model can be expressed as a stick breaking process with
| (3) |
| (4) |
| (5) |
| (6) |
The posterior distribution of θi, conditioned on the data y and θ−i is then given by
| (7) |
which shows that given θ−ι, θι depends only on yι. Thus the posterior distribution of the DPM model is given by
| (8) |
The conjugate prior distribution of the cluster-specific parameters for the mixing proportions is the symmetric Dirichlet distribution (a multivariate generalization of the beta distribution), with concentration α parameter α/κ
| (9) |
where α controls the distribution of the prior weight assigned to each cluster, and Γ is the gamma function. The priors on the parameters of the mixtures are conjugate consisting of diffuse Gaussian priors for the means and Wishart priors for the covariances.
Inference via Marcov Chain Monte Carlo (MCMC) Sampling
Estimating the posterior distribution of the DPM model is analytically difficult as it involves high dimensional integral in the marginal likelihood. For this reason it is common to use Markov Chain Monte Carlo (MCMC) simulation32 to approximate the posterior distribution of the model parameters33. Although the DPM model in theory can have an infinite number of parameters, we can perform exact inference with MCMC methods efficiently since only a finite number33 of parameters are needed to represent the data. We used Neal’s Gibbs sampling algorithm (#8)34 to estimate the posterior distribution of cluster assignment. More precisely we sample θι, according to
| (10) |
where q0 is the finite mixture distribution that we use to sample θ and ψ(θ|yi) = G0(θ) F(yi|θi)/q0. At the start of the initialization we consider each data point yi being its own cluster with . We proceed by sampling for the kth step in the following way:
Draw a sample from
Draw a sample from
…
Draw a sample from
We run 4 MCMC chains for 70,000 iterations after a burn-in phase of 20,000 iterations that were discarded. Gibbs sampling is very similar to Expectation-Maximization (EM) algorithm35 where for each iteration and having the cluster of each yi determined we update the parameters of the kth cluster.
Data
Data Processing
All EEG data used here were obtained from previous studies in which smokers (N=357) interested in quitting participated in a neurophysiological assessment while still smoking at their regular rate15,24. During the neurophysiological assessment (described in detail in the above mentioned publications), we continuously recorded EEG at 250 Hz using a 129-channel Geodesic Sensor Net connected to an AC-coupled high-input impedance (200 MΩ) amplifier (Geodesic EEG System 250; Electrical Geodesics, Inc., Eugene, OR) while participants looked at a slideshow that included cigarette-related, pleasant, neutral and unpleasant images. After data collection, we used a standard data reduction procedure to compute, for each individual, the event-related potentials evoked by the four picture category. The data reduction pipeline included the following steps: a) Visual inspection of the EEG to identify and interpolate broken channels; b) transformation of the EEG data to the average reference, which is necessary for accurate topographic mapping; c) eye movements and blinks correction using a spatial filtering method as implemented in BESA 6.1 (MEGIS Software GmbH, Gräfelfing, Germany); d) application of a 0.01-Hz high-pass filter and a 100-Hz low-pass filter to the data; e) segmentation of the continuous EEG into 900-ms epochs starting 100 ms before the onset of each picture; f) Baseline correction using the 100-ms interval preceding each picture; g) identification of artifacts contaminating sensors using a semi-automated artifact detection algorithm checking for amplitude, absolute difference between minimum and maximum voltage within epoch, and difference between two contiguous data points; h) interpolation of channels contaminated by artifacts for more than 50% of the recording time using spherical splines (any session in which more than 10% of the channels were interpolated was discarded from subsequent analyses); i) rejection of trials with more than 10% of the sensors contaminated by artifacts; l) voltage average across 10 centroparietal sensors; m) computation of the average ERPs at each scalp site for each category (i.e., pleasant, cigarette-related, neutral, unpleasant); n) calculation of the LPP amplitude between 400 and 800 ms after picture onset.
The final data set included 357 individuals with LPP values for pleasant, cigarette-related, neutral, and unpleasant picture. Figure 1 shows the ERP waveforms and the average LPP differences among the 4 picture categories. The y-axis represents the amplitude (in microvolts) of the event-related potentials (ERP) evoked by plesant (PLE), unpleasant (UNP), cigarette (CIG), and neutral (NEU)-related pictures. The waveforms represent grand-averages across all participants of the mean voltage from 10 centro-parietal electrodes (see inset for electrode location). The box indicates the time window used to calculate the late positive potential aplitude for each picture category. As expected, pleasant, cigarette-related, and unpleasant images prompted significantly larger LPPs than neutral images.
Figure 1.
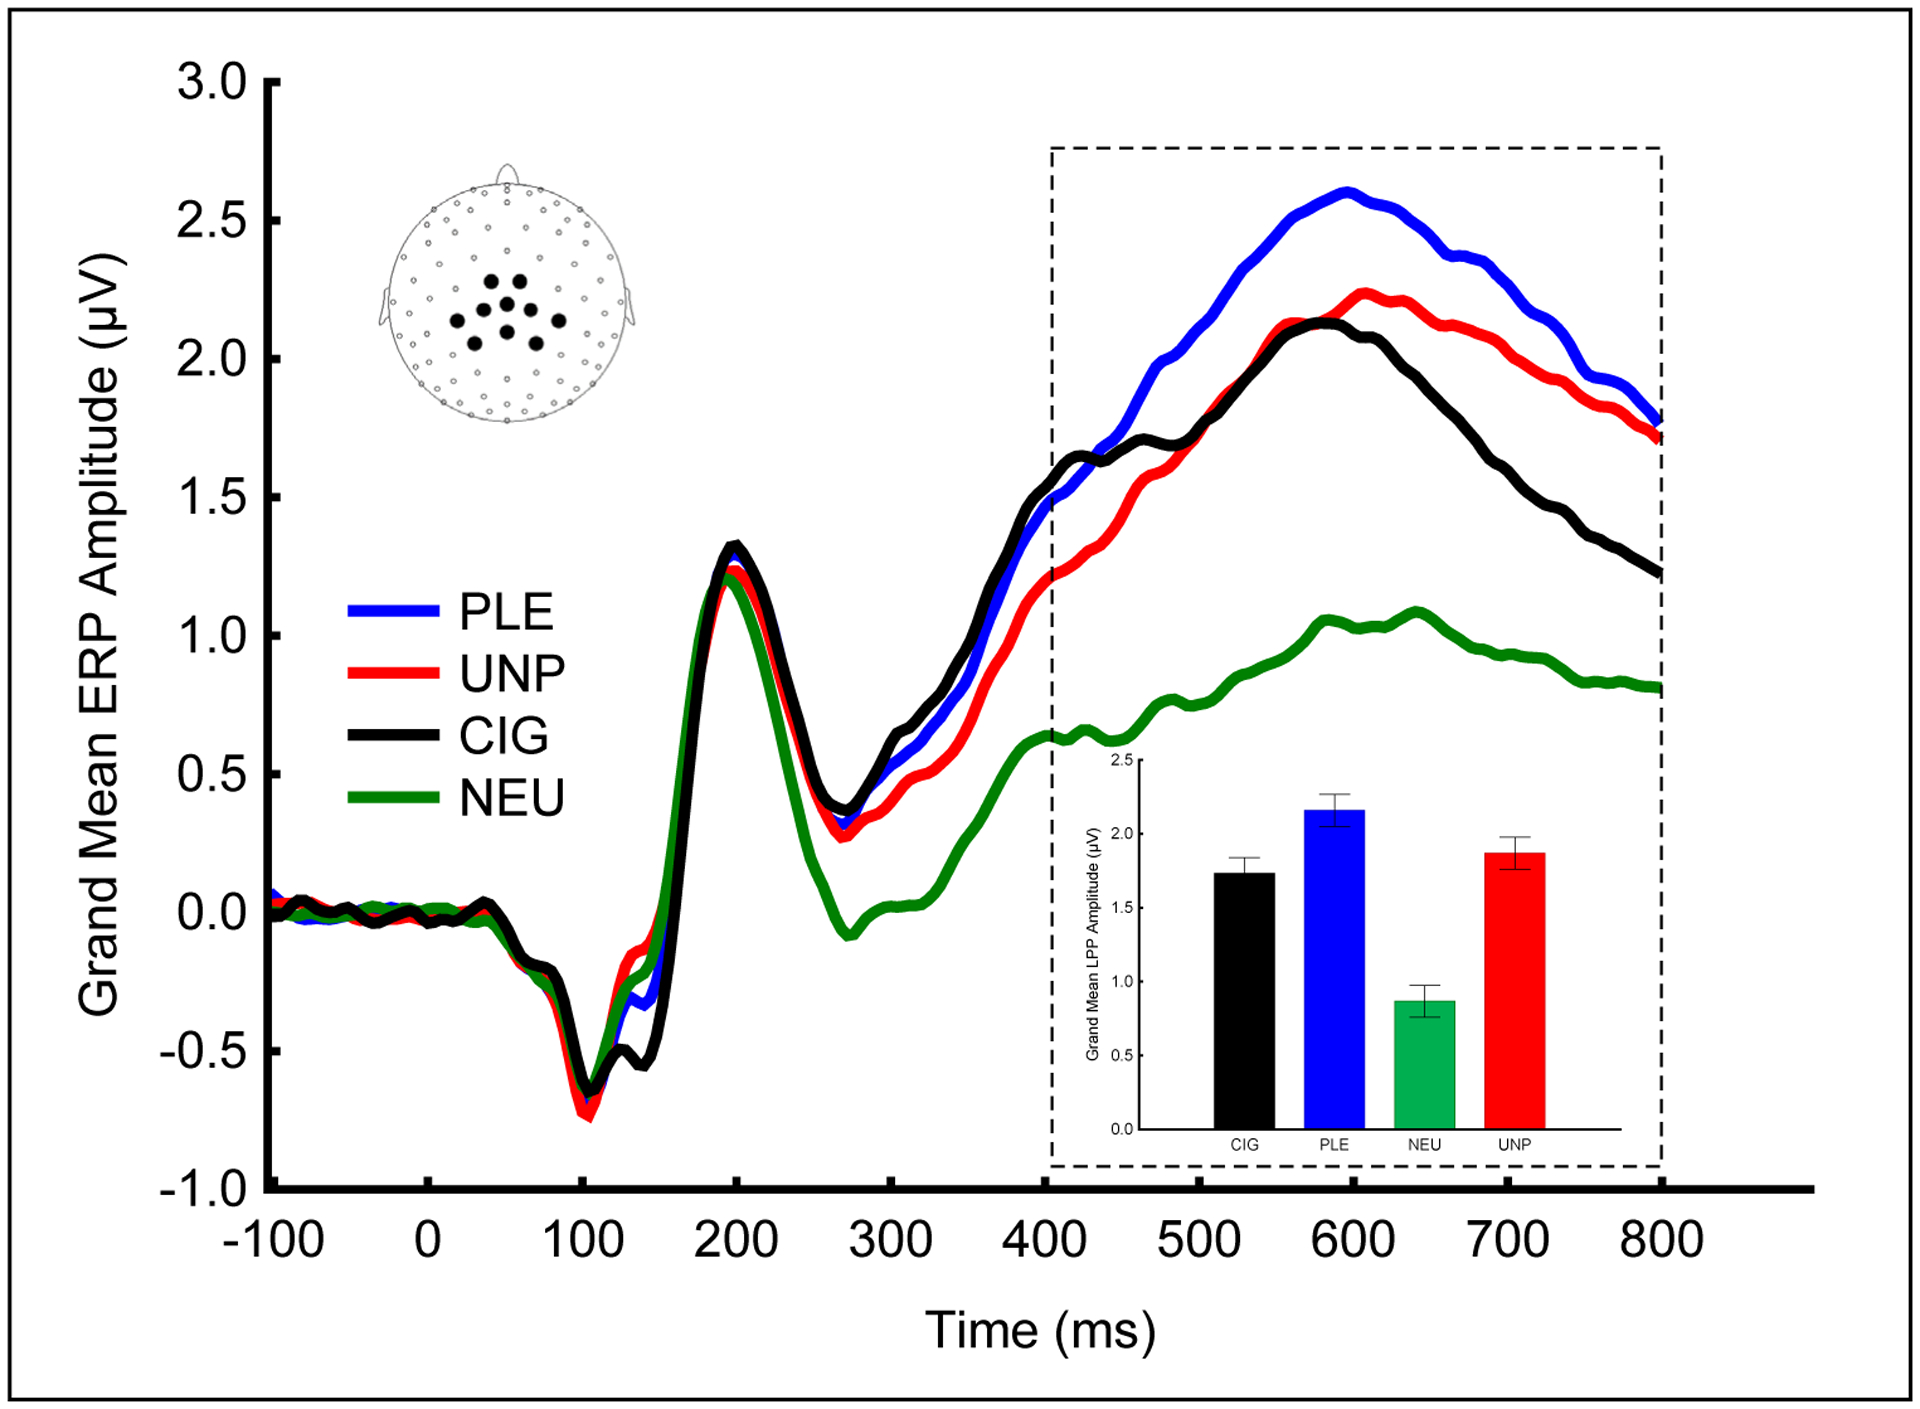
As expected, pleasant, cigarette-related, and unpleasant images prompted significantly larger LPPs than neutral images in the 400–800 ms window. The waveforms show the grand-averaged ERPs evoked by each picture category from the group of centroparietal sensors highlighted in the inset.
RESULTS
Descriptive
Table 1 presents baseline characteristics of the individuals assigned to the two clusters previously identified via the k-means method. We tested for differences in age, gender, race, nicotine dependence (measured using the Fagerstrom Test for Nicotine Dependence, FTND36), and depression (measured using the Center for Epidemiologic Studies Depression Scale, CES-D37). We did not observe significant differences in any of the baseline characteristics between the two clusters.
Table 1.
Baseline characteristics by clusters identified by k-means.
| C>P& N = 212 | P>C^ N = 145 | ||||
|---|---|---|---|---|---|
| Variable | Mean or N | SD or % | Mean or N | SD or % | p-value |
| Age | 45.86 | 10.42 | 45.83 | 10.35 | 0.980 |
| Male | 126 | 60 | 88 | 60.69 | 0.896 |
| Race | |||||
| AA * | 99 | 46.7 | 69 | 47.59 | 0.857 |
| White | 105 | 49.53 | 69 | 47.59 | |
| Other | 8 | 3.77 | 7 | 4.83 | |
| FTND $ | 4.65 | 2.02 | 4.71 | 2.15 | 0.815 |
| CES-D # | 9.95 | 7.54 | 9.82 | 8.62 | 0.882 |
larger brain responses to cigarette-related cues than non-nicotine-related pleasant stimuli;
larger brain responses to non-nicotine-related pleasant stimuli than cigarette-related cues;
African American;
Fagerstrom Test for Nicotine Dependence;
Depression (Center for Epidemiologic Studies Depression Scale)
Posterior Probabilities of Cluster Number and Cluster Membership
In Figure 2, we present the relative frequency of the number of clusters represented over the MCMC samples. The figure shows that the most likely solution ranges between 2 and 5 clusters. This narrow range of number of clusters underlines our premise that the clustering of the subjects found is associated with substantial stability since only the two and three cluster solutions were visited with considerable posterior probability. There is a 60% posterior probability that there are 3 clusters in the data (with 95% credibility interval 2–4), 37% posterior probability of 2 clusters and 3% and 0.1 percent probability of 4 and 5 clusters respectively. The solution of 1 cluster was never visited by the MCMC sampler, a strong indication of the presence of heterogeneity in LPP responses to the cues.
Figure 2.

The MCMC runs showed Probability of each cluster solution derived from the MCMC runs.
Based on these results, we decided to consider the 3 cluster solution as the best representation of the data. In Table 2 we evaluated whether individuals between the three clusters produced by the BNP method differ in any of the baseleline characteristics. We found significant differences among groups in nicotine dependence (FTND). Specifically, individuals in the third cluster reported significantly lower nicotine dependence than individuals in cluster 1 and cluster 2. No other significant differences were observed among the three clusters.
Table 2.
Baseline characteristics by cluster identified by the BNP method.
| Cluster 1 N = 160 | Cluster 2 N = 127 | Cluster 3 N = 70 | |||||
|---|---|---|---|---|---|---|---|
| Variable | Mean or N | SD or % | Mean or N | SD or % | Mean or N | SD or % | p-value |
| Age | 44.91 | 11.09 | 46.33 | 10.00 | 47.10 | 9.28 | 0.276 |
| Male | 99 | 62.66 | 81 | 63.78 | 34 | 48.57 | 0.080 |
| Race | |||||||
| AA * | 67 | 41.88 | 58 | 45.67 | 43 | 61.43 | 0.055 |
| White | 87 | 54.38 | 64 | 50.39 | 23 | 32.86 | |
| Other | 6 | 3.75 | 5 | 3.94 | 4 | 5.71 | |
| FTND $ | 4.80 | 1.99 | 4.96 | 2.16 | 3.88 | 1.90 | 0.001 |
| CES-D # | 9.60 | 8.18 | 10.16 | 7.96 | 10.06 | 7.68 | 0.831 |
African American;
Fagerstrom Test for Nicotine Dependence;
Depression (Center for Epidemiologic Studies Depression Scale)
The posterior probabilities of cluster membership is 83% for the 1st cluster, 80% for the 2nd cluster and 83% of the 3rd cluster. The cross-clustering posterior probabilities (probabilities of members in one cluster being members in another cluster) range from 5% to 14%, indicating relatively low cross-clustering. Unlike k-means methods and other clustering methods based on hard clustering of the data, the approach described in this paper computes the probability of an individual being a member of a cluster while taking into account all sources of model uncertainty (including number of clusters). Specifically, we use the probability pij that two individuals i and j belong to the same cluster in the DPM model as a measure of the (dis)similarity within and between clustering profiles. In Figure 3, the (dis)similarity in the posterior probabilities of cluster membership that two individuals belong to the same cluster determined solely by the data is expressed by the intensity of the color black. Lighter shades represent low similarity in the posterior probabilities of cluster membership between two individuals and darker shades high similarity. The (dis)similarity measure between two subjects’ patterns of posterior probabilities is defined as , which is 1 minus the correlation patterns of cluster membership probabilities. Individuals with similar patterns of correlations among their cluster membership probabilities are more likely to be in the same cluster. The three darker blocks along the diagonal correspond to homogeneous clusters in terms of LPP responses. The x and y axis labels in the figure are numbers identifying study participants. Black represents absolute agreement in the posterior probabilities of cluster memebrship between two persons, white represents absolute disagreement in the posterior probabilities of cluster membership, grey indicates cross-clustering or overlapping clusters for pairs of individuals. As expected, Figure 3 shows that individuals within the same cluster are more likely to have very similar posterior probabilities of cluster membership (closer to black) than individuals belonging to different clusters (closer to white).
Figure 3.
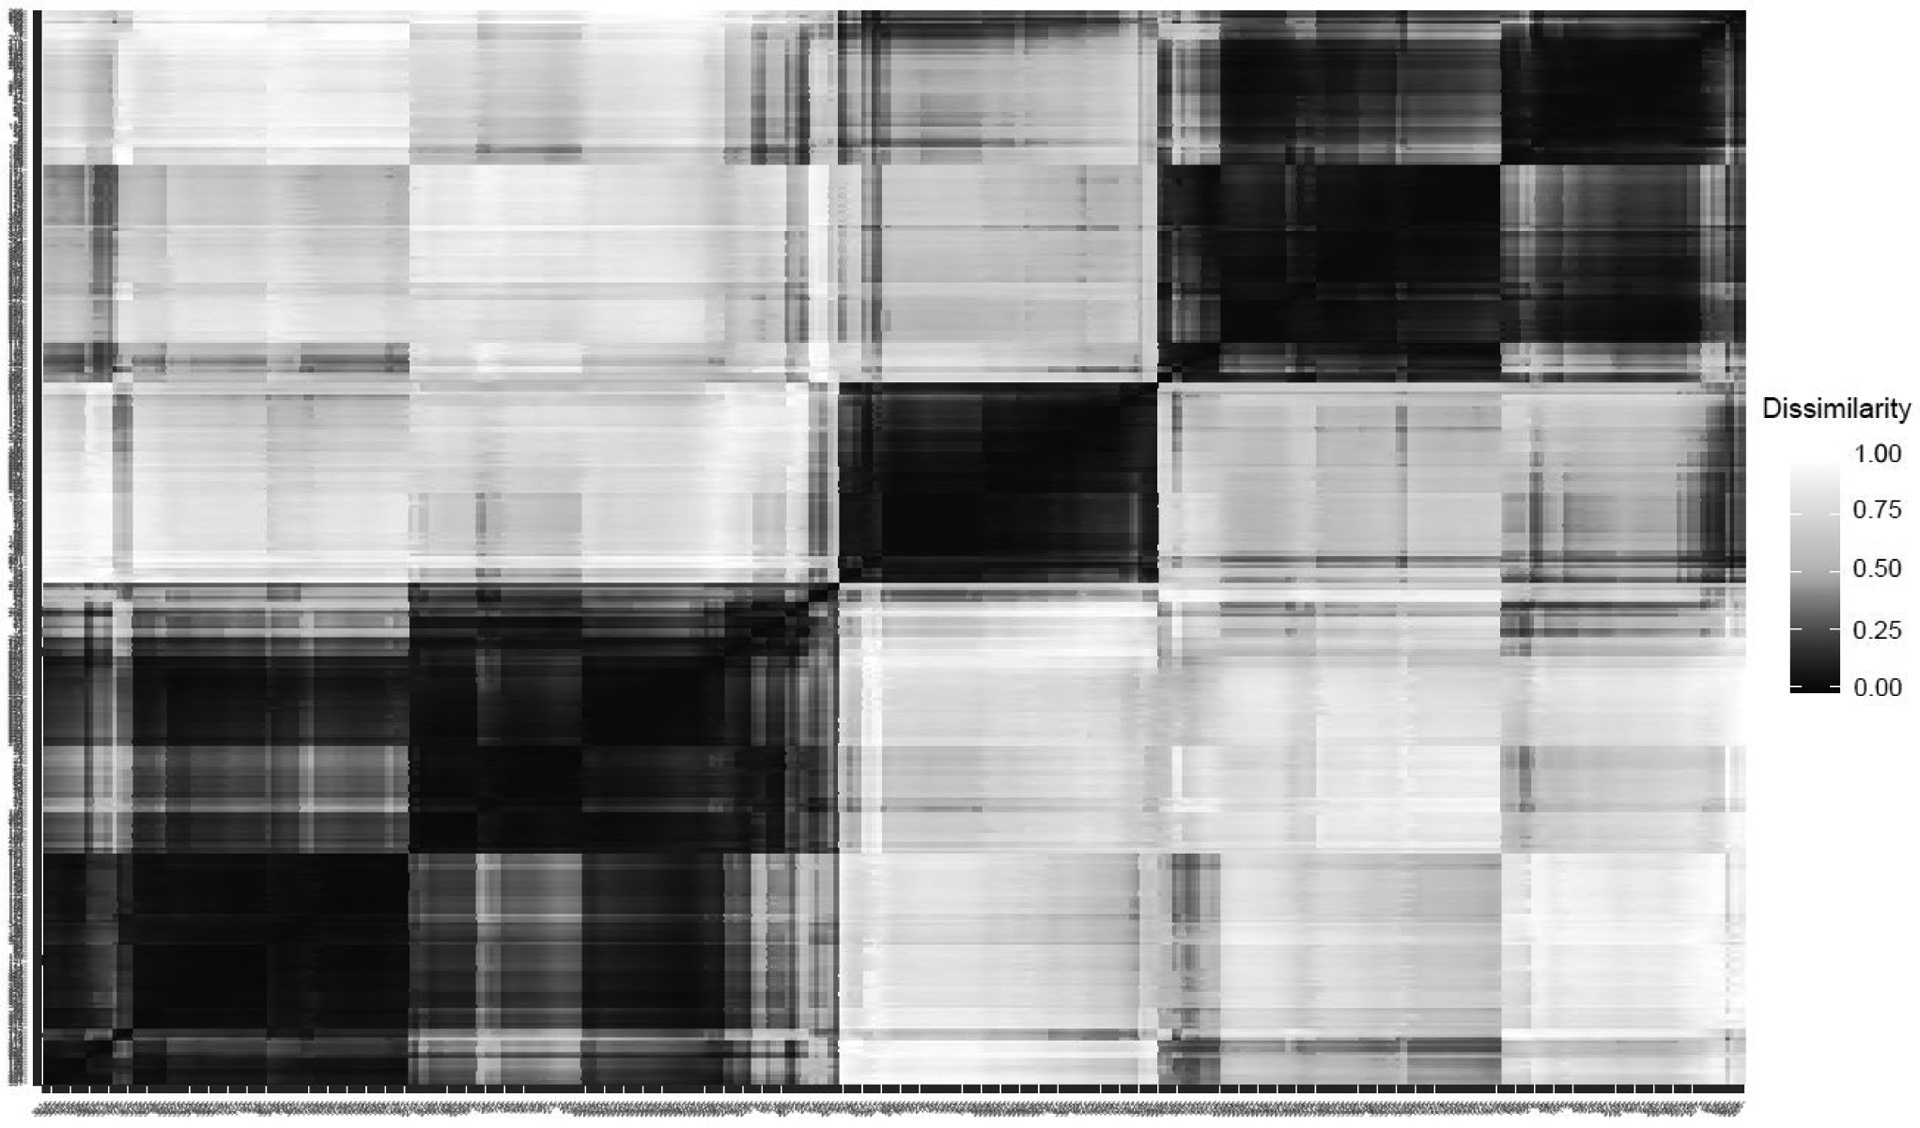
The (dis)similarity matrix for the DPM model based on the posterior probabilities of cluster membership indicates that individuals within the same cluster are more likely to have very similar posterior probabilities of cluster membership (indicated by darker shades) than individuals belonging to different clusters (indicated by lighter shades). Darker shades represent higher similarity in the distribution of posterior probabilities of different individuals within each cluster. Grey indicates cross-clustering or overlapping clusters for pairs of individuals. Individuals are identified by the numbers on the x and y axis.
Examining the cluster-specific parameters for all variables
The mean response to the four picture categories observed for each cluster is shown in Figure 4. Examination of these posterior parameter estimates provides particular insight into the structure of the three clusters. Individuals in both Cluster 1 and Cluster 2 show higher reactivity to emotional (including cigarette-related cues) than neutral stimuli, a pattern of reactivity very well replicated in the literature26,29. Importantly, replicating what we observed in our previous studies, individuals in Cluster 1 (N = 160) show higher brain responses to pleasant stimuli than to cigarette cues, whereas individuals in Cluster 2 (N = 127) presents the opposite pattern, higher brain responses to cigarette cues as compared to pleasant stimuli. Unlike what observed for the other two clusters, individuals in Cluster 3 (N = 70) respond similarly to all type of stimuli.
Figure 4.

Mean and 95% confidence intervals for neuroaffective responses evoked by each image in each cluster identified by the MCMC samples. Replicating previous findings, individuals in Cluster 1 (N = 160) show higher brain responses to pleasant stimuli than to cigarette cues, whereas individuals in Cluster 2 (N = 127) presents the opposite pattern, higher brain responses to cigarette cues as compared to pleasant stimuli. Individuals in Cluster 3 (N = 70) respond similarly to all type of stimuli.
Correspondence between NP Bayesian membership and the k-means Clustering
As mentioned above, the data analyzed here have been used previously to classify smokers using k-means cluster analysis with k=215,24. Table 3 shows the congruence of the BNP 3-cluster solution against the 2-cluster solution that we previously identified. We use the Rand Index38 (RI) to compare the clustering performance. RI is a measure for clustering is independent of the number of clusters and it measures cluster similarity by counting pairs that are assigned consistently or inconsistently with an alternative classification method. The Rand index when we compare the DPM model solution with the k-means solution is 72, and percent disagreement is 26%. There is substantial agreement between the DPM model’s 1st and 2nd clusters and the 2-clusters previously reported and derived from k-means clustering.
Table 3.
Cross tabulation of clustering of the k-means solution and the BNP solution.
| Bayesian Nonparametric solution % (N) | |||||
|---|---|---|---|---|---|
| 1 | 2 | 3 | Row Total | ||
| k-means Solution | P>C | 71 (150) | 7 (15) | 22 (47) | 59 (212) |
| C>P | 7 (10) | 77 (112) | 15 (23) | 41 (145) | |
| Column Total | 45 (160) | 35 (127) | 20 (70) | ||
The third cluster identified here, may imply that there is uncertainty whether a subset of individuals should be assigned to one of the two other clusters, or it may indicate that a subset of subjects may belong simultaneously to both clusters. Moreover, the absence of significant differences in reactivity to emotional and neutral stimuli might indicate poor data quality or a low emotional reactivity pattern recently associated with the presence of anxiety disorders39. In our case, there is substantial uncertainty of assignment of the third cluster in either the first or the second clusters, and we should suggest the existence of a third cluster (as discussed above, cross-clustering probabilities did not exceed 0.14, indicating low probability that a member of the third cluster being a member of the first or second cluster). As a result, the BNP method was able to distribute individuals into more specific clusters.
Predictive comparison of k-means and BNP clustering on smoking abstinence
We previously showed that smokers assigned by the k-means cluster analysis to the C>P group have lower abstinence rates than those assigned to the P>C group15,24. Hence, after clustering and membership identification using the BNP method, we used abstinence as an outcome to evaluate the predictive validity of the new cluster solution. We used a Bayesian logistic regression model with vague priors centered at 0 and same model priors (0.5), to estimate the posterior probability that the clustering has a non-zero effect on abstinence, and we computed the marginal likelihood using Laplace-Metropolis approximation (Table 4). We run identical models for both the k-means clustering and the BNP clustering solutions and we compared the two models using Bayes factor. The logarithm of the Bayes factor is 5.88 favoring the model with the two clusters, meaning that the 2 cluster solution was more accurate at predicting smoking abstinence. Although the Bayes factor favors the 2-cluster solution, according to Jeffreys’40 interpretation of Bayes factor (1–3 anecdotal evidence; 3–10 moderate; 10–30 strong; 30–100 very strong; and 100+ decisive), the evidence favoring the superiority of the 2-cluster solution over the 3-cluster solution is moderate. Hence these results indicate that the new approach validated the 2-clusters structure, but also suggests the presence of a smaller cluster of individuals that do not differentially respond to neutral and emotional stimuli.
Table 4.
Bayesian logistic regressions on cluster membership on abstinence by clustering algorithm. The Bayes facor of 5.88 indicates moderate evidence favoring the superiority of the 2-cluster solution over the 3-cluster solution.
| k-means Clustering | BNP+ | ||||||
|---|---|---|---|---|---|---|---|
| OR* | HPD# | Posterior probability < 0 | OR | HPD | Posterior probability < 0 | ||
| C>P & vs. P>C ^ | 0.58 | 0.28 – 0.91 | .983 | 0.62 | 0.28 – 0.98 | 0.961 | |
| C>P vs. New Cluster | 0.61 | 0.24 – 1.08 | 0.069 | ||||
| P>C vs. New Cluster | 1.02 | 0.47 – 1.74 | 0.442 | ||||
| DIC @ | 369.37 | 371.89 | |||||
| Bayes Factor (k-means vs. BNP models) | 5.88 | ||||||
Bayesian Non-Parametric;
Odds Ratio;
Highest Posterior Density;
larger brain responses to cigarette-related cues than non-nicotine-related pleasant stimuli;
larger brain responses to non-nicotine-related pleasant stimuli than cigarette-related cues;
Deviance Information Criterion
DISCUSSION
The relationship between neuroaffective reactivity and smoking relapse that we identified here and elsewhere15,24, underscores the role that reactivity to drug-related cues and rewards plays in smoking relapse and provides a method to identify smokers at risk for relapse before starting any treatment. While conventional hard clustering methods produce predefined number of clusters, the DPM approach computes the probability that a subject belongs to a cluster and provides both uncertainty in cluster membership and uncertainty in the number of clusters. Previous methods of clustering ERPs do not explicitly integrate uncertainty in the classification of subject or uncertainty in the number of clusters obtained. Bayesian approaches to clustering have recently received a lot of attention in biology and cytometric41, gene expression42, in physcis43, and engineering44. Here we present an MCMC procedure for ERPs that replicated results from previous analyses and provides a novel and strong support for clustering individuals into meaningful categories based on neurophysiological responses to stimuli rather than self-reports of symptoms. Our results provide additional support to claims that ERP responses can be grouped together meaningfully and be used to predict future smoking status4,45.
Our results are theoretically meaningful and extend previously published results obtained using k-means cluster analysis on these data. We obtained a confirmation of previously identified endophenotypes, but also we were able to reveal a finer level of granularity in the clustering. In particular, using BNP methods we identified a cluster with invariant responses to smoking, pleasant, neutral and unpleasant cues, in addition to the two clusters already identified in the literature17,24. The identification of the third cluster may suggest either considerable uncertainty about these subjects’ assignment, or that some subjects may have multiple membership assignments simultaneously. This would be in line with results from animal models showing that some individuals might not be easily classified as sign- or goal- trackers23. In this case, the assumption that a subject should be assign to a single cluster may not be valid and we should consider cross-cluster membership as a hypothesis of overlapping brain-reactivity profiles. Specifically, future work will test the hypothesis that there may exist a third cluster that is characterized by relatively equal affinity for both the C>P and P>C clusters.
Conclusion:
DPM models provide an alternative to the k-mean clustering approach to modeling EEG endophenotypes. Unlike k-means clustering, DPM models compute the probability that a subject belongs to a cluster while taking into consideration uncertainty in the number of clusters. Our DPM model clustering results are theoretically plausible and extend previous cluster analyses of EEG measurements. Our results not only confirm previously published clusters identified in these data, but also provide insights by revealing a cluster that presented similar responses to four different cues. This is the first time that a group with similar responses to different cues is identified and may suggest uncertainty in classification or overlapping brain-reactivity profiles.
Highlights.
Attempts of classifying individuals using electrophysiological measures have had limited success.
Bayesian nonparametrics can automatically cluster individuals with similar profiles.
We replicated and extended previous findings on heterogeneity of neuroaffective biomarkers.
References
- 1.Shiffman S, Balabanis MH, Gwaltney CJ, et al. Prediction of lapse from associations between smoking and situational antecedents assessed by ecological momentary assessment. Drug Alcohol. Depend 2007;91(2–3):159–168. doi: 10.1016/j.drugalcdep.2007.05.017. [DOI] [PMC free article] [PubMed] [Google Scholar]
- 2.Antoniou M, Kolamunnage-Dona R, Jorgensen AL. Biomarker-Guided Non-Adaptive Trial Designs in Phase II and Phase III: A Methodological Review. J Pers Med. 2017;7(1). doi: 10.3390/jpm7010001. [DOI] [PMC free article] [PubMed] [Google Scholar]
- 3.Ekhtiari H, Faghiri A, Oghabian M-A, Paulus MP. Functional neuroimaging for addiction medicine: From mechanisms to practical considerations. Prog Brain Res. 2016;224:129–153. doi: 10.1016/bs.pbr.2015.10.001. [DOI] [PubMed] [Google Scholar]
- 4.Moeller SJ, Paulus MP. Toward biomarkers of the addicted human brain: Using neuroimaging to predict relapse and sustained abstinence in substance use disorder. Prog Neuropsychopharmacol Biol Psychiatry. 2018;80(Pt B):143–154. doi: 10.1016/j.pnpbp.2017.03.003. [DOI] [PMC free article] [PubMed] [Google Scholar]
- 5.Stewart JL, May AC. Electrophysiology for addiction medicine: From methodology to conceptualization of reward deficits. Prog Brain Res. 2016;224:67–84. doi: 10.1016/bs.pbr.2015.07.013. [DOI] [PubMed] [Google Scholar]
- 6.Shiffman S, Paty J, Gnys M, Kassel J, Hickcox M. First lapses to smoking: Within-subjects analysis of real-time reports. J Consult.Clin.Psychol 1996;64(2):366–379. doi: 10.1037/0022-006X.64.2.366. [DOI] [PubMed] [Google Scholar]
- 7.Berridge KC, Robinson TE. Liking, wanting, and the incentive-sensitization theory of addiction. The American Psychologist. 2016;71(8):670–679. doi: 10.1037/amp0000059. [DOI] [PMC free article] [PubMed] [Google Scholar]
- 8.Robinson TE, Berridge KC. Addiction. Annu Rev Psychol. 2003;54:25–53. doi: 10.1146/annurev.psych.54.101601.145237. [DOI] [PubMed] [Google Scholar]
- 9.Robinson MJF, Robinson TE, Berridge KC. Incentive salience and the transition to addiction. Biological research on addiction. 2013;2:391–399. [Google Scholar]
- 10.Berridge KC. From prediction error to incentive salience: Mesolimbic computation of reward motivation. Eur J Neurosci. 2012;35(7):1124–1143. doi: 10.1111/j.1460-9568.2012.07990.x. [DOI] [PMC free article] [PubMed] [Google Scholar]
- 11.Flagel SB, Robinson TE. Neurobiological Basis of Individual Variation in Stimulus-Reward Learning. Current Opinion in Behavioral Sciences. 2017;13:178–185. doi: 10.1016/j.cobeha.2016.12.004. [DOI] [PMC free article] [PubMed] [Google Scholar]
- 12.Sarter M, Phillips KB. The neuroscience of cognitive-motivational styles: Sign- and goal-trackers as animal models. Behav Neurosci. 2018;132(1):1–12. doi: 10.1037/bne0000226. [DOI] [PMC free article] [PubMed] [Google Scholar]
- 13.Saunders BT, Robinson TE. Individual variation in resisting temptation: implications for addiction. Neurosci Biobehav.Rev 2013;37(9 Pt A):1955–1975. doi: 10.1016/j.neubiorev.2013.02.008. [DOI] [PMC free article] [PubMed] [Google Scholar]
- 14.Tomie A, Grimes KL, Pohorecky LA. Behavioral characteristics and neurobiological substrates shared by Pavlovian sign-tracking and drug abuse. Brain Res.Rev 2008;58(1):121–135. doi: 10.1016/j.brainresrev.2007.12.003. [DOI] [PMC free article] [PubMed] [Google Scholar]
- 15.Versace F, Lam CY, Engelmann JM, et al. Beyond cue reactivity: Blunted brain responses to pleasant stimuli predict long term smoking abstinence. Addict Biol. 2012;17(6):991–1000. doi: 10.1111/j.1369-1600.2011.00372.x. [DOI] [PMC free article] [PubMed] [Google Scholar]
- 16.Versace F, Engelmann JM, Robinson JD, et al. Pre-quit fMRI responses to pleasant and cigarette cues predict cessation outcome. Nicotine Tob.Res 2014;16(6):697–708. doi: 10.1093/ntr/ntt214. [DOI] [PMC free article] [PubMed] [Google Scholar]
- 17.Versace F, Engelmann JM, Deweese MM, et al. Beyond Cue Reactivity: Non-Drug-Related Motivationally Relevant Stimuli Are Necessary to Understand Reactivity to Drug-Related Cues. Nicotine Tob.Res 2017;19(6):663–669. doi: 10.1093/ntr/ntx002. [DOI] [PMC free article] [PubMed] [Google Scholar]
- 18.Flagel SB, Akil H, Robinson TE. Individual differences in the attribution of incentive salience to reward-related cues: Implications for addiction. Neuropharmacology. 2009;56Suppl 1:139–148. [DOI] [PMC free article] [PubMed] [Google Scholar]
- 19.Tunstall BJ, Kearns DN. Sign-tracking predicts increased choice of cocaine over food in rats. Behav Brain Res. 2015;281:222–228. doi: 10.1016/j.bbr.2014.12.034. [DOI] [PMC free article] [PubMed] [Google Scholar]
- 20.Flagel SB, Clark JJ, Robinson TE, et al. A selective role for dopamine in stimulus-reward learning. Nature. 2011;469(7328):53–57. doi: 10.1038/nature09588. [DOI] [PMC free article] [PubMed] [Google Scholar]
- 21.Versace F, Kypriotakis G, Basen-Engquist K, Schembre SM. Heterogeneity in brain reactivity to pleasant and food cues: Evidence of sign-tracking in humans. Soc Cogn Affect Neurosci. 2016;11(4):604–611. doi: 10.1093/scan/nsv143. [DOI] [PMC free article] [PubMed] [Google Scholar]
- 22.Versace F, Frank DW, Stevens EM, Deweese MM, Guindani M, Schembre SM. The reality of “food porn”: Larger brain responses to food-related cues than to erotic images predict cue-induced eating. Psychophysiology. 2019;56(4):e13309. doi: 10.1111/psyp.13309. [DOI] [PMC free article] [PubMed] [Google Scholar]
- 23.Meyer PJ, Lovic V, Saunders BT, et al. Quantifying individual variation in the propensity to attribute incentive salience to reward cues. PloS one. 2012;7(6):e38987. [DOI] [PMC free article] [PubMed] [Google Scholar]
- 24.Frank DW, Cinciripini PM, Deweese MM, et al. Toward Precision Medicine for Smoking Cessation: Developing a Neuroimaging-Based Classification Algorithm to Identify Smokers at Higher Risk for Relapse. Nicotine Tob.Res 2019. doi: 10.1093/ntr/ntz211. [DOI] [PMC free article] [PubMed] [Google Scholar]
- 25.Keil A, Bradley MM, Hauk O, Rockstroh B, Elbert T, Lang PJ. Large-scale neural correlates of affective picture processing. Psychophysiology. 2002;39(5):641–649. doi: 10.1111/1469-8986.3950641. [DOI] [PubMed] [Google Scholar]
- 26.Lang PJ, Bradley MM. Emotion and the motivational brain. Biol Psychol. 2010;84(3):437–450. doi: 10.1016/j.biopsycho.2009.10.007. [DOI] [PMC free article] [PubMed] [Google Scholar]
- 27.Minnix JA, Versace F, Robinson JD, et al. The late positive potential (LPP) in response to varying types of emotional and cigarette stimuli in smokers: A content comparison. Int.J.Psychophysiol 2013;89(1):18–25. doi: 10.1016/j.ijpsycho.2013.04.019. [DOI] [PMC free article] [PubMed] [Google Scholar]
- 28.Schupp HT, Cuthbert BN, Bradley MM, Cacioppo JT, Ito T, Lang PJ. Affective picture processing: The late positive potential is modulated by motivational relevance. Psychophysiology. 2000;37(2):257–261. doi: 10.1111/1469-8986.3720257. [DOI] [PubMed] [Google Scholar]
- 29.Weinberg A, Hajcak G. Beyond good and evil: The time-course of neural activity elicited by specific picture content. Emotion. 2010;10(6):767–782. doi: 10.1037/a0020242. [DOI] [PubMed] [Google Scholar]
- 30.Ferguson TS. A Bayesian Analysis of Some Nonparametric Problems. The Annals of Statistics. 1973;1:209–230. [Google Scholar]
- 31.Sethuraman J A Constructive Definition of Dirichlet Priors. Fort Belvoir, VA: Defense Technical Information Center; 1991. [Google Scholar]
- 32.Robert CP, Casella G. Monte Carlo statistical methods. 2. ed.New York, NY: Springer; 2004. Springer texts in statistics.http://www.loc.gov/catdir/enhancements/fy0818/2004049157-d.html. [Google Scholar]
- 33.Kenward MG, Roger JH. Small sample inference for fixed effects from restricted maximum likelihood. Biometrics. 1997;53(3):983–997. [PubMed] [Google Scholar]
- 34.Neal RM. Markov Chain Sampling Methods for Dirichlet Process Mixture Models. Journal of Computational and Graphical Statistics. 2000;9(2):249–265. doi: 10.1080/10618600.2000.10474879. [DOI] [Google Scholar]
- 35.Dempster AP, Laird NM, Rubin DB Maximum Likelihood from Incomplete Data via the EM Algorithm. Journal of the Royal Statistical Society.Series B (Methodological). 1977;39(1):1–38. [Google Scholar]
- 36.Fagerstrom KO. Measuring degree of physical dependence to tobacco smoking with reference to individualization of treatment. Addict.Behav 1978;3(3–4):235–241. [DOI] [PubMed] [Google Scholar]
- 37.Radloff LS. The CES-D Scale: A self-report depression scale for research in the general population. Appl Psychol Meas. 1977;1(3):385–401. doi: 10.1177/014662167700100306. [DOI] [Google Scholar]
- 38.Rand WM. Objective Criteria for the Evaluation of Clustering Methods. Journal of the American Statistical Association. 1971;66(336):846. doi: 10.2307/2284239. [DOI] [Google Scholar]
- 39.Sambuco N, Bradley M, Herring D, Hillbrandt K, Lang PJ. Transdiagnostic trauma severity in anxiety and mood disorders: Functional brain activity during emotional scene processing. Psychophysiology. 2020;57(1):e13349. doi: 10.1111/psyp.13349. [DOI] [PMC free article] [PubMed] [Google Scholar]
- 40.Jeffreys H Theory of probability. 3rd ed.Oxford Oxfordshire: Clarendon Press; New York : Oxford University Press; 1998. Oxford classic texts in the physical sciences. [Google Scholar]
- 41.Hejblum BP, Alkhassim C, Gottardo R, Caron F, Thiébaut R. Sequential Dirichlet process mixtures of multivariate skew $t$-distributions for model-based clustering of flow cytometry data. The Annals of Applied Statistics. 2019;13(1):638–660. doi: 10.1214/18-AOAS1209. [DOI] [Google Scholar]
- 42.McDowell IC, Manandhar D, Vockley CM, Schmid AK, Reddy TE, Engelhardt BE. Clustering gene expression time series data using an infinite Gaussian process mixture model. PLoS Comput Biol. 2018;14(1):e1005896. doi: 10.1371/journal.pcbi.1005896. [DOI] [PMC free article] [PubMed] [Google Scholar]
- 43.Sgouralis I, Madaan S, Djutanta F, Kha R, Hariadi RF, Pressé S. A Bayesian Nonparametric Approach to Single Molecule Förster Resonance Energy Transfer. J Phys Chem B. 2019;123(3):675–688. doi: 10.1021/acs.jpcb.8b09752. [DOI] [PMC free article] [PubMed] [Google Scholar]
- 44.Foroozmehr F, Nazari B, Sadri S, Rikhtehgaran R. Spike sorting: Which clustering method should be chosen? Which circumstances affect this selection? In: 2017 25th Iranian Conference on Electrical Engineering (ICEE): K.N. Toosi University of Technology, Tehran, Iran, 2–4 May 2017. [Piscataway, NJ: ]: IEEE; 2017:55–60. [Google Scholar]
- 45.Houston RJ, Schlienz NJ. Event-Related Potentials as Biomarkers of Behavior Change Mechanisms in Substance Use Disorder Treatment. Biol.Psychiatry Cogn.Neurosci.Neuroimaging 2018;3(1):30–40. doi: 10.1016/j.bpsc.2017.09.006. [DOI] [PMC free article] [PubMed] [Google Scholar]