

Summary
This systematic review with meta‐analyses aimed to identify the sensory and physical characteristics of foods/beverages which increase satiation and/or decrease/delay subsequent consumption without affecting acceptability. Systematic searches were first undertaken to identify review articles investigating the effects of any sensory and physical food characteristic on food intake. These articles provided some evidence that various textural parameters (aeration, hardness, homogeneity, viscosity, physical form, added water) can impact food intake. Individual studies investigating these effects while also investigating acceptability were then assessed. Thirty‐seven individual studies investigated a textural manipulation and provided results on food intake and acceptability, 13 studies (27 comparisons, 898 participants) investigated effects on satiation, and 29 studies (54 comparisons, 916 participants) investigated effects on subsequent intake. Meta‐analyses of within‐subjects comparisons (random‐effects models) demonstrated greater satiation (less weight consumed) from food products that were harder, chunkier, more viscous, voluminous, and/or solid, while demonstrating no effects on acceptability. Textural parameters had limited effects on subsequent consumption. Between‐subjects studies and sensitivity analyses confirmed these results. These findings provide some evidence that textural parameters can increase satiation without affecting acceptability. The development of harder, chunkier, more viscous, voluminous, and/or solid food/beverage products may be of value in reducing overconsumption.
Keywords: food intake, palatability, satiation, satiety, texture
1. INTRODUCTION
Overweight and obesity currently affect a majority of adults and an increasing number of children worldwide, to the detriment of health, well‐being, and optimal functioning.1 Overweight is caused by a period of sustained excess food intake relative to energetic need.2, 3 This sustained positive energy balance suggests that the process of appetite regulation, with increased desire to eat when the body senses a decreased energy supply and reduced appetite when energy is replete, is unable to cope adequately with the modern environment, particularly in those with genetic predispositions favoring weight gain.4, 5 Among many approaches to better understand this, one focus has been to explore the extent to which ingestion suppresses appetite, either by controlling the size of meals (often referred to as satiation) or by inhibiting the desire to eat after consumption. To that end, considerable research has examined the extent to which satiation and subsequent consumption can be influenced by modifying the sensory and physical characteristics of the ingested product, with the intention of promoting the development of newer products that better promote appetite regulation.6, 7, 8, 9
Commonly examined sensory aspects include tastes, olfactory cues, and color, whereas relevant physical characteristics include features such as food form, viscosity, and hardness, and many reviews highlight the impact of these characteristics on concurrent and subsequent food intake.10, 11, 12, 13, 14, 15 However, a key issue faced by studies that try and alter the sensory or physical characteristics of food/beverage products is that these manipulations may also alter their hedonic characteristics. Any consequent change in liking may be problematic for two main reasons. Firstly, overall liking for a product is itself a key driver of food selection and short‐term consumption.3, 14, 16, 17, 18 Repeated studies demonstrate the increased selection and consumption of foods that are reported as liked.3, 14, 16, 17, 18 Because reduced intake of a product is used as a key measure of satiation, if a sensory manipulation results in reduced intake and reduced liking, it is possible that the effect of the manipulation on intake is, in part, mediated by its effect on liking. Likewise, some studies also suggest greater subsequent consumption or a faster return of hunger following the consumption of liked foods compared to those that are less liked.17, 18, 19 Studies on subsequent consumption typically require the intake of a fixed portion of a food product. If the product manipulation results in reduced liking, being required to eat all of a less liked product could modify subsequent appetite not through an effect related to fullness but as a result of the experience of having to consume something less liked.9, 17, 18 In both cases, changes in liking could invalidate any conclusions on the effects of a food characteristic on appetite control. The second issue is the key role of liking in consumer choice.16, 17, 18, 19 Because the aim of studies which try to alter food intake by manipulating the sensory and/or physical characteristics of products is to provide consumers with products that could reduce energy intake, reduced liking for these modified products could undermine any potential consumer benefits by acting as a deterrent to choice.
Consensus on the food characteristics that impact food intake without also impacting product liking would be beneficial for the formulation of more‐satiating food and/or beverage products. In turn, this development would likely facilitate appetite regulation and weight management at the population level, with potential benefits for the prevention and treatment of overweight and obesity.4, 5 Accordingly, this review aimed to establish the sensory and physical characteristics of foods/beverages which increase satiation and/or decrease or delay subsequent consumption, while maintaining acceptability.
2. OVERVIEW
We sought to identify all individual studies in which the sensory or physical properties of a food were manipulated and where an effect on acceptability was assessed. Considerable work already exists on the sensory and physical characteristics that impact satiation and/or subsequent consumption; thus, to guide and focus our approach, we pre‐specified two related research questions:
RQ1. What are the food sensory and physical characteristics which increase satiation and/or decrease/delay subsequent consumption?
RQ2. Which of these food sensory and physical characteristics maintain or have no negative impact on acceptability?
To address RQ1, systematic searches were undertaken to identify review articles that summarized the effects of any food sensory and/or physical characteristic on satiation and/or subsequent consumption. Following the identification of relevant reviews, data on all sensory and/or physical food characteristics were extracted, this evidence was discussed among the research team, and based on this evidence, the team agreed which food characteristics may have the potential to increase satiation and/or decrease/delay subsequent consumption. To address RQ2, all articles investigating the agreed impactful food characteristics were sought. Data were subsequently extracted and analyzed from all independent studies that included a sensory/physical manipulation, a measure of satiation and/or subsequent consumption, and a measure of acceptability.
For both research questions, we defined food sensory and physical characteristics as the sensory or physical aspects of a food irrespective of macronutrient or micronutrient content, that is, taste, flavor, texture. We characterized an impact on satiation as a reduction in meal duration or size; and we characterized a decrease or delay in subsequent consumption as either a relative delay in subsequent consumption, suppression of appetite, or reduced food intake at a subsequent meal. For clarity, we considered subsequent consumption as one aspect of the broader concept of “satiety”. We chose to focus on subsequent consumption to ensure distinction between this and satiation (concurrent consumption) and to allow a focus on behavior. Further, we defined acceptability as any positive response to a food, for example, subjective ratings of liking, palatability, enjoyment, or pleasantness, or behavioral measures of preference, choice, willingness to try, or willingness to buy. For all variables of interest, we focused on relative differences between food characteristics, satiation, subsequent consumption, and acceptability—we did not use standards to describe absolute effects.
2.1. Review registration
The review was registered on PROSPERO (ID: CRD42019119458) prior to commencement. We undertook all work as detailed in the registration, but refinements were made to some of the pre‐specified study inclusion criteria after considering the evidence available. These refinements are detailed below and in the Supporting Information.
3. RQ1: WHAT ARE THE FOOD SENSORY AND PHYSICAL CHARACTERISTCS WHICH INCREASE SATIATION OR DECREASE/DELAY SUBSEQUENT CONSUMPTION?
3.1. Methods
3.1.1. Searches
Systematic searches were undertaken to identify all review articles published in the last 10 years that detailed the effects of any food sensory and/or physical characteristic/s on satiation and/or subsequent consumption. Only review articles were sought given the existing work in this area, and articles published in the last 10 years were considered sufficient to cover all individual studies; that is, recent reviews would cover old as well as new individual studies. Searching for review articles as opposed to independent studies was intended to maximize our use of existing work, while ensuring the search and review task remained manageable.
Three academic databases, Scopus, Web of Science and the Cochrane Library, were searched over 2008–2018 using a search string that combined terms to denote (1) sensory or physical characteristics; (2) satiation or subsequent consumption; and (3) a review. These databases were used to capture articles from the following disciplines: medicine, nutrition, psychology, food science, sensory science, consumer sciences, consumer behavior, and marketing. Full details of the search strings are given in the Supporting Information.
Alongside database searches, reference lists of included articles were also searched for further relevant articles, and we included review articles of which we were aware. Our intention was to consider as many review articles as possible.
3.1.2. Review article inclusion
Review articles were included in the review if they considered one or more clearly defined sensory or physical property/ies of a food; investigated impacts of that/those properties on satiation and/or subsequent consumption using validated measures; offered a review of the literature; included studies conducted in healthy human adults; and were published in the last 10 years in peer‐reviewed journals as full papers. We also included reviews that focused on possible mechanisms by which sensory and physical properties may impact on food intake, for example, reviews on oral processing. We did not search specifically for these reviews, but these may have provided relevant evidence.
Review articles were excluded if they focused entirely on animal studies; focused entirely on studies assessing satiation or subsequent consumption using non‐validated methods, for example, questionnaire measures of food choice, or involved only neural, physical, or hormonal measures of satiation or subsequent consumption without corresponding behavioral outcomes; focused entirely on studies assessing food safety or food (in)security; focused entirely on the microbiological aspects of foods; or focused entirely on children, older individuals (>65 years), patient groups, pregnant women, or individuals with food allergies/intolerances, or appetite or eating disorders.
Review articles were also excluded if they focused entirely on macronutrients, unless specific macronutrients were known to have an impact on the sensory or physical properties of a food. Reviews were included if they focused on specific ingredients where those ingredients were known to impact on sensory or physical characteristics, for example, low‐calorie sweeteners (LCS), spices, or water, but we did not include reviews of ingredients that do not alter sensory or physical characteristics, for example, micronutrients, or that did not provide information on sensory or physical characteristics, for example, LCS versus sugars or LCS that are encapsulated.
3.1.3. Review article selection
Searches were undertaken by one reviewer (KA), search results were downloaded into Endnote, and all search results were screened by two researchers independently (KA, AN) based on title and abstract. Full texts of all potentially relevant reviews were gained and screened for suitability by two researchers independently (KA, AN), and coding agreed. Relevant data from all reviews were subsequently extracted independently and agreed by two reviewers (EAR, KA, JB, KdG, HK, AN, SV, MY). Data extraction was undertaken using a project‐specific data extraction sheet, developed for the project, and trialed by two reviewers (KA, AN) prior to use by all reviewers.
3.1.4. Outcomes from review articles
Data were extracted from each review on the food sensory or physical characteristic/s of the study; the reported effects on satiation and the evidence provided in the review for this/these effect/s; the reported effects on subsequent consumption and the evidence provided in the review for this/these effect/s; and on risk of bias. Risk of bias was assessed using the Measurement Tool to Assess Systematic Reviews (AMSTAR) system for assessing the quality of systematic reviews.20 Many of the reviews identified by our searches were not systematic, but the AMSTAR system was used in preference to no measure. Data were deemed appropriate for extraction based on the inclusion and exclusion criteria for review article inclusion as above, plus some refinements. These refinements are detailed in the Supporting Information. Only published details were extracted—we did not contact review authors.
3.1.5. Data analysis
Extracted data were tabulated by food sensory or physical characteristic, as described within each article. Review articles that provided evidence on several different food characteristics were included for each characteristic. AMSTAR ratings were compiled to provide a score of 11 for each article, where a higher score suggests lower potential bias. The table of extracted data was reviewed and discussed by the research team (EAR, KA, JB, KdG, HK, SV, MY), and the team agreed which sensory and physical properties effect satiation and/or subsequent food consumption based on the extracted evidence. Each sensory and physical characteristic was considered independently, based on the amount and quality of evidence gained from the reviews and on the consistency of effects as reported in that evidence. When discussing the extracted data, preference was given to the data from the review articles scoring ≥9 and secondarily to reviews scoring ≥7 on the AMSTAR system.
3.2. Results
3.2.1. Search results
Database searches were conducted on January 31, 2019. These searches resulted in the detection of 11,597 possible reviews, and a total of 7281 articles remained following deduplication. Of these, 168 full texts were assessed against our study inclusion criteria, and additional identification resulted in the inclusion of a further 18 articles, resulting in inclusion of 186 review articles in total. Of these, 178 review articles were finally included in the first part of our review. The results of all searches are provided in the Preferred Reporting Items for Systematic reviews and Meta‐Analyses (PRISMA) diagram in Figure 1.
FIGURE 1.
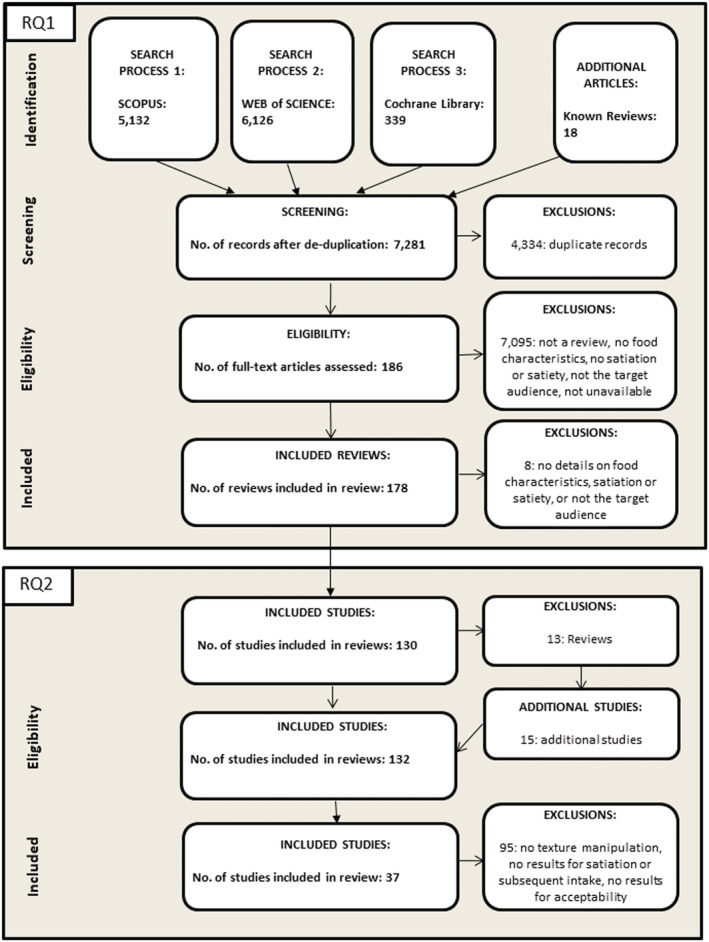
PRISMA diagram
3.2.2. Included review articles
All review articles were obtained and all data extracted and compiled by July 31, 2019. A summary of all considered review articles and extracted data is given in Table 1. Articles ranged from formal systematic reviews with meta‐analyses to commentaries and opinions; the majority were non‐systematic. Articles focused on a single sensory or physical food property, for example, sweet taste, or included a range of sensory or physical food properties, or focused more on the mechanisms by which impacts would be achieved, such as oral processing. Some articles only addressed our research question indirectly. Articles typically considered aspects of satiation and subsequent consumption, and many articles did not distinguish between these aspects of food intake. Some evidence was poorly described in individual review articles, but consensus was possible when articles were considered with others on the same sensory/physical food characteristic. Three articles received a total of nine or over using the AMSTAR system for rating systematic reviews, and an additional 12 articles received a total of seven or over. All other articles received a total rating lower than 7 out of 11.
TABLE 1.
Summary of the evidence provided on each food sensory or physical property as gained from the review articles
| Sensory or physical food characteristica | Number of review articles providing evidenceb , c | Impacts on satiation and subsequent food intake (SFI) | Evidence providedd |
|---|---|---|---|
| Sensory variety | 13 reviews | Greater variety decreases satiation and increases SFI, inconsistent effects on sensory specific satiety | Several reviews, several individual studies |
| Taste/flavor intensity | 9 reviews | Limited inconsistent impacts on satiation | Limited individual studies |
| Sweet taste | 15 reviews, of which 1 received a 9+ AMSTAR score and 2 received a 7+ AMSTAR score | No effects or inconsistent effects on satiation and SFI | Several systematic reviews, with large numbers of studies and/or meta‐analyses, several individual studies |
| Fat taste | 2 reviews | Fat taste may increase satiation and reduce SFI | Limited individual references |
| Salt taste | 3 reviews | Salt taste may increase satiation and reduce SFI | Limited individual references |
| Umami taste | 2 reviews | Inconsistent effects on satiation and SFI | Limited individual references |
| Specific tastes (ginger, chili, cinnamon) | 8 reviews, of which 2 received a 7+ AMSTAR score | Specific tastes may increase satiation and reduce SFI | Limited individual references |
| Aroma | 4 reviews | No effects on satiation or SFI | Limited individual references |
| Color | 3 reviews | Inconsistent effects on satiation | Limited individual references |
| Shape | 2 reviews | Inconsistent effects on satiation | Limited individual references |
| Volume, aeration and added water | 13 reviews, of which 2 received a 7+ AMSTAR score | Greater volume, aeration and water results in increased satiation and reduced SFI | Some reviews, one with meta‐analyses, limited individual studies |
| Food form (solid vs. semi‐solid vs. liquid) | 41 reviews, of which 1 received a 9+ AMSTAR score, and 3 received a 7+ AMSTAR score | Greater solidity/less fluidity results in increased satiation and reduced SFI | Many reviews, some systematic, with large numbers of studies and/or meta‐analyses, many individual studies |
| Texture (non‐specific or varied) | 31 reviews, of which 3 received a 7+ AMSTAR score | Greater texture results in increased satiation and reduced SFI | Limited narrative reviews, several individual studies |
| Fibers | 18 reviews, of which 1 received a 9+ AMSTAR score, and 3 received a 7+ AMSTAR score | Different fibers may increase or decrease satiation and SFI | Several reviews, some systematic, many individual studies |
| Proteins | 19 reviews, of which 1 received a 7+ AMSTAR score | Different proteins may increase or decrease satiation and SFI | Several individual studies |
| Oral processing | 7 reviews, of which 1 received a 7+ AMSTAR score | Greater oral processing increases satiation and SFI | Some reviews with meta‐analyses, several individual studies |
Abbreviation: SFI, subsequent food intake.
At this stage, food characteristics were classified using reviewers classifications or classifications from the reviews themselves; thus, there is likely to be some overlap.
Number of review articles includes total number of review articles, including number of review articles given a score of 9+ from the AMSTAR ratings, and number of review articles given a score of 7+ from the AMSTAR ratings.21 There is again likely to be some overlap between food characteristics.
Some reviews provided evidence on several food characteristics; thus, the apparent number of review articles is more than the actual number considered.
At this stage, we did not investigate the evidence provided; thus, some evidence is likely to be repeated in different reviews.
3.2.3. Findings
Of the range of sensory and physical food characteristics studied, the extracted data provided good evidence that physical form can increase satiation and delay subsequent consumption, and some evidence that: sensory variety can decrease satiation and increase subsequent intake; sweet taste has no or inconsistent effects on satiation and subsequent intake; texture (non‐specific or varied), added air, water or volume, and greater oral exposure can increase satiation and delay subsequent consumption; and that different fibers and different proteins have different effects on satiation and subsequent consumption. Thus, to answer RQ1: physical form, texture (non‐specific or varied), added air, water or volume, and some fibers and proteins can increase satiation and/or delay subsequent consumption. Considering our focus on product formulation without altering food composition, for RQ2, we choose to look further at all studies investigating food form, texture (non‐specific or varied), and/or added air or water. These food characteristics can all be described as textural parameters.
4. RQ2: WHICH OF THESE FOOD SENSORY AND PHYSICAL CHARACTERISTICS MAINTAIN (HAVE NO NEGATIVE IMPACT ON) ACCEPTABILITY?
4.1. Methods
4.1.1. Searches
All reviews that were described as investigating textural parameters for RQ1, were subsequently used to identify relevant individual studies. Reviews described as focussing on other sensory or physical food characteristics were not screened further. This included the reviews that focused on the effects of fibers and proteins.21, 22 All individual articles providing evidence on the impacts of textural parameters on satiation and subsequent consumption were obtained, and subsequently screened for relevance to address RQ2.
4.1.2. Study inclusion
Studies were considered suitable for inclusion at this stage if they: considered one or more clearly defined sensory or physical property/ies of a food; included a clearly defined manipulation of the sensory or physical property/ies; investigated impacts of that/those properties, and reported results on satiation and/or subsequent consumption using validated behavioral measures, such as test meal intake; included results for acceptability; used an experimental design (within or between groups); included a comparator; were conducted in human adults aged 18–65 years, with no clinical diagnosis (i.e., not patient groups), not pregnant, no food allergies/intolerances, appetite or eating disorders; and were reported in a peer‐reviewed paper published in English.
Only comparisons where the sensory or physical manipulation was the clear dominant manipulation, and where product reformulation may be possible were included, for example, if product ingredients and macronutrient content also differed this was not considered, for example, when comparing a dairy yoghurt and a syrup drink; or if the comparison was between a solid food and a liquid beverage. Impacts on food intake of solid versus liquid food/beverage items are well known;10, 12, 13, 14 therefore, only studies investigating effects of physical form where reformulation may be possible were considered, for example, where a solid candy was reformulated as a semi‐solid jelly, or a solid food was reformulated as a semi‐solid soup. Studies on macronutrients or behaviors such as eating rate were included only if a sensory or physical difference between conditions was clearly reported. Studies were included regardless of the direction of manipulation; that is, studies were included regardless of whether the usual formulation was compared with formulations with stronger or weaker textural parameters. Many studies included several comparisons, for example, semi‐solid versus semi‐liquid versus liquid. In this case all relevant comparisons were considered, but only aspects of a study relevant to the sensory or physical manipulation were included, for example, if a study investigated impacts of viscosity and portion size, only the parts of the study relevant to the viscosity manipulation were considered.
Only studies that reported results from a behavioral measure of satiation and/or subsequent intake were included; to limit the work to studies that addressed energy intake, we excluded studies that only reported appetite ratings. If intake outcomes were assessed at several time points, data for the actual meal (satiation), the first meal after a preload, and total intake over the period were considered. If acceptability outcomes were measured at several time points, priority was given to measures taken after the first taste, as a measure unaffected by subsequent potential impacts of consumption and as the most common measure used, but measures taken after consumption of a full portion were also considered. Measures of acceptability that may be affected by consumption itself, for example, fullness and nausea, were not considered. Measures were also not considered if it was unclear that they reflected a hedonic feature of a food, for example, measures of taste intensity. Studies that only measured acceptability as part of the study inclusion criteria or only in other participants, for example, as part of a pilot study, were not included. Studies that aimed to ensure comparability between manipulations in acceptability, and then subsequently checked this, were included. Studies were included regardless of study duration, regardless of their incorporation of a food characteristic in a simple or complex food, and regardless of number of exposures to the target foods/beverages.
Some evidence in the review articles came from other reviews. These were checked for suitability for inclusion in the first part of the work and included there if appropriate, otherwise these reviews were discarded. Some additional studies were also added if we were aware of these, and they had not been already identified. Again, our intention was to identify as many studies as possible that may address our research question.
4.1.3. Study selection
All evidence was reviewed by two reviewers independently (EAR, KA, JB, LG, AN, SV, MY) and first classified as a review article or individual study. Data were then extracted from each study, including details of the sensory or physical manipulation, measures and results for satiation and/or subsequent intake, measures and results for acceptability, and risk of bias. Risk of bias was assessed using several domains, based on those recommended by the Cochrane collaboration23 and using specific criteria for assessing key aspects of potential bias in studies using within‐subjects designs. These domains were: relevant analysis is the primary research question; comparability between target condition and control; participant awareness of study purpose; (for within‐subjects designs) consideration of order effects; (for within‐subjects designs) consideration for carryover effects; discrepancy between number of participants that entered the study and number that are included in analyses (the equivalent of Intention‐to‐Treat [ITT] analysis); discrepancy between number of participants that enter the study and number that complete the study (dropout); and measures relevant to the review included in the method section, but for which results were not reported (incomplete outcome reporting). These domains were selected as aspects of studies that were likely to be relevant and likely to have been reported. For each domain, risk of bias was judged as “low”, “high”, or “unclear”, based on published information. The criteria for each judgment are given in the Supporting Information. Studies were included in the review regardless of risk of bias. All data were extracted by two reviewers independently (EAR, KA, JB, LG, AN, SV, MY), using a project‐specific data extraction sheet, piloted prior to use by all reviewers. Discordances were resolved within each reviewer pair.
4.1.4. Data analysis
Extracted data were tabulated by food sensory or physical characteristic in relation to satiation and/or subsequent consumption, to detail methodology, findings, and risk of bias. Data were collected at the group level as published (we did not collect individual‐level data). Satiation, subsequent consumption and acceptability data were also subsequently combined using meta‐analyses, where possible. Where manipulations involved several characteristics, for example, increased thickness and added particles, the manipulation was classified based on the most dominant characteristic as published.
For the meta‐analyses, unadjusted mean and standard deviation data (converted from standard error data where necessary) were corrected to ensure comparable direction in all measures, and analyzed as standardized mean difference (SMD) with 95% confidence intervals (CIs), using Hedge's adjusted g to allow a correction for small sample sizes. Estimates were made using random‐effects models primarily to allow for heterogeneity between studies.24, 25 Fixed effects models were also applied as sensitivity analyses. Analyses included only studies using a within‐subjects design due to the greater number of these studies, and included an adjustment for the reduced within‐study variance in studies using a within‐subjects design, assuming a correlation between conditions of r = 0.7.26 Effects of the different sensory or physical manipulations were investigated using subgroup analyses, and compared using chi‐square tests. Analyses were conducted on individual comparisons using ITT data (based on number of participants at study entry) where these data were provided. Where alternative data were provided, all aspects of these data (N, means, standard deviations) were used for analyses as published. Where studies included multiple conditions, for example, solid versus semi‐solid versus liquid, each condition was treated as an independent comparison. Studies were also divided into individual comparisons based on systematic differences between two versions of the preload (not relevant to the manipulation/s of interest), for example, high versus low energy; if several different foods were assessed separately in the same study; and/or if assessments were made at several time points, for example, at the start and end of a repeated exposure study. Where studies were divided into more than one comparison, numbers of participants were divided across the number of comparisons. Where studies provided suitable data both before and after a repeated exposure phase, only the data from before the exposure phase were included in analyses, as a result of the number of studies available. Missing standard deviation data for one study were imputed using standard deviation data from other studies using the same outcome measure.27 Heterogeneity between studies was investigated using Higgins' I‐squared statistic.28, 29 Possible sources of heterogeneity were identified a priori, to include publication bias and risk of bias. Publication bias was investigated using funnel plot asymmetry.30 Effects of risk of bias were investigated using sensitivity analyses which included only the studies considered at low risk of bias for good comparability between the target and control conditions and for the use of ITT analyses. Exploratory subgroup analyses investigating the differing effects of texture on satiation based on differences in acceptability between the two textural manipulations were also conducted. To carry out these analyses, studies were divided by a median split based on difference in acceptability after first taste between the two textural manipulations, and analyzed for effects of texture on satiation in the two subgroups—high versus low differences in acceptability between textural manipulations. Analyses were undertaken in Stata, version 16.0 (StataCorp LLC, Texas, USA).
4.2. Results
Data collection for RQ2 ceased on September 4, 2020. A total of 130 articles from the review evidence of RQ1 provided evidence on the effects on satiation and/or subsequent consumption, of various textural parameters. Thirteen of these articles were review articles, six of which offered nine individual studies in addition to those already included. A further six studies were also added at this stage as a result of personal awareness. Of the total 132 individual studies, 37 were found to fit our inclusion criteria. Results of the search process are included in Figure 1.
Textural parameters investigated were aeration, homogeneity (a result of the presence of chunky versus smooth textures), hardness (hard versus soft food textures), lubricity (wet versus dry food textures), viscosity (thin versus thick textures), physical form (the physical state of the food as a solid, semi‐soli, or liquid), and added water. An overview of the individual studies31, 32, 33, 34, 35, 36, 37, 38, 39, 40, 41, 42, 43, 44, 45, 46, 47, 48, 49, 50, 51, 52, 53, 54, 55, 56, 57, 58, 59, 60, 61, 62, 63, 64, 65, 66, 67 included in the review is given in Table 2. Full details of the individual studies are in the Supporting Information.
TABLE 2.
Overview of the studies included in the review, including reference, textural parameter/s manipulated, and measurement of concurrent (satiation) and/or subsequent consumption
| Reference | Textural parameter investigated | Measure of satiationa , b | Measure of subsequent consumptionc , d | Measure of acceptabilitye |
|---|---|---|---|---|
| Osterholt et al.56 | Aeration | Amount | Ratings | |
| Rolls et al.59 | Aeration | Amount | Ratings | |
| Flood and Rolls36 | Chunky versus smooth | Amount | Ratings | |
| Forde et al.38 | Chunky versus smooth | Amount | Ratings | |
| Laboure et al.47 | Chunky versus smooth | Amount, time | Ratings | |
| Pritchard et al.57 | Chunky versus smooth | Amount | Amount, time | Ratings |
| Tsuchiya et al.62 | Chunky versus smooth | Amount | Ratings | |
| Bolhuis et al.33 | Hard versus soft | Amount | Amount | Ratings |
| Lasschuijt et al.48 | Hard versus soft | Amount | Ratings | |
| Zijlstra et al.67 | Hard versus soft | Amount | Ratings | |
| Krop et al.46 | Hard versus soft (and wet vs. dry) | Amount | Ratings | |
| Almiron‐Roig et al.31 | Thick versus thin | Amount | Ratings | |
| Bertenshaw et al.32 | Thick versus thin | Amount | Ratings | |
| Camps et al.34 | Thick versus thin | Amount | Ratings | |
| Hovard et al.42 | Thick versus thin | Amount | Ratings | |
| Jensen et al.43 | Thick versus thin | Amount | Ratings | |
| Jensen et al.44 | Thick versus thin | Amount | Ratings | |
| Juvonen et al.45 | Thick versus thin | Amount | Ratings | |
| Lett et al.50 | Thick versus thin | Amount | Ratings | |
| Mattes and Rothacker53 | Thick versus thin | Amount, time | Ratings | |
| McCrickerd et al.54 | Thick versus thin | Amount | Amount | Ratings |
| Mosca et al.55 | Thick versus thin | Amount, time | Ratings | |
| Yeomans and Chambers63 | Thick versus thin | Amount | Ratings | |
| Yeomans et al.64 | Thick versus thin | Amount | Ratings | |
| De Wijk et al.35 | Semi‐solid versus liquid | Amount | Ratings | |
| Flood‐Obbagy and Rolls37 | Solid versus semi‐solid, semi‐solid versus liquid | Amount | Ratings | |
| Gadah et al.39 | Solid versus semi‐solid, semi‐solid versus liquid | Amount | Ratings | |
| Hogenkamp et al.40 | Semi‐solid versus liquid | Amount | Ratings | |
| Hogenkamp et al.41 | Semi‐solid versus liquid | Amount | Amount | Ratings |
| Lavin et al.49 | Solid versus semi‐solid, semi‐solid versus liquid | Amount | Ratings | |
| Mars et al.51 | Semi‐solid versus liquid | Amount | Amount | Ratings |
| Mattes52 | Solid versus semi‐solid | Amount | Ratings | |
| Rolls et al.58 | Solid versus semi‐solid | Amount | Ratings | |
| Tournier and Louis‐Sylvestre61 | Solid versus semi‐solid | Amount | Ratings | |
| Zijlstra et al.65 | Semi‐solid versus liquid | Amount | Ratings | |
| Zijlstra et al.66 | Semi‐solid versus liquid | Amount | Ratings | |
| Rolls et al.60 | Water added | Amount | Ratings |
Amount: amount of the food/beverage consumed;
Time: time to consume meal;
Amount: amount consumed in a subsequent snack/meal;
Time: time to next meal;
Ratings of liking, palatability, pleasantness or hedonics.
4.3. Effects of textural parameters on satiation
4.3.1. Included studies
Thirteen studies undertook manipulations of textural parameters and could contribute results on satiation and acceptability.33, 35, 38, 40, 41, 48, 51, 54, 55, 56, 57, 65, 67 Details of these studies are provided in Supporting Information Table S1. Two studies used between‐subjects designs,38, 51 and two studies involved only 9 or 10 participants,35 but all other studies involved 33–132 participants. Studies used a range of test foods and beverages to provide 27 different comparisons—1 investigating effects of aeration, 7 investigating effects of hard versus soft textures, 4 investigating effects of chucky versus smooth textures, 6 investigating effects of thick versus thin viscosities, and 9 comparisons investigating effects of physical form—either semi‐solid versus liquid (N = 7), semi‐solid versus semi‐liquid (N = 1) or semi‐liquid versus liquid (N = 1). The test foods used were complex meals (beef, vegetable and potato meal, potato‐topped beef pie), complex meal components (hamburgers, rice salad), simple meal components (luncheon meat, meat replacers, porridge), snack items (extruded corn snacks, candy, dairy products) and some “model foods” specifically constructed for testing purposes. The majority of manipulations were conducted on commercially available food/beverage products that were modified to increase or decrease the textural parameters for comparisons. In all studies, food/beverage intake was assessed at the time of consumption as necessitated for a test of satiation. Intake was measured as weight consumed in all comparisons and as energy consumed in 13 comparisons. One study provided data on time taken to finish consuming a food product as a measure of satiation.55 Acceptability was assessed using measures of pleasantness (N = 12), liking (N = 11), and palatability (N = 2) (as detailed by the authors in the text on the measures provided), and was assessed at first taste for all comparisons, and also after consumption of a full food/beverage item for seven comparisons. No other measures of acceptability were found.
Details of risk of bias for each study are provided in Supporting Information Table S2. All studies investigated effects of texture on satiation as a primary research question, and the majority of studies were judged to be at low risk of bias on participant awareness, consideration of order effects and carryover effects in within‐subjects designs, dropout, and incomplete outcome reporting. Eight studies (17 comparisons) were judged to be at high risk of bias due to possible differences between intervention and comparator aside from the texture manipulation,33, 38, 41, 51, 54, 56, 57, 67 and seven studies (16 comparisons) were judged to be at high risk of bias due to failure to conduct ITT analyses.
4.3.2. Findings
Meta‐analyses were conducted to investigate effects of the textural parameters firstly on satiation, and secondly on acceptability. Analyses for satiation included all 19 within‐subjects comparisons that provided unadjusted data on weight consumed, and the six within‐subjects comparisons that provided unadjusted data on energy consumed. These analyses demonstrated lower weight consumed (SMD = −0.31 [95%CI −0.52, −0.11], 19 comparisons, 586 participants, I2 = 0%) and lower energy consumed (borderline significance) (SMD = −0.30 [95%CI −0.63, 0.03], 6 comparisons, 219 participants, I2 = 0%) for foods/beverages that were harder, chunkier, thicker and more solid. There were no differences between subgroups (weight consumed: χ2(4) = 4.62, p = 0.33; energy consumed: χ2(3) = 3.07, p = 0.38); thus, no differences were found between the different types of textural manipulation. Similar results were also found in analyses of weight consumed if one comparison (de Wijk et al.,35 Study 2) was removed (SMD = −0.32 [95%CI −0.53, −0.12], 18 comparisons, 576 participants, I2 = 0%). This study was conducted where oral exposure time to both foods was controlled, and oral exposure is the likely mechanism through which texture may impact on satiation. Effect sizes are comparable in weight and energy consumed, but effects are more convincing for weight consumed, where CIs are narrower and further from 0. Effect sizes (SMD) of 0.31–0.32 represent a reduction in weight consumed of approximately 50 g, and an effect size (SMD) of 0.30 represents a reduction in energy consumed of approximately 285 kJ or 68 kcal. Forest plots for the analyses investigating the effects of all textural manipulations on satiation as measured using weight consumed and energy intake are given in Figures 2 and 3, respectively.
FIGURE 2.

Forest plot for the analysis of all within‐subjects comparisons investigating the effects of texture on satiation (weight consumed) using a random‐effects model. Contributing comparisons are represented by a filled square with horizontal lines, where the area of the square depicts the contribution of the study to the full analysis, and the horizontal lines demonstrate the 95%CIs for each study. Studies depicted to the left of a 0 line demonstrate a finding in favor of greater texture (more aeration, chunky, hard, semi‐solid, thick), whereas those to the right demonstrate a finding in favor of lesser texture (less aeration, smooth, soft, liquid, thin, respectively). The diamond at the base of the plot represents the combined effect (standardized mean difference) with 95%CIs
FIGURE 3.
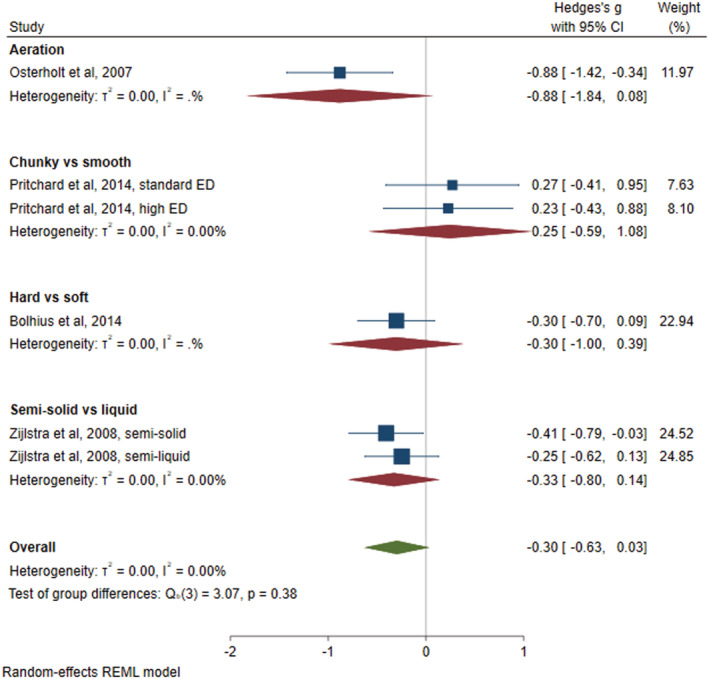
Forest plot for the analysis of all within‐subjects comparisons investigating the effects of texture on satiation (energy consumed) using a random‐effects model. Contributing comparisons are represented by a filled square with horizontal lines, where the area of the square depicts the contribution of the study to the full analysis, and the horizontal lines demonstrate the 95%CIs for each study. Studies depicted to the left of a 0 line demonstrate a finding in favor of greater texture (more aeration, chunky, hard, semi‐solid), whereas those to the right demonstrate a finding in favor of lesser texture (less aeration, smooth, soft, liquid, respectively). The diamond at the base of the plot represents the combined effect (standardized mean difference) with 95%CIs
Analyses for acceptability included all 17 within‐subjects comparisons that provided data on acceptability at first taste, and the seven comparisons that provided data on acceptability after consumption of a full food/beverage item. These analyses demonstrated no effects of texture on acceptability after first taste (SMD = −0.07 [95%CI −0.28, 0.14], 17 comparisons, 559 participants, I2 = 0%) or after complete consumption (SMD = −0.12 [95%CI −0.45, 0.22], 7 comparisons, 209 participants, I2 = 0%). There were no differences between subgroups (acceptability on first taste: χ2(4) = 4.64, p = 0.33; acceptability on complete consumption: χ2(3) = 4.72, p = 0.19). An effect size (SMD) of 0.07 equates to a difference in acceptability after first taste on a 100 mm scale of 1.4 mm. The Forest plot for the analysis investigating the effects of all textural manipulations on acceptability in studies measuring satiation is given in Figure 4. Exploratory subgroup analyses also revealed no differences in the effects of texture on satiation in subgroups based on differences in acceptability after first taste between the textural manipulations (weight consumed: χ2(1) = 2.09, p = 0.15 (eight vs. seven comparisons); energy consumed χ2(1) = 0.07, p = 0.79 [four vs. three comparisons]).
FIGURE 4.
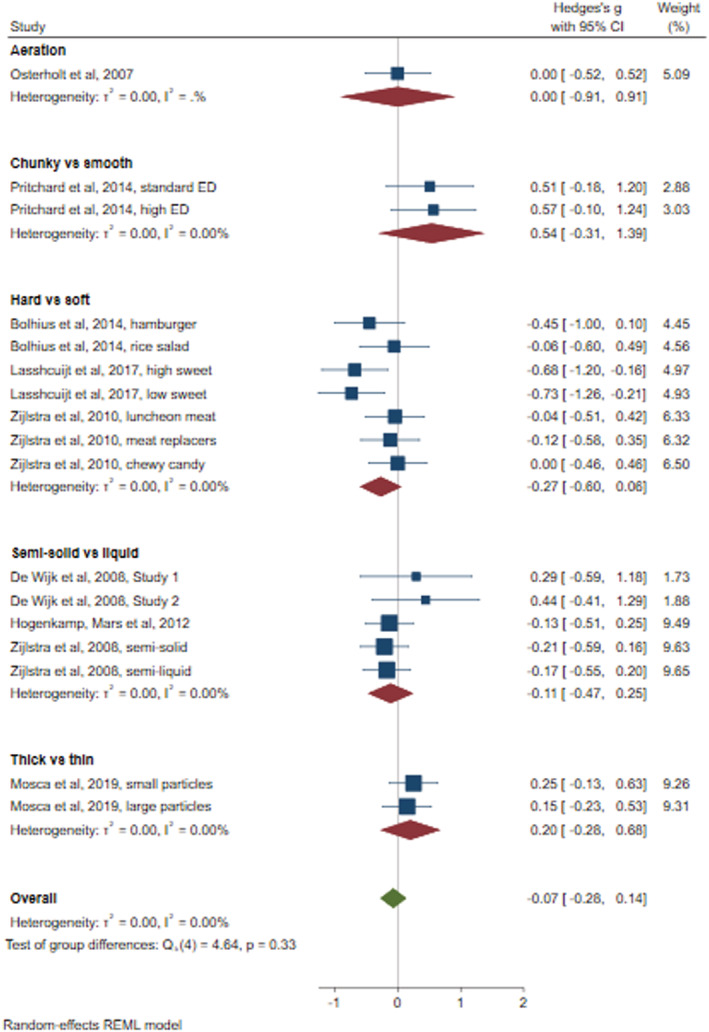
Forest plot for the analysis of all within‐subjects comparisons investigating the effects of texture on acceptability at first taste in the studies assessing satiation using a random‐effects model. Contributing comparisons are represented by a filled square with horizontal lines, where the area of the square depicts the contribution of the study to the full analysis, and the horizontal lines demonstrate the 95%CIs for each study. Studies depicted to the left of a 0 line demonstrate a finding in favor of greater texture (more aeration, chunky, hard, semi‐solid, thick), whereas those to the right demonstrate a finding in favor of lesser texture (less aeration, smooth, soft, liquid, thin, respectively). The diamond at the base of the plot represents the combined effect (standardized mean difference) with 95%CIs
Similar effects were found using fixed‐effect models, and findings from the studies using between‐subjects designs also suggest lower weight and energy consumed from foods/beverages that were harder, chunkier, thicker and more solid, with limited effects on acceptability. The one study using a within‐subjects design that only reported mean data that were adjusted for acceptability also found lower weight and energy consumed from thicker foods.54 Similar effects were also found in the measures taken after an exposure period in studies involving repeated exposure. Funnel plots revealed limited evidence of publication bias. Studies that were judged low for risk of bias based on intervention/comparator comparability and the use of ITT analyses also suggested similar effects, although the number of contributing studies was low. Results from the sensitivity analyses and funnel plots are presented in the Supporting Information.
4.4. Effects of textural parameters on subsequent consumption
4.4.1. Included studies
Twenty‐nine studies undertook textural manipulations and could contribute results on subsequent test food intake and acceptability.31, 32, 33, 34, 36, 37, 39, 41, 42, 43, 44, 45, 46, 47, 49, 50, 51, 52, 53, 54, 57, 58, 59, 60, 61, 62, 63, 64, 66 Details of these studies are provided in Supporting Information Table S3. Five of these studies contributed effects on satiation, but aspects relevant to subsequent consumption are also provided here. Four studies used between‐subjects designs.39, 46, 51, 64 Studies ranged in size from eight to 84 participants, and used a range of test foods and beverages to provide 54 different texture‐based comparisons—2 investigating effects of aeration, 3 investigating effects of hard versus soft textures, 11 investigating effects of chunky versus smooth textures, 17 investigating effects of thick versus thin viscosities, 10 investigating effects of solid versus semi‐solid physical form, 9 investigating effects of semi‐solid versus liquid physical form, and 2 comparisons investigating the effects of adding water to a milkshake. Lubricity (wet versus dry food textures) was also studied secondary to hardness in two comparisons.46 The test foods used were complex meals (beef, vegetable and potato meal, potato‐topped beef pie, chicken casseroles and soups, vegetable broths and soups), complex meal components (hamburgers, rice salad), simple meal components (porridge), snack items (fruit, candy, dairy products, milkshakes) and some model foods/beverages specifically constructed for testing purposes. The majority of manipulations were conducted on commercially available food/beverage products that were modified to increase or decrease the textural parameters for comparisons. In all studies, the texture manipulation was given as a preload and intake was assessed at a subsequent test meal from immediately after the preload41 to a meal 5 h later.33, 47 In most cases, the test meal was provided in a controlled setting, but in 12 comparisons some food intake was undertaken in a free‐living situation and self‐recorded. In 13 comparisons, intake data for more than the first meal following the preload were added to provide cumulative intake. Intake was measured as energy consumed in all but two46 comparisons and as weight consumed in 29 comparisons. Three studies provided data on time taken to next meal as a measure of delay to subsequent consumption.47, 53, 57 Acceptability was assessed using ratings of pleasantness (N = 33), liking (N = 12), palatability (N = 8), and a hedonic scale (N = 1) (as detailed in the text of each methods section) and was assessed at first taste for 35 comparisons, and after consumption of a full preload for 24 comparisons. No other measure of acceptability was reported.
Details of risk of bias are provided in Supporting Information Table S4. All studies investigated effects of texture on subsequent consumption as a primary research question, and the majority were judged to be at low or unclear risk of bias on participant awareness, consideration of order effects and carryover effects in within‐subjects designs, dropout, and incomplete outcome reporting. Seventeen studies (34 comparisons) were judged to be at high risk of bias due to possible differences between intervention and comparator asides from the textural manipulation,31, 32, 33, 36, 37, 39, 42, 46, 47, 49, 51, 53, 54, 57, 59, 60, 66 and 15 studies (31 comparisons) were judged to be at high risk of bias due to failure to conduct ITT analyses.
4.4.2. Findings
Meta‐analyses were conducted to investigate effects of all textural parameters firstly on subsequent consumption, and secondly on acceptability. Analyses for subsequent consumption included all 35 within‐subjects comparisons that provided data on energy consumed and the 16 within‐subjects comparisons that provided data on weight consumed at the first meal after a preload, and on the 10 comparisons and 6 comparisons, respectively, that combined these assessments with data from additional time points. These analyses demonstrate limited differences in energy consumed (borderline significance) (SMD = −0.18 [95%CI −0.37, 0.00], 35 comparisons, 691 participants, I2 = 0%) and no differences in weight consumed (SMD = −0.13 [95%CI −0.38, 0.13], 16 comparisons, 364 participants, I2 = 0%) at the first meal after a preload involving any texture manipulation. There were no differences between subgroups (energy consumed: χ2(6) = 4.34, p = 0.63; weight consumed: χ2(6) = 0.81, p = 0.99); thus, no differences were found between the different types of textural manipulation. No effects were found where studies also included further measures of energy intake (SMD = 0.03 (95%CI −0.37, 0.30), 10 comparisons, 209 participants, I2 = 0%, χ2(4) for subgroups = 0.82, p = 0.94) or further measures of weight consumed (SMD = 0.00 (95%CI −0.59, 0.59), 6 comparisons, 72 participants, I2 = 0%, χ2(2) for subgroups = 0.37, p = 0.83). No effects were also found in analyses of the first meal if studies allowing ad libitum consumption of the preload33, 57 were excluded (energy intake: SMD = −0.14 (95%CI −0.34, 0.07), 32 comparisons, 606 participants, I2 = 0%, χ2(5) for subgroups = 0.97, p = 0.97; weight consumed: SMD = 0.11 (95%CI −0.39, 0.17), 15 comparisons, 314 participants, I2 = 0%, χ2(5) for subgroups = 0.60, p = 0.99).
Stronger effects in energy consumed at the first meal after a preload were found if three comparisons were removed that compared a solid food that was “eaten with a knife and fork”/“from a … bowl” with a semi‐solid soup that was “drunk from a bowl”/“served in a … cup”.58, 61 In these analyses, foods/beverages that were harder, chunkier, thicker and more solid resulted in less energy consumed (borderline significance) (SMD = −0.21 [95%CI −0.41, −0.02], 32 comparisons, 654 participants, I2 = 0%), but no differences were found in weight consumed (SMD = −0.15 [95%CI −0.41, 0.11], 14 comparisons, 340 participants, I2 = 0%); there were no differences between subgroups (energy consumed: χ2(6) = 3.73, p = 0.71; weight consumed: χ2(6) = 0.79, p = 0.99); and no effects were found in further measures of energy intake (SMD = −0.08 (95%CI −0.44, 0.27), 8 comparisons, 185 participants, I2 = 0%, χ2(3) for subgroups = 0.15, p = 0.99) or weight consumed (SMD = 0.11 (95%CI −0.28, 0.50), 4 comparisons, 48 participants, I2 = 0%, χ2(1) for subgroups = 0.30, p = 0.59). Initial effect sizes (SMD) represent a reduction in intake of approximately 229 kJ (55 kcal) and approximately 25 g food weight. Forest plots for the analyses investigating the effects of the textural manipulations on subsequent consumption as measured using energy intake and weight consumed are given in Figures 5 and 6, respectively.
FIGURE 5.
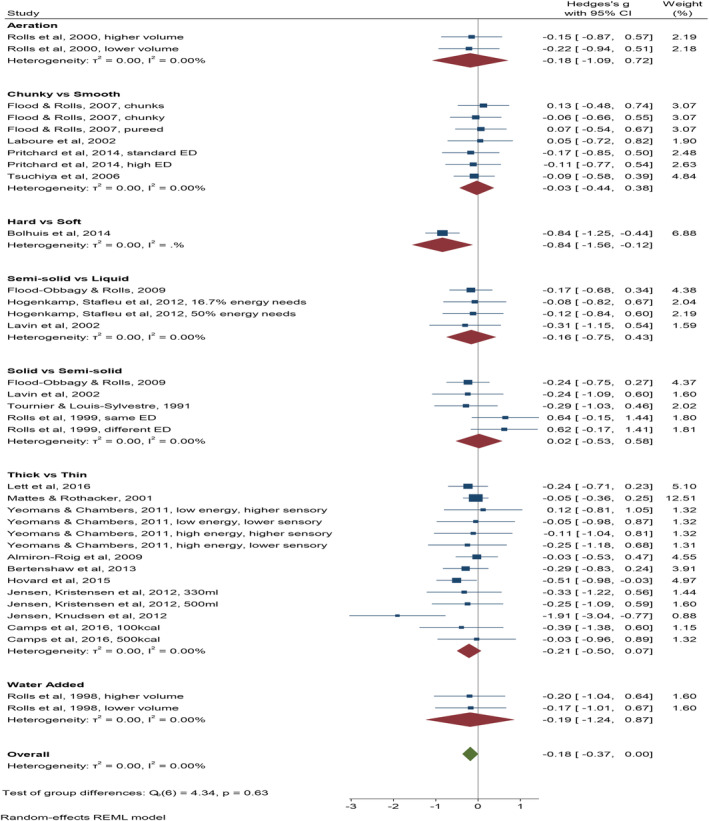
Forest plot for the analysis of all within‐subjects comparisons investigating the effects of texture on subsequent consumption (energy consumed) using a random‐effects model. Studies depicted to the left of a 0 line demonstrate a finding in favor of greater texture (more aeration, chunky, hard, semi‐solid, solid, thick, more water), whereas those to the right demonstrate a finding in favor of lesser texture (less aeration, smooth, soft, liquid, semi‐solid, thin, less water, respectively)
FIGURE 6.

Forest plot for the analysis of all within‐subjects comparisons investigating the effects of texture on subsequent consumption (weight consumed) using a random‐effects model. Studies depicted to the left of a 0 line demonstrate a finding in favor of greater texture (more aeration, chunky, hard, semi‐solid, solid, thick, more water), whereas those to the right demonstrate a finding in favor of lesser texture (less aeration, smooth, soft, liquid, semi‐solid, thin, less water, respectively)
Analyses for acceptability included all 25 within‐subjects comparisons that provided data on acceptability at first taste, and the 12 comparisons that provided data on acceptability after consumption of a full food/beverage item. These analyses demonstrate overall no effects of texture on acceptability after first taste (SMD = −0.02 [95%CI −0.25, 0.21], 25 comparisons, 446 participants, I2 = 0%) or after complete consumption (SMD = −0.04 (95%CI −0.26, 0.34, 12 comparisons, 264 participants, I2 = 0%). No differences were found between subgroups in either analysis (acceptability at first taste: χ2(6) = 3.63, p = 0.73; acceptability post consumption χ2(4) = 2.82, p = 0.59). An effect size (SMD) of 0.02 equates to a difference in acceptability on a 100 mm scale of 0.4 mm. The Forest plot for the analysis investigating the effects of the textural manipulations on acceptability in the studies investigating subsequent consumption is given in Figure 7.
FIGURE 7.
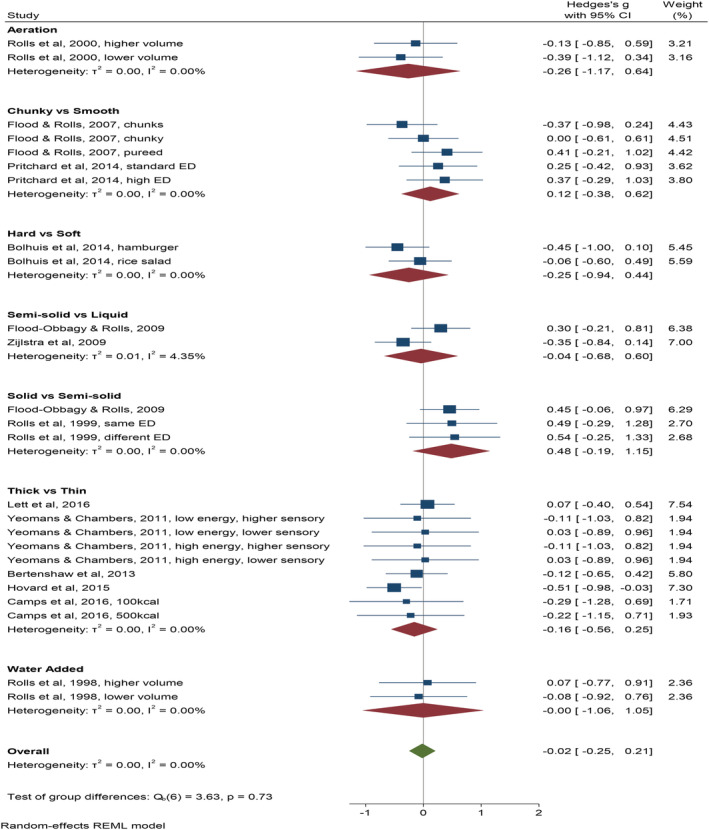
Forest plot for the analysis of all within‐subjects comparisons investigating the effects of texture on acceptability at first taste in the studies assessing subsequent consumption using a random‐effects model. Studies depicted to the left of a 0 line demonstrate a finding in favor of greater texture (more aeration, chunky, hard, semi‐solid, solid, thick, more water), whereas those to the right demonstrate a finding in favor of lesser texture (less aeration, smooth, soft, liquid, semi‐solid, thin, less water, respectively)
No effects were also found using fixed‐effect models and from the studies using between‐subjects designs. Similar effects were also found in the measures taken after an exposure period in relevant studies. Funnel plots revealed limited evidence of publication bias. Studies that were judged low for risk of bias based on intervention/comparator comparability and the use of ITT analyses also suggested similar effects, although the number of contributing studies was low. Results from the sensitivity analyses and funnel plots are presented in the Supporting Information.
5. DISCUSSION
5.1. Findings of the review
This work was undertaken to investigate the sensory and physical characteristics that increase satiation and/or decrease/delay subsequent consumption, while maintaining acceptability. Systematic searches for articles that reviewed the existing literature on the effects of these food characteristics on food intake yielded 178 recently published articles, and from these 37 independent studies investigating the effects of food texture on satiation and/or subsequent consumption while also assessing acceptability were identified.
Although the number of review articles found was high, few of these were systematic, and several addressed our research question only indirectly. Some evidence was poorly described in individual review articles, but taking all relevant review articles together, there were consistent conclusions across reviews suggesting that various textural parameters may increase satiation or decrease/delay subsequent consumption. Thirty‐seven independent studies investigated these effects while also assessing acceptability—13 studies (27 comparisons, 898 participants) that investigated effects on satiation, and 29 studies (54 comparisons, 916 participants) that investigated effects on subsequent intake.
All individual studies were designed to investigate the effects of textural parameters on food intake and included at least one deliberate assessment of acceptability; thus, all studies contributed directly to our research question. Studies included a range of textural manipulations, in a range of food/beverage products, and assessed effects using a variety of food intake scenarios, resulting in considerable heterogeneity between studies in terms of methodology, but the majority of measurements were undertaken in the laboratory allowing good control of environmental factors. Evidence for potential bias, including publication bias, was largely found to be low, but many studies reported poor comparability between target manipulation and comparator on aspects of a food/beverage product that were not under investigation, and several studies reported non‐use of ITT analyses.
All studies measured satiation and subsequent consumption in terms of amount consumed, and measured acceptability using ratings of palatability, including specific measures of palatability, liking, pleasantness and hedonic quality. Palatability is a measure of sensory food satisfaction, which is mostly determined by liking of taste and appearance,68, 69 as opposed to a more holistic appraisal of sensory satisfaction.70 Our findings thus relate specifically to the impacts of textural parameters on food intake while maintaining palatability.
5.2. Effects of food texture on satiation
In the 13 studies that investigated effects on satiation, enhancing the textural nature of foods, such that products were harder, chunkier, more viscous, voluminous, and more solid reduced weight and energy consumed, whereas palatability remained unchanged after both first taste and following consumption of the whole product. Effect sizes were comparable in weight and energy consumed, but these effects are more convincing for weight of food consumed. No differences were found between the different types of texture manipulation but the number of comparisons for each different textural parameter was very low. Heterogeneity between study findings was low, and comparable results in all sensitivity analyses strengthens these findings.
These results suggest that the manipulation of texture may be a useful strategy to reduce the amount consumed of a given product. These effects have previously been suggested to result from both changes to eating rate and the effort involved in eating.33, 35, 38, 51, 65 More solid, viscous and hard food products have been associated with slower eating rates,35, 51, 65 and increased oral exposure time,35, 38, 51 which will likely enhance the sensory experience of eating, leading to faster fatigue with the sensory experience,35, 38, 65, 67 and/or enhanced digestive activity, which may enhance post‐ingestive feedback mechanisms.36, 47, 48, 49, 51, 52, 58, 59, 60 More solid, viscous and harder food products may also increase the effort required for chewing, again enhancing digestive activity,33, 35, 37, 65 although studies by Bolhuis et al.33 and Zijlstra et al.65 suggest greater impacts of texture on eating rate as opposed to the effort of eating. The limited impacts on palatability further suggest that effects are a result of the texture manipulation rather than a result of factors affecting food liking or hedonic processes.
It is important however, to put these findings in context. Effect sizes are small, and some of the effects of texture may be artifacts of an artificial test situation, consumption of a food item in isolation,40, 41 consumption of a food item ad libitum, or other constraints of the test situation.40, 41, 48 Moreover, manipulations to texture were often extreme,38, 48, 51, 67 and probably greater than can be achieved in most commercial products. Many other factors will also contribute to determining the amount of a food product that is consumed in the real world. Beyond individual traits (e.g., age, sex, and BMI), portion size and visual cues, previous experience, expectations, and environmental situation, are well recognized to have strong impacts on everyday food intake.31, 33, 35, 52, 58, 59, 67, 71, 72 It is also possible that palatability itself effects satiation.16 Some of the individual studies included in the review report such an effect,48, 51 hence our interest in acceptability in reference to the sensory and physical food characteristics that effect satiation, although these effects of acceptability on satiation were not reported in all studies that investigated them.57, 65 Further consideration of the relative independent effects of texture and acceptability on satiation may be of interest.
5.3. Effects of food texture on subsequent consumption
The 29 studies that investigated the effects of food texture on subsequent consumption found limited effects in subsequent energy or weight consumed. Heterogeneity between study findings was low, and no effects were found if analyses excluded studies allowing ad libitum consumption of the preload and in all sensitivity analyses. Exclusion of three comparisons where solid and semi‐solid preloads were consumed in different manners resulted in small effects. The 29 studies also demonstrated no differences dependent on type of texture manipulation, and no impacts on acceptability.
These findings suggest that food texture manipulations have little impact on subsequent consumption. These findings may be unsurprising given the myriad factors, including individual, food and environmental factors, that may impact consumption and may play a greater role in governing food intake than food texture.12, 13, 14, 16, 33, 35, 59, 60, 66, 67 Effects of texture on future consumption may further rely on other factors. In a review by Almiron‐Roig et al.10 both inter‐meal interval and energy density were integral in determining energy compensation from different food forms. Expectations and previous learning may also play a role.73 Thus, although textural parameters might not influence subsequent consumption directly, texture might prime the tendency to compensate for calories in an energy‐rich meal, especially when in solid form73; a suggestion which is in line with broader ideas that cues that predict the presence of nutrients can modify subsequent food intake.7
Various aspects of the test situations may also have contributed to our results. Firstly, the pool of studies as analyzed here are limited to only the studies that also measured acceptability, but we have no reason to believe that this subset of studies systematically differs from those that do not measure acceptability. Secondly, many individual studies report effects on appetite ratings that did not translate into consumption, and so may have been missed by our analyses.31, 53 Optimal inter‐meal intervals for detecting effects may not have been used,47 and the use of buffet‐style meals in some studies may have masked differences between conditions.74 Some effects, furthermore, may occur more as a result of the food components, such as fibers, that create texture as opposed to the texture per se,43, 44 and some studies suggest effects based on interactions between a products' sensory profile and energy content, such that effects depend on appropriate sensory profile for energy content as opposed to sensory profile per se.32, 63, 64 As above, acceptability itself may also affect subsequent consumption.
5.4. Impacts on satiation but limited impacts on subsequent consumption
Impacts on satiation and the limited effects on subsequent consumption may add further weight to explanations of effects of textural parameters that are based on sensory or other aspects of the consumption experience as opposed to downstream digestive activities.66 In support for this, a recent meta‐analysis by Stribiţcaia et al.74 identified eight studies that examined the impact of texture manipulations on gut peptide secretion, and did not find conclusive evidence of an effect.
In relation to the differing effects on satiation and subsequent consumption, assessments of satiation also typically involve ad libitum consumption of a food/beverage item, whereas measures of subsequent consumption typically involve consumption of a fixed preload amount. Is it possible that the effects of texture on food intake are only realized when people eat a texture‐modified food ad libitum? A positive answer here would have further implications for the value of these modified food products in everyday life where a fixed amount is typically consumed. A need for strict control in the test situation also questions the generalizability of any effects to the real‐world scenario.
5.5. Strengths and limitations of the review
The review was conducted in a systematic manner, and database searches resulted in the accumulation of a large and varied amount of review evidence on the impacts of food characteristics on satiation and subsequent consumption. A reliance on review articles to identify relevant individual studies may have resulted in a reduced ability to identify more recent work, but the results from the review articles were also supplemented with recent individual studies. A reliance on the reviews that focused on textural parameters for RQ2 may also have reduced the individual studies identified, but we have no reason to suspect that these reviews were not inclusive. Reliance on personal awareness for the identification of more recent studies may have again resulted in reduced identification of individual studies, but all suitable studies that were identified in this manner reported null findings for effects on satiation or subsequent consumption, and given the general tendency to publish positive findings, we consider any bias to be unlikely. Our data set of individual studies is limited through our inclusion of only the studies that also measured acceptability, but there is no reason to suggest that this will have resulted in any systematic differences between the included studies and those excluded. Many of these studies furthermore, were conducted by the same researchers or in the same laboratories, and the number of relevant individual studies did not allow for good investigation of different textural parameters. Some of the textural parameters may also be inter‐related; chunky foods for example, may be more aerated, more viscous foods may be less aerated. Our classification of textural parameters assuming independence may be rather basic. However, we draw no conclusions based on each specific textural parameter—our findings refer to textural manipulations in general. We also only considered the textural characteristics of food products as these had been investigated, and we relied on the identified studies to define these; that is, we did not find any eligible papers investigating effects of textural complexity; thus, we did not consider this textural parameter. The total number of participants was also low for a review, but these controlled laboratory studies are typically small. Due to this low number of participants and the low number of individual studies, caution is required in interpreting our findings, and we have not taken account of differences in study methodology, for example, based on participant characteristics, and food product type. We did not collect individual‐level data from study authors; thus, we are unable to draw conclusions about individual differences. Our use of group‐level data both for investigating texture and for investigating acceptability may be rather crude in this respect. It is also possible that the impacts of texture have different impacts on acceptability in different foods products.33, 36 Without further evidence, we can offer no conclusions based on different textural manipulations or their impacts in different product types. We also did not consider appetite ratings as measures of satiation or likely subsequent consumption, and our analyses may be limited by our use of an assumed correlation between within‐subjects conditions of 0.7. We did not contact authors and request these correlations, but if correlations between participants are higher than this, our analyses will be conservative.
5.6. Comparison with other reviews
Although several previous reviews have investigated the effects of the sensory or physical characteristics of foods/beverages on food intake,6, 7, 10, 13, 14 including a recent systematic review by Stribiţcaia et al.,74 no other review of which we are aware has investigated these effects while also considering acceptability. Our work is novel in this respect.
The previous reviews support our focus on the textural components of foods for impacting food intake, compared to the more taste‐based characteristics. Most notably, a previous systematic review and meta‐analysis by Almiron‐Roig et al.10 found important effects on energy intake compensation based on physical form, such that compensation was better after solids compared to liquids, an effect that was also more pronounced in studies using a shorter inter‐meal interval. The recent review by Stribiţcaia et al.74 also found effects as a result of inter‐meal interval, where studies with shorter inter‐meal intervals (10–15 min) showed effects of texture on subsequent intake, whereas studies with longer inter‐meal intervals found no effects. Stribiţcaia et al.74 found limited effects of other textural parameters, although some effects in appetite ratings were reported. This review was not restricted to the inclusion of studies that also measured acceptability, but also failed to include some of the studies that we have included. Despite these differences, the findings of Stribiţcaia et al.74 are largely in agreement with ours.
5.7. Implications
Our findings suggest that product formulation to result in the development of food/beverage products that are harder, chunkier, more viscous, voluminous, and/or solid may aid reduced consumption of that product, with limited impacts on product acceptability. Effect sizes from the textural manipulations also suggest an average reduction in immediate consumption of 50 g or 68 kcal. Hill et al.2 suggest that a reduction in positive energy balance of 100 kcal/day could prevent weight gain in 90% of adults, although larger energy deficits will likely be needed for weight loss.2, 3 Further, the limited impacts of the textural manipulations on acceptability are likely to facilitate consumer selection and consumption.
Furthermore, research on energy intake compensation has shown that people are unlikely to fully compensate their energy intake from one eating occasion to the next eating occasion.33 Thus, there is potential for the accumulative acute effects of a texture manipulation to lead to a sustained reduction in energy intake over time, resulting in lower daily energy intakes and benefits for long‐term weight management. We recommend the future exploration of this possibility, together with a detailed assessment of the relative advantages of specific textural manipulations, in both food and beverage products, in different individuals.
Our findings, however, also suggest that effects are small, and that any effects of texture are unlikely to extend beyond consumption of the product itself. Thus, although harder, chunkier, more viscous, voluminous, and/or solid food products may be consumed to a lesser amount at the time, effects are limited. Moreover, many of the textural manipulations were extreme, and may be difficult to emulate in the context of commercial product reformulation. Considering amount consumed is often determined by other factors such as portion or pack size, effects may also be further reduced.
Limited impacts on acceptability also need to be demonstrated over repeated experience or sustained choice. Consumer acceptability of new approaches is essential for such strategies to be sustainable. In addition, methodological robustness is necessary. Predicting any aspect of consumer behavior toward foods in real life situations is extremely difficult and it is important to consider factors beyond the food characteristics themselves. Appropriateness for the situation and expected liking, for example, are strong influencers of food satisfaction.
5.8. Conclusions
In conclusion, the review evidence collected suggested greatest likely effects from the textural parameters of foods/beverages for impacting food intake. Further consideration of the relevant individual studies demonstrated increased satiation from foods/beverages that are harder, chunkier, more viscous, voluminous, and/or more solid, while acceptability was maintained, although limited effects were found for subsequent consumption. These findings provide some evidence that the development of harder, chunkier, more viscous, voluminous, and/or solid food/beverage products may be of value in reducing overconsumption.
CONFLICT OF INTEREST
KMA, AN, EAR, LG, MRY, KDG, JMB: In relation to work on textural parameters, no conflicts of interest to declare. HK, SV: employees of the food industry, as declared under affiliation.
AUTHOR CONTRIBUTIONS
Author contributions were as follows: Study conception and setup—SV, KA; data searches—KA; data screening—KA, AN; data extraction—KA, AN, EAR, MY, JB, KDG, LG, HK, SV; data analysis—KA; first draft of the manuscript—KA, MY; manuscript revision, finalization, and agreement—all authors.
Supporting information
Data S1 Supporting Information
ACKNOWLEDGMENTS
This work was conducted by an expert group (EG) of the European branch of the International Life Sciences Institute, ILSI Europe. The research question addressed in this publication and potential contributing experts in the field were identified by the Energy Balance and Eating Behaviour Task Force. Members of this task force are listed on the ILSI Europe website (https://ilsi.eu/task-forces/nutrition/sensory-science-consumer-behaviour/). According to ILSI Europe policies, the EG is composed of at least 50% of external non‐industry members. The complete composition of the EG can be found on the ILSI Europe website (https://ilsi.eu/task-forces/nutrition/sensory-science-consumer-behaviour/). Once the EG was formed, the research project was handed over to them to independently refine the research question. Consequently, the EG carried out the work, that is, collecting/analyzing data/information and writing the scientific paper, independently of other activities of the task force. The research reported is the result of a scientific evaluation in line with ILSI Europe's framework to provide a precompetitive setting for public–private partnership. ILSI Europe facilitated scientific meetings and coordinated the overall project management and administrative tasks relating to the completion of this work. For further information about ILSI Europe, please email info@ilsieurope.be or call +3227710014. The opinions expressed herein and the conclusions of this publication are those of the authors and do not necessarily represent the views of ILSI Europe nor those of its member companies nor any regulatory authority. Experts are not paid for the time spent on this work; however, the non‐industry members within the expert group were offered support for travel and accommodation costs from the Energy Balance and Eating Behaviour Task Force to attend meetings to discuss the manuscript and a small compensatory sum (honorarium) with the option to decline. Thanks are also extended to Cyril Marsaux, ILSI Europe, BE, for contributions to the project conceptualization and initial setup.
Appleton KM, Newbury A, Almiron‐Roig E, et al. Sensory and physical characteristics of foods that impact food intake without affecting acceptability: Systematic review and meta‐analyses. Obesity Reviews. 2021;22:e13234. 10.1111/obr.13234
[Corrections added on April 12, 2021 after first online publication: Affiliation #3 has been added for Eva Almiron‐Roig, and section headings have been updated throughout.]
DATA AVAILABILITY STATEMENT
Complete datasets are available from the corresponding author (Dr. Eva Almiron‐Roig) or the first author (Dr. Katherine Appleton) on request.
REFERENCES
- 1.NCD Risk Factor Collaboration . Trends in adult body‐mass index in 200 countries from 1975 to 2014: a pooled analysis of 1698 population‐based measurement studies with 19·2 million participants. Lancet. 2016;387(10026):1377‐1396. 10.1016/S0140-6736(16)30054-X [DOI] [PMC free article] [PubMed] [Google Scholar]
- 2.Hill JO, Wyatt HR, Peters JC. Energy balance and obesity. Circulation. 2012;126(1):126‐132. 10.1161/circulationaha.111.087213 [DOI] [PMC free article] [PubMed] [Google Scholar]
- 3.Guyenet SJ, Schwartz MW. Clinical review: regulation of food intake, energy balance, and body fat mass: implications for the pathogenesis and treatment of obesity. J Clin Endocrinol Metab. 2012;97(3):745‐755. 10.1210/jc.2011-2525 [DOI] [PMC free article] [PubMed] [Google Scholar]
- 4.Albuquerque D, Nóbrega C, Manco L, Padez C. The contribution of genetics and environment to obesity. Br Med Bull. 2017;123(1):159‐173. 10.1093/bmb/ldx022 [DOI] [PubMed] [Google Scholar]
- 5.Bilman E, van Kleef E, van Trijp H. External cues challenging the internal appetite control system—overview and practical implications. Crit Rev Food Sci Nutr. 2017;57(13):2825‐2834. 10.1080/10408398.2015.1073140 [DOI] [PubMed] [Google Scholar]
- 6.Campbell CL, Wagoner TB, Foegeding EA. Designing foods for satiety: the roles of food structure and oral processing in satiation and satiety. Food Struct. 2017;13:1‐12. 10.1016/j.foostr.2016.08.002 [DOI] [Google Scholar]
- 7.Chambers L, McCrickerd K, Yeomans MR. Optimising foods for satiety. Trends Food Sci Technol. 2015;41(2):149‐160. 10.1016/j.tifs.2014.10.007 [DOI] [Google Scholar]
- 8.Halford JC, Harrold JA. Satiety‐enhancing products for appetite control: science and regulation of functional foods for weight management. Proc Nutr Soc. 2012;71(2):350‐362. 10.1017/s0029665112000134 [DOI] [PubMed] [Google Scholar]
- 9.Li T, Zhao M, Raza A, et al. The effect of taste and taste perception on satiation/satiety: a review. Food Funct. 2020;11(4):2838‐2847. 10.1039/c9fo02519g [DOI] [PubMed] [Google Scholar]
- 10.Almiron‐Roig E, Palla L, Guest K, et al. Factors that determine energy compensation: a systematic review of preload studies. Nutr Rev. 2013;71(7):458‐473. 10.1111/nure.12048 [DOI] [PMC free article] [PubMed] [Google Scholar]
- 11.Appleton KM, Tuorila H, Bertenshaw EJ, de Graaf K, Mela DJ. Sweet taste exposures and the subsequent acceptance and preference for sweet taste in the diet: systematic review of the published literature. Am J Clin Nutr. 2018;107(3):405‐419. 10.1093/ajcn/nqx031 [DOI] [PubMed] [Google Scholar]
- 12.de Graaf C, Kok FJ. Slow food, fast food and the control of food intake. Nat Rev Endocrinol. 2010;6(5):290‐293. 10.1038/nrendo.2010.41 [DOI] [PubMed] [Google Scholar]
- 13.Dhillon J, Running CA, Tucker RM, Mattes RD. Effects of food form on appetite and energy balance. Food Qual Pref. 2016;48:368‐375. 10.1016/j.foodqual.2015.03.009 [DOI] [Google Scholar]
- 14.McCrickerd K, Forde CG. Sensory influences on food intake control: moving beyond palatability. Obes Rev. 2016;17(1):18‐29. 10.1111/obr.12340 [DOI] [PubMed] [Google Scholar]
- 15.Whiting S, Derbyshire EJ, Tiwari B. Could capsaicinoids help to support weight management? A systematic review and meta‐analysis of energy intake data. Appetite. 2014;73:183‐188. 10.1016/j.appet.2013.11.005 [DOI] [PubMed] [Google Scholar]
- 16.de Graaf C, de Jong L, Lambers AC. Palatability affects satiation and not satiety. Physiol Behav. 1999;66(4):681‐688. 10.1016/s0031-9384(98)00335-7 [DOI] [PubMed] [Google Scholar]
- 17.Johnson F, Wardle J. Variety, palatability, and obesity. Adv Nutr. 2014;5(6):851‐859. 10.3945/an.114.007120 [DOI] [PMC free article] [PubMed] [Google Scholar]
- 18.Sørensen L, Møller P, Flint A, Martens M, Raben A. Effect of sensory perception of foods on appetite and food intake: a review of studies on humans. Int J Obes (Lond). 2003;27(10):1152‐1166. 10.1038/sj.ijo.0802391 [DOI] [PubMed] [Google Scholar]
- 19.Monneuse M‐O, Bellisle F, Louis‐Sylvestre J. Responses to an intense sweetener in humans: immediate preference and delayed effects on intake. Physiol Behav. 1991;49(2):325‐330. 10.1016/0031-9384(91)90051-o [DOI] [PubMed] [Google Scholar]
- 20.Shea BJ, Hamel C, Wells GA, et al. AMSTAR is a reliable and valid measurement tool to assess the methodological quality of systematic reviews. J Clin Epidemiol. 2009;62(10):1013‐1020. 10.1016/j.jclinepi.2008.10.009 [DOI] [PubMed] [Google Scholar]
- 21.Poutanen KS, Dussort P, Erkner A, et al. A review of the characteristics of dietary fibers relevant to appetite and energy intake outcomes in human intervention trials. Am J Clin Nutr. 2017;106:747‐754. 10.3945/ajcn.117.157172 [DOI] [PubMed] [Google Scholar]
- 22.Halton TL, Hu FB. The effects of high protein diets on thermogenesis, satiety and weight loss: a critical review. J am Coll Nutr. 2004;23(5):373‐385. 10.1080/07315724.2004.10719381 [DOI] [PubMed] [Google Scholar]
- 23.Higgins JPT, Green S. Cochrane Handbook for Systematic Reviews of Interventions. 5.1ed. Chichester, UK: The Cochrane Collaboration & John Wiley & Sons, Ltd; 2011https://training.cochrane.org/handbook/current [Google Scholar]
- 24.Deeks JJ, Altman DG, Bradbrun MJ. Statistical methods for examining heterogeneity and combining results from several studies in meta‐analysis. In: Egger M, Davey Smith G, Altman DG, eds. Systematic Reviews in Health Care: Meta‐Analysis in Context. London: BMJ Publishing Group; 2001:285‐312 10.1002/9780470693926.ch15 [DOI] [Google Scholar]
- 25.Egger M, Davey Smith G. Principles of and procedures for systematic reviews. In: Egger M, Davey Smith G, Altman DG, eds. Systematic Reviews in Health Care: Meta‐Analysis in Context. London: BMJ Publishing Group; 2001:23‐42 10.1002/9780470693926.ch2 [DOI] [Google Scholar]
- 26.Elbourne DR, Altman DG, Higgins JPT, Curtin F, Worthington HV, Vail A. Meta‐analyses involving cross‐over trials: methodological issues. Int J Epidemiol. 2002;31(1):140‐149. 10.1093/ije/31.1.140 [DOI] [PubMed] [Google Scholar]
- 27.Furukawa TA, Barbui C, Cipriani A, Brambilla P, Watanabe N. Imputing missing standard deviations in meta‐analyses can provide accurate results. J Clin Epidemiol. 2006;59(1):7‐10. 10.1016/j.jclinepi.2005.06.006 [DOI] [PubMed] [Google Scholar]
- 28.Higgins JPT, Thompson SG. Quantifying heterogeneity in a meta‐analysis. Stat Med. 2002;21(11):1539‐1558. 10.1002/sim.1186 [DOI] [PubMed] [Google Scholar]
- 29.Higgins JPT, Thompson SG, Deeks JJ, Altman DG. Measuring inconsistency in meta‐analyses. BMJ. 2004;327(7414):557‐560. 10.1136/bmj.327.7414.557 [DOI] [PMC free article] [PubMed] [Google Scholar]
- 30.Sterne JAC, Egger M, Davey Smith G. Investigating and dealing with publication and other biases. In: Egger M, Davey Smith G, Altman DG, eds. Systematic Reviews in Health Care: Meta‐Analysis in Context. London: BMJ Publishing Group; 2001:189‐208 10.1136/bmj.323.7304.101 [DOI] [Google Scholar]
- 31.Almiron‐Roig E, Grathwohl D, Green H, Erkner A. Impact of some isoenergetic snacks on satiety and next meal intake in healthy adults. J Hum Nutr Diet. 2009;22(5):469‐474. 10.1111/j.1365-277x.2009.00978.x [DOI] [PubMed] [Google Scholar]
- 32.Bertenshaw EJ, Lluch A, Yeomans MR. Perceived thickness and creaminess modulates the short‐term satiating effects of high‐protein drinks. Brit J Nutr. 2013;110(3):578‐586. 10.1017/s0007114512005375 [DOI] [PubMed] [Google Scholar]
- 33.Bolhuis DP, Forde CG, Cheng Y, Xu H, Martin N, de Graaf C. Slow food: sustained impact of harder foods on the reduction in energy intake over the course of the day. PLoS One. 2014;9(4):e93370. 10.1371/journal.pone.0093370 [DOI] [PMC free article] [PubMed] [Google Scholar]
- 34.Camps G, Mars M, de Graaf C, Smeets PAM. Empty calories and phantom fullness: a randomized trial studying the relative effects of energy density and viscosity on gastric emptying determined by MRI and satiety. Am J Clin Nutr. 2016;104(1):73‐80. 10.3945/ajcn.115.129064 [DOI] [PubMed] [Google Scholar]
- 35.De Wijk RA, Zijlstra N, Mars M, de Graaf C, Prinz JF. The effects of food viscosity on bite size, bite effort and food intake. Physiol Behav. 2008;95(3):527‐532. 10.1016/j.physbeh.2008.07.026 [DOI] [PubMed] [Google Scholar]
- 36.Flood JE, Rolls BJ. Soup preloads in a variety of forms reduce meal energy intake. Appetite. 2007;49(3):626‐634. 10.1016/j.appet.2007.04.002 [DOI] [PMC free article] [PubMed] [Google Scholar]
- 37.Flood‐Obbagy JE, Rolls BJ. The effect of fruit in different forms on energy intake and satiety at a meal. Appetite. 2009;52(2):416‐422. 10.1016/j.appet.2008.12.001 [DOI] [PMC free article] [PubMed] [Google Scholar]
- 38.Forde CG, van Kuijk N, Thaler T, de Graaf C, Martin N. Texture and savoury taste influences on food intake in a realistic hot lunch time meal. Appetite. 2013;60(1):180‐186. 10.1016/j.appet.2012.10.002 [DOI] [PubMed] [Google Scholar]
- 39.Gadah NS, Kyle LA, Smith JE, Brunstrom JM, Rogers PJ. No difference in compensation for sugar in a drink versus sugar in semi‐solid and solid foods. Physiol Behav. 2016;156:35‐42. 10.1016/j.physbeh.2015.12.025 [DOI] [PubMed] [Google Scholar]
- 40.Hogenkamp PS, Mars M, Stafleu A, de Graaf C. Repeated consumption of a large volume of liquid and semi‐solid foods increases ad libitum intake, but does not change expected satiety. Appetite. 2012;59(2):419‐424. https://www.sciencedirect.com/science/article/abs/pii/S0195666312002097 [DOI] [PubMed] [Google Scholar]
- 41.Hogenkamp PS, Stafleu A, Mars M, de Graaf C. Learning about the energy density of liquid and semi‐solid foods. Int J Obes (Lond). 2012;36(9):1229‐1235. 10.1038/ijo.2011.231 [DOI] [PubMed] [Google Scholar]
- 42.Hovard P, Chambers L, Hull S, Re R, Wickham MSJ, Yeoman MR. Sensory‐enhanced beverages: effects on satiety following repeated consumption at home. Nutr Bull. 2015;40(3):187‐198. 10.1111/nbu.12152 [DOI] [Google Scholar]
- 43.Jensen MG, Knudsen JC, Viereck N, Kristensen M, Astrup A. Functionality of alginate based supplements for application in human appetite regulation. Food Chem. 2012;132(2):823‐829. 10.1016/j.foodchem.2011.11.042 [DOI] [Google Scholar]
- 44.Jensen MG, Kristensen M, Belza A, Knudsen JC, Astrup A. Acute effect of alginate‐based preload on satiety feelings, energy intake, and gastric emptying rate in healthy subjects. Obesity. 2012;20(9):1851‐1858. 10.1038/oby.2011.232 [DOI] [PubMed] [Google Scholar]
- 45.Juvonen KR, Purhonen AK, Salmenkallio‐Marttila M, et al. Viscosity of oat bran‐enriched beverages influences gastrointestinal hormonal responses in healthy humans. J Nutr. 2009;139(3):461‐466. 10.3945/jn.108.099945 [DOI] [PubMed] [Google Scholar]
- 46.Krop EM, Hetherington MM, Miquel S, Sarkar A. The influence of oral lubrication on food intake: a proof‐of‐concept study. Food Qual Pref. 2019;74:118‐124. 10.1016/j.foodqual.2019.01.016 [DOI] [Google Scholar]
- 47.Labouré H, van Wymelbeke V, Fantino M, Nicolaidis S. Behavioral, plasma, and calorimetric changes related to food texture modification in men. Am J Physiol Regul Integr Comp Physiol. 2002;282(5):R1501‐R1511. 10.1152/ajpregu.00287.2001 [DOI] [PubMed] [Google Scholar]
- 48.Lasschuijt MP, Mars M, Stieger M, Miquel‐Kergoat S, de Graaf C, Smeets PAM. Comparison of oro‐sensory exposure duration and intensity manipulations on satiation. Physiol Behav. 2017;176:76‐83. 10.1016/j.physbeh.2017.02.003 [DOI] [PubMed] [Google Scholar]
- 49.Lavin JH, French SJ, Ruxton CHS, Read NW. An investigation of the role of oro‐sensory stimulation in sugar satiety. Int J Obes (Lond). 2002;26(3):384‐388. 10.1038/sj.ijo.0801829 [DOI] [PubMed] [Google Scholar]
- 50.Lett AM, Norton JE, Yeomans MR. Emulsion oil droplet size significantly affects satiety: a pre‐ingestive approach. Appetite. 2016;96:18‐24. 10.1016/j.appet.2015.08.043 [DOI] [PubMed] [Google Scholar]
- 51.Mars M, Hogenkamp PS, Gosses AM, Stafleu A, de Graaf C. Effect of viscosity on learned satiation. Physiol Behav. 2009;98(1‐2):60‐66. 10.1016/j.physbeh.2009.04.018 [DOI] [PubMed] [Google Scholar]
- 52.Mattes R. Soup and satiety. Physiol Behav. 2005;83(5):739‐747. 10.1016/j.physbeh.2004.09.021 [DOI] [PubMed] [Google Scholar]
- 53.Mattes R, Rothacker D. Beverage viscosity is inversely related to postprandial hunger in humans. Physiol Behav. 2001;74(4‐5):551‐557. 10.1016/s0031-9384(01)00597-2 [DOI] [PubMed] [Google Scholar]
- 54.McCrickerd K, Lim CMH, Leong C, Chia EM, Forde CG. Texture‐based differences in eating rate reduce the impact of increased energy density and large portions on meal size in adults. J Nutr. 2017;147(6):1208‐1217. 10.3945/jn.116.244251 [DOI] [PubMed] [Google Scholar]
- 55.Mosca AC, Torres AP, Slob E, de Graaf K, McEwan JA, Stieger M. Small food texture modifications can be used to change oral processing behaviour and to control ad libitum food intake. Appetite. 2019;142:104375. 10.1016/j.appet.2019.104375 [DOI] [PubMed] [Google Scholar]
- 56.Osterholt KM, Liane S, Roe LS, Rolls BJ. Incorporation of air into a snack food reduces energy intake. Appetite. 2007;48(3):351‐358. 10.1016/j.appet.2006.10.007 [DOI] [PMC free article] [PubMed] [Google Scholar]
- 57.Pritchard SJ, Davidson I, Jones J, Bannerman E. A randomised trial of the impact of energy density and texture of a meal on food and energy intake, satiation, satiety, appetite and palatability responses in healthy adults. Clin Nutr. 2014;33(5):768‐775. 10.1016/j.clnu.2013.10.014 [DOI] [PubMed] [Google Scholar]
- 58.Rolls BJ, Bell EA, Thorwart ML. Water incorporated into a food but not served with a food decreases energy intake in lean women. Am J Clin Nutr. 1999;70(4):448‐455. 10.1093/ajcn/70.4.448 [DOI] [PubMed] [Google Scholar]
- 59.Rolls BJ, Bell EA, Waugh BA. Increasing the volume of a food by incorporating air affects satiety in men. Am J Clin Nutr. 2000;72(2):361‐368. 10.1093/ajcn/72.2.361 [DOI] [PubMed] [Google Scholar]
- 60.Rolls BJ, Castellanos VH, Halford JC, et al. Volume of food consumed affects satiety in men. Am J Clin Nutr. 1998;67(6):1170‐1177. 10.1093/ajcn/67.6.1170 [DOI] [PubMed] [Google Scholar]
- 61.Tournier A, Louis‐Sylvestre J. Effect of physical state of a food on subsequent intake in human subjects. Appetite. 1991;16(1):17‐24. 10.1016/0195-6663(91)90107-4 [DOI] [PubMed] [Google Scholar]
- 62.Tsuchiya A, Almiron‐Roig E, Lluch A, Guyonnet D, Drewnowski A. Higher satiety ratings following yogurt consumption relative to fruit drink or dairy fruit drink. J am Diet Assoc. 2006;106(4):550‐557. 10.1016/j.jada.2006.01.004 [DOI] [PubMed] [Google Scholar]
- 63.Yeomans MR, Chambers L. Satiety‐relevant sensory qualities enhance the satiating effects of mixed carbohydrate‐protein preloads. Am J Clin Nutr. 2011;94(6):1410‐1417. 10.3945/ajcn.111.011650 [DOI] [PubMed] [Google Scholar]
- 64.Yeomans MR, McCrickerd K, Brunstrom JM, Chambers L. Effects of repeated consumption on sensory‐enhanced satiety. Brit J Nutr. 2014;111(6):1137‐1144. 10.1017/s0007114513003474 [DOI] [PubMed] [Google Scholar]
- 65.Zijlstra N, Mars M, de Wijk RA, Westerterp‐Plantenga MS, de Graaf C. The effect of viscosity on ad libitum food intake. Int J Obes (Lond). 2008;32(4):676‐683. 10.1038/sj.ijo.0803776 [DOI] [PubMed] [Google Scholar]
- 66.Zijlstra N, Mars M, de Wijk RA, Westerterp‐Plantenga MS, Holst JJ, de Graaf C. Effect of viscosity on appetite and gastro‐intestinal hormones. Physiol Behav. 2009;97(1):68‐75. 10.1016/j.physbeh.2009.02.001 [DOI] [PubMed] [Google Scholar]
- 67.Zijlstra N, Mars M, Stafleu A, de Graaf C. The effect of texture differences on satiation in 3 pairs of solid foods. Appetite. 2010;55(3):490‐497. 10.1016/j.appet.2010.08.014 [DOI] [PubMed] [Google Scholar]
- 68.Vad Andersen B, Hyldig G. Food satisfaction: integrating feelings before, during and after food intake. Food Qual Pref. 2015;43:126‐134. 10.1016/j.foodqual.2015.03.004 [DOI] [Google Scholar]
- 69.Vad Andersen B, Hyldig G. Consumers' view on determinants to food satisfaction. A qualitative approach. Appetite. 2015;95:9‐16. 10.1016/j.appet.2015.06.011 [DOI] [PubMed] [Google Scholar]
- 70.Vad Andersen B, Brockhoff PB, Hyldig G. The importance of liking of appearance, ‐odour, ‐taste and ‐texture in the evaluation of overall liking. A comparison with the evaluation of sensory satisfaction. Food Qual Pref. 2019;71:228‐232. 10.1016/j.foodqual.2018.07.005 [DOI] [Google Scholar]
- 71.Cardello A, Schutz H, Snow C, Lesher L. Predictors of food acceptance, consumption and satisfaction in specific eating situations. Food Qual Pref. 2000;11(3):201‐216. 10.1016/S0950-3293(99)00055-5 [DOI] [Google Scholar]
- 72.Møller P. Satisfaction, satiation and food behaviour. Curr Opin Food Sci. 2015;3:59‐64. 10.1016/j.cofs.2015.02.008 [DOI] [Google Scholar]
- 73.Forde C, Almiron‐Roig E, Brunstrom JM. Expected satiety: application to weight management and understanding energy selection in humans. Curr Obes Rep. 2015;4(1):131‐140. 10.1007/s13679-015-0144-0 [DOI] [PMC free article] [PubMed] [Google Scholar]
- 74.Stribiţcaia E, Evans CEL, Gibbons C, Blundell J, Sarkar A. Food texture influences on satiety: systematic review and meta‐analysis. Sci Rep. 2020;10(1):12929. 10.1038/s41598-020-69504-y [DOI] [PMC free article] [PubMed] [Google Scholar]
Associated Data
This section collects any data citations, data availability statements, or supplementary materials included in this article.
Supplementary Materials
Data S1 Supporting Information
Data Availability Statement
Complete datasets are available from the corresponding author (Dr. Eva Almiron‐Roig) or the first author (Dr. Katherine Appleton) on request.