Abstract
Background
Clear‐cell renal cell carcinoma (ccRCC) is stubborn to traditional chemotherapy and radiation treatment, which makes its clinical management a major challenge. Recently, we have made efforts in understanding the etiology of ccRCC. Increasing evidence revealed that the competing endogenous RNA (ceRNA) was involved in the development of varied tumors. However, a comprehensive analysis of the prognostic model based on lncRNA‐miRNA‐mRNA ceRNA regulatory network of ccRCC with large‐scale sample size and RNA‐sequencing expression data is still limited.
Methods
RNA‐sequencing expression data were taken out from GTEx database and TCGA database, a total of 354 samples with ccRCC and 157 normal controlled samples were included in our study. The ccRCC‐specific genes were obtained by WGCNA and differential expression analysis. Following, the communication of mRNAs and lncRNAs with targeted miRNAs were predicted by MiRcode, starBase, miRTarBase, and TargetScan. A gene signature of eight genes was further constructed by univariate Cox regression, Lasso methods, and multivariate Cox regression analysis.
Results
A total of 2191 mRNAs and 1377 lncRNAs was identified, and a dysregulated ceRNA network for ccRCC was established using 7 mRNAs, 363 lncRNAs, and 3 miRNAs. Further, a gene signature including eight genes based on this ceRNA was determined followed by the development of a nomogram predicting 1‐, 3‐, and 5‐year survival probability for ccRCC.
Conclusion
It could contribute to a better understanding of ccRCC tumorigenesis mechanism and guide clinicians to make a more accurate treatment decision.
Keywords: competing endogenous RNA, gene signature, nomograms, renal cell carcinoma
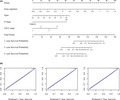
We constructed a nomogram predicting 1‐, 3‐, and 5‐OS of ccRCC patients with a gene signature based on the ccRCC‐specific dysregulated ceRNA network and some other clinical factors. It could contribute to a better understanding of ccRCC tumorigenesis mechanism and guide clinicians to make a more accurate treatment decision.
1. BACKGROUND
Kidney cancer, of which the most common subtype is clear‐cell renal cell carcinoma (ccRCC), constituted the third prevalent malignant tumor in the urogenital system of women and the second of men, and accounted for about 144,000 deaths annually worldwide.1 However, since a lack of external tumor factors such as age, nuclear grading, and microscopic tumor necrosis, it remains controversial for the optimum stratification of patients with ccRCC using the TNM staging system,2 hence, identification of prognostic predictive system for ccRCC containing both tumor anatomical features and other clinical and genetic variables deserves increasing attention.
Recently, the hypothesis of competing endogenous RNA (ceRNA) states that the pool of long non‐coding RNAs (lncRNAs) can regulate messenger RNAs (mRNAs) activity by binding to and competing for microRNAs (miRNAs).3,4 miRNA can regulate the expression level of targeted mRNAs with miRNA response elements (MREs) combining on the targeted mRNAs, on the other hand, lncRNA can serve as a molecular sponge to interact with miRNAs, which thus results in different kinds of human diseases process.5 At present, emerging evidence showed that the ceRNA hypothesis was involved in the development of different kinds of tumors, such as gastric, colon, liver, breast, bladder, and pancreatic cancer, which makes it possible to construct a prognostic prediction system on the basis of ceRNA network. Nevertheless, there are limited prognosis‐related ceRNA researches conducted in ccRCC. In this way, this study pointed to explore the prognostic significance of genes contained in the ccRCC‐specific dysregulated ceRNA network.
In the current study, ccRCC‐specific genes were obtained by employing weighted correlation network analysis (WGCNA)6 and differential expression analysis to RNA‐Seq data from Genotype‐Tissue Expression (GTEx)7 and The Cancer Genome Atlas (TCGA),8 then miRNA database was used to predict the interaction between mRNAs or lncRNAs and miRNAs. Following, 7 mRNAs, 363 lncRNAs, and 3 miRNAs were used to develop a dysregulated‐ceRNA network for ccRCC. Further, a gene signature of one mRNA (MPP5) and seven lncRNAs (WT1‐AS, AC114316.1, AC103719.1, AL162377.1, HS1BP3‐IT1, LINC02657, and AC015909.1) was constructed by univariate Cox regression, Least absolute shrinkage and selection operator (Lasso) methods, and multivariate Cox regression analysis. Consequently, a prognostic nomogram assessment system predicting 1‐, 3‐, and 5‐year survival probability was constructed by including the gene signature and related clinical characteristics using a stepwise Cox regression for ccRCC.
2. METHODS
2.1. Gene expression and clinical data
The high‐throughput RNA sequencing data of 539 kidney samples with ccRCC and 72 normal controlled samples were obtained from TCGA data repository using TCGAbiolinks9 R package. miRNA sequencing data were also retrieved from TCGA.8 Samples with tumor purity below 0.6,10 Formalin‐fixed paraffin‐embedded (FFPE) tissue, and duplicate samples were excluded in downstream analysis. Meanwhile, a total of 85 normal kidney cortex samples were downloaded from GTEx7 (version V8). No further approval was required from the Ethics Committee as the data comes from the TCGA and GTEx database. lncRNAs and mRNAs were recognized by the Ensembl11 database (version GRCh38.98). lncRNAs and mRNAs that were not included in the database were excluded in this study. We mainly used the R program (version 3.6.1)12 for the analysis in our study.
2.2. ccRCC‐specific mRNAs and lncRNAs
WGCNA, which can determine genes most related to a sample trait by clustering highly correlated genes to several modules and combining modules with external traits, was used to identify co‐expression network in lncRNAs or mRNAs expression profiles.6 The biweight midcorrelation analysis13 was efficiently used to assess weighted coexpression relationship. Gene significance (GS), module significance (MS), and module membership (MM) were explained by biweight midcorrelation coefficients. Genes in modules with max MS were defined with ccRCC importance, moreover, we only incorporated modules with a significant biweight midcorrelation coefficient between GS and MM. In this study, we obtained mRNAs or lncRNAs most related to ccRCC patients using WGCNA. Differentially expressed genes between ccRCC and normal samples were identified by DESeq2 with a threshold of |log2 fold change| >1 and adjusted p‐value < 0.01. Further, to obtain ccRCC‐specific mRNAs and lncRNAs, we intersected genes most positively or negatively correlated with ccRCC in WGCNA with upregulated or downregulated genes in differential expression analysis, respectively.
2.3. Construction of a dysregulated ceRNA network
Interactions between lncRNAs and miRNAs were identified by MiRcode.14,15 The interactions between mRNAs and miRNAs were explored by StarBase (version 3.9),16, 17 TargetScan (version 7.2),18 and miRTarBase (version 8.0)19 databases, meanwhile, miRNA sequencing data from TCGA was employed to review the top 10% expressed miRNA, since the implementation of ceRNA function depends on abundant of miRNAs, we only included triple lncRNAs‐miRNAs‐mRNAs with miRNA in above miRNAs. We used Cytoscape (version 3.7.1) to depict the ceRNA network.
2.4. Establishment of prognostic gene signature
To construct a risk assessment gene signature, a whole of 344 TCGA cases whose follow‐up >30 days with all clinical characteristics were randomly divided into a discovery group and a validation group, which was used to identify the gene signature and validate the efficacy of the gene signature, respectively. Both mRNA and lncRNA in the ceRNA network were employed to univariable Cox proportional‐hazards model. Then, we selected genes meeting the statistical significance (p‐value <0.01) to conduct Lasso penalized Cox regression analysis, which allows for the variable selection by constraining the variable regression coefficients, even to zero, and for declining the risk of overfitting,20 thus finding a prognostic gene signature for patients with ccRCC based on the Lasso‐penalized Cox regression model coefficients (β) and gene expression levels (risk scores = β1*gene1 + β2*gene2 +…..+ βn*genen). To assess the prognostic gene signature, we conducted a time‐dependent receiver operating characteristic (ROC) curve analysis and calculated Harrell's concordance index (C‐index) among discovery group, validation group, and the entire group separately.
2.5. Construction of prognostic nomogram
A prognostic nomogram predicting 1‐, 3‐, and 5‐ year survival probability for ccRCC patients in the entire group was constructed by applying prognostic gene signature and relevant clinical characteristics to a stepwise Cox proportional‐hazards model. Further, we tested the discrimination and the calibration of the nomogram by Harrell's concordance index (C‐index) analysis and the calibration curves analysis.
2.6. Validation of gene signature and prognostic nomogram
The Human Protein Atlas and GEO database were firstly searched to validate the differential expression of genes in the gene signature. Bootstrap, which could adjust overfitting and provide nearly unbiased estimates for model performance, was employed to validate the gene signature and prognostic nomogram.21, 22 Let C‐index(orig) indicated C‐index based on the original data and gene signature or nomogram. First, we generated a bootstrap sample from our original data with replacement, and we developed a model based on the same process constructing the gene signature or prognostic nomogram using the upper bootstrap sample, we calculated C‐index based on this model using the bootstrap sample (C‐index(training)) and original data (C‐index(test)), optimism denoted to C‐index(training)–C‐index(test) which was regarded as the evaluation of overfitting. The corrected C‐index was C‐index(orig) subtracted optimism.
2.7. Functional enrichment analysis
We only applied functional enrichment analysis to mRNA as mRNA is the main functional molecule in ceRNA network. The clusterProfiler23 package was used to investigate both biological process (BP) in Gene Ontology24, 25 (GO) and functional pathways in Kyoto Encyclopedia of Genes and Genomes26 (KEGG).
3. RESULTS
3.1. Data source and data preprocessing
After filtering samples with tumor purity below 0.6,10 Formalin‐Fixed Paraffin‐Embedded (FFPE) tissue and duplicate samples, a total of 354 ccRCC samples and 72 normal controls in TCGA were included in downstream analysis. Meanwhile, a total of 85 normal controlled samples from GTEx was incorporated. Moreover, Ensembl identified 19538 mRNA expression values and 13511 lncRNA expression values for further analysis. The flow chart of the ceRNA network construction and the development of following gene signature and nomogram was depicted (Figure 1).
FIGURE 1.
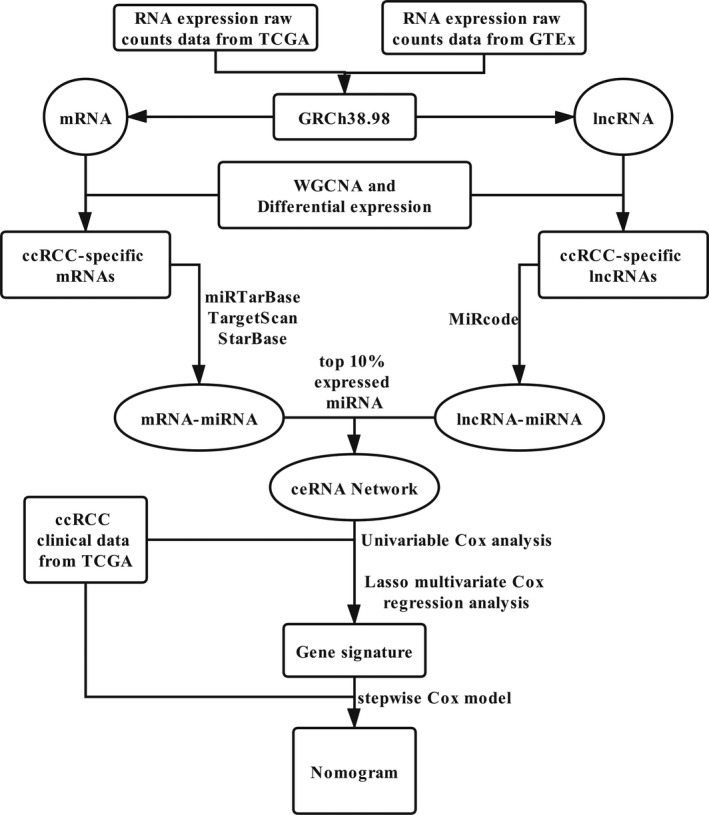
The flow chart of the ceRNA network construction
3.2. mRNA modules correlated with ccRCC
WGCNA was employed to analyze gene modules among the top 10000 mRNAs with maximum median absolute deviation (MAD) using softpower 14, minModuleSize 25, and mergeCutHeight 0.20 as the threshold. Consequently, we identified 17 gene color modules (Figures S1A–B). The biological process for each module was determined by GSEA (Table 1). As shown in Figure 2A, the association between gene co‐expression modules and ccRCC was explored, a total of 4005 mRNAs, which showed the highest relationship with ccRCC, was found in brown module, black module, and turquoise module. The relationships between MM and GS in three modules were then analyzed (Figure 2B). We then conducted GO analysis to reveal these mRNAs functions in BP, which found that these genes were most related to angiogenesis, extracellular matrix organization, and response to hypoxia (Figure S1C). Besides, genes were highly enriched in HIF‐1 signaling pathway, MAPK signaling pathway, and PI3K‐Akt signaling pathway by KEGG analysis (Figure S1D).
TABLE 1.
Module description of mRNA modules created by WGCNA, GSEA was applied to disclose the biological process of modules. Module size indicated the number of genes in a module
| Module | Module size | Biological process | p.adjust |
|---|---|---|---|
| Magenta | 284 | Adaptive immune response | 7.02E‐26 |
| Lightcyan | 144 | Nuclear‐transcribed mRNA catabolic process, nonsense‐mediated decay | 1.13E‐39 |
| Pink | 310 | Oxidative phosphorylation | 4.06E‐38 |
| Turquoise | 2869 | Adaptive immune response | 1.42E‐32 |
| Purple | 263 | Organic acid catabolic process | 3.34E‐43 |
| Greenyellow | 236 | Small molecule catabolic process | 5.92E‐35 |
| Salmon | 213 | Adaptive immune response | 4.41E‐24 |
| Midnightblue | 151 | Lymphocyte activation | 1.40E‐57 |
| Tan | 214 | Mitotic cell cycle process | 1.48E‐35 |
| Blue | 1244 | Lymphocyte activation | 1.16E‐55 |
| Brown | 789 | Lymphocyte activation | 1.37E‐31 |
| Green | 397 | Cotranslational protein targeting to membrane | 4.49E‐56 |
| Yellow | 783 | Sulfur compound metabolic process | 1.12E‐17 |
| Black | 347 | Adaptive immune response | 8.34E‐19 |
| Red | 386 | Vasculature development | 3.11E‐40 |
| Cyan | 155 | Organic acid catabolic process | 2.18E‐34 |
| Grey | 1215 | Mitotic cell cycle | 5.44E‐19 |
FIGURE 2.
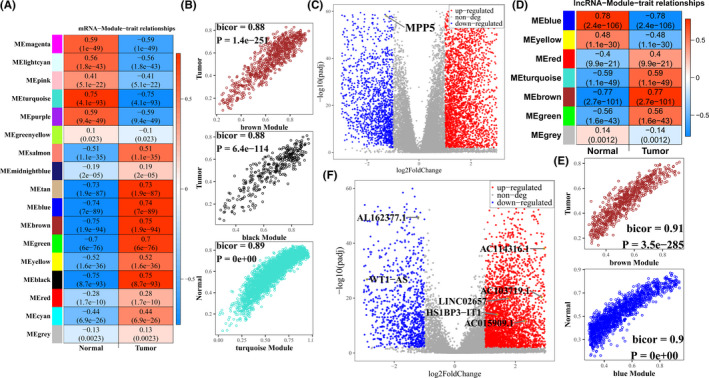
Determination of ccRCC‐specific mRNAs and lncRNAs. (A and D) the heatmap of the relationships between modules and traits was investigated, where the color represented the biweight midcorrelation coefficients; (A) mRNA (D) lncRNA. (B and E) Gene significance versus module membership. The x‐axis stands for the biweight midcorrelation coefficients between genes expression levels and the corresponding module eigengene, the y‐axis represents the biweight midcorrelation coefficients between genes expression levels with corresponding traits; (B) mRNA, (E) lncRNA. (C and F) the volcano of differential expression genes in ccRCC, red spots represent upregulated genes, and blue spots represent downregulated genes, further determined genes in prognostic gene signature were labeled and encircled in the yellow ring; (C) mRNA, (F) lncRNA
3.3. Determination of differential expression mRNAs (DEmRNAs)
A total of 3679 significantly upregulated and 1944 significantly downregulated mRNAs, which were depicted in volcano map (Figure 2C), were identified by DESeq2. We used Gene Set Enrichment Analysis (GSEA) to demonstrate the biological function behind these identified differential expression genes. DEmRNAs were enriched in neutrophil‐mediated immunity, immune response‐activating signal transduction, and neutrophil activation in biological process (BP) (Figure S2A). Meanwhile, cytokine‐cytokine receptor interaction, human T‐cell leukemia virus 1 infection, and viral carcinogenesis‐related genes were found upregulated in DEmRNAs, while collecting duct acid secretion, proximal tubule bicarbonate reclamation, and glyoxylate and dicarboxylate metabolism pathways were downregulated in DEmRNAs (Figure S2B). Finally, we obtained 2191 ccRCC‐specific mRNAs by intersecting mRNAs from WGNCA modules and differential expression analysis.
3.4. ccRCC‐specific lncRNAs identified by WGCNA and DESeq2
We investigated the co‐expression network of 8332 lncRNAs by WGCNA with softpower 7, minModuleSize 15, and mergeCutHeight 0.20 as the threshold after filtering lncRNAs with median absolute deviation (MAD) zero. Finally, we identified a total of seven coexpression modules (Figures S3A–B) and found that brown module with 744 lncRNAs was most positively related to ccRCC and blue module including 1424 lncRNAs presented the highest negative relationship with ccRCC (Figure 2D and Table 2), Further, both modules possessed a significant relationship between MM and GS (Figure 2E). At the same time, we identified 3654 upregulated lncRNAs and 1223 downregulated lncRNAs (Figure 2F). By intersecting them with lncRNAs in brown and blue modules, respectively, we obtained 610 lncRNAs positively correlated with ccRCC, and 767 lncRNAs with a negative relation to ccRCC.
TABLE 2.
The details of lncRNA modules created by WGCNA. Module Size indicated the number of genes in a module
| Module | Blue | Brown | Green | Grey | Red | Turquoise | Yellow |
|---|---|---|---|---|---|---|---|
| Module size | 1424 | 744 | 125 | 3014 | 92 | 2806 | 127 |
3.5. Development of dysregulated ceRNA network
A total of 2191 ccRCC‐specific mRNAs and 1377 ccRCC‐specific lncRNAs was included in the construction of dysregulated ceRNA network. Then the interaction between lncRNAs and miRNAs was identified using miRcode, following StarBase, miRTarBase, and TargetScan databases were applied to demonstrate the targeted miRNA of cancer‐specific mRNAs. At the same time, miRNA sequencing data from TCGA was employed to review the top 10% expressed miRNA, we only included triple lncRNAs‐miRNAs‐mRNAs with miRNA in the above miRNAs. Consequently, a dysregulated ceRNA network for ccRCC was established using 7 mRNAs, 363 lncRNAs, and 3 miRNAs (Figure 3).
FIGURE 3.
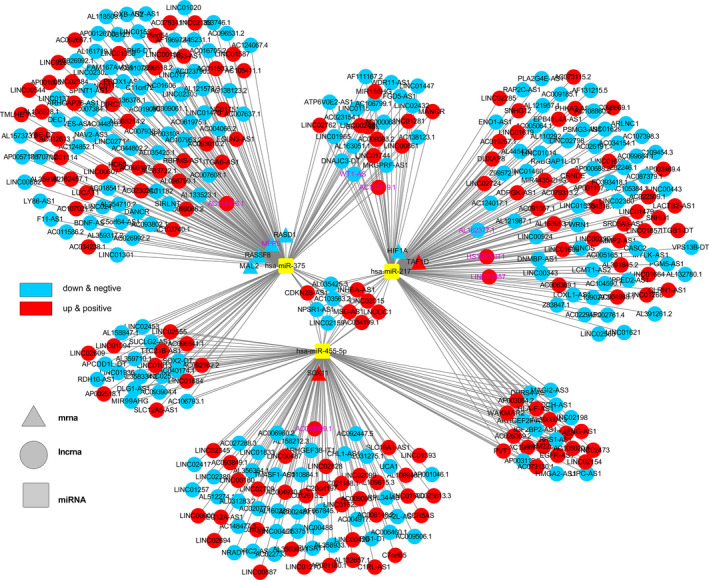
A lncRNA‐miRNA‐mRNA ceRNA network was constructed by 363 lncRNAs, 3 miRNAs, and 7 mRNAs. Further determined genes in prognostic gene signature were labeled in purple color
3.6. Construction of gene signature using genes in the ceRNA network
A total of 344 ccRCC patients with the expression levels of genes in the dysregulated ceRNA network were included in the construction of the gene signature. We randomly classified patients into two groups: a discovery group (n = 210) and a validation group (n = 134). Meanwhile, the univariate Cox proportional hazards model was applied to both lncRNAs and mRNAs in the dysregulated ceRNA network to screen for genes as biomarkers which significantly influence overall survival and prognosis in discovery group. Consequently, we obtained 21 genes including 1 mRNA and 20 lncRNAs with the threshold of p‐value <0.01, subsequently these genes were applied into Lasso with a lambda based on Cross‐Validation (Figure 4A) using glmnet.27 Finally, we obtained eight genes, namely MPP5, WT1‐AS, AC114316.1, AC103719.1, AL162377.1, HS1BP3‐IT1, LINC02657, and AC015909.1. The expression level of these genes associated with clinical characteristics was also depicted in a heatmap (Figure 4B). Furthermore, we also compared the expression levels between ccRCC and normal control samples (Figure 4C). A risk score was constructed based on Lasso Cox model coefficients and the gene expression levels (risk score = 0.102*LINC02657–0.183*MPP5 + 0.0979*WT1‐AS–0.111*AL162377.1 + 0.000866*AC015909.1–0.0372*AC103719.1–0.0357*HS1BP3‐IT1–0.0352*AC114316.1). The risk scores, overall survival time, and expression levels of model genes was explored in Figure 5A–C, and the clinical characteristics between groups determined by median risk scores were shown in Table 3.
FIGURE 4.
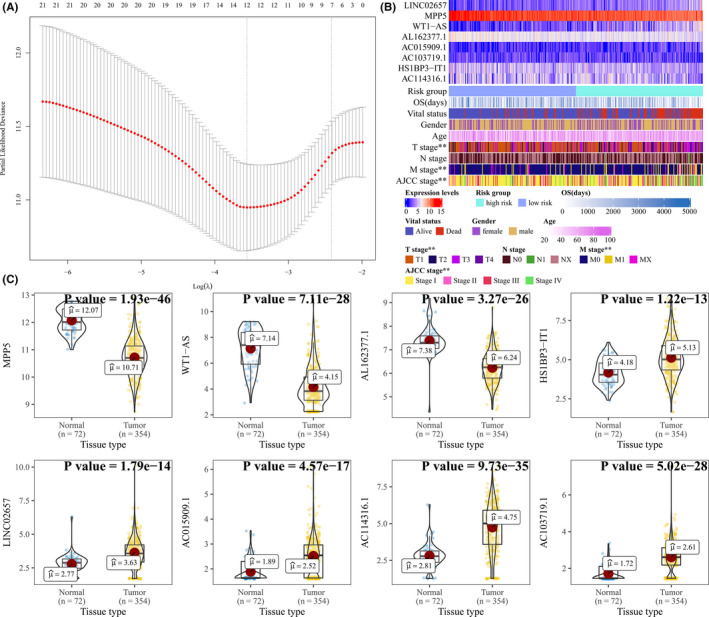
A gene signature based on ccRCC‐specific ceRNA network was developed. (A) Coefficient paths for Lasso regression model in dependence on log(λ). (B) The expression levels of eight genes in gene signature associated with clinical characteristics were also depicted in a heatmap. The risk group of high risk and low risk was based on median risk scores. Categorical variables were tested by Chi‐squared and continuous variables were tested by analysis of variance, label (*) means p < 0.05, label (**) means p < 0.01, and label (***) means p < 0.001. (C) The differential expression of the eight genes in the gene signature was compared
FIGURE 5.
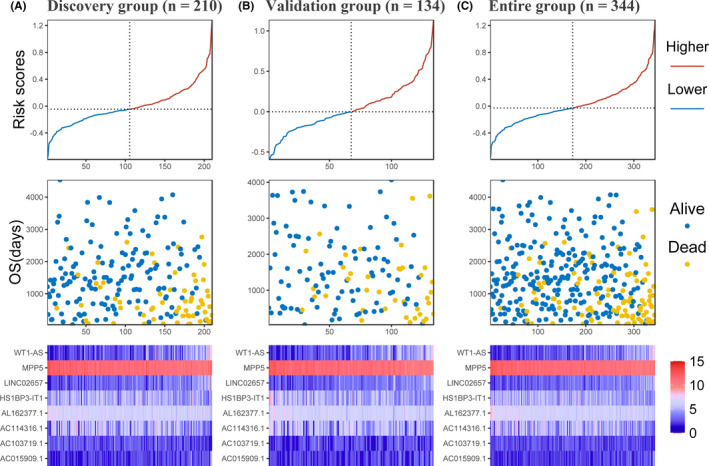
Analysis of gene signature risk score in ccRCC patients. (A) Discovery group (B) validation group (C) entire group. The samples ranked according to risk scores correspond to x‐axis. Each panel consists of three rows: top row, y‐axis represents risk scores, and the risk group of higher and lower was based on median risk scores; middle row, y‐axis represents overall survival time in days; bottom row, heatmap showing the expression of the eight key genes. The color from blue to red shows the expression levels from lower to higher
TABLE 3.
Relationship between clinicopathological characteristics and risk score calculated by using the eight‐gene signature
| Level | Low risk | High risk | p | |
|---|---|---|---|---|
| N | 172 | 172 | ||
| Vital status (%) | Alive | 151 (87.8) | 93 (54.1) | <0.001 |
| Dead | 21 (12.2) | 79 (45.9) | ||
| OS (mean [SD]) | 1515.10 (1008.39) | 1308.04 (971.94) | 0.053 | |
| Gender (%) | Female | 57 (33.1) | 68 (39.5) | 0.262 |
| Male | 115 (66.9) | 104 (60.5) | ||
| Ages (mean [SD]) | 60.40 (12.48) | 60.88 (11.64) | 0.711 | |
| T stage (%) | T1 | 114 (66.3) | 81 (47.1) | 0.005 |
| T2 | 20 (11.6) | 29 (16.9) | ||
| T3 | 36 (20.9) | 58 (33.7) | ||
| T4 | 2 (1.2) | 4 (2.3) | ||
| N stage (%) | N0&NX | 172 (100.0) | 168 (97.7) | 0.131 |
| N1 | 0 (0.0) | 4 (2.3) | ||
| M stage (%) | M0&MX | 158 (91.9) | 139 (80.8) | 0.005 |
| M1 | 14 (8.1) | 33 (19.2) | ||
| AJCC stage (%) | Stage I | 114 (66.3) | 79 (45.9) | 0.001 |
| Stage II | 18 (10.5) | 21 (12.2) | ||
| Stage III | 25 (14.5) | 36 (20.9) | ||
| Stage IV | 15 (8.7) | 36 (20.9) | ||
| Gene signature (mean [SD]) | −0.21 (0.15) | 0.24 (0.25) | <0.001 |
The group of low risk and high risk was based on a cut point of median risk scores. Categorical variables were tested by Chi‐squared and continuous variables were tested by analysis of variance.
3.7. Estimation and validation of gene signature
To validate gene signature, we searched expression levels of genes contributing to the risk scores in the GSE76207 (p‐value: 3.05e‐05) and GSE82122 (p‐value: 4.88e‐04) which indicated the significance of MPP5 to ccRCC (Figure 6A). Protein levels of MPP5 between renal cancer and normal control samples were also verified in The Human Protein Atlas (Figure 6B). Furthermore, we calculated the C‐index for the prognostic model in discovery group (0.741, 95% CI, 0.678–0.805), ROC revealed the areas under ROC (AUC) among 1‐, 3‐, and 5‐ year were 0.780 (95% CI: 0.672–0.888), 0.785 (95% CI: 0.701–0.868), and 0.730 (95% CI: 0.633–0.827), respectively (Figure 7A). Kaplan–Meier analysis in discovery group also presented statistical significance that patients with predicted high risk showed shorter OS than those with low risk (p‐value: 5.41e‐05, Figure 7B). ROC analysis was conducted in both validation group (AUC at 1‐, 3‐, and 5‐year: 0.888, 0.743, and 0.791) and entire group (AUC at 1‐, 3‐, and 5‐year: 0.805, 0.765, and 0.757) (Figure 7A). Following, Kaplan–Meier analysis was conducted in validation group and entire group which both suggested prognostic significance to overall survival (Figure 7B). Moreover, C‐index analysis in validation group and entire group presented 0.754 (95% CI, 0.677–0.831) and 0.742 (95% CI, 0.691–0.792), respectively and the corrected C‐index adjusted by bootstrap was 0.721 (Table 4), which further confirmed the accuracy of the gene signature. Finally, ROC analysis was used with reference to genes in prognostic model in entire group data, which presented that WT1‐AS (0.70, 95% CI: 0.58−0.81) could provide the best prediction of 1 year survival, LINC02657 performed best in 3‐year (0.67, 95% CI: 0.59−0.75) survival and 5‐year survival (0.67, 95% CI: 0.59−0.75) (Figure 7C).
FIGURE 6.
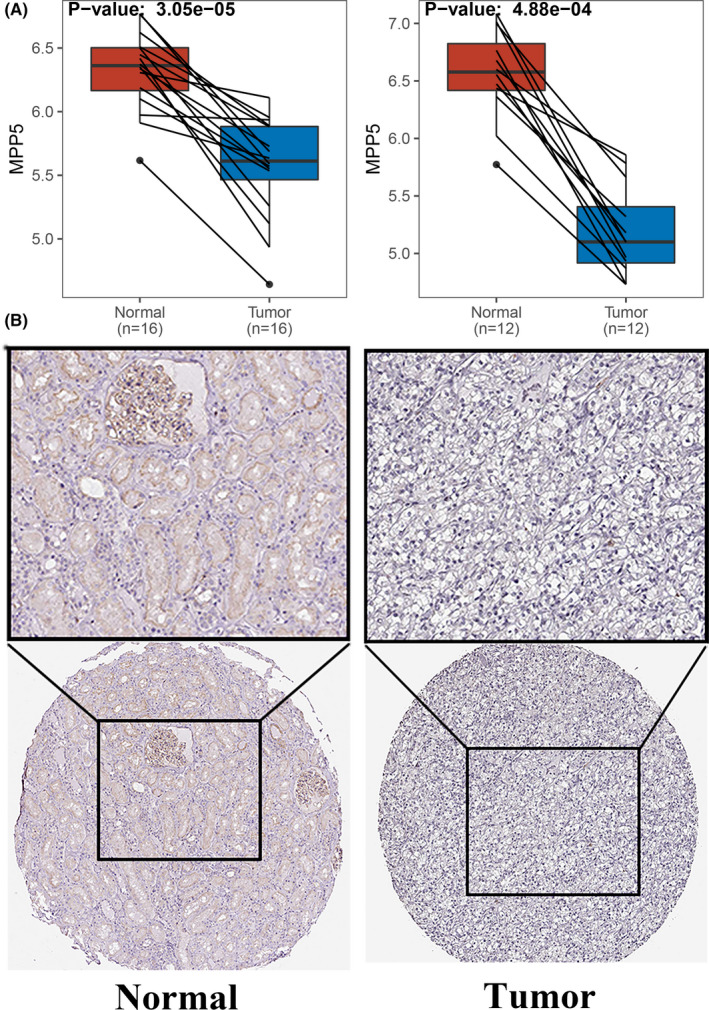
The expression levels of MPP5 in GEO and The Human Protein Atlas. (A) Boxplot of MPP5 in GSE76207 (Left panel) and GSE82122 (Right panel). p‐value was calculated by paired Wilcoxon Rank Sum test. (B) Differential protein level of MPP5 based on the human protein atlas
FIGURE 7.
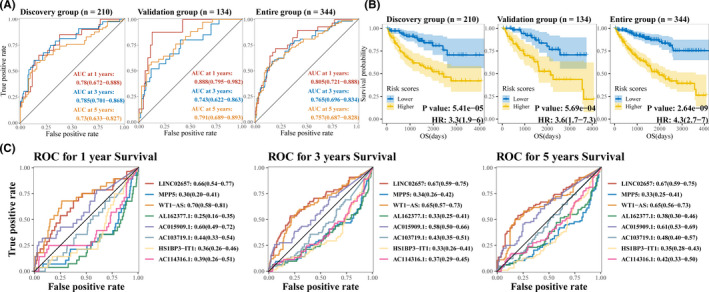
Estimation and validation of gene signature. (A)Time‐dependent ROC curve for predicting 1‐, 3‐, and 5‐year survival with gene signature in discovery group, validation group and entire group. AUC along with 95% CI was displayed. (B) Kaplan–Meier survival curves showing overall survival outcomes for the high‐ and low‐risk patients in discovery group, validation group and entire group, the risk group of high risk and low risk was based on median risk scores based on gene signature. (C) Time‐dependent ROC curve for predicting 1‐, 3‐, and 5‐year survival with genes in the gene signature was explored in the entire group
TABLE 4.
Validation of gene signature and nomogram based on bootstrap methods. C‐index(orig) indicated C‐index based on the original data for gene signature or nomogram
| C‐index(orig) | Training | Test | Optimism | Index.corrected | |
|---|---|---|---|---|---|
| Gene signature | 0.742 | 0.766 | 0.745 | 0.021 | 0.721 |
| Nomogram | 0.809 | 0.81 | 0.804 | 0.006 | 0.803 |
The column training represented C‐index based on bootstrap model and bootstrap sample. The column test represented C‐index based on bootstrap model and original data, optimism denoted to C‐index(training)–C‐index(test) which was regarded as the evaluation of overfitting. The corrected C‐index was C‐index(orig) subtracted optimism.
3.8. Building and validation of a prognostic nomogram
Univariate Cox regression analysis showed that gene signature, ages, T stage, M stage, N stage, and AJCC stage were significantly related to the overall survival (p < 0.05), and multivariate Cox analysis further revealed that ages, N stage, and gene signature were independent risk factors. Meanwhile, a stepwise Cox regression model was employed to develop a nomogram predicting the 1‐, 3‐, and 5‐year OS for ccRCC patients (Figure 8A) with a C‐index 0.809 (95% CI, 0.696–0.887), we also depicted the calibration curve for 1‐, 3‐, and 5‐year survival probability (Figure 8B) which collectively indicated a good accuracy of the prognostic nomogram. Bootstrap validation further authenticated the performance of this nomogram (corrected C‐index: 0.803) (Table 4).
FIGURE 8.
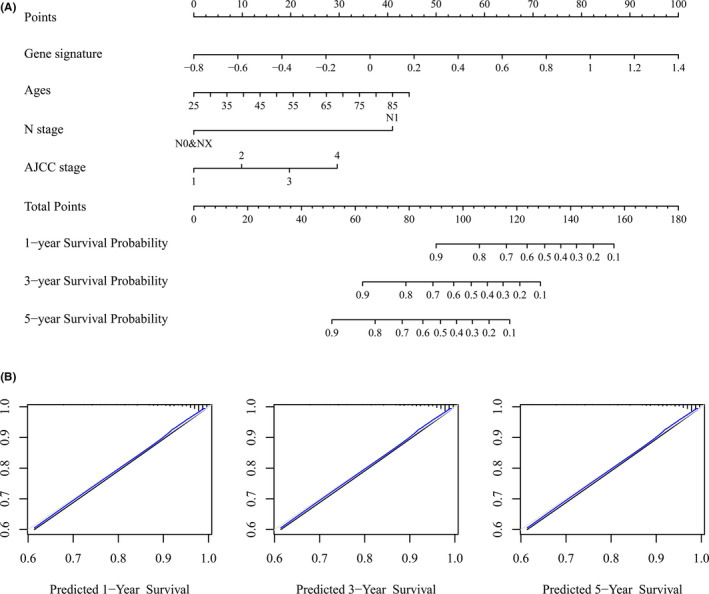
Building and validation of a prognostic nomogram. (A) Nomogram based on gene signatures, ages, N stage, and AJCC stage for 1‐, 3‐, and 5‐year OS prediction. The number from 1 to 4 in AJCC stage represents AJCC stage I, II, III, and IV, respectively (B) Calibration plot for agreement test between 1‐, 3‐, and 5‐year OS prediction and actual observation
4. DISCUSSION
Kidney cancer accounted for 338,000 new cases and 144,000 deaths each year.1 The most common subtype of kidney cancer ccRCC, is a complex tumor with different clinical and pathological features, genetic variation, DNA methylation profiles, and RNA and proteomic signatures.28 Nevertheless, the TNM staging system, the most used risk assessment system for ccRCC patients, failed to consider these genomic variation of ccRCC which makes it not perfect for accurately predicting the prognosis of ccRCC patients.29
The novel hypothesis of gene expression regulation has been confirmed to be related to the mechanism of varied diseases, especially cancer. The disturbance of the equipoise of ceRNA network was of vital importance for tumorigenesis. In gallbladder cancer, the lncRNA PVT1 which was positively related to malignancies and worse overall survival time was upregulated in gallbladder cells. PVT1 and HK2 act as a ceRNA of miR‐143, which could regulate aerobic glucose metabolism in gallbladder cancer cells, and promote cell proliferation and metastasis.30 PTAR acts as a ceRNA of miR‐101 which promotes tumorigenicity and metastasis of ovarian cancer in vivo.31 LncRNA DANCR functions as a ceRNA in osteosarcoma which could promote cell proliferation and metastasis.32 MT1JP, which severs as a ceRNA regulating FBXW7 expression, could influence the progression of gastric cancer.33 Thus, ceRNA network containing crucial biomarkers was of vital importance in tumorigenesis. Importantly, lncRNA‐miRNA‐mRNA dysregulated ceRNA network played a vital role in predicting disease prognosis. For example, in pancreatic cancer, 11 lncRNAs have been found and validated to function well in predicting prognosis.34 Seven genes (LPP‐AS2, MUC1, GAB2, hsa‐let‐7i‐5p, hsa‐let‐7f‐5p, hsa‐miR‐101‐3p, and hsa‐miR‐1226‐3p) in a recurrent soft tissue sarcoma‐specific ceRNA network associated with recurrence and survival were identified based on the TCGA database.35 Although there were many studies on ceRNA networks conducted in numerous cancers, nevertheless, few of them were related to ccRCC.
In this study, ccRCC‐specific mRNAs and lncRNAs, including 2191 mRNAs and 1377 lncRNAs, were identified by WGCNA and DESeq2. Functional enrichment analysis revealed these mRNAs involved in MAPK signaling pathway and PI3K‐Akt signaling pathway both of which have been reported to tightly implicated in the progression and metastasis of malignancy.36, 37, 38, 39 Sunitinib and axitinib, the most common targeted drugs related to MAPK signaling pathway, were used extensively in renal cancer.40 GSEA suggested that these mRNAs were highly involved in multiply immune‐related function and pathways, like neutrophil‐mediated immunity, immune response‐activating signal transduction, and neutrophil activation in biological process and Cytokine‐cytokine receptor interaction and Human T‐cell leukemia virus 1 infection in KEGG, this may imply the importance to ccRCC of immune infiltration, which has been validated to play vital role in tumor growth and progression.41, 42 Importantly, axitinib plus immune checkpoint inhibitor has made great success in treating renal carcinoma.43, 44 Our findings may provide evidence for the combination of tyrosine kinase inhibitors and immunotherapy.
Subsequently, the dysregulated ceRNA network consisting of 363 lncRNAs, 3 miRNAs, and 7 mRNAs was determined by MiRcode, StarBase, miRTarBase, and TargetScan databases. To further explore the relationships with prognosis of these 370 genes (mRNA and lncRNA in the ceRNA network), a gene signature with eight genes, namely MPP5, WT1‐AS, AC114316.1, AC103719.1, AL162377.1, HS1BP3‐IT1, LINC02657, and AC015909.1, was determined by univariate Cox proportional hazard regression, Lasso and multivariate Cox proportional hazard regression analysis. The discriminations and accuracy of the gene signature were validated with C‐index and time‐dependent ROC curve, which all suggested that the eight genes in the model could act as biomarkers based on the patients’ prognosis. Moreover, bootstrap validations also authenticated the good performance of the gene signature.
Among the eight genes in the gene signature, the exclusive mRNA MPP5, which is associated with the membrane‐associated guanylate kinase family helping the construction of cell polarity, had been validated to be associated with the maintenance of cell polarity, invasion, and cell division in prostate cancer,45 meanwhile, disruption of apical protein MPP5, which could negatively regulate YAP/TAZ abundance and activity, might promote the enrichment of oncogenic YAP and TAZ in hepatocellular carcinoma.46 The loss of MPP5 is a hallmark of cancer is crucial for tissue organization, corresponded to the downregulated expression in ccRCC. Long noncoding RNA WT1‐AS which functioned as a potential tumor suppressor was related to poor survival in cervical squamous cell carcinoma474849 and triple‐negative breast cancer (TNBC).50 For lncRNA HS1BP3‐IT1, it may be a prognosis biomarker for cholangiocarcinoma,51 laryngeal cancer,52 respectively. LINC02657 has been named as LASTR (lncRNA associated with SART3 regulation of splicing), which was reported to decline the fitness of cancer cells by inducing intron retention.53 Therefore, our prediction of the ceRNA network had great confirmation of previous studies.
Nomograms were widely used as prognostic tools in oncology and medicine. By including various prognosis‐associated variables and generating survival probability, nomograms can help clinicians make better treatment decisions.54 In the present study, by including gene signature based on the dysregulated ceRNA network and other related clinical characteristics into a stepwise Cox model, a concise nomogram for the prognostic prediction of ccRCC was developed, meanwhile, C‐index 0.809 (95% CI, 0.696–0.887) and calibration curve (Figure 8B) all suggested its perfect discriminations and calibrations. Bootstrap validation (corrected C‐index: 0.803) (Table 4) for the nomogram further strengthened the effect in predicting the prognosis of ccRCC comparing with Jiang's nomogram (C‐index 0.79; 95% CI 0.75–0.82).55
However, there are still some limitations in our study. Although the prognostic dysregulated‐ceRNA‐related gene signature and nomogram were validated by internal dataset and bootstrap, the exact mechanism of the eight genes in the gene signature have not been explored in the current study and an externally validated dataset is necessary for both gene signature and nomogram. Therefore, further efforts to investigate the exact function of eight genes in ccRCC in vitro and in vivo and external validation based on a larger sample size are still required to make our findings more convincible, which is also the direction of our future work.
5. Conclusions
In conclusion, a ccRCC‐specific dysregulated ceRNA network was developed, followed by the determination of an eight‐gene signature, which will help us better understand dysregulated ceRNA network‐mediated pathway in ccRCC. Moreover, the development of nomogram, including both clinical characteristics and ccRCC‐specific gene signatures, could accurately predict 1‐, 3‐, and 5‐year OS of ccRCC, it could contribute to a better understanding of ccRCC tumorigenesis mechanism and guide clinicians to make a better treatment decision.
CONFLICT OF INTEREST
None.
Supporting information
Figure S1
Figure S2
Figure S3
ACKNOWLEDGMENTS
This work was supported by the National Natural Science Foundation of China (program no. 81572543) and the Science and Technology Support Program of Tianjin, China (Grant No. 17ZXMFSY00040).
Peng Y, Wu S, Xu Z, et al. A prognostic nomogram based on competing endogenous RNA network for clear‐cell renal cell carcinoma. Cancer Med. 2021;10:5499–5512. 10.1002/cam4.4109
DATA AVAILABILITY STATEMENT
The datasets analyzed for this study can be found in the GTEx (https://www.gtexportal.org/home/datasets), TCGA (https://portal.gdc.cancer.gov/), and GEO (https://www.ncbi.nlm.nih.gov/geo/) databases.
REFERENCES
- 1.Ferlay J, Soerjomataram I, Dikshit R, et al. Cancer incidence and mortality worldwide: sources, methods and major patterns in GLOBOCAN 2012. Int J Cancer. 2015;136(5):E359‐E386. [DOI] [PubMed] [Google Scholar]
- 2.Ficarra V, Galfano A, Mancini M, Martignoni G, Artibani W. TNM staging system for renal‐cell carcinoma: current status and future perspectives. Lancet Oncol. 2007;8(6):554‐558. [DOI] [PubMed] [Google Scholar]
- 3.Qi X, Zhang DH, Wu N, Xiao JH, Wang X, Ma W. ceRNA in cancer: possible functions and clinical implications. J Med Genet. 2015;52(10):710‐718. https://www.ncbi.nlm.nih.gov/pubmed/26358722/ [DOI] [PubMed] [Google Scholar]
- 4.Ala U, Karreth FA, Bosia C, et al. Integrated transcriptional and competitive endogenous RNA networks are cross‐regulated in permissive molecular environments. Proc Natl Acad Sci USA. 2013;110(18):7154‐7159. [DOI] [PMC free article] [PubMed] [Google Scholar]
- 5.Prensner JR, Chinnaiyan AM. The emergence of lncRNAs in cancer biology. Cancer Discov. 2011;1(5):391‐407. https://www.ncbi.nlm.nih.gov/pubmed/22096659/ [DOI] [PMC free article] [PubMed] [Google Scholar]
- 6.Langfelder P, Horvath S. WGCNA: an R package for weighted correlation network analysis. BMC Bioinformatics. 2008;9(1):559. [DOI] [PMC free article] [PubMed] [Google Scholar]
- 7.GTEx Portal . Available from: https://www.gtexportal.org/home/
- 8.GDC TCGA portal . Available from: https://portal.gdc.cancer.gov/
- 9.Colaprico A, Silva TC, Olsen C, et al. TCGAbiolinks: an R/Bioconductor package for integrative analysis of TCGA data. Nucleic Acids Res. 2016;44(8):e71. https://www.ncbi.nlm.nih.gov/pubmed/26704973 [DOI] [PMC free article] [PubMed] [Google Scholar]
- 10.Mounir M, Lucchetta M, Silva TC, et al. New functionalities in the TCGAbiolinks package for the study and integration of cancer data from GDC and GTEx. PLOS Comput Biol. 2019;15(3):e1006701. [DOI] [PMC free article] [PubMed] [Google Scholar]
- 11.Zerbino DR, Achuthan P, Akanni W, et al. Ensembl 2018. Nucleic Acids Res. 2018;46(D1):D754‐D761. [DOI] [PMC free article] [PubMed] [Google Scholar]
- 12.R Core Team . R: A Language and Environment for Statistical Computing. Vienna, Austria: R Foundation for Statistical Computing; 2020. Available from: https://www.R‐project.org/
- 13.Langfelder P, Horvath S. Fast R functions for robust correlations and hierarchical clustering. J Stat Softw. 2012;46(11):i11. [PMC free article] [PubMed] [Google Scholar]
- 14.miRcode ‐ transcriptome‐wide microRNA target prediction including lncRNAs . Available from: http://www.mircode.org/
- 15.Jeggari A, Marks DS, Larsson E. miRcode: a map of putative microRNA target sites in the long non‐coding transcriptome. Bioinformatics. 2012;28(15):2062‐2063. https://academic.oup.com/bioinformatics/article/28/15/2062/238391 [DOI] [PMC free article] [PubMed] [Google Scholar]
- 16.Gong J, Shao D, Xu K, et al. RISE: a database of RNA interactome from sequencing experiments. Nucleic Acids Res. 2018;46(D1):D194‐D201. [DOI] [PMC free article] [PubMed] [Google Scholar]
- 17.ENCORI: The Encyclopedia of RNA Interactomes . Available from: http://starbase.sysu.edu.cn/
- 18.TargetScanHuman 7.2 . Available from: http://www.targetscan.org/vert_72/
- 19.miRTarBase: the experimentally validated microRNA‐target interactions database . Available from: http://mirtarbase.cuhk.edu.cn/php/download.php
- 20.Emmert‐Streib F, Dehmer M. High‐dimensional LASSO‐based computational regression models: regularization, shrinkage, and selection. Mach Learn Knowl Extr. 2019;1(1):359‐383. [Google Scholar]
- 21.Harrell FE, Lee KL, Mark DB. Multivariable prognostic models: issues in developing models, evaluating assumptions and adequacy, and measuring and reducing errors. Stat Med. 1996;15(4):361‐387. [DOI] [PubMed] [Google Scholar]
- 22.Lee Y, Bang H, Kim DJ. How to establish clinical prediction models. Endocrinol Metab. 2016;31(1):38‐44. [DOI] [PMC free article] [PubMed] [Google Scholar]
- 23.Yu G, Wang L‐G, Han Y, He Q‐Y. clusterProfiler: an R package for comparing biological themes among gene clusters. OMICS J Integr Biol. 2012;16(5):284‐287. [DOI] [PMC free article] [PubMed] [Google Scholar]
- 24.Ashburner M, Ball CA, Blake JA, et al. Gene ontology: tool for the unification of biology. Nat Genet. 2000;25(1):25‐29. [DOI] [PMC free article] [PubMed] [Google Scholar]
- 25.Resource TGO. 20 years and still GOing strong. Nucleic Acids Res. 2019;47(D1):D330‐D338. [DOI] [PMC free article] [PubMed] [Google Scholar]
- 26.Kanehisa M, Goto S. KEGG: kyoto encyclopedia of genes and genomes. Nucleic Acids Res. 2000;28(1):27‐30. [DOI] [PMC free article] [PubMed] [Google Scholar]
- 27.Simon N, Friedman J, Hastie T, Tibshirani R. Regularization paths for Cox’s proportional hazards model via coordinate descent. J Stat Softw. 2011;39(5). http://www.jstatsoft.org/v39/i05/ [DOI] [PMC free article] [PubMed] [Google Scholar]
- 28.Cancer Genome Atlas Research Network . Comprehensive molecular characterization of clear cell renal cell carcinoma. Nature. 2013;499(7456):43‐49. [DOI] [PMC free article] [PubMed] [Google Scholar]
- 29.Moch H, Artibani W, Delahunt B, et al. Reassessing the current UICC/AJCC TNM staging for renal cell carcinoma. Eur Urol. 2009;56(4):636‐643. [DOI] [PubMed] [Google Scholar]
- 30.Chen J, Yu Y, Li H, et al. Long non‐coding RNA PVT1 promotes tumor progression by regulating the miR‐143/HK2 axis in gallbladder cancer. Mol Cancer. 2019;18(1):33. [DOI] [PMC free article] [PubMed] [Google Scholar]
- 31.Liang H, Yu T, Han Y, et al. LncRNA PTAR promotes EMT and invasion‐metastasis in serous ovarian cancer by competitively binding miR‐101‐3p to regulate ZEB1 expression. Mol Cancer. 2018;17(1):119. [DOI] [PMC free article] [PubMed] [Google Scholar]
- 32.Wang Y, Zeng X, Wang N, et al. Long noncoding RNA DANCR, working as a competitive endogenous RNA, promotes ROCK1‐mediated proliferation and metastasis via decoying of miR‐335‐5p and miR‐1972 in osteosarcoma. Mol Cancer. 2018;17(1):89. [DOI] [PMC free article] [PubMed] [Google Scholar]
- 33.Zhang G, Li S, Lu J, et al. LncRNA MT1JP functions as a ceRNA in regulating FBXW7 through competitively binding to miR‐92a‐3p in gastric cancer. Mol Cancer. 2018;17(1):87. [DOI] [PMC free article] [PubMed] [Google Scholar]
- 34.Giulietti M, Righetti A, Principato G, Piva F. LncRNA co‐expression network analysis reveals novel biomarkers for pancreatic cancer. Carcinogenesis. 2018;39(8):1016‐1025. [DOI] [PubMed] [Google Scholar]
- 35.Huang R, Meng T, Chen R, et al. The construction and analysis of tumor‐infiltrating immune cell and ceRNA networks in recurrent soft tissue sarcoma. Aging. 2019;18:11. [DOI] [PMC free article] [PubMed] [Google Scholar]
- 36.Burotto M, Chiou VL, Lee J‐M, Kohn EC. The MAPK pathway across different malignancies: a new perspective. Cancer. 2014;120(22):3446‐3456. [DOI] [PMC free article] [PubMed] [Google Scholar]
- 37.Drosten M, Barbacid M. Targeting the MAPK pathway in KRAS‐driven tumors. Cancer Cell. 2020;37(4):543‐550. [DOI] [PubMed] [Google Scholar]
- 38.Kurtzeborn K, Kwon HN, Kuure S. MAPK/ERK Signaling in regulation of renal differentiation. Int J Mol Sci. 2019;20(7):1779. https://www.ncbi.nlm.nih.gov/pmc/articles/PMC6479953/ [DOI] [PMC free article] [PubMed] [Google Scholar]
- 39.Huang D, Ding Y, Luo W‐M, et al. Inhibition of MAPK kinase signaling pathways suppressed renal cell carcinoma growth and angiogenesis in vivo. Cancer Res. 2008;68(1):81‐88. [DOI] [PubMed] [Google Scholar]
- 40.Li W, Feng C, Di W, et al. Clinical use of vascular endothelial growth factor receptor inhibitors for the treatment of renal cell carcinoma. Eur J Med Chem. 2020;200:112482. [DOI] [PubMed] [Google Scholar]
- 41.Quail D, Joyce J. Microenvironmental regulation of tumor progression and metastasis. Nat Med. 2013;19(11):1423‐1437. [DOI] [PMC free article] [PubMed] [Google Scholar]
- 42.Brassart‐Pasco S, Brézillon S, Brassart B, Ramont L, Oudart J‐B, Monboisse JC. Tumor microenvironment: extracellular matrix alterations influence tumor progression. Front Oncol. 2020;10. https://www.frontiersin.org/articles/10.3389/fonc.2020.00397/full [DOI] [PMC free article] [PubMed] [Google Scholar]
- 43.Grünwald V, Voss MH, Rini BI, et al. Axitinib plus immune checkpoint inhibitor: evidence‐ and expert‐based consensus recommendation for treatment optimisation and management of related adverse events. Br J Cancer. 2020;123(6):898‐904. [DOI] [PMC free article] [PubMed] [Google Scholar]
- 44.Rizzo A, Mollica V, Santoni M, et al. Impact of clinicopathological features on survival in patients treated with first‐line immune checkpoint inhibitors plus tyrosine kinase inhibitors for renal cell carcinoma: a meta‐analysis of randomized clinical trials. Eur Urol. Focus. 2021. [DOI] [PubMed] [Google Scholar]
- 45.Teles Alves I, Hartjes T, McClellan E, et al. Next‐generation sequencing reveals novel rare fusion events with functional implication in prostate cancer. Oncogene. 2015;34(5):568‐577. [DOI] [PubMed] [Google Scholar]
- 46.Tóth M, Wan S, Weiler S, et al. MPP5 (Membrane Palmitoylated Protein 5), a novel upstream regulator of yes‐associated protein (YAP) and its paralogue TAZ. Zeitschrift für Gastroenterologie. 2018;56(01):E2‐E89. http://www.thieme‐connect.de/DOI/DOI?10.1055/s‐0037‐1612820 [Google Scholar]
- 47.Zhang Y, Na R, Wang X. LncRNA WT1‐AS up‐regulates p53 to inhibit the proliferation of cervical squamous carcinoma cells. BMC Cancer. 2019;19(1):1052. [DOI] [PMC free article] [PubMed] [Google Scholar]
- 48.Dai S‐G, Guo L‐L, Xia X, Pan Y. Long non‐coding RNA WT1‐AS inhibits cell aggressiveness via miR‐203a‐5p/FOXN2 axis and is associated with prognosis in cervical cancer. Eur Rev Med Pharmacol Sci. 2019;23(2):486‐495. [DOI] [PubMed] [Google Scholar]
- 49.Cui L, Nai M, Zhang K, Li L, Li R. lncRNA WT1‐AS inhibits the aggressiveness of cervical cancer cell via regulating p53 expression via sponging miR‐330‐5p. Cancer Manag Res. 2019;11:651‐667. [DOI] [PMC free article] [PubMed] [Google Scholar]
- 50.Wang J, Xi C, Yang X, et al. LncRNA WT1‐AS inhibits triple‐negative breast cancer cell migration and invasion by downregulating transforming growth factor β1. Cancer Biother Radiopharm. 2019;34(10):671‐675. [DOI] [PubMed] [Google Scholar]
- 51.Song W, Miao D, Chen L. Comprehensive analysis of long noncoding RNA‐associated competing endogenous RNA network in cholangiocarcinoma. Biochem Biophys Res Commun. 2018;506(4):1004‐1012. [DOI] [PubMed] [Google Scholar]
- 52.Zhang G, Fan E, Zhong Q, et al. Identification and potential mechanisms of a 4‐lncRNA signature that predicts prognosis in patients with laryngeal cancer. Hum Genomics. 2019;13(1):36. [DOI] [PMC free article] [PubMed] [Google Scholar]
- 53.De Troyer L, Zhao P, Pastor T, et al. Stress‐induced lncRNA LASTR fosters cancer cell fitness by regulating the activity of the U4/U6 recycling factor SART3. Nucleic Acids Res. 2020;48(5):2502‐2517. [DOI] [PMC free article] [PubMed] [Google Scholar]
- 54.Balachandran VP, Gonen M, Smith JJ, DeMatteo RP. Nomograms in oncology: more than meets the eye. Lancet Oncol. 2015;16(4):e173‐e180. [DOI] [PMC free article] [PubMed] [Google Scholar]
- 55.Jiang W, Guo Q, Wang C, Zhu Y. A nomogram based on 9‐lncRNAs signature for improving prognostic prediction of clear cell renal cell carcinoma. Cancer Cell Int. 2019;19(1). https://www.ncbi.nlm.nih.gov/pmc/articles/PMC6683339/ [DOI] [PMC free article] [PubMed] [Google Scholar]
Associated Data
This section collects any data citations, data availability statements, or supplementary materials included in this article.
Supplementary Materials
Figure S1
Figure S2
Figure S3
Data Availability Statement
The datasets analyzed for this study can be found in the GTEx (https://www.gtexportal.org/home/datasets), TCGA (https://portal.gdc.cancer.gov/), and GEO (https://www.ncbi.nlm.nih.gov/geo/) databases.


