

Abstract
Tunneling nanotubes (TNTs) are actin‐rich structures that connect two or more cells and mediate cargo exchange between spatially separated cells. TNTs transport signaling molecules, vesicles, organelles, and even pathogens. However, the molecular mechanisms regulating TNT formation remain unclear and little is known about the endogenous mechanisms suppressing TNT formation in lung cancer cells. Here, we report that MICAL2PV, a splicing isoform of the neuronal guidance gene MICAL2, is a novel TNT regulator that suppresses TNT formation and modulates mitochondrial distribution. MICAL2PV interacts with mitochondrial Rho GTPase Miro2 and regulates subcellular mitochondrial trafficking. Moreover, down‐regulation of MICAL2PV enhances survival of cells treated with chemotherapeutical drugs. The monooxygenase (MO) domain of MICAL2PV is required for its activity to inhibit TNT formation by depolymerizing F‐actin. Our data demonstrate a previously unrecognized function of MICAL2 in TNT formation and mitochondrial trafficking. Furthermore, our study uncovers a role of the MICAL2PV‐Miro2 axis in mitochondrial trafficking, providing a mechanistic explanation for MICAL2PV activity in suppressing TNT formation and in modulating mitochondrial subcellular distribution.
Keywords: F‐actin, lung cancer, Miro2, mitochondria, tunneling nanotubes
Subject Categories: Cancer; Cell Adhesion, Polarity & Cytoskeleton; Membrane & Intracellular Transport
MICAL2PV suppress TNT formation and TNT‐mediated mitochondrial transfer in lung cancer cells. Down‐regulation of MICAL2PV promotes F‐actin polymerization, thereby increasing TNT formation and intercellular mitochondrial movement and distribution.
Introduction
Lung cancer is a leading cause of cancer‐related death worldwide. Approximately 85% of lung cancer cases present as non–small‐cell lung cancer (NSCLC) (Bray et al, 2018). Although significant progress has been made in lung cancer treatment, drug resistance is a major cause of cancer recurrence and poor prognosis (Kim, 2016). The molecular mechanisms underlying drug resistance remain to be elucidated.
Cell–cell communications regulate cell behavior, tissue development, and homeostasis under physiological conditions (Park et al, 2017; Siebel & Lendahl, 2017). Intercellular communication also plays a critical role in tumor adaption and progression. Various types of cell–cell communication have been reported that impact on tumor progression, including secreted factors, exosomes, gap junction, and cell–cell contacts. These mechanisms modulate communication between cancer cells and between cancer cells and cancer microenvironments, thereby promoting tumor proliferation, adaptation, invasion, and chemo‐resistance (Zhang & Grizzle, 2011; Mao et al, 2016; Wan et al, 2018). Recently, thin membrane protrusions have been demonstrated as an efficient means of intercellular communication by establishing direct contact between spatially separated cells. Different terms have been used to describe these membrane protrusions, such as cytonemes, tunneling nanotubes (TNTs), and microtubule‐based nanotubes (MT‐nanotubes) (Ramírez‐Weber & Kornberg, 1999; Rustom et al, 2004; Inaba et al, 2015; Yamashita et al, 2018).
Tunneling nanotubes (TNTs) were first reported by Rustom and colleagues to facilitate vesicle transfer (Rustom et al, 2004). TNTs can form by extension of bulging filopodia structures from one cell to another or by separation of two contacting cells (Sowinski et al, 2008; Hase et al, 2009; Wang et al, 2010; Wang et al, 2011). Structurally, TNTs are characterized by their enrichment in F‐actin and non‐attachment to the extracellular substrate (reviewed in McCoy‐Simandle et al, 2016; Dupont et al, 2018; Cordero Cervantes & Zurzolo, 2021). Functionally, TNTs are capable of transducing electric signals and transporting proteins, RNAs, vesicles, organelles, and even pathogens between non‐adjacent cells (Rustom et al, 2004; Watkins & Salter, 2005; Hase et al, 2009; Arkwright et al, 2010; Van Prooyen et al, 2010; Wang et al, 2012; Ahmad et al, 2014; Polak et al, 2015; Wang & Gerdes, 2015; Zhu et al, 2015). Emerging evidence supports a diverse role of TNTs in different physiological and pathological processes (Rustom, 2016; Lou et al, 2018; Pinto et al, 2020). TNT formation has been reported in different types of cells, including cancer cells. There have been recent reports of detecting membrane nanotubes and TNT‐like structures in vivo (e.g., Alarcon‐Martinez et al, 2020; Osswald et al, 2015; reviewed in Pinto et al, 2020). However, molecular mechanisms, especially the endogenous mechanisms, that control the TNT formation remain unclear.
MICAL (microtubule‐associated monooxygenase, calponin, and LIM domain containing) proteins, a family of evolutionarily conserved flavoprotein oxidoreductases, are encoded by 3 genes in the human genome: MICAL1, MICAL2, and MICAL3. In addition, a group of MICAL‐like proteins, including MICAL‐L1 and MICAL‐L2, have been identified, which lack the N‐terminal region of MICAL proteins (Zhou et al, 2011). Human MICAL1 was initially identified as a CasL‐interacting molecule associated with vimentin (Suzuki et al, 2002). In the same year, the Drosophila MICAL1 gene was reported (Terman et al, 2002). The Drosophila MICAL1 gene mediates axonal repulsion and bristle branching (Hung et al, 2010). Biochemical data show that MICALs bind to and depolymerize F‐actin, leading to signal transduction, cytoskeletal remodeling, and morphological changes in cells (Hung et al, 2010; Giridharan et al, 2012; Lundquist et al, 2014; Alto & Terman, 2018). Subsequent studies indicate that MICALs are multi‐functional proteins involved in a variety of biological processes (Alto & Terman, 2018; Cai et al, 2018). Splicing isoforms of MICAL2 have been reported in prostate cancer as prostate variants, MICAL2PV (Ashida et al, 2006). However, little is known about the molecular function of MICAL2 and the underlying mechanisms in lung cancer.
In this study, we demonstrate that MICAL2PV suppresses TNT formation in lung cancer cells and that down‐regulating MICAL2PV promotes TNT formation and reduces chemo‐drug‐induced cytotoxicity. MICAL2PV interacts with the outer mitochondrial membrane protein Miro2 (mitochondrial Rho GTPase 2). Down‐regulating MICAL2PV alters mitochondrial movement and distribution by enhancing mitochondrial localization of the Miro2 protein. Further experiments show that overexpression of the monooxygenase (MO) domain of MICAL2PV is sufficient to reduce TNT formation by depolymerizing F‐actin. Our results reveal, for the first time, that MICAL2PV acts as an endogenous suppressor of TNT formation and mitochondrial distribution in lung cancer cells, modulating responses of lung cancer cells to chemo‐drugs and likely suppressing chemo‐resistance of lung cancer cells.
Results
TNT formation in lung cancer cells
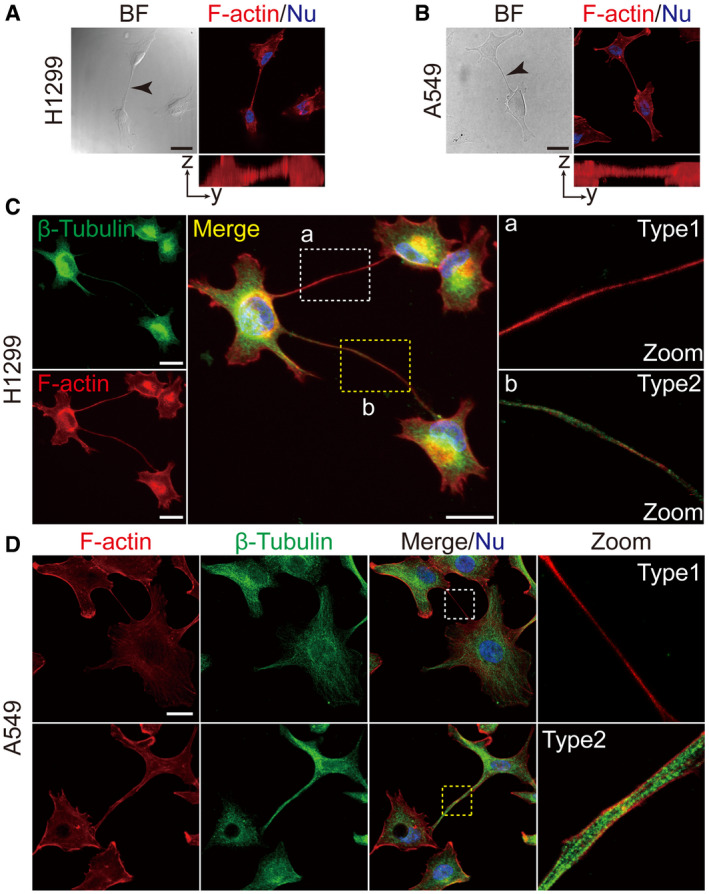
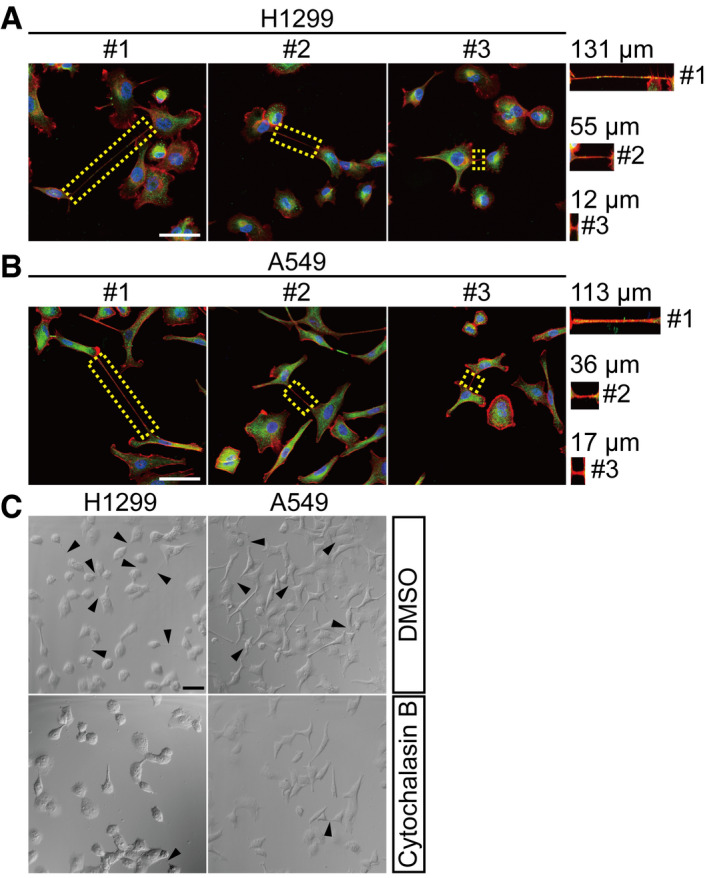
To examine TNT formation in lung cancer cells, a variety of human lung cancer cell lines were obtained from the American Type Culture Collection (see Methods). H1299 and A549 cells were chosen to represent TP53‐deficient (H1299) and K‐ras mutant (A549) lung cancer cells, respectively. H1299 and A549 cells were cultured on collagen‐coated glass coverslips and examined under confocal microscopy. Thin, membranous bridges connecting two cells were observed in both H1299 and A549 cell lines (left panels in Fig 1A and B). Because TNTs are characterized by enrichment in F‐actin and non‐attachment to the extracellular substrate (McCoy‐Simandle et al, 2016; Dupont et al, 2018), we examined these membranous structures following actin staining. Phalloidin staining revealed that these structures were rich in F‐actin and not attached to the extracellular substrate (see images in the x‐z plane; Fig 1A and B). In addition, Cytochalasin B, an actin inhibitor frequently used to characterize TNTs, efficiently reduced the formation of these structures (Fig EV1C). These results clearly demonstrate the formation of TNTs among lung cancer cells.
Figure 1. TNTs in lung cancer cell lines.
-
A, BRepresentative bright field images of TNTs in H1299 (A) and A549 (B) cells (black arrow). These TNTs were actin‐enriched, as shown by phalloidin staining (red) and not attached to the substrate (Y–Z axes). Scale bar: 20 μm.
-
C, DTwo types of TNTs were detected in H1299 (C) and A549 (D) cells, Type 1, containing F‐actin with little or no detectable microtubules (white box) and Type2, containing both microtubules and F‐actin (yellow box). Anti‐β‐tubulin antibody (green) and phalloidin (red) were used for fluorescent staining. Scale bar: 20 μm.
Data information: In (A‐D), nuclei were stained with Hoechst 33342 (blue). Boxed areas are enlarged and shown in panels on the right.
Figure EV1. TNTs of different lengths are formed between lung cancer cells.
-
A, BH1299 (A) and A549 (B) cells were stained with anti‐β‐tubulin (green) antibody and phalloidin (red) followed by fluorescent confocal microscopy. The dotted area marked TNTs with their lengths measured. Scale bar: 50 μm.
-
CH1299 and A549 cells were treated by Cytochalasin B (500 nM) for 24 h. TNT formation was observed by confocal microscopy. Black triangles marked TNTs. Scale bar: 50 μm.
Data information: In (A, B), nuclei were stained with Hoechst 33342 (blue).
Related to Fig 1.
Two types of TNTs have been reported, depending on whether they contain microtubules (Dubois et al, 2018; Panasiuk et al, 2018). Type1 TNTs contain actin filaments with little or no detectable microtubules, whereas type2 TNTs contain both actin filaments and microtubules. Both types of TNTs were observed in H1299 and A549 cells by fluorescent confocal microscopy (Fig 1C and D). In addition, TNTs are highly variable in lengths, ranging from a few to over a hundred micrometers, as observed in both H1299 and A549 cells (Fig EV1A and B).
MICAL2PV suppresses TNT formation
In gastric and renal cancer cells, it was reported that the full‐length isoform of MICAL2 enhanced migration and invasion of tumor cells by promoting epithelial–mesenchymal transition (Mariotti et al, 2016). When MICAL2 mRNA expression was examined in lung cancer samples and control lung tissue samples, however, the full‐length isoform of MICAL2 was not detectable, either in the control lung tissues or lung cancer samples. On the other hand, MICAL2PVa and MICAL2PVb, two splicing variants of MICAL2 originally found in prostate cancer (Ashida et al, 2006), were the main isoforms detectable in lung tissues and lung cancer samples. We, therefore, focused on these splicing isoforms, MICAL2PV, and designed specific shRNA constructs to down‐regulate MICAL2 in lung cancer cells. MICAL2PVa and MICAL2PVb share almost all predicted functional domains, including monooxygenase (MO), calponin‐homology (CH), and LIM domains. MICAL2PVa and MICAL2PVb behave similarly in all assays that we have used. In spite of our efforts, we have not been able to obtain specific antibodies that could distinguish MICAL2PVa from MICAL2PVb protein. For these reasons, we did not differentiate between the two isoforms in this study and refer to them as MICAL2PV (abbreviated as M2).
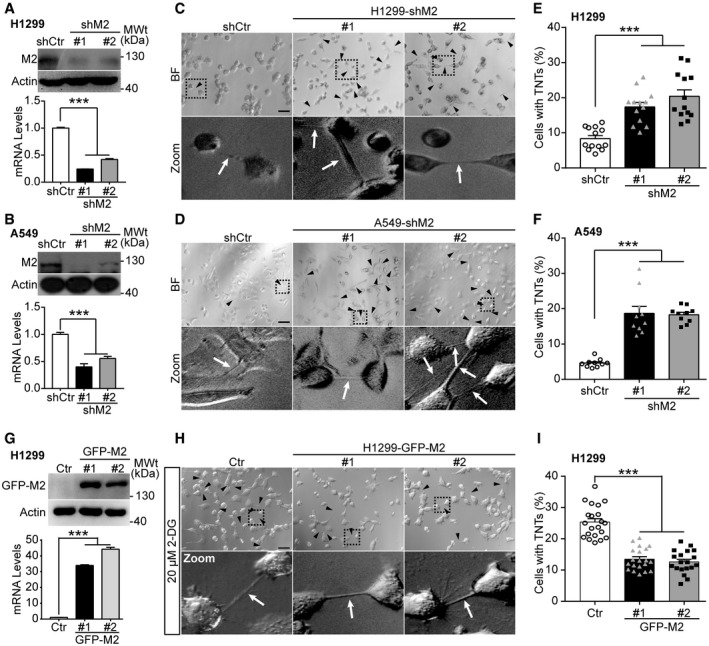
Previous studies show that actin polymerization is required for TNT formation and that MICAL2 regulates the actin cytoskeleton (Giridharan et al, 2012; Delage et al, 2016; Hanna et al, 2017). Therefore, we examined whether MICAL2PV could regulate TNT formation. We generated stable H1299 and A549 cell lines in which MICAL2PV was down‐regulated by two independent shRNAs (shM2#1 and shM2#2). The mRNA and protein levels of MICAL2PV were detected by quantitative RT–PCR (qRT–PCR) and Western blotting in these stable shM2 H1299 and A549 cells (Fig 2A and B). TNT formation was examined by confocal microscopy (Fig 2C and D). Quantitative analyses revealed that the percentage of cells forming TNTs was significantly increased upon down‐regulation of MICAL2PV in shM2 cells (Fig 2E and F).
Figure 2. Down‐regulating MICAL2PV expression increases TNT formation in lung cancer cells.
-
A, BMICAL2PV is down‐regulated in H1299 (A) and A549 (B) cells. H1299 and A549 cells stably expressing shRNAs against MICAL2PV (shM2) or a control shRNA (shCtr) were examined by Western blotting using an anti‐MICAL2PV antibody. MICAL2PV mRNA levels were detected by quantitative RT–PCR.
-
C, DTNT formation (marked by black triangles and white arrowheads) was imaged in control and shM2 H1299 (C) and shM2 A549 (D) cells by confocal microscopy. Scale bar: 60 μm. Boxed areas are enlarged and shown at the bottom of the corresponding images.
-
E, FQuantification of the percentage of cells forming TNTs in control and shM2 H1299 (E) and shM2 A549 (F) cells. 13 images per group (E) and 10 per group (F) were captured for quantification. Three independent experiments were conducted.
-
GH1299 cells were transfected with a GFP‐tagged MICAL2PVb vector (GFP‐M2) or control vector (Ctr) followed by Western blotting with an anti‐GFP antibody. The mRNA levels of MICAL2PV were measured by quantitative RT–PCR. Three independent experiments were conducted.
-
H, IH1299 cells stably expressing the Ctr or GFP‐M2 were cultured in the presence of 20 μM 2‐DG for 24 h to induce TNT formation. TNTs were imaged by confocal microscopy (H) and the percentage of cells forming TNTs was quantified (I). n = 21, 20, and 19 images were captured from Ctr, GFP‐M2#1, and GFP‐M2#2, respectively. Three independent experiments were performed. Scale bar: 60 μm.
Data information: In (A, B, E, F, I), data were analyzed by one‐way ANOVA with Bonferroni post‐test and shown as mean ± SEM; ***P < 0.001. Three independent experiments were performed.
Source data are available online for this figure.
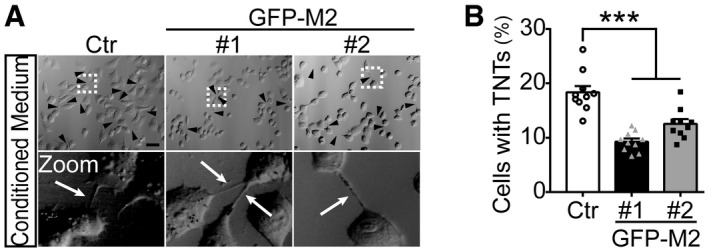
We next examined the effect of MICAL2PV on TNT formation in stable H1299 cells overexpressing GFP‐tagged MICAL2PV (GFP‐M2) cells. Quantification of mRNA and protein levels of MICAL2PV confirmed increased MICAL2PV expression in these GFP‐M2 stable cells (Fig 2G). Because the percentage of cells with TNTs was less than 10% in control H1299 cells (see Fig 2E), we enhanced TNT formation by culturing cells in the presence of 2‐Deoxy‐D‐glucose (2‐DG) in order to detect the effect of MICAL2PV on TNT formation. It has been reported that environmental or metabolic stresses, such as hypoxia and nutrient restriction, can induce TNT formation (Wang et al, 2011; Desir et al, 2016). Consistently, we observed that 2‐DG, a glucose analog and glycolytic inhibitor, induced TNT formation in lung cancer cells. Following treatment with 2‐DG (20 μM for 24 h), the control and GFP‐M2 cells were imaged to quantify the percentage of cells with TNTs. MICAL2PV overexpression significantly suppressed TNT formation (Fig 2H and I). To confirm these results, we also induced TNT formation using acidified low‐serum conditioned medium, as previously reported (Lou et al, 2012). Under these conditions, similar results of suppression of TNT formation by MICAL2PV expression were obtained (Fig EV2A and B).
Figure EV2. MICAL2PV expression suppresses TNT formation.
-
A, BH1299 cells stably expressing the Ctr or GFP‐M2 were treated by cultured in conditioned media for 24 h to induce TNT formation (see Methods). TNTs were imaged by confocal microscopy (A), and the percentage of cells forming TNTs was quantified (B). Ten images were captured from Ctr, GFP‐M2#1, and GFP‐M2#2, respectively, for quantification. Three independent experiments were performed. Scale bar: 60 μm.
Data information: In (A), the black arrowheads (or white arrows) marked TNTs. In (B), data were analyzed using one‐way ANOVA with Bonferroni post‐test and shown as mean ± SEM; ***P < 0.001.
Related to Fig 2.
Source data are available online for this figure.
Down‐regulating MICAL2PV increases TNT‐mediated mitochondrial transfer
We next asked whether TNTs in lung cancer cells are functional in transporting cargoes between connecting cells. Previous studies have reported that TNTs can mediate the transfer of organelles, including mitochondria (Ahmad et al, 2014; Wang et al, 2018). To examine mitochondrial movement between TNT‐connected cells, we established a live cell imaging assay using shCtr and shM2 cells in which mitochondria were labeled by GFP (Mito‐GFP). Time‐lapse confocal microscopic imaging of these cells revealed mitochondrial movement along TNTs and mitochondria entering into connected cells both in shCtr and shM2 groups (Fig 3A, and Movies EV1 and EV2). We further quantified the percentage of TNTs containing mitochondria in fixed cells. A significantly higher proportion of TNTs containing mitochondria was observed when MICAL2PV was down‐regulated, suggesting that MICAL2PV might suppress TNT‐mediated mitochondrial exchange between lung cancer cells (Figs 3B and C, and EV3A and B). To examine the role of MICAL2PV in TNT‐mediated mitochondrial transfer, we adopted a co‐culture assay reported previously (Abounit et al, 2015; Pinto et al, 2021). In this assay, Mito‐GFP‐labeled shCtr or shM2 cells (as donor cells) were co‐cultured with recipient cells expressing cytosolic mCherry at 1:1 ratio either in direct contact or in transwells where cells were separated by a filter (Fig 3D). The percentage of recipient cells receiving donor‐derived mitochondria was quantified by flow cytometry after cells were co‐cultured for 2 days. When cells were co‐cultured in direct contact, either in glucose or galactose‐containing media, more recipient cells received mitochondria from shM2 cells than from shCtr cells, indicating that down‐regulating MICAL2PV promoted mitochondrial transfer (Fig 3E and F). This effect of MICAL2PV down‐regulation on mitochondrial transfer was more pronounced when cells were co‐cultured in the galactose medium, which forced the cells to produce ATP through mitochondrial oxidative phosphorylation (Fig 3E and F). The observed mitochondrial transfer was dependent on cell–cell contact because mitochondrial transfer was nearly non‐detectable when the recipient and donor cells were co‐cultured in the transwell separated by the filter (Fig 3E). To confirm that donor‐derived mitochondria were indeed transferred into the recipient cells, confocal fluorescence microscopy was performed in cells cultured under the same co‐culture conditions as used for flow cytometry. The donor‐derived GFP‐labeled mitochondria were observed in mCherry‐labeled recipient cells (Fig 3G). In addition, mitochondrial transfer from the donor cell to the recipient cell was also observed in live cell imaging (Movie EV3). These results demonstrate that functional TNTs are formed in lung cancer cells and that down‐regulating MICAL2PV promotes TNT‐mediated mitochondrial transfer.
Figure 3. Down‐regulation of MICAL2PV promotes TNT‐mediated mitochondrial transfer.
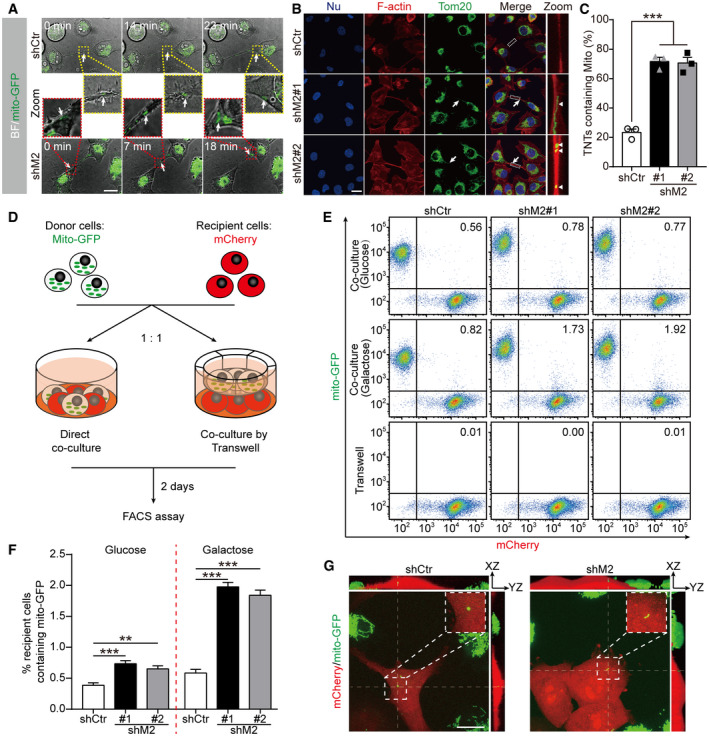
- Time‐lapse microscopic images showing that H1299 shCtr or shM2 cells stably expressing Mito‐GFP were connected by TNTs containing mitochondria. Cells were seeded in collagen‐coated dishes and cultured for 24 h before time‐lapse live cell images were acquired by confocal microscopy (also see Movies EV1 and EV2). Fluorescent images (with bright field) at different time points show the mitochondria moving along the TNT and entering in one of the two connected cells. Scale bar: 20 μm. The moving mitochondria are marked by the white arrows. Boxed areas (shCtr in yellow dotted boxes; shM2 in red dotted boxes) are enlarged and shown in the middle panel.
- Confocal microscopic images of control and shM2 H1299 cells following immunofluorescence staining with anti‐Tom20 antibody (green) and staining using phalloidin (red). The white arrows marked TNTs, whereas the white triangles marked mitochondria inside TNTs. Scale bar: 25 μm.
- Quantification of TNTs containing mitochondria in shCtr and shM2 H1299 cells. The percentage of TNTs containing mitochondria was determined. n = 168, 187, and 192 for shCtr, shM2#1, and shM2#2 groups, respectively; three independent experiments.
- A diagram showing the co‐culture experiments. shCtr and shM2 H1299 cells stably expressing Mito‐GFP were used as donor cells to co‐culture with H1299 cells expressing mCherry as recipient cells at 1 : 1 ratio either in direct contact or separated by a filter in transwells.
- Representative flow cytometry plot of shCtr and shM2 cells following co‐culture for 2 days. Experiments were conducted under three conditions: co‐cultured in direct contact in normal glucose medium or in galactose medium or co‐cultured through a filter.
- The percentage of mCherry‐expressing recipient cells containing Mito‐GFP was quantified. Twenty thousand events were acquired for each condition and data were analyzed using FlowJo analysis software. When co‐cultured through the filter in transwells, only 0.01% or fewer recipient cells contained Mito‐GFP, and this group is not included in the graph to avoid an overcrowded figure. Three independent experiments were conducted.
- Representative images of co‐cultured shCtr and shM2 H1299 cells. Cells were fixed after 2 days of co‐culture, and confocal images were acquired with 100× objective. The boxed areas are enlarged to show the donor‐derived mitochondria in recipient mCherry cells with the corresponding orthogonal views along the thin dotted lines. Scale bar: 20 μm.
Data information: In (B), nuclei were stained with Hoechst 33342 (blue). In (C, F), data were analyzed using one‐way ANOVA with Bonferroni post‐test and shown as mean ± SEM; **P < 0.01, ***P < 0.001.
Source data are available online for this figure.
Figure EV3. Down‐regulating MICAL2PV increases mitochondria‐containing TNTs without affecting the diameter of TNTs nor the percentage of TNTs containing microtubules.
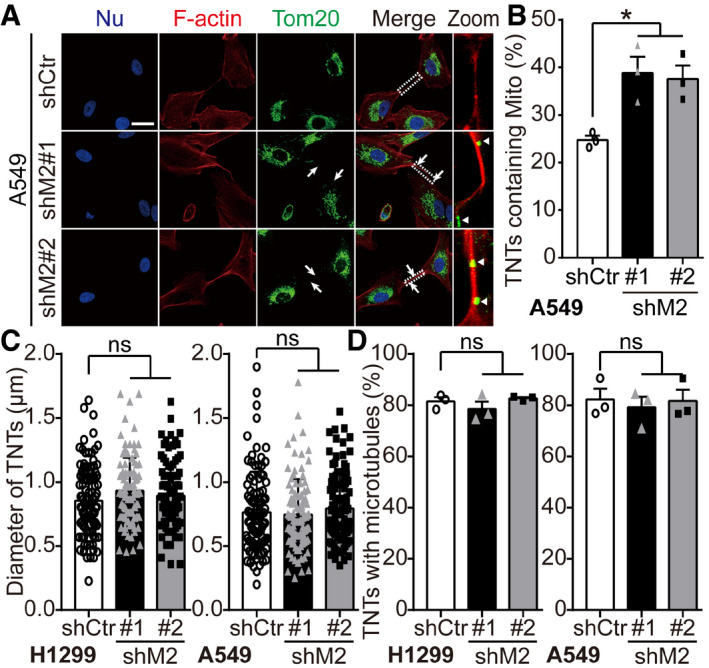
- Control and shM2 A549 cells were stained with anti‐Tom20 antibody (green) and phalloidin (red). The white arrowheads marked mitochondria in TNTs. White triangles marked mitochondria in TNTs in zoomed images. Scale bar: 25 μm.
- The percentage of TNTs containing mitochondria was quantified. n = 162, 183, and 177 TNTs in the shCtr, shM2#1, and shM2#2 groups, respectively, from three independent experiments.
- Quantification of diameter of TNTs. One hundred of TNTs in cells stably expressing shCtr or shM2 were measured by ImageJ from three independent experiments.
- More than 50 TNTs in each group were imaged by confocal microscopy with the percentage of TNTs containing microtubules quantified. For shCtr and shM2 H1299 cells, n = 209, 201, and 185 TNTs in the shCtr, shM2#1, and shM2#2 cells, respectively, from three independent experiments. For shCtr and shM2 A549 cells, n = 162, 183, and 177 TNTs in the shCtr, shM2#1, and shM2#2 cells, respectively, from three independent experiments.
Data information: In (A), nuclei were stained with Hoechst 33342 (blue). In (B‐D), data were analyzed using one‐way ANOVA with Bonferroni post‐test and shown as mean ± SEM; *P < 0.05, ns, not significant.
Related to Fig 3.
Source data are available online for this figure.
Mitochondrial transport and subcellular distribution are critical for cancer cell behavior, such as invasion and metastasis (reviewed in Altieri, 2019). Previous studies suggest that the diameter of TNTs may affect the types of cargoes transported by TNTs. Although it remains controversial, it was proposed that microtubule‐containing TNTs with larger diameters may be more favorable for mitochondrial transport (Onfelt et al, 2006; Dupont et al, 2018). When the effects of MICAL2PV on the diameter of TNTs and the percentage of TNTs containing microtubules were examined, no significant difference was observed between shCtr and shM2 cells (Fig EV3C and D). These data suggest that MICAL2PV may not affect the diameter of TNTs or their microtubule content in these lung cancer cells.
Down‐regulating MICAL2PV promotes mitochondrial infiltration into the cortical cytoskeleton
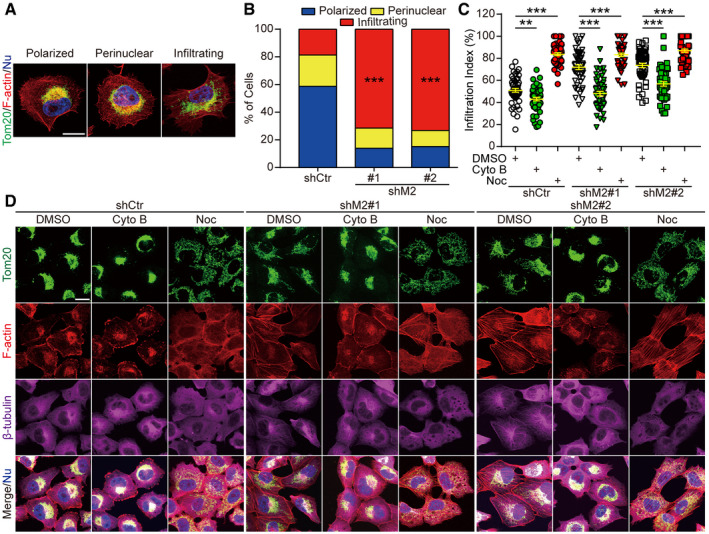
Next, we asked whether MICAL2PV affected the subcellular distribution of mitochondria. Adopting a previously published method of classifying mitochondria according to their patterns of subcellular distribution (Caino et al, 2015), we quantitatively analyzed mitochondrial distribution in shCtr and shM2 cells. Similar to the published study (Caino et al, 2015), we observed three types of mitochondrial distribution: polarized (clustering around one side of the nucleus), perinuclear (distributing around the nucleus), and infiltrating (penetrating into the cortical cytoskeleton) (Fig EV4A). In control cells, the majority of mitochondria exhibited a “polarized” pattern, whereas in the stable shM2 cells, the majority of mitochondria were elongated and showed an “infiltrating” pattern (Figs 4A and B, and EV4B). Consistent with this, we observed that mitochondria were clustered around the nucleus and rarely moved to the cell edge in control cells in our live cell imaging assay (see Movie EV4). On the other hand, in shM2 cells, a large fraction of mitochondria infiltrated into the cortical cytoskeleton, localizing in proximity to the cytoplasm membrane (see Movie EV5). These results indicate that MICAL2PV suppresses mitochondrial infiltration into the cortical cytoskeleton.
Figure EV4. Down‐regulating MICAL2PV enhances mitochondrial infiltration into the cortical cytoskeleton; and F‐actin contributes to mitochondrial infiltration.
-
AThree types of mitochondrial distribution patterns as detected by confocal microscopy. H1299 cells were subjected to immunofluorescent staining using anti‐Tom20 antibody (green) and phalloidin (red). Images of different patterns of mitochondrial distribution (polarized, perinuclear, or infiltrating) were shown. Scale bar: 20 μm.
-
BDown‐regulating MICAL2PV significantly increases the proportion of cells with infiltrating mitochondria. Control and shM2 H1299 cells were stained with anti‐Tom20 antibody (green) and phalloidin (red). The proportion of cells with different mitochondrial distribution patterns (polarized, perinuclear, or infiltrating) was quantified. n = 437, 337, and 372 cells in shCtr, shM2#1, and shM2#2, respectively, from three independent experiments.
-
C, DDepolymerizing F‐actin inhibits mitochondrial infiltration. Control and shM2 H1299 cells were treated with Cytochalasin B (5 μM, 4 h), Nocodazole (Noc) (5 μM, 1 h), or DMSO and subjected to immunofluorescence with anti‐Tom20 antibody (green), anti‐β‐tubulin antibody (magenta), and phalloidin (red). Images were taken by confocal microscopy (D). Mitochondrial infiltration of index was quantified in each group, and 50 cells were quantified for each group from three independent experiments (C). Scale bar: 20 μm.
Data information: In (A, D), nuclei were stained with Hoechst 33342 (blue). In (B, C), data were analyzed using one‐way ANOVA with Bonferroni post‐test and shown as mean ± SEM; *P < 0.05, **P < 0.01, ***P < 0.001.
Related to Fig 4.
Source data are available online for this figure.
Figure 4. Down‐regulating MICAL2PV promotes mitochondrial infiltration and mitochondrial localization of mitochondrial transport proteins.
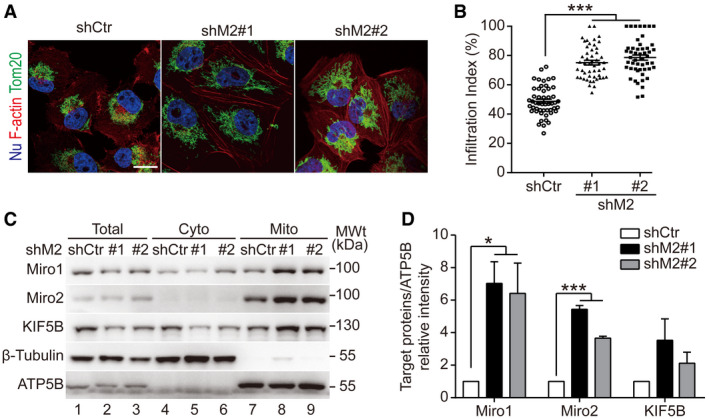
- Down‐regulating MICAL2PV promotes mitochondrial infiltration into the cortical cytoskeleton. Control and shM2 H1299 cells were subjected to immunofluorescence staining with anti‐Tom20 antibody (green) and staining using phalloidin (red). Scale bar: 25 μm.
- Down‐regulating MICAL2PV enhances mitochondrial infiltration. Mitochondrial infiltration index was quantified as the ratio of the radial distance from the nucleus to the furthest mitochondria and the radial distance from the nucleus to the plasma membrane. Fifty cells were quantified for each group.
- Down‐regulating MICAL2PV enhances the mitochondrial localization of Miro1 and Miro2. Mitochondria were purified from control and shM2 H1299 cells and subjected to Western blotting. The purity of the mitochondrial fraction was confirmed by detection of mitochondrial ATP5B and the absence of the cytoplasmic β‐tubulin protein.
- The band intensity of target proteins in the mitochondrial fraction was determined [gels shown in (C)] and expressed relative to the Control.
Data information: In (A), nuclei were stained with Hoechst 33342 (blue). In (B, D), data were analyzed using one‐way ANOVA with Bonferroni post‐test and shown as mean ± SEM; *P < 0.05, ***P < 0.001. Three independent experiments were conducted.
Source data are available online for this figure.
Mitochondrial movement depends on actin filaments or microtubules (Boldogh & Pon, 2007). It was proposed that long‐distance mitochondrial movement is dependent on microtubules, whereas actin filaments mediate short‐distance mitochondrial movement (MacAskill & Kittler, 2010). To investigate whether the increased mitochondrial infiltration into the cortical cytoskeleton in shM2 cells was dependent on the actin cytoskeleton or microtubules, we treated cells with Cytochalasin B (Cyto B) or Nocodazole (Noc), depolymerizing reagents for F‐actin or microtubules, respectively. Following treatment of these cells with vehicle control (DMSO) or either Cyto B or Noc, mitochondrial distribution was analyzed by fluorescent confocal microscopy. In both shCtr and shM2 cells, depolymerizing F‐actin by Cytochalasin B inhibited mitochondrial infiltration into the cortical cytoskeleton, significantly reducing the infiltration index (Fig EV4C and D). On the other hand, in cells treated with Nocodazole, mitochondria were redistributed from the perinuclear region to be dispersed throughout the cytoplasm, consistent with a previous report (Fig EV4C and D) (Tanaka et al, 1998). This suggests that the perinuclear distribution of mitochondria is microtubule‐dependent. Interestingly, it was reported that TNTs in ARPE‐19 cells contained only F‐actin, but not microtubules and that these TNTs mediated mitochondrial transport (Wittig et al, 2012). A recent correlative light‐ and cryo‐electron microscopy study also clearly detected mitochondria inside TNTs containing only F‐actin (Sartori‐Rupp et al, 2019). These studies suggest that mitochondria may rely on F‐actin for long‐distance transport. Similarly, our results show that depolymerizing F‐actin inhibited mitochondrial infiltration, suggesting that the effect of MICAL2PV down‐regulation in enhancing mitochondrial infiltration and transport in shM2 cells may be dependent on F‐actin.
Mitochondrial movement depends on mitochondrial transport proteins that mediate interaction of mitochondria with the cytoskeleton (Boldogh & Pon, 2007). To investigate whether MICAL2PV affects mitochondrial movement by regulating the levels of Miro1, Miro2, or KIF5B proteins, they were examined by Western blotting following purification of mitochondria from control and shM2 cells. Interestingly, down‐regulating MICAL2PV expression increased mitochondrial localization of these mitochondrial transport proteins, especially Miro proteins (Fig 4C and D). These data suggest a role of MICAL2PV in regulating Miro proteins.
MICAL2PV interacts with Miro1/2
Miro1 and Miro2 belong to a family of GTPases located on the outer membrane of mitochondria. They play an important role in regulating mitochondrial distribution and transport (Eberhardt et al, 2020). Recent studies show that Miro proteins coordinate actin‐ and microtubule‐dependent mitochondrial transport and distribution (López‐Doménech et al, 2018). We examined whether MICAL2PV interacted with Miro proteins. Co‐immunoprecipitation experiment was performed using an anti‐Flag antibody in cells stably expressing Flag‐tagged MICAL2PV. The endogenous Miro1 and Miro2 proteins were detected in the immunoprecipitated proteins from cell lysates expressing MICA2PV, but not in the lysates from control cells (Fig 5A), supporting that MICAL2PV interacts with Miro proteins. Consistent with this, co‐immunoprecipitation experiments performed using anti‐Myc antibody show that Flag‐MICAL2PV was detected in the immunoprecipitated samples when Myc‐tagged Miro1 or Miro2 was expressed, but not in the lysates from control cells expressing the control vector (Fig 5B).
Figure 5. MICAL2PV interacts with Miro1/2.
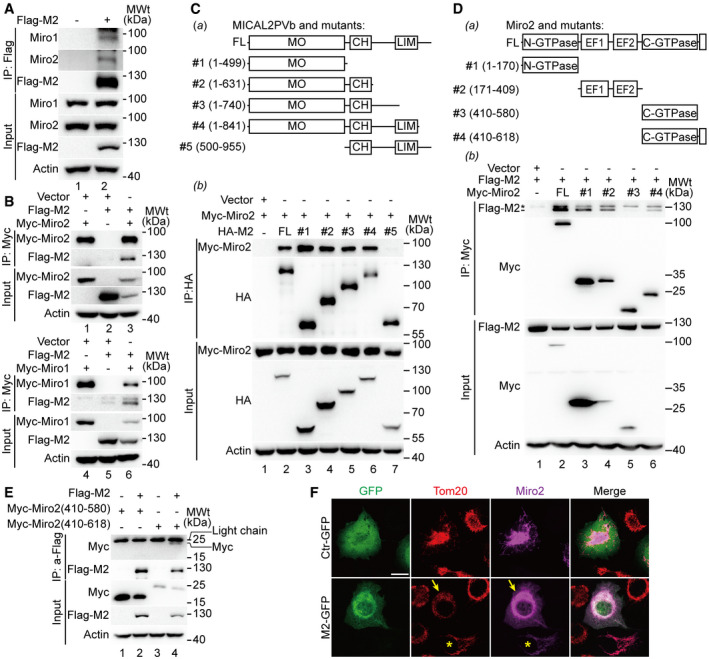
- Lysates of H1299 cells expressing Flag‐MICAL2PV were immunoprecipitated using an anti‐Flag antibody, and immunoprecipitated proteins were analyzed by Western blotting using different antibodies as indicated.
- H1299 cells were co‐transfected with different combinations of plasmids as indicated. The cell lysates were immunoprecipitated using an anti‐Myc antibody. Immunoprecipitated proteins were analyzed by Western blotting using different antibodies as indicated.
- The monooxygenase (MO) domain of MICAL2PV interacts with Miro2. A schematic representation of protein domain organization in MICAL2PV and its truncation mutants is shown in (panel a). H1299 cells were co‐transfected with Myc‐Miro2 and different HA‐tagged MICAL2PV mutants. Following transfection, cells were lysed and immunoprecipitated using an anti‐HA antibody and subjected to Western blotting with different antibodies (panel b).
- MICAL2PV interacts with N‐GTPase, EF hand, and C‐terminal domains of Miro2, but not with the C‐GTPase domain. A schematic representation of protein domain organization in Miro2 and its truncation mutants is shown in (panel a). H1299 cells were co‐transfected with Flag‐MICAL2PV and different Myc‐tagged Miro2 mutants. Transfected cells were lysed, and immunoprecipitation was performed using an anti‐Myc antibody and subjected to Western blotting with different antibodies as indicated (panel b). It should be noted that the upper band (marked by “*”) migrating closely above the Flag‐M2 band in the top section of panel b is a non‐specific species because it is present in anti‐Myc immunoprecipitates of cells only expressing the vector control, not expressing any Myc‐Miro2 (lane 1).
- MICAL2PV interacts with the C‐terminal domain of Miro2 containing the transmembrane region. H1299 cells were co‐transfected with plasmids encoding Flag‐MICAL2PV and Myc‐tagged Miro2 mutants as indicated. Following transfection, cells were lysed for immunoprecipitation using the anti‐Flag antibody and Western blotting. Please note the Myc‐Miro2 (410‐618) protein band in lane 4 migrated as a faint band, slightly faster than the IgG light chain.
- MICAL2PV inhibits the mitochondrial localization of Miro2 and mitochondrial infiltration. H1299 cells were co‐transfected with Myc‐tagged Miro2 and GFP‐tagged MICAL2PV (GFP‐M2) or control vector. Following transfection, cells were fixed and stained with anti‐Tom20 (red) and anti‐Myc antibodies (magenta). Confocal microscopic images were taken with the same objective and the same microscope settings. In cells co‐expressing the GFP vector and Myc‐Miro2 (upper panels), most Miro2 signals (magenta) are co‐colocalized with mitochondria (red Tom20 signals). However, a significant fraction of the Miro2 signals are not colocalized with mitochondria in cells co‐expressing GFP‐M2 and Myc‐Miro2 (marked by the yellow arrowheads). Mitochondria in cells expressing GFP‐M2 show a perinuclear distribution pattern, whereas mitochondria in cells transfected by Myc‐Miro2 without GFP‐M2 (marked by the yellow stars) exhibit an infiltration pattern into the cortical cytoplasm. Scale bar: 20 μm.
Source data are available online for this figure.
Next, we mapped the domains of MICAL2PV and Miro2 involved in MICAL2PV–Miro2 interaction. A series of plasmids expressing different mutants of MICAL2PV were constructed (Fig 5C, panel a). Following transfection of the vector control or mutant MICAL2PV plasmids into H1299 cells, co‐immunoprecipitation experiments were performed to examine MICAL2PV–Miro2 interaction. All MICAL2PV mutants containing the monooxygenase (MO) domain showed their interaction with Miro2, whereas the mutant lacking the MO domain did not. These data indicate that the MO domain mediates MICAL2PV–Miro2 interaction (Fig 5C, panel b). Co‐IP experiments were also carried out in cells expressing different mutants of Miro2 tagged with the Myc tag by using anti‐Myc antibody for immunoprecipitation and using anti‐Flag antibody to detect co‐precipitated Flag‐MICAL2PV (Flag‐M2) (Fig 5D, panel a). MICAL2PV interacted with the Miro2 mutants containing N‐GTPase (aa 1–170) or EF hand (aa 171–409) and mutant #4 containing C‐GTPase (aa 410–580) together with C‐terminal transmembrane domain (TM domain: aa 593–618) (Fig 5D, panel b). On the other hand, the Miro2 mutant #3 containing only the C‐GTPase domain (aa 410–580; without the C‐terminal TM domain) did not interact with MICAL2PV (Fig 5D, panel b). These data suggest that MICAL2PV may interact with the C‐terminal TM domain of Miro2. To confirm this, additional Co‐IP experiments were carried out using anti‐Flag antibody for immunoprecipitation of Flag‐tagged MICAL2PV, followed by Western blotting using anti‐Myc antibody to detect Myc‐tagged Miro2 mutants. The Miro2 mutant containing C‐GTPase and the TM domain (aa 410–618), but not the mutant lacking the TM domain (aa 410–580), was detected in the anti‐Flag immunoprecipitates (Fig 5E). These data support the notion that MICAL2PV interacts with Miro2, raising the possibility that the MICAL2PV–Miro2 interaction in the TM domain of Miro2 may interfere with Miro2 mitochondrial localization. Consistent with this possibility, increased Miro2 immunofluorescence signals that were not colocalized with mitochondria were detected in cells overexpressing MICAL2PV (Fig 5F). These results suggest that the MICAL2PV–Miro2 interaction may inhibit Miro2 mitochondrial localization, thereby affecting mitochondrial trafficking.
Down‐regulating Miro2 inhibits mitochondrial infiltration and TNT‐mediated mitochondrial transport in cells with reduced MICAL2PV expression
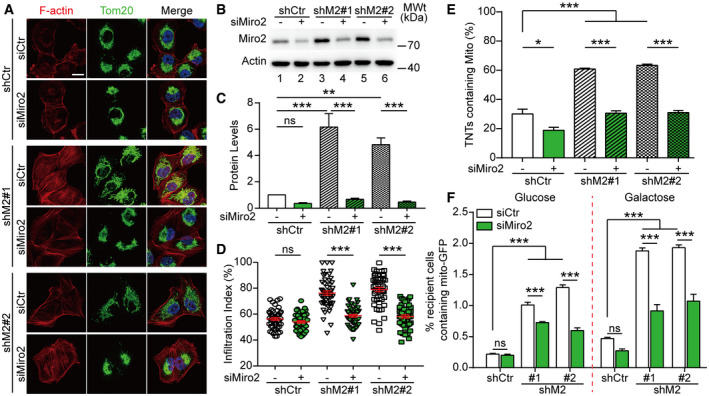
To test whether Miro2 plays a role in mediating MICAL2PV activity in modulating mitochondrial infiltration and TNT‐mediated mitochondrial transport in shM2 cells, we down‐regulated Miro2 expression using specific siRNAs and then determined the mitochondrial infiltration index and the proportion of TNTs containing mitochondria by immunofluorescence microscopy (Fig 6). Western blotting analyses showed that Miro2 expression was up‐regulated in shM2 cells and that Miro2 siRNA significantly reduced Miro2 protein levels in these cells (Fig 6B and C, Appendix Fig S1). Fluorescence microscopy revealed that mitochondria were clustered in the perinuclear region following Miro2 down‐regulation (Fig 6A). Live cell imaging also clearly demonstrated perinuclear mitochondrial clustering in shM2 cells following down‐regulation of Miro2 (see Movie EV6). Quantitative analyses showed that the mitochondrial infiltration index was significantly decreased after down‐regulating Miro2, indicating that Miro2 promotes mitochondrial infiltration (Fig 6D). Down‐regulating Miro2 significantly reduced the percentage of TNTs containing mitochondria (Fig 6E). Furthermore, we used the co‐culture assay as described in Fig 3 to quantify mitochondrial transfer by flow cytometry. Down‐regulating Miro2 in shM2 cells significantly reduced the percentage of recipient cells containing donor‐derived mitochondria when cells were cultured either in glucose or galactose‐containing media (Fig 6F). These results support the idea that the MICAL2PV–Miro2 axis plays a role in regulation of mitochondrial trafficking.
Figure 6. Down‐regulating Miro2 inhibits mitochondrial infiltration and transport in shM2 cells.
-
AControl and shM2 H1299 cells were transfected with control siRNA or siRNAs targeting Miro2. Following transfection, cells were stained with anti‐Tom20 antibody (green) and phalloidin (red). Confocal microscopic images are shown. Scale bar: 20 μm.
-
B, CMiro2 protein levels were detected in different groups by Western blotting with actin as a loading control (B). The Miro2 band intensity was determined and normalized to that in lane 1 in the shCtr group (C). Three independent experiments were conducted.
-
DMitochondrial infiltration index was quantified as described for Fig 4. Fifty cells were quantified for each group.
-
EThe percentage of TNTs containing mitochondria was determined with 100 TNTs per group scored.
-
FDown‐regulating Miro2 inhibits mitochondrial transport in shM2 cells. Mito‐GFP‐labeled control and shM2 H1299 cells were transfected with control siRNA or siRNAs targeting Miro2. These cells were then co‐cultured with mCherry‐labeled recipient cells and analyzed by flow cytometry as described in Fig 3. The percentage of mCherry recipient cells containing Mito‐GFP was quantified. Twenty thousand events were analyzed for each condition, as described in Fig 3.
Data information: In (A), nuclei were stained with Hoechst 33342 (blue). Data were analyzed using Student's t‐test (panel D) or two‐way ANOVA with Bonferroni post‐test (panels C, E, F) and presented as mean ± SEM; *P < 0.05, ***P < 0.01, ***P < 0.001, ns, not significant. Three independent experiments were conducted.
Source data are available online for this figure.
Down‐regulating MICAL2PV decreases chemo‐induced cell death of lung cancer cells
To investigate whether MICAL2PV may affect drug resistance of cancer cells by modulating TNT formation, we examined cell death induced by chemo‐drugs in our co‐culture assay. Control and shM2 cells were treated by vehicle control or 5‐Fluorouracil (5‐FU; 50 μM; 24 h), a chemo‐drug that has been recently evaluated in non–small‐cell lung cancer (Urushiyama et al, 2018). Following 5‐FU treatment, cells were further cultured or co‐cultured with non‐drug‐treated cells labeled with mCherry‐tagged mitochondria (mito‐mCherry) at 1:1 in the absence or presence of Cyto B. Twenty‐four hours following co‐culture or mono‐culture, cell death was quantified by propidium iodide (PI) staining. Down‐regulating MICAL2PV decreased drug‐induced cell death in lung cancer cells (Fig 7A). When co‐cultured with non‐chemo‐treated cells, the death of chemo‐drug‐treated cells was significantly reduced compared with the mono‐cultured group, and such a reduction in cell death was reversed in the presence of Cyto B (Fig 7A). Cell viability was also examined in 5‐FU‐treated cells using MTT assay (Fig 7B). Consistently, shM2 cells showed increased viability as compared with the shCtr cells. However, viability of chemo‐drug‐treated shCtr or shM2 cells did not show difference when cultured in the conditioned medium collected from untreated cells or co‐cultured with untreated cells in transwells (Fig 7B), suggesting that secretion‐related mechanisms may not contribute to the reduction in cell death observed in 5‐FU‐treated cells following co‐culture with non‐treated cells, as shown in Fig 7A. Consistent with the data presented in Fig 2, down‐regulation of MICAL2PV led to an increase in TNT formation, and Cyto B significantly inhibited TNT formation in the co‐culture assay (Fig 7C). Down‐regulating MICAL2PV increased the percentage of cells forming TNTs between chemo‐drug‐treated cells and non‐treated cells (Fig 7D and E). Together, these results suggest that increased formation of TNTs among co‐cultured cells may contribute to the reduction in the death of chemo‐drug‐treated shM2 cells. In previous studies, TNT formation was reported to contribute to drug resistance in many other types of cancer cells by transporting diverse cargoes (as reviewed in Hekmatshoar et al, 2018; Sahu et al, 2018). Together, our data suggest that reduced expression of MICAL2PV might contribute to chemo‐resistance of lung cancer cells by promoting TNT formation.
Figure 7. Down‐regulation of MICAL2PV increases TNT formation between chemo‐drug‐treated cells and non‐treated cells and decreases drug‐induced cell death.
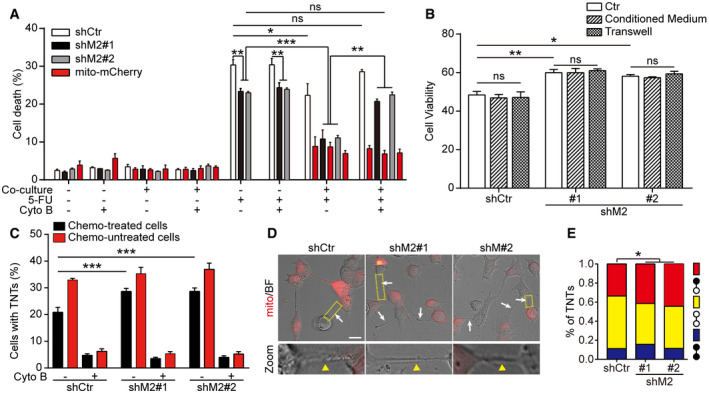
- Stable H1299 cells (shCtr or shM2) were treated by 5‐FU (50 μM, 24 h) and then cultured alone or co‐cultured with non‐drug‐treated cells stably expressing mito‐mCherry in the absence or presence of Cyto B (500 nM, 24 h). The percentage of dead cells in each group was quantified. Three independent experiments were conducted.
- shCtr and shM2 H1299 cells were treated by 5‐FU (50 μM, 24 h). The drugs were then washed out and the cells were cultured in normal DMEM medium (Ctr) or conditioned medium from non‐treated cells or co‐cultured with non‐treated cells in transwells (separated by the filter) for another 24 h. The cell viability of 5‐FU‐treated cells was determined using MTT assay.
- Cyto B inhibits TNT formation in the co‐culture assay. The percentage of cells forming TNTs was quantified in co‐cultured cells in the absence or presence of Cyto B. Three independent experiments were conducted.
- Confocal microscopic images of TNTs in each group, white arrowheads and yellow triangle in enlarged views (zoom‐in panels, zoom) marked the TNTs formed between non‐drug‐treated (mCherry positive) and drug‐treated cells. Scale bar: 25 μm.
- TNT formation was quantified between non‐drug‐treated cells (yellow), chemo‐drug‐treated cells (blue) or between non‐drug‐treated and chemo‐drug‐treated cells (red) following confocal microscopic imaging (non‐drug‐treated cells: white circles, chemo‐drug‐treated cells: black circles). In the co‐culture assay, TNTs in shCtr, shM2#1, and shM2#2 groups (n = 485, 618, and 581, respectively) were imaged. Three independent experiments were performed.
Data information: In (A, B, C, E), data were analyzed using two‐way ANOVA with Bonferroni post‐test and shown as mean ± SEM; *P < 0.05, **P < 0.01, ***P < 0.001, ns, not significant.
Source data are available online for this figure.
The MO domain of MICAL2PV is required for its activity in depolymerizing F‐actin and suppressing TNT formation
Previous studies have shown that MICAL family proteins regulate the cytoskeleton, in particular, F‐actin (Hung et al, 2010; Giridharan et al, 2012; Hung et al, 2013). It has been reported that F‐actin dynamics is important for TNT formation (Hanna et al, 2017). Therefore, we examined whether MICAL2PV affects F‐actin polymerization in lung cancer cells. As expected, more F‐actin filaments and increased F‐actin staining signals were observed in shM2 cells with reduced MICAL2PV expression, demonstrating the activity of MICAL2PV in depolymerizing F‐actin (see Appendix Fig S2A–F). Cytochalasin B is an established inhibitor of actin polymerization frequently used to suppress TNT formation in published studies (Yasuda et al, 2011; Wang & Gerdes, 2015; Patheja & Sahu, 2017). In shM2 cells treated with cytochalasin B, F‐actin distribution and signal intensity were restored to that in the control cells (see Appendix Fig S3A and B), suggesting that MICAL2PV and Cytochalasin B have similar effects on F‐actin, i.e., depolymerizing F‐actin.
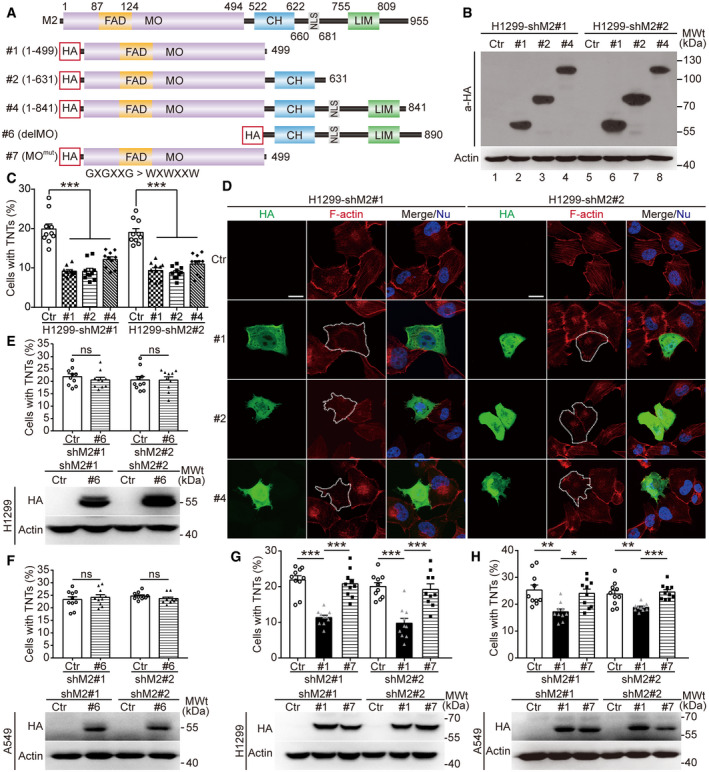
In Hela cells expressing the V1 isoform of MICAL2, it depolymerizes F‐actin through the MO domain (Giridharan et al, 2012). The MO domain is conserved in the MICAL2PV. To determine the domain(s) of MICAL2PV responsible for inhibiting TNT formation, a series of MICAL2PV mutants (as described in Fig 5C) were expressed in shM2 H1299 cells (Fig 8A). Expression of these MICAL2PV mutant proteins was confirmed by Western blotting using an anti‐HA antibody (Fig 8B). Expression of any of three truncation mutants containing the MO domain resulted in a significant reduction in TNT formation, similar to the effect of the wild‐type MICAL2PV (Fig 8C). F‐actin staining revealed that F‐actin filaments and overall F‐actin levels were reduced in cells expressing these MICAL2PV truncation mutants retaining the MO domain (Fig 8D). Similar results were obtained in shM2 A549 cells when MICAL2PV mutants were expressed (see Fig EV5A–C). These data support that the MO domain of MICAL2PV is required for its activities in F‐actin depolymerization and in suppressing TNT formation.
Figure 8. The monooxygenase (MO) domain of MICAL2PV is sufficient for its activity in actin depolymerization and suppression of TNT formation.
-
AA diagrammatic illustration of protein domain organization in MICAL2PV and its mutants.
-
B, CMICAL2PV mutants that contain the MO domain retain the ability to suppress TNT formation. Stable shM2 H1299 cells were transfected with plasmids expressing different MICAL2PV mutants containing a hemagglutinin (HA) tag or the vector control (Ctr). The mutant proteins were detected by Western blotting using an anti‐HA antibody (B). TNT formation was quantified in transfected cells following confocal microscopy. Expression of MICAL2PV mutants, #1, #2, or #4 significantly reduced TNT formation (C). Three independent experiments were conducted.
-
DMICAL2PV mutants containing the MO domain are active in depolymerizing F‐actin. Following transfection of plasmids expressing different HA‐MICAL2PV mutants (#1, #2, or #4) into shM2 cells, confocal microscopy was performed following staining with phalloidin (red) and anti‐HA antibody (green). F‐actin signals were reduced in cells expressing different mutants (HA‐positive green cells marked by dashed lines). Scale bar: 20 μm.
-
E, FMICAL2PV mutants lacking the MO domain do not inhibit TNT formation. Stable shM2 H1299 (E) or A549 (F) cells were transfected with the corresponding MICAL2PV mutants lacking the MO domain or control vectors (Ctr). Following transfection, Western blotting was carried out using an anti‐HA antibody to detect expression of the mutant proteins, and confocal microscopy was performed to examine TNT formation. Ten images per group were captured for quantification. Three independent experiments were conducted.
-
G, HThe MICAL2PV mutant containing an inactive MO domain does not inhibit TNT formation. Stable shM2 H1299 (G) or A549 (H) cells were transfected with plasmids expressing the MICAL2PV mutant in which the MO domain was inactivated by mutations in the FAD binding site (MOmut: amino acid residues 93‐98 GxGxxG mutated to WxWxxW) or the control vector (Ctr). Following transfection, Western blotting and quantification of TNT formation were carried out as in panel E. Ten images were captured for quantification in each group. Three independent experiments were performed.
Data information: In (D), nuclei were stained with Hoechst 33342 (blue). Data were analyzed using Student’s t‐test (C) or a one‐way ANOVA with Bonferroni post‐test (E–H) and shown as mean ± SEM; *P < 0.05, **P < 0.01, ***P < 0.001, ns, not significant.
Source data are available online for this figure.
Figure EV5. The monooxygenase (MO) domain of MICAL2PV is required for its activity in actin depolymerization and suppression of TNT formation.
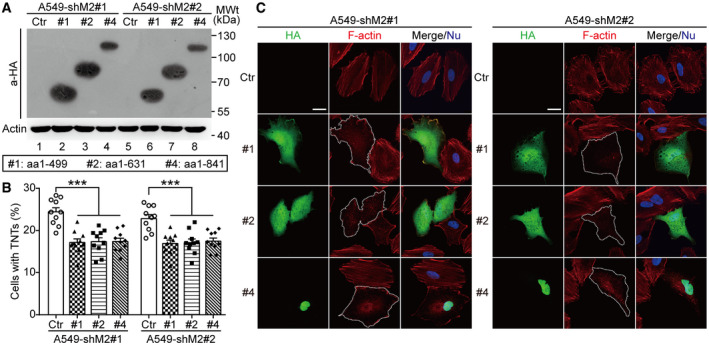
- shM2 A549 cells were transfected with the vector control plasmid (Ctr) or plasmids encoding different MICAL2PV mutants tagged with a hemagglutinin (HA) tag; and expression of HA‐tagged MICAL2PV proteins were detected by Western blotting using anti‐HA antibody.
- TNT formation were imaged by confocal microscopy in the control cells and cells expressing different MICAL2PV mutants. The percentage of cells forming TNTs was quantified. Ten images were captured for quantification in each group cells. Three independent experiments were conducted.
- MICAL2PV mutants containing MO domain were capable of depolymerizing F‐actin. shM2 A549 cells transfected with different MICAL2PV mutants were stained with phalloidin (red) and anti‐HA antibody (green) followed by confocal microscopy (dotted lines depicting transfected cells). Scale bar: 20 μm.
Data information: In (C), nuclei were stained with Hoechst 33342 (blue). In (B), data were analyzed using one‐way ANOVA with Bonferroni post‐test and shown as mean ± SEM; ***P < 0.001.
Related to Fig 8.
Source data are available online for this figure.
To confirm that the MO domain is necessary for MICAL2PV function, the mutant lacking the MO domain (delMO; see Fig 8A) was expressed in shM2 H1299 and A549 cells, respectively. Expression of different MICAL2PV mutants was confirmed by Western blotting analyses (Fig 8E and F, lower panels). Quantification of TNT formation demonstrates that the delMO mutant lost the activity of MICAL2PV in suppressing TNT formation (Fig 8E and F). As expected, this delMO mutant failed to depolymerize F‐actin filaments (see Appendix Fig S4A and B).
Previous studies have reported that mutation of the conserved glycine residues to tryptophan (G to W) in the FAD‐binding region of MO domain blocks FAD binding and impairs the actin‐depolymerizing activity of both Drosophila MICAL and mammalian MICAL2 genes (Terman et al, 2002; Giridharan et al, 2012). We constructed a similar mutant (GXGXXG to WXWXXW) in the MO domain (MOmut) of MICAL2PV (mutant #7 in Fig 8A). Western blotting confirmed the expression of the mutant MICAL2PV protein in the transfected lung cancer cells, both H1299 and A549 (Fig 8G and H, lower panels). Expression of the wild‐type MO domain was sufficient for suppressing TNT formation, whereas the expression of the MOmut mutant MICAL2PV protein did not show any detectable effect on TNT formation (Fig 8G and H). Consistent with this observation, the MO domain alone was sufficient for depolymerizing F‐actin, whereas MOmut mutant MICAL2PV protein did not show detectable activity in F‐actin depolymerization, as shown by F‐actin staining using phalloidin (see Appendix Fig S4A and B). These results indicate that the G to W mutation inside the FAD‐binding region of the MO domain eliminated the activity of MICAL2PV in depolymerizing F‐actin and suppressing TNT formation. The above data demonstrate that the MO domain activity is necessary for MICAL2PV to suppress TNT formation in lung cancer cells.
Discussion
Since the original discovery of TNTs, this type of intercellular communication has been examined in homeostasis and in pathogenesis (Wang & Gerdes, 2012; Yamashita et al, 2018; Nussenzveig, 2019). TNTs play important roles in both physiological and pathological settings (Rustom, 2016; Lou et al, 2018; Pinto et al, 2020). Under physiological conditions, TNTs are involved in brain development, cell reprogramming, cell senescence, immunity, and possibly repair of damaged mitochondria (Koyanagi et al, 2005; Acquistapace et al, 2011; Takahashi et al, 2013; Liu et al, 2014; Zaccard et al, 2015; Alarcon‐Martinez et al, 2020; Whitehead et al, 2020). Under pathological conditions, TNTs may modulate disease progression, including neurodegenerative diseases, AIDS, and cancers (Eugenin et al, 2009; Lou et al, 2012; Lou et al, 2018; Marlein et al, 2019; Sharma & Subramaniam, 2019; Vargas et al, 2019; Jansens et al, 2020; Pinto et al, 2020). Several genes, including p53 and downstream effector genes, are required for TNT formation in certain cells (Sahu et al, 2018). A number of GTPase genes that promote TNT formation have been identified, including Rab8a, Rab11a, and Rab35 (Zhu et al, 2018; Bhat et al, 2020) However, much less is known about the endogenous mechanisms that suppress TNT formation.
In this study, we demonstrate that MICAL2PV encodes a previously unknown suppressor of TNT formation. Our data indicate that down‐regulating MICAL2PV significantly increases TNT formation (Fig 2), enhances mitochondrial infiltration into the cortical cytoskeleton (Fig 4), and promotes TNT‐mediated mitochondrial transport (Fig 3). The monooxygenase (MO) domain of MICAL2PV is required for its activity in inhibiting TNT formation by depolymerizing F‐actin (Fig 8 and Appendix Fig S4). Interestingly, increased TNT formation upon MICAL2PV down‐regulation is accompanied by decreased cell death induced by chemo‐drug treatment, as shown in the co‐culture experiments (Fig 7). Our results suggest that TNT formation between drug‐treated and non‐drug‐treated cancer cells may provide a previously under‐appreciated mechanism for cancer chemo‐resistance or recurrence. Furthermore, our study uncovers an unexpected link between MICAL2PV and mitochondrial transport protein Miro2, revealing the MICAL2PV‐Miro2 axis in regulating mitochondrial distribution and TNT‐mediated mitochondrial transport.
The leading causes of death in cancer patients are distant metastasis and post‐treatment recurrence. Chemo‐resistance is a major mechanism for cancer recurrence. Altered or reprogrammed metabolism is an important hallmark of cancer, and metabolic changes promote cancer cell survival and chemo‐resistance (Hanahan & Weinberg, 2011; Pavlova & Thompson, 2016). Among the multiple mechanisms reported for communication between cancer cells and for adaptive changes in the tumor microenvironment, TNT formation stands out as an effective one for direct intercellular communication (Pasquier et al, 2012; Lu et al, 2017; Desir et al, 2018; Lou et al, 2018; Wang et al, 2018; Pinto et al, 2020; Tischchenko et al, 2020). For example, TNT‐mediated mitochondrial transport from bone marrow stromal cells to leukemic cells and mitochondrial exchange between cancer cells have been suggested to provide cancer cells with metabolic advantage to survive and to invade (Lu et al, 2017; Marlein et al, 2017). Here, we present evidence that TNTs contribute to chemo‐resistance in lung cancer cells. Our data demonstrate that down‐regulating MICAL2PV reduces cell death induced by chemo‐drug treatment and promotes TNT formation between chemo‐treated and non‐treated cancer cells in our co‐culture system (Fig 7A and E). Previous studies suggest a role of TNT in progression and drug resistance in other types of cancer. For example, chemo‐drug‐activated mesenchymal stromal cell (MSCs) prevented drug‐induced cell death in acute lymphoblastic leukemia (ALL), via mitochondrial transfer through TNTs (Burt et al, 2019). It was proposed that less aggressive tumor cells could enhance their ability to invade by acquiring mitochondria from more aggressive cells (Lu et al, 2017). In breast cancer cells, P‐glycoproteins (P‐gps) could be transferred from drug‐resistant cancer cells to drug‐sensitive cells, enhancing chemo‐resistance (Pasquier et al, 2012). Together with published studies, our data support the notion that TNT formation may contribute to mechanisms promoting survival of drug‐treated cancer cells. Clearly, future experiments are necessary to elucidate how TNT formation promotes chemo‐resistance of lung cancer cells.
The role of MICAL2 in lung cancer is supported by the observation that a number of missense and splicing mutations in the human MICAL2 gene have been identified in lung cancer patients. In particular, 13 mutations have been identified inside the MO domain with at least two residues (G13 and A256) hit by recurrent mutations associated with lung cancer (Appendix Fig S5). Some of these lung cancer‐associated mutations are predicted to alter MICAL2PV activity and may affect its role in suppressing TNT formation. Future research is necessary for understanding the precise role of MICAL2PV in lung cancer.
Mitochondria are the major transport cargo for TNTs, suggesting that TNT‐mediated mitochondrial transport may affect cell survival and adaptation. For example, TNT‐mediated mitochondrial transfer from healthy cells rescued cell apoptosis caused by UV treatment (Wang & Gerdes, 2015). Our data show that down‐regulating MICAL2PV alters the mitochondrial subcellular distribution, increases TNT‐mediated mitochondrial transfer (Fig 3). Our experiments also demonstrate that down‐regulating MICAL2PV increases mitochondrial infiltration into the cortical cytoskeleton (Figs 4A and B, and EV4B), a phenotype that has been associated with cancer cell migration and invasion. It has been proposed that PI3K may increase tumor cell motility and invasion by redistributing energetically active mitochondria to the cortical cytoskeleton, where they support membrane dynamics, turnover of focal adhesion complexes, and random cell motility (Caino et al, 2015). Local activation of AMPK, an energy sensor and metabolic regulator, has been reported to promote trafficking of mitochondria to the leading edge, maintaining ATP content and ensuring the ATP supply needed for cell migration (Cunniff et al, 2016). These results suggest that MICAL2PV may affect cancer cell behavior by regulating the subcellular distribution and intercellular transport of mitochondria.
It was suggested that long‐range movement of mitochondria is dependent on microtubules, whereas short‐range mitochondrial movement relies on actin cytoskeleton (MacAskill & Kittler, 2010). A number of proteins important for mitochondrial transport have been identified. Miro 1 and 2 are mitochondrial outer membrane‐associated GTPases that regulate mitochondrial trafficking and distribution by coordinating actin‐ and microtubule‐dependent mitochondrial movement (Ahmad et al, 2014; López‐Doménech et al, 2018; Oeding et al, 2018). It was reported that Miro1 knockout significantly inhibited microtubule‐dependent mitochondrial motion, whereas Miro2 deficiency showed no effect on microtubule‐dependent mitochondrial movement, suggesting that Miro1 is important for microtubule‐dependent mitochondrial trafficking (López‐Doménech et al, 2018). On the other hand, Miro1 knockout did not affect Myo19 protein levels, whereas Miro2 knockout significantly reduced the expression of Myo19, an actin‐dependent mitochondrial motor protein. These data suggest that Miro2 may play an important role in regulating actin‐dependent mitochondrial movement (López‐Doménech et al, 2018). Our biochemical experiments show that MICAL2PV interacts with Miro2 and down‐regulating MICAL2PV significantly increases the mitochondrial localization of Miro2 and mitochondrial infiltration into the cortical cytoskeleton (Figs 4C and D, and EV4B). Consistently, down‐regulating Miro2 in shM2 cells reduces mitochondrial infiltration and TNT‐mediated mitochondrial transfer (Fig 6). Furthermore, depolymerizing F‐actin reduces mitochondrial infiltration into the cortical cytoskeleton, consistent with the notion that F‐actin polymerization contributes to increased mitochondrial infiltration in shM2 cells (Fig EV4C and D). It is conceivable that down‐regulating MICAL2PV may facilitate mitochondrial movement and enhance mitochondrial infiltration by both increasing mitochondrial localization of Miro2 and promoting F‐actin polymerization. These results uncover a previously unrecognized mechanism for MICAL2PV in modulating intercellular transfer and subcellular distribution of mitochondria.
Taken together, our study demonstrates, for the first time, that MICAL2PV suppresses TNT formation by regulating actin cytoskeleton and affects mitochondrial distribution and trafficking by regulating F‐actin polymerization. Our data reveal a role of the MICAL2PV‐Miro2 axis in these processes. Our data also suggest a possible pathogenic role of those recurrent MICAL2 mutations inside the MO domain found in lung cancer patients. Consistent with the notion that MICAL2 may play an important role in lung cancer is our observation that down‐regulation of MICAL2PV reduced cell death in chemo‐drug‐treated lung cancer cells. Our data suggest previously unsuspected targets for future development of effective therapeutic approaches for lung cancer, aiming at enhancing the endogenous mechanism(s) that suppress TNT‐mediated events important for cancer progression, drug resistance, and post‐treatment cancer recurrence.
Materials and Methods
Cell cultures
To examine TNT formation in human lung cancer cells, a number of cell lines were obtained from the American Type Culture Collection (ATCC), including A549, H23, H460, H520, H1299, H1993, and H1792. Initial experiments indicate that A549 and H1299 cells showed consistent results, whereas the heterogeneity in cell morphology and growth features making it difficult to consistently quantify TNTs in the other cell lines. A549 (K‐Ras mutant) and H1299 (TP53‐deficient) cells also represent lung cancer cell lines containing frequent genetic changes in lung cancer patients. For these reasons, these two lines were chosen for most experiments presented in this study. A549 and H1299 cells were cultured in Dulbecco’s modified Eagle medium (DMEM) (Gibco) supplemented with 10% (v/v) fetal bovine serum (FBS) (Gibco), 100 μg/ml of penicillin, and 100 μg/ml of streptomycin (P/S) (Gibco). All cells were cultured in a 37°C, humidified, 5% CO2‐containing atmosphere incubator (Thermo Scientific).
Antibodies
The following antibodies were used in this study, anti‐ATP5B (ProteinTech/17247‐1‐AP), anti‐KIF5B (ProteinTech/21632‐1‐AP), anti‐Miro1 (Sigma/WH0055288M1), anti‐Miro2 (ProteinTech/11237‐1‐AP), anti‐HA (Abmart/M20003L), anti‐β‐tubulin (ProteinTech/10094‐1‐AP), anti‐β‐Actin (ProteinTech/60008‐1‐Ig), anti‐Tom20 (ProteinTech/11802‐1‐AP), anti‐Flag (Sigma/F3165), anti‐Myc (ProteinTech/60003‐2‐Ig), and anti‐GFP (Invitrogen/A6455). Alexa Fluor® 594 phalloidin was from Invitrogen (A12381). The polyclonal anti‐MICAL2PV antibody was generated by Sino Biological Inc. The secondary antibodies used for immunofluorescence, Alexa Fluor® 488 goat anti‐mouse (A21121), Alexa Fluor® 594 goat anti‐mouse (A21125), Alexa Fluor® 647 goat anti‐mouse (A31571), Alexa Fluor® 488 goat anti‐rabbit IgG (A11008), and Alexa Fluor® 594 goat anti‐rabbit IgG (A11012) were from Invitrogen. For Western blotting analyses, peroxidase‐linked donkey anti‐rabbit (NA934V) or peroxidase‐linked donkey anti‐mouse (NA931V) secondary antibodies from GE Healthcare were used.
Plasmid construction and transfection
The full‐length sequence of MICAL2PV and GFP was generated by PCR amplification using cDNA or the plasmids containing the corresponding sequence as the template. The fragments were inserted into the Plko.1‐TRC vector between Age I (NEB) and EcoR I (NEB) sites using the Hieff Clone™ Plus One Step Cloning Kit (Yeasen/10911ES25) according to the manufacturer’s instruction. MICAL2PV mutants were generated by PCR amplification using the full‐length MICAL2PV as template. All constructs were subcloned between the SaI I (NEB) and Not I (NEB) sites of a pCMV‐HA vector (Invitrogen). All constructs were verified by DNA sequencing. Two different shRNAs against MICAL2PV were synthesized together with a negative control shRNA (Shanghai Gene Pharma Co., Ltd). pRK5‐myc‐Miro1 and pRK5‐myc‐Miro2 were gifts from Pontus Aspenström (Addgene plasmid # 47891; Addgene plasmid # 47888) (Fransson et al, 2003). The cells were transfected with the plasmids using Lipofectamine 2000™ (Invitrogen) according to the manufacturer’s instruction.
siRNA transfection
The control siRNA and Miro2 siRNAs were transfected using lipofectamine 2000™ (Invitrogen) according to the manufacturer’s instructions. Briefly, 150 pmol siRNA per well was transfected into cells in 6‐well plates. 24 h following transfection, the cells were trypsinized with a fraction of cells seeded on coverslips for immunofluorescence, and the remaining cells were further cultured for Western blotting. After another 24 h, cells were processed for immunofluorescent microscopy or Western blotting, respectively. The following Miro2 siRNAs were used (5′–3′): (#1 GCGUGGAGUGUUCGGCCAA, #2 CCUCAAGUUUGGAGCCGUU), as in a previous study (Oeding et al, 2018).
Western blotting
Cells were lysed in lysis buffer (50 mM Tris–HCL, pH 7.4, 150 mM NaCl, 1% NP‐40 (Sigma) w/v, 0.5% sodium deoxycholate, 0.1% SDS, 25 mM NaF, 1 mM Na3VO4, 1 mM PMSF, and proteinase inhibitors (Roche)). Cell lysates were centrifuged at 17,000 g at 4°C for 15 min. The supernatants were mixed with loading buffer (20 mM Tris–HCl, pH 8.0, 100 mM DTT, 2% SDS, 20% Glycerol, and 0.016% Bromophenol Blue) at 1:1, and boiled for 10 min. Samples were separated on 10% polyacrylamide gels and transferred onto PVDF membranes. The membranes were blocked with 5% non‐fat milk for 1 h and probed using specific primary antibodies overnight at 4°C. Following incubation with peroxidase‐linked secondary antibodies (GE Healthcare), signals were detected by ECL detection system (Millipore).
Immunofluorescent staining
Cells were cultured on the sterile collagen‐coated glass coverslips for 24 h and fixed as described to preserve TNTs (Ady et al, 2014). Briefly, 8% w/v paraformaldehyde (PFA) was added along the sides of the dishes with glass coverslips, keeping the overlying culture medium intact to a final w/v concentration of 4% and incubated at 4°C for 2 h. Then cells were permeabilized for 10 min with 0.3% Triton X‐100 in PBS and blocked by 10% normal goat serum (NGS) for 1 h at 37°C. For β‐tubulin staining, cells were incubated with anti‐β‐tubulin antibody (1:500) at 4°C overnight.
To examine the effect of MICAL2PV mutants on actin cytoskeleton, cells were transfected and plated on sterile cover‐glasses coated with poly‐L‐lysine and cultured for another 24 h. Cells cultured on the cover‐glasses were then fixed and stained with anti‐HA primary antibody (1:200). Hoechst 33342 and Alexa Fluor® 594 phalloidin were used for nuclear and F‐actin staining, respectively. Fluorescent images were captured with a Leica SP8 confocal microscope. To analyze F‐actin intensity, images were acquired by confocal microscopy with a 100x objective at 1,024 × 1,024 pixels. All images were taken with the same objective with the same settings. The F‐actin intensity in cells was quantified using ImageJ, with mean intensity quantified and normalized to control cells as described previously (Zonderland et al, 2019).
Live cell imaging
Control H1299 (shCtr) or shM2 H1299 (shM2) cells stably expressing Mito‐GFP were cultured in collagen‐coated cover‐glass chambers. Following washing with warm PBS and switching to phenol red‐free DMEM medium, live cell imaging was performed using a Leica SP8 microscope with a 100× oil‐immersion objective in a live cell imaging incubator containing 37°C and 5% CO2.
Quantification of mitochondrial transfer in co‐cultured cells
A flow cytometry assay following co‐culture of donor and recipient cells was performed following published protocols (Abounit et al, 2015; Pinto et al, 2021). Briefly, stable shCtr or shM2 H1299 cells expressing Mito‐GFP were used as donor cells; and H1299 cells expressing mCherry were used as recipient cells. In co‐culture system, donor cells and recipient cells were co‐cultured at 1:1 ratio for 2 days in glucose‐containing regular media. In some experiments where specified, donor cells and recipient cells were co‐cultured in galactose medium (10 mM) for 24 h before flow cytometry. To monitor mitochondrial transfer mediated by secretion, donor cells and recipient cells were co‐cultured in transwells with donor and recipient cells separated by the filter membrane. Following co‐culture for 2 days, flow cytometry was performed using a BD FACSAria IIIu flow cytometer. GFP and mCherry fluorescence signals were analyzed at 488 and 561 nm excitation wavelengths, respectively. Twenty thousand events were acquired for each condition.
Cell viability assay
MTT (3‐(4,5‐dimethylthiazol‐2‐yl)‐2,5‐diphenyltetrazolium bromide) assay was performed following a published protocol (Mosmann, 1983) to determine cell viability. shCtr and shM2 cells were treated with 5‐FU (50 μM) for 24 h in 6‐well plates. Then 5‐FU was washed out, and cells were cultured in complete DMEM medium, or conditioned medium from untreated cells or co‐cultured with untreated cells in transwells separated by the filter. After 24 h, the cell viability was tested by adding 400 μl MTT (5 mg/ml) solution to each well. Following incubation at 37°C for 4 h, the cultured medium was discarded from each well and 2 ml DMSO was added to cells to solubilize MTT formazan. Then 100 μl solution was taken from each well with the color intensity measured spectrophotometrically using a microplate reader at 490 nm wavelength. The data were normalized to the corresponding untreated cells.
Immunoprecipitation
Immunoprecipitation and subsequent Western blotting were performed as reported previously with minor modification (Kong et al, 2015). Briefly, transfected cells were lysed in lysis buffer [50 mM Tris–HCL (pH 7.4), 1 mM EDTA,150 mM NaCl, 0.5% Nonidet P‐40, 50 mM NaF, 1 mM PMSF, 1 mM Na3VO4, 10% glycerol and proteinase inhibitors (Roche)]. Cell lysates were centrifuged and the supernatants were incubated with antibodies at 4°C, following incubation with 30 μl of protein A/G agarose beads (Roche) for 4 h at 4°C. Immunoprecipitated proteins were examined using Western blotting as described above.
RNA isolation and qRT–PCR
Following extraction using TRIzol (Invitrogen), the total RNAs from cells was used in reverse‐transcribed using TransScript One‐step gDNA Removal and cDNA Synthesis SuperMix kit (TransGen Biotech) according to manufacturer's instruction. The mRNA levels were measured by quantitative PCR using UltraSYBR Mixture (low ROX) (CWbio/CW2601M) in a total reaction volume of 20 μl. The expression level for MICAL2PV was quantified according to the −ΔΔCT method using the experimentally quantified efficiency (Vargas et al, 2019). Following primers were used with β‐actin as a reference gene:
MICAL2PV forward 5′‐CCAGGTATCTCCACCTCCTT‐3′ and
reverse 5′‐AGTCCCTGCATCCAGTTACAC‐3′;
β‐actin forward 5′‐ CAGAAGGATTCCTATGTGG‐3′ and
reverse 5′‐ CATGATCTGGGTCATCTTC‐3′.
Mitochondrial purification
Mitochondrial isolation and purify validation were performed according to our published protocols (Deng et al, 2018). Purified mitochondria were stored at minus 80°C or immediately characterized. Protein concentration was determined by BCA protein assay (Pierce).
Determination of subcellular mitochondrial distribution
After the indicated treatments, cells were fixed with 4% paraformaldehyde (PFA; w/v) for 15 min at room temperature, cells were permeabilized with 0.3% Triton X‐100 in PBS for 10 min and blocked by 10% NGS for 30 min at 37°C. Mitochondria were stained with anti‐Tom20 antibody overnight at 4°C and F‐actin was stained with phalloidin Alexa Fluor® 594 for 30 min at 37°C. At least fifty images were taken by confocal microscopy and analyzed by Image J. Mitochondrial distribution was classified into three categories, “perinuclear, polarized, and infiltrated (into the cortical cytoskeleton)”, as described previously (Caino et al, 2015). Mitochondrial infiltration index was defined as the ratio of radial distance from the nucleus to furthest mitochondria and the radial distance from the nucleus to the plasma membrane, as described in the previous report (Caino et al, 2015).
Depolymerization of F‐actin and microtubule
To investigate the effect of F‐actin and microtubules on mitochondrial distribution, cells were treated with Cytochalasin B (Sigma; 5 μM, 4 h) or Nocodazole (Sigma; 5 μM, 1 h) to inhibit the polymerization of F‐actin or microtubules.
Cells were fixed and stained with anti‐Tom20 for mitochondria, anti‐β‐tubulin for microtubule, and phalloidin for F‐actin. Images were taken by confocal microscopy and analyzed by ImageJ.
Quantification of TNT formation
Chambered cover‐glasses (Keyoujia Biotechnology/801101) were coated with collagen, and then seeded with the cells at 40,000/well. 24 h following seeding, the cells were imaged under confocal microscopy (DIC). The membrane protrusions connecting two or more cells without attachment to the substrate were scored as TNTs. The percentage of cells forming TNTs was quantified. In each experiment, at least 10 images were taken of each group (Takahashi et al, 2013).
To detect the TNTs between healthy and chemo‐drug‐treated (stressed) cells, the un‐labeled H1299 control and shM2 cells were treated by 50 μM 5‐FU (Tokyo Chemical Industry/F0150) for 24 h, followed by co‐culturing of treated cells with Mito‐mCherry labeled non‐drug‐treated H1299 cells at a ratio of 1:1 for 24 h. TNTs formed between unlabeled cells (stressed cells), mito‐mCherry marked healthy cells or between unlabeled stressed cells and mito‐mCherry marked healthy cells were imaged by confocal microscopy.
Cytochalasin B treatment: Cells were cultured on the collagen‐coated chambered cover‐glasses and treated with 500 nM Cytochalasin B (Abcam/ab143482) for 24 h to inhibit TNT formation. Under these conditions, no cytotoxicity was detected.
TNT activation by 2‐DG or conditioned media
Cells were treated with 20 μM 2‐DG (Sigma D6134) to induce the formation of TNTs in control and MICAL2PV‐overexpressing cells. Another method for inducing TNT formation was culturing cells in the conditioned media, an acidified hyperglycemic low‐serum medium (pH 6.6, 50 mM glucose, 2.5% fetal calf serum) for 24 h as reported previously (Lou et al, 2012).
Quantification of mitochondria‐containing TNT
Lung cancer cells in the corresponding groups were cultured on collagen‐coated cover‐glasses and cultured for 24 h. Then, the cells were fixed and stained with anti‐Tom20 antibody (1:200) and Alexa Fluor® 594 phalloidin. At least fifty TNTs were imaged in each group. In each field, the percentage of TNTs containing mitochondria was quantified.
Co‐culture assay and quantification of cell death
Unlabeled H1299 control or shM2 cells were treated by 50 μM 5‐FU for 24 h. Following drug treatment, cells were cultured or co‐cultured with Mito‐mCherry labeled non‐drug treated cells at a ratio of 1:1 for 24 h. Cells were stained with propidium iodide (PI) at 37°C for 20 min and then imaged using confocal microscopy. Cell death index was presented as the percentage of PI‐positive cells in different groups.
Statistical analyses
At least three independent experiments were carried out for each assay. Data were presented as mean ± SEM. Data were analyzed with one‐ or two‐way analysis of variance (ANOVA) followed by post hoc tests (as specified) or Student’s t‐test using GraphPad Prism 6. A P‐value of < 0.05 was considered as significant; ns, not significant.
Author contributions
Idea conception, study design, project supervision, and data analysis: JYW and LZ; Designing and performing experiments and data analysis: FW; Experiments and project coordination: XC, HC, JL, LS, and SC; Writing and editing the manuscript: FW, LZ, and JYW.
Conflict of interest
The authors declare that they have no conflict of interest.
Supporting information
Appendix
Expanded View Figures PDF
Movie EV1
Movie EV2
Movie EV3
Movie EV4
Movie EV5
Movie EV6
Source Data for Expanded View and Appendix
Review Process File
Source Data for Figure 2
Source Data for Figure 3
Source Data for Figure 4
Source Data for Figure 5
Source Data for Figure 6
Source Data for Figure 7
Source Data for Figure 8
Acknowledgements
We are grateful to Dr. P. Aspenström for the gift of plasmids. We thank Dr. William A. Muller and members of the Wu laboratory for discussions, suggestions, and critical reading of the manuscript. We thank Dr. Yang Li for his expert suggestions on the quantification of immunofluorescent images. FW, LS, JL, and LZ are supported by grants from the National Key R&D Development Program of China (2019YFA0508603) and the National Natural Science Foundation of China (31971075 and 31671174). The work was supported by National Institutes of Health (R01CA175360 to JW; R01GM123557; P30GM106397 to SC).
EMBO reports (2021) 22: e52006.
Contributor Information
Li Zhu, Email: zhuli@ibp.ac.cn.
Jane Y Wu, Email: jane-wu@northwestern.edu.
Data availability
This study includes no data deposited in external repositories.
References
- Abounit S, Delage E, Zurzolo C (2015) Identification and characterization of tunneling nanotubes for intercellular trafficking. Curr Protoc Cell Biol 67: 12.10.1‐12.10.21 [DOI] [PubMed] [Google Scholar]
- Acquistapace A, Bru T, Lesault P‐F, Figeac F, Coudert AE, le Coz O, Christov C, Baudin X, Auber F, Yiou Ret al (2011) Human mesenchymal stem cells reprogram adult cardiomyocytes toward a progenitor‐like state through partial cell fusion and mitochondria transfer. Stem Cells 29: 812–824 [DOI] [PMC free article] [PubMed] [Google Scholar]
- Ady J, Desir S, Thayanithy V, Vogel R, Moreira A, Downey R, Fong Y, Manova‐Todorova K, Moore M, Lou E (2014) Intercellular communication in malignant pleural mesothelioma: properties of tunneling nanotubes. Front Physiol 5: 400 [DOI] [PMC free article] [PubMed] [Google Scholar]
- Ahmad T, Mukherjee S, Pattnaik B, Kumar M, Singh S, Kumar M, Rehman R, Tiwari B, Jha K, Barhanpurkar Aet al (2014) Miro1 regulates intercellular mitochondrial transport & enhances mesenchymal stem cell rescue efficacy. EMBO J 33: 994–1010 [DOI] [PMC free article] [PubMed] [Google Scholar]
- Alarcon‐Martinez L, Villafranca‐Baughman D, Quintero H, Kacerovsky JB, Dotigny F, Murai KK, Prat A, Drapeau P, Di Polo A (2020) Interpericyte tunnelling nanotubes regulate neurovascular coupling. Nature 585: 91–95 [DOI] [PubMed] [Google Scholar]
- Altieri D (2019) Mitochondrial dynamics and metastasis. Cell Mol Life Sci 76: 827–835 [DOI] [PMC free article] [PubMed] [Google Scholar]
- Alto L, Terman J (2018) MICALs. Curr Biol 28: R538–R541 [DOI] [PMC free article] [PubMed] [Google Scholar]
- Arkwright PD, Luchetti F, Tour J, Roberts C, Ayub R, Morales AP, Rodríguez JJ, Gilmore A, Canonico B, Papa Set al (2010) Fas stimulation of T lymphocytes promotes rapid intercellular exchange of death signals via membrane nanotubes. Cell Res 20: 72–88 [DOI] [PMC free article] [PubMed] [Google Scholar]
- Ashida S, Furihata M, Katagiri T, Tamura K, Anazawa Y, Yoshioka H, Miki T, Fujioka T, Shuin T, Nakamura Yet al (2006) Expression of novel molecules, MICAL2‐PV (MICAL2 prostate cancer variants), increases with high Gleason score and prostate cancer progression. Clin Cancer Res 12: 2767–2773 [DOI] [PubMed] [Google Scholar]
- Bhat S, Ljubojevic N, Zhu S, Fukuda M, Echard A, Zurzolo C (2020) Rab35 and its effectors promote formation of tunneling nanotubes in neuronal cells. Sci Rep 10: 16803 [DOI] [PMC free article] [PubMed] [Google Scholar]
- Boldogh I, Pon L (2007) Mitochondria on the move. Trends Cell Biol 17: 502–510 [DOI] [PubMed] [Google Scholar]
- Bray F, Ferlay J, Soerjomataram I, Siegel R, Torre L, Jemal A (2018) Global cancer statistics 2018: GLOBOCAN estimates of incidence and mortality worldwide for 36 cancers in 185 countries. CA Cancer J Clin 68: 394–424 [DOI] [PubMed] [Google Scholar]
- Burt R, Dey A, Aref S, Aguiar M, Akarca A, Bailey K, Day W, Hooper S, Kirkwood A, Kirschner Ket al (2019) Activated stromal cells transfer mitochondria to rescue acute lymphoblastic leukemia cells from oxidative stress. Blood 134: 1415–1429 [DOI] [PMC free article] [PubMed] [Google Scholar]
- Cai Y, Lu J, Tang F (2018) Overexpression of MICAL2, a novel tumor‐promoting factor, accelerates tumor progression through regulating cell proliferation and EMT. J Cancer 9: 521–527 [DOI] [PMC free article] [PubMed] [Google Scholar]
- Caino MC, Ghosh JC, Chae YC, Vaira V, Rivadeneira DB, Faversani A, Rampini P, Kossenkov AV, Aird KM, Zhang Ret al (2015) PI3K therapy reprograms mitochondrial trafficking to fuel tumor cell invasion. Proc Natl Acad Sci USA 112: 8638–8643 [DOI] [PMC free article] [PubMed] [Google Scholar]
- Cordero Cervantes D, Zurzolo C (2021) Peering into tunneling nanotubes‐The path forward. EMBO J 1: e105789 [DOI] [PMC free article] [PubMed] [Google Scholar]
- Cunniff B, McKenzie A, Heintz N, Howe A (2016) AMPK activity regulates trafficking of mitochondria to the leading edge during cell migration and matrix invasion. Mol Biol Cell 27: 2662–2674 [DOI] [PMC free article] [PubMed] [Google Scholar]
- Delage E, Cervantes D, Penard E, Schmitt C, Syan S, Disanza A, Scita G, Zurzolo C (2016) Differential identity of Filopodia and Tunneling Nanotubes revealed by the opposite functions of actin regulatory complexes. Sci Rep 6: 39632 [DOI] [PMC free article] [PubMed] [Google Scholar]
- Deng J, Wang P, Chen X, Cheng H, Liu J, Fushimi K, Zhu L, Wu J (2018) FUS interacts with ATP synthase beta subunit and induces mitochondrial unfolded protein response in cellular and animal models. Proc Natl Acad Sci USA 115: E9678–E9686 [DOI] [PMC free article] [PubMed] [Google Scholar]
- Desir S, Dickson E, Vogel R, Thayanithy V, Wong P, Teoh D, Geller M, Steer C, Subramanian S, Lou E (2016) Tunneling nanotube formation is stimulated by hypoxia in ovarian cancer cells. Oncotarget 7: 43150–43161 [DOI] [PMC free article] [PubMed] [Google Scholar]
- Desir S, O’Hare P, Vogel RI, Sperduto W, Sarkari A, Dickson EL, Wong P, Nelson AC, Fong Y, Steer CJet al (2018) Chemotherapy‐induced tunneling nanotubes mediate intercellular drug efflux in pancreatic cancer. Sci Rep 8: 9484 [DOI] [PMC free article] [PubMed] [Google Scholar]
- Dubois F, Jean‐Jacques B, Roberge H, Bénard M, Galas L, Schapman D, Elie N, Goux D, Keller M, Maille Eet al (2018) A role for RASSF1A in tunneling nanotube formation between cells through GEFH1/Rab11 pathway control. Cell Commun Signal 16: 66 [DOI] [PMC free article] [PubMed] [Google Scholar]
- Dupont M, Souriant S, Lugo‐Villarino G, Maridonneau‐Parini I, Verollet C (2018) Tunneling nanotubes: intimate communication between myeloid cells. Front Immunol 9: 43 [DOI] [PMC free article] [PubMed] [Google Scholar]
- Eberhardt E, Ludlam A, Tan Z, Cianfrocco M (2020) Miro: a molecular switch at the center of mitochondrial regulation. Protein Sci 29: 1269–1284 [DOI] [PMC free article] [PubMed] [Google Scholar]
- Eugenin E, Gaskill P, Berman J (2009) Tunneling nanotubes (TNT) are induced by HIV‐infection of macrophages: a potential mechanism for intercellular HIV trafficking. Cell Immunol 254: 142–148 [DOI] [PMC free article] [PubMed] [Google Scholar]
- Fransson A, Ruusala A, Aspenstrom P (2003) Atypical Rho GTPases have roles in mitochondrial homeostasis and apoptosis. J Biol Chem 278: 6495–6502 [DOI] [PubMed] [Google Scholar]
- Giridharan S, Rohn J, Naslavsky N, Caplan S (2012) Differential regulation of actin microfilaments by human MICAL proteins. J Cell Sci 125: 614–624 [DOI] [PMC free article] [PubMed] [Google Scholar]
- Hanahan D, Weinberg R (2011) Hallmarks of cancer: the next generation. Cell 144: 646–674 [DOI] [PubMed] [Google Scholar]
- Hanna S, McCoy‐Simandle K, Miskolci V, Guo P, Cammer M, Hodgson L, Cox D (2017) The role of Rho‐GTPases and actin polymerization during macrophage tunneling nanotube biogenesis. Sci Rep 7: 8547 [DOI] [PMC free article] [PubMed] [Google Scholar]
- Hase K, Kimura S, Takatsu H, Ohmae M, Kawano S, Kitamura H, Ito M, Watarai H, Hazelett CC, Yeaman Cet al (2009) M‐Sec promotes membrane nanotube formation by interacting with Ral and the exocyst complex. Nat Cell Biol 11: 1427–1432 [DOI] [PubMed] [Google Scholar]
- Hekmatshoar Y, Nakhle J, Galloni M, Vignais M (2018) The role of metabolism and tunneling nanotube‐mediated intercellular mitochondria exchange in cancer drug resistance. Biochem J 475: 2305–2328 [DOI] [PubMed] [Google Scholar]
- Hung R, Spaeth C, Yesilyurt H, Terman J (2013) SelR/MsrB reverses Mical‐mediated oxidation of actin to regulate F‐actin dynamics. Nat Cell Biol 15: 1445–1454 [DOI] [PMC free article] [PubMed] [Google Scholar]
- Hung R, Yazdani U, Yoon J, Wu H, Yang T, Gupta N, Huang Z, van Berkel W, Terman J (2010) Mical links semaphorins to F‐actin disassembly. Nature 463: 823–827 [DOI] [PMC free article] [PubMed] [Google Scholar]
- Inaba M, Buszczak M, Yamashita Y (2015) Nanotubes mediate niche‐stem‐cell signalling in the Drosophila testis. Nature 523: 329–332 [DOI] [PMC free article] [PubMed] [Google Scholar]
- Jansens R, Tishchenko A, Favoreel H (2020) Bridging the gap: virus long‐distance spread via tunneling nanotubes. J Virol 94: e02120–e2219 [DOI] [PMC free article] [PubMed] [Google Scholar]
- Kim E (2016) Chemotherapy resistance in lung cancer. Adv Exp Med Biol 893: 189–209 [DOI] [PubMed] [Google Scholar]
- Kong R, Yi F, Wen P, Liu J, Chen X, Ren J, Li X, Shang Y, Nie Y, Wu Ket al (2015) Myo9b is a key player in SLIT/ROBO‐mediated lung tumor suppression. J Clin Invest 125: 4407–4420 [DOI] [PMC free article] [PubMed] [Google Scholar]
- Koyanagi M, Brandes R, Haendeler J, Zeiher A, Dimmeler S (2005) Cell‐to‐cell connection of endothelial progenitor cells with cardiac myocytes by nanotubes: a novel mechanism for cell fate changes? Circ Res 96: 1039–1041 [DOI] [PubMed] [Google Scholar]
- Liu K, Ji K, Guo L, Wu W, Lu H, Shan P, Yan C (2014) Mesenchymal stem cells rescue injured endothelial cells in an in vitro ischemia‐reperfusion model via tunneling nanotube like structure‐mediated mitochondrial transfer. Microvasc Res 92: 10–18 [DOI] [PubMed] [Google Scholar]
- López‐Doménech G, Covill‐Cooke C, Ivankovic D, Halff EF, Sheehan DF, Norkett R, Birsa N, Kittler JT (2018) Miro proteins coordinate microtubule‐ and actin‐dependent mitochondrial transport and distribution. EMBO J 37: 321–336 [DOI] [PMC free article] [PubMed] [Google Scholar]
- Lou E, Fujisawa S, Morozov A, Barlas A, Romin Y, Dogan Y, Gholami S, Moreira A, Manova‐Todorova K, Moore M (2012) Tunneling nanotubes provide a unique conduit for intercellular transfer of cellular contents in human malignant pleural mesothelioma. PLoS One 7: e33093 [DOI] [PMC free article] [PubMed] [Google Scholar]
- Lou E, Zhai E, Sarkari A, Desir S, Wong P, Iizuka Y, Yang J, Subramanian S, McCarthy J, Bazzaro Met al (2018) Cellular and molecular networking within the ecosystem of cancer cell communication via tunneling nanotubes. Front Cell Dev Biol 6: 95 [DOI] [PMC free article] [PubMed] [Google Scholar]
- Lu J, Zheng X, Li F, Yu Y, Chen Z, Liu Z, Wang Z, Xu H, Yang W (2017) Tunneling nanotubes promote intercellular mitochondria transfer followed by increased invasiveness in bladder cancer cells. Oncotarget 8: 15539–15552 [DOI] [PMC free article] [PubMed] [Google Scholar]
- Lundquist M, Storaska A, Liu T, Larsen S, Evans T, Neubig RR, Jaffrey S (2014) Redox modification of nuclear actin by MICAL‐2 regulates SRF signaling. Cell 156: 563–576 [DOI] [PMC free article] [PubMed] [Google Scholar]
- MacAskill A, Kittler J (2010) Control of mitochondrial transport and localization in neurons. Trends Cell Biol 20: 102–112 [DOI] [PubMed] [Google Scholar]
- Mao X, Li Q, Gao Y, Zhou H, Liu Z, Jin W (2016) Gap junction as an intercellular glue: emerging roles in cancer EMT and metastasis. Cancer Lett 381: 133–137 [DOI] [PubMed] [Google Scholar]
- Mariotti S, Barravecchia I, Vindigni C, Pucci A, Balsamo M, Libro R, Senchenko V, Dmitriev A, Jacchetti E, Cecchini Met al (2016) MICAL2 is a novel human cancer gene controlling mesenchymal to epithelial transition involved in cancer growth and invasion. Oncotarget 7: 1808–1825 [DOI] [PMC free article] [PubMed] [Google Scholar]
- Marlein C, Piddock R, Mistry J, Zaitseva L, Hellmich C, Horton R, Zhou Z, Auger M, Bowles K, Rushworth S (2019) CD38‐driven mitochondrial trafficking promotes bioenergetic plasticity in multiple myeloma. Cancer Res 79: 2285–2297 [DOI] [PubMed] [Google Scholar]
- Marlein C, Zaitseva L, Piddock R, Robinson S, Edwards D, Shafat M, Zhou Z, Lawes M, Bowles K, Rushworth S (2017) NADPH oxidase‐2 derived superoxide drives mitochondrial transfer from bone marrow stromal cells to leukemic blasts. Blood 130: 1649–1660 [DOI] [PubMed] [Google Scholar]
- McCoy‐Simandle K, Hanna S, Cox D (2016) Exosomes and nanotubes: control of immune cell communication. Int J Biochem Cell Biol 71: 44–54 [DOI] [PMC free article] [PubMed] [Google Scholar]
- Mosmann T (1983) Rapid colorimetric assay for cellular growth and survival: application to proliferation and cytotoxicity assays. J Immunol Methods 65: 55–63 [DOI] [PubMed] [Google Scholar]
- Nussenzveig H (2019) Are cell membrane nanotubes the ancestors of the nervous system? Eur Biophys J 48: 593–598 [DOI] [PubMed] [Google Scholar]
- Oeding SJ, Majstrowicz K, Hu X‐P, Schwarz V, Freitag A, Honnert U, Nikolaus P, Bähler M (2018) Identification of Miro1 and Miro2 as mitochondrial receptors for myosin XIX. J Cell Sci 131: jcs219469 [DOI] [PubMed] [Google Scholar]
- Onfelt B, Nedvetzki S, Benninger R, Purbhoo M, Sowinski S, Hume A, Seabra M, Neil M, French P, Davis D (2006) Structurally distinct membrane nanotubes between human macrophages support long‐distance vesicular traffic or surfing of bacteria. J Immunol 177: 8476–8483 [DOI] [PubMed] [Google Scholar]
- Osswald M, Jung E, Sahm F, Solecki G, Venkataramani V, Blaes J, Weil S, Horstmann H, Wiestler B, Syed Met al (2015) Brain tumour cells interconnect to a functional and resistant network. Nature 528: 93–98 [DOI] [PubMed] [Google Scholar]
- Panasiuk M, Rychlowski M, Derewonko N, Bienkowska‐Szewczyk K (2018) Tunneling nanotubes as a novel route of cell‐to‐cell spread of herpesviruses. J Virol 92: e00090–e118 [DOI] [PMC free article] [PubMed] [Google Scholar]
- Park Y, Musson D, Naot D, Cornish J (2017) Cell‐cell communication in bone development and whole‐body homeostasis and pharmacological avenues for bone disorders. Curr Opin Pharmacol 34: 21–35 [DOI] [PubMed] [Google Scholar]
- Pasquier J, Galas L, Boulange‐Lecomte C, Rioult D, Bultelle F, Magal P, Webb G, Le Foll F (2012) Different modalities of intercellular membrane exchanges mediate cell‐to‐cell p‐glycoprotein transfers in MCF‐7 breast cancer cells. J Biol Chem 287: 7374–7387 [DOI] [PMC free article] [PubMed] [Google Scholar]
- Patheja P, Sahu K (2017) Macrophage conditioned medium induced cellular network formation in MCF‐7 cells through enhanced tunneling nanotube formation and tunneling nanotube mediated release of viable cytoplasmic fragments. Exp Cell Res 355: 182–193 [DOI] [PubMed] [Google Scholar]
- Pavlova N, Thompson C (2016) The emerging hallmarks of cancer metabolism. Cell Metab 23: 27–47 [DOI] [PMC free article] [PubMed] [Google Scholar]
- Pinto G, Brou C, Zurzolo C (2020) Tunneling nanotubes: the fuel of tumor progression? Trends Cancer 6: 874–888 [DOI] [PubMed] [Google Scholar]
- Pinto G, Saenz‐de‐Santa‐Maria I, Chastagner P, Perthame E, Delmas C, Toulas C, Moyal‐Jonathan‐Cohen E, Brou C, Zurzolo C (2021) Patient‐derived glioblastoma stem cells transfer mitochondria through tunneling nanotubes in tumor organoids. Biochem J 478: 21–39 [DOI] [PMC free article] [PubMed] [Google Scholar]
- Polak R, de Rooij B, Pieters R, den Boer M (2015) B‐cell precursor acute lymphoblastic leukemia cells use tunneling nanotubes to orchestrate their microenvironment. Blood 126: 2404–2414 [DOI] [PubMed] [Google Scholar]
- Ramírez‐Weber F, Kornberg T (1999) Cytonemes: cellular processes that project to the principal signaling center in Drosophila imaginal discs. Cell 97: 599–607 [DOI] [PubMed] [Google Scholar]
- Rustom A (2016) The missing link: does tunnelling nanotube‐based supercellularity provide a new understanding of chronic and lifestyle diseases? Open Biol 6: 160057 [DOI] [PMC free article] [PubMed] [Google Scholar]
- Rustom A, Saffrich R, Markovic I, Walther P, Gerdes H (2004) Nanotubular highways for intercellular organelle transport. Science 303: 1007–1010 [DOI] [PubMed] [Google Scholar]
- Sahu P, Jena S, Samanta L (2018) Tunneling nanotubes: a versatile target for cancer therapy. Curr Cancer Drug Targets 18: 514–521 [DOI] [PubMed] [Google Scholar]
- Sartori‐Rupp A, Cordero Cervantes D, Pepe A, Gousset K, Delage E, Corroyer‐Dulmont S, Schmitt C, Krijnse‐Locker J, Zurzolo C (2019) Correlative cryo‐electron microscopy reveals the structure of TNTs in neuronal cells. Nat Commun 10: 342 [DOI] [PMC free article] [PubMed] [Google Scholar]
- Sharma M, Subramaniam S (2019) Rhes travels from cell to cell and transports Huntington disease protein via TNT‐like protrusion. J Cell Biol 218: 1972–1993 [DOI] [PMC free article] [PubMed] [Google Scholar]
- Siebel C, Lendahl U (2017) Notch signaling in development, tissue homeostasis, and disease. Physiol Rev 97: 1235–1294 [DOI] [PubMed] [Google Scholar]
- Sowinski S, Jolly C, Berninghausen O, Purbhoo MA, Chauveau A, Köhler K, Oddos S, Eissmann P, Brodsky FM, Hopkins Cet al (2008) Membrane nanotubes physically connect T cells over long distances presenting a novel route for HIV‐1 transmission. Nat Cell Biol 10: 211–219 [DOI] [PubMed] [Google Scholar]
- Suzuki T, Nakamoto T, Ogawa S, Seo S, Matsumura T, Tachibana K, Morimoto C, Hirai H (2002) MICAL, a novel CasL interacting molecule, associates with vimentin. J Biol Chem 277: 14933–14941 [DOI] [PubMed] [Google Scholar]
- Takahashi A, Kukita A, Li Y, Zhang J, Nomiyama H, Yamaza T, Ayukawa Y, Koyano K, Kukita T (2013) Tunneling nanotube formation is essential for the regulation of osteoclastogenesis. J Cell Biochem 114: 1238–1247 [DOI] [PubMed] [Google Scholar]
- Tanaka Y, Kanai Y, Okada Y, Nonaka S, Takeda S, Harada A, Hirokawa N (1998) Targeted disruption of mouse conventional kinesin heavy chain, kif5B, results in abnormal perinuclear clustering of mitochondria. Cell 93: 1147–1158 [DOI] [PubMed] [Google Scholar]
- Terman J, Mao T, Pasterkamp R, Yu H, Kolodkin A (2002) MICALs, a family of conserved flavoprotein oxidoreductases, function in plexin‐mediated axonal repulsion. Cell 109: 887–900 [DOI] [PubMed] [Google Scholar]
- Tishchenko A, Azorín DD, Vidal‐Brime L, Muñoz MJ, Arenas PJ, Pearce C, Girao H, Ramón y Cajal S, Aasen T (2020) Cx43 and associated cell signaling pathways regulate tunneling nanotubes in breast cancer cells. Cancers 12: 2798 [DOI] [PMC free article] [PubMed] [Google Scholar]
- Urushiyama H, Jo T, Yasunaga H, Michihata N, Matsui H, Hasegawa W, Takeshima H, Sakamoto Y, Hiraishi Y, Mitani Aet al (2018) Oral fluorouracil vs vinorelbine plus cisplatin as adjuvant chemotherapy for stage II‐IIIA non‐small cell lung cancer: propensity score‐matched and instrumental variable analyses. Cancer Med 7: 4863–4869 [DOI] [PMC free article] [PubMed] [Google Scholar]
- Van Prooyen N, Gold H, Andresen V, Schwartz O, Jones K, Ruscetti F, Lockett S, Gudla P, Venzon D, Franchini G (2010) Human T‐cell leukemia virus type 1 p8 protein increases cellular conduits and virus transmission. Proc Natl Acad Sci USA 107: 20738–20743 [DOI] [PMC free article] [PubMed] [Google Scholar]
- Vargas J, Loria F, Wu Y, Cordova G, Nonaka T, Bellow S, Syan S, Hasegawa M, van Woerden G, Trollet Cet al (2019) The Wnt/Ca(2+) pathway is involved in interneuronal communication mediated by tunneling nanotubes. EMBO J 38: e101230 [DOI] [PMC free article] [PubMed] [Google Scholar]
- Wan Z, Gao X, Dong Y, Zhao Y, Chen X, Yang G, Liu L (2018) Exosome‐mediated cell‐cell communication in tumor progression. Am J Cancer Res 8: 1661–1673 [PMC free article] [PubMed] [Google Scholar]
- Wang J, Liu X, Qiu Y, Shi Y, Cai J, Wang B, Wei X, Ke Q, Sui X, Wang Yiet al (2018) Cell adhesion‐mediated mitochondria transfer contributes to mesenchymal stem cell‐induced chemoresistance on T cell acute lymphoblastic leukemia cells. J Hematol Oncol 11: 11 [DOI] [PMC free article] [PubMed] [Google Scholar]
- Wang X, Bukoreshtliev N, Gerdes H (2012) Developing neurons form transient nanotubes facilitating electrical coupling and calcium signaling with distant astrocytes. PLoS One 7: e47429 [DOI] [PMC free article] [PubMed] [Google Scholar]
- Wang X, Gerdes H (2012) Long‐distance electrical coupling via tunneling nanotubes. Biochim Biophys Acta 1818: 2082–2086 [DOI] [PubMed] [Google Scholar]
- Wang X, Gerdes H (2015) Transfer of mitochondria via tunneling nanotubes rescues apoptotic PC12 cells. Cell Death Differ 22: 1181–1191 [DOI] [PMC free article] [PubMed] [Google Scholar]
- Wang X, Veruki M, Bukoreshtliev N, Hartveit E, Gerdes H (2010) Animal cells connected by nanotubes can be electrically coupled through interposed gap‐junction channels. Proc Natl Acad Sci USA 107: 17194–17199 [DOI] [PMC free article] [PubMed] [Google Scholar]
- Wang Y, Cui J, Sun X, Zhang Y (2011) Tunneling‐nanotube development in astrocytes depends on p53 activation. Cell Death Differ 18: 732–742 [DOI] [PMC free article] [PubMed] [Google Scholar]
- Watkins S, Salter R (2005) Functional connectivity between immune cells mediated by tunneling nanotubules. Immunity 23: 309–318 [DOI] [PubMed] [Google Scholar]
- Whitehead J, Zhang J, Harvestine J, Kothambawala A, Liu G, Leach J (2020) Tunneling nanotubes mediate the expression of senescence markers in mesenchymal stem/stromal cell spheroids. Stem Cells 38: 80–89 [DOI] [PMC free article] [PubMed] [Google Scholar]
- Wittig D, Wang X, Walter C, Gerdes H, Funk R, Roehlecke C (2012) Multi‐level communication of human retinal pigment epithelial cells via tunneling nanotubes. PLoS One 7: e33195 [DOI] [PMC free article] [PubMed] [Google Scholar]
- Yamashita Y, Inaba M, Buszczak M (2018) Specialized intercellular communications via cytonemes and nanotubes. Annu Rev Cell Dev Biol 34: 59–84 [DOI] [PMC free article] [PubMed] [Google Scholar]
- Yasuda K, Khandare A, Burianovskyy L, Maruyama S, Zhang F, Nasjletti A, Goligorsky M (2011) Tunneling nanotubes mediate rescue of prematurely senescent endothelial cells by endothelial progenitors: exchange of lysosomal pool. Aging 3: 597–608 [DOI] [PMC free article] [PubMed] [Google Scholar]
- Zaccard C, Watkins S, Kalinski P, Fecek R, Yates A, Salter R, Ayyavoo V, Rinaldo C, Mailliard R (2015) CD40L induces functional tunneling nanotube networks exclusively in dendritic cells programmed by mediators of type 1 immunity. J Immunol 194: 1047–1056 [DOI] [PMC free article] [PubMed] [Google Scholar]
- Zhang H, Grizzle W (2011) Exosomes and cancer: a newly described pathway of immune suppression. Clin Cancer Res 17: 959–964 [DOI] [PMC free article] [PubMed] [Google Scholar]
- Zhou Y, Gunput R, Adolfs Y, Pasterkamp R (2011) MICALs in control of the cytoskeleton, exocytosis, and cell death. Cell Mol Life Sci 68: 4033–4044 [DOI] [PMC free article] [PubMed] [Google Scholar]
- Zhu S, Bhat S, Syan S, Kuchitsu Y, Fukuda M, Zurzolo C (2018) Rab11a‐Rab8a cascade regulates the formation of tunneling nanotubes through vesicle recycling. J Cell Sci 131: jcs215889 [DOI] [PubMed] [Google Scholar]
- Zhu S, Victoria G, Marzo L, Ghosh R, Zurzolo C (2015) Prion aggregates transfer through tunneling nanotubes in endocytic vesicles. Prion 9: 125–135 [DOI] [PMC free article] [PubMed] [Google Scholar]
- Zonderland J, Wieringa P, Moroni L (2019) A quantitative method to analyse F‐actin distribution in cells. MethodsX 6: 2562–2569 [DOI] [PMC free article] [PubMed] [Google Scholar]
Associated Data
This section collects any data citations, data availability statements, or supplementary materials included in this article.
Supplementary Materials
Appendix
Expanded View Figures PDF
Movie EV1
Movie EV2
Movie EV3
Movie EV4
Movie EV5
Movie EV6
Source Data for Expanded View and Appendix
Review Process File
Source Data for Figure 2
Source Data for Figure 3
Source Data for Figure 4
Source Data for Figure 5
Source Data for Figure 6
Source Data for Figure 7
Source Data for Figure 8
Data Availability Statement
This study includes no data deposited in external repositories.