

Abstract
Epithelial‐to‐mesenchymal transition (EMT) describes the loss of epithelial traits and gain of mesenchymal traits by normal cells during development and by neoplastic cells during cancer metastasis. The long noncoding RNA HOTAIR triggers EMT, in part by serving as a scaffold for PRC2 and thus promoting repressive histone H3K27 methylation. In addition to PRC2, HOTAIR interacts with the LSD1 lysine demethylase, an epigenetic regulator of cell fate during development and differentiation, but little is known about the role of LSD1 in HOTAIR function during EMT. Here, we show that HOTAIR requires its LSD1‐interacting domain, but not its PRC2‐interacting domain, to promote the migration of epithelial cells. This activity is suppressed by LSD1 overexpression. LSD1‐HOTAIR interactions induce partial reprogramming of the epithelial transcriptome altering LSD1 distribution at promoter and enhancer regions. Thus, we uncover an unexpected role of HOTAIR in EMT as an LSD1 decommissioning factor, counteracting its activity in the control of epithelial identity.
Keywords: EMT, enhancer, HOTAIR, LSD1, promoter
Subject Categories: Cancer; Chromatin, Epigenetics, Genomics & Functional Genomics; RNA Biology
This study shows that HOTAIR lncRNA independently of PRC2 redistributes LSD1 along chromatin genome‐wide and thus impairs Lsd1 function in maintaining epithelial identity.

Introduction
The epithelial‐to‐mesenchymal transition (EMT) allows normal or neoplastic cells to gradually lose their differentiated epithelial characteristics, including cell adhesion and polarity, and acquire mesenchymal traits, enabling cytoskeleton reorganization and motility (Lamouille et al, 2014). EMT is closely linked to tumor progression: It gradually endows epithelial cells with functions required for invasion and metastasis, as well as stem‐like properties that contribute to tumor recurrence and drug resistance (Ye & Weinberg, 2015).
Epithelial‐to‐mesenchymal transition is a dynamic and reversible process driven by complex changes in signaling circuits and gene expression. Transcription factors such as zinc finger E‐box‐binding (ZEB1), SNAI2 (Slug), SNAI1 (Snail), and Twist are master regulators of EMT that coordinate the repression of epithelial genes and activation of mesenchymal genes (Lamouille et al, 2014). EMT is also influenced by epigenetic regulators, in particular histone lysine methyltransferases (Polycomb), histone deacetylases (NuRD), and histone demethylases (LSD1, PHF2). Through the control of chromatin modifications, these factors modify the expression of EMT genes, preventing or promoting the transition from an epithelial to a mesenchymal state (Tam & Weinberg, 2013).
Long noncoding (lnc)RNAs are emerging as regulators of EMT and metastasis (Huarte & Marín‐Béjar, 2015; Richards et al, 2015; Shi et al, 2015; Liang et al, 2018). They use diverse mechanisms to modify gene expression, including interacting with proteins and DNA, serving as scaffolds, and recruiting chromatin‐modifying complexes to specific genomic locations (Morlando et al, 2014; Quinn & Chang, 2015; Hendrickson et al, 2016). One of the best‐known examples is the lncRNA HOTAIR (HOX transcript antisense intergenic RNA), frequently overexpressed in cancer and associated with poor prognosis, metastasis, and stemness (Gupta et al, 2010; Kogo et al, 2011; Tsai et al, 2011; Zhang et al, 2015; Li et al, 2017). HOTAIR was first identified in human fibroblasts as a scaffold RNA, responsible for epigenetic regulation of cell fate during differentiation (Rinn et al, 2007). HOTAIR interacts with Polycomb repressive complex 2 (PRC2) to trigger histone H3 Lys27 (H3K27) methylation of EMT gene promoters (Gupta et al, 2010; Kogo et al, 2011). How it guides PRC2 to specific loci in distinct cell types is still unclear. Mechanisms based on triplex formation between HOTAIR and DNA or on anchoring the transcription factor SNAI1 have been described (Kalwa et al, 2016; Battistelli et al, 2017). However, PRC2 was recently reported to be dispensable for HOTAIR‐mediated transcriptional repression in breast cancer cells (Portoso et al, 2017). This raises the question of how HOTAIR ensures the control of gene repression and whether PRC2 is required for HOTAIR function in promotion of EMT.
In addition to PRC2, HOTAIR can bind the LSD1/REST/CoREST complex (Tsai et al, 2010; Wu et al, 2013; Somarowthu et al, 2015). LSD1/KDM1A (lysine‐specific demethylase‐1) demethylates H3K4me2 and thus has been proposed to reinforce HOTAIR/PRC2‐mediated repression of transcription. However, whether LSD1 contributes to HOTAIR action is incompletely understood. LSD1 is a well‐known epigenetic regulator of EMT and cancer. In few cases, LSD1 functions as a tumor suppressor (Wang et al, 2009), but mostly it acts as an oncogene (Lim et al, 2010; Harris et al, 2012; Schenk et al, 2012; Feng et al, 2016; Hino et al, 2016; Sun et al, 2016). This duality of LSD1 reflects its distinct substrates and interacting partners in different biological contexts (Shi et al, 2004; Metzger et al, 2005; McDonald et al, 2011). LSD1 controls the establishment of large organized heterochromatin H3K9 and H3K4 domains (LOCKs) across the genome during EMT of mouse hepatocytes, interacting either with REST/coREST co‐repressors in differentiated epithelial cells or with transcriptional co‐activators in cells undergoing EMT (McDonald et al, 2011). LSD1 has also been proposed to regulate non‐histone targets, such as p53 and DNMT1, and to have non‐enzymatic, scaffold roles, particularly in the regulation of enhancer activity in mammals (Wang et al, 2001; Huang et al, 2007; Lan et al, 2007a; Lan et al, 2007b; Scoumanne & Chen, 2007; Wissmann et al, 2007; Roth et al, 2016; Zeng et al, 2016; Maiques‐Diaz et al, 2018). However, in the context of HOTAIR, whether and how LSD1 activity is controlled remained unknown.
Here, we investigated the role of the interaction between HOTAIR and LSD1 in EMT. We discovered that HOTAIR‐mediated epithelial cell migration required the LSD1‐interacting domain but not the PRC2‐interacting domain. In addition, overexpression of LSD1 counteracted HOTAIR‐induced phenotypic changes, indicating an epistatic crosstalk between both for the regulation of cell migration. Our data suggest that HOTAIR expression in epithelial cells affects LSD1 distribution at regulatory elements, resulting in transcriptome changes that favor mesenchymal traits. These findings further support a role for LSD1 as a guardian of epithelial identity and uncover a PRC2‐independent function of HOTAIR in the acquisition of migratory properties by epithelial cells at the very early steps of carcinogenesis.
Results
The LSD1‐interacting domain is essential for HOTAIR to promote cell migration
To uncover a potential role for the LSD1‐interacting domain within HOTAIR, we generated a series of CMV expression vectors containing the full‐length transcript (HOT), a truncation of the first 300 nucleotides (HOTΔP), disrupting the HOTAIR interaction with PRC2 and a truncation of the last 658 nucleotides, removing the LSD1‐interacting domain within HOTAIR (HOTΔL) (Tsai et al, 2010; Wu et al, 2013) (Fig 1A). These constructs were transduced into an epithelial cell line to generate stable cell lines through a drug selection of cell populations integrated the constructs constitutively expressing GFP (CTR), HOT, HOTΔP, and HOTΔL. Specifically, we used the immortalized human epithelial kidney cell line HA5‐early (termed Epi), which has a normal karyotype and epithelial features, such as a rounded cobblestone morphology, low migration, and expression of epithelial markers (Zonula Occludens‐1/ZO‐1, β‐Catenin, Claudin‐1; Fig EV1A–C). For comparative studies, we also examined the mesenchymal cell line of the same origin, HA5‐late (termed Mes), which expresses key mesenchymal markers and characterizes by high migration (Castro‐Vega et al, 2013) and has higher endogenous levels of HOTAIR than Epi (Fig EV1A–C).
Figure 1. HOTAIR expression in epithelial Epi cells weakens tight junctions and promotes cell migration in LSD1‐dependent manner.

-
AStable Epi cell lines ectopically expressing CTR (GFP), full‐length HOTAIR (HOT), HOTAIR lacking PRC2‐ or LSD1‐interacting domains, HOTΔP and HOTΔL, respectively.
-
B–DQuantification of the wound area invaded in 24 h (gray dots) for Epi cells expressing CTR, HOT, HOTΔP or HOTΔP (B), or Mes cells transfected with ASO CTR (control), ASO1 and ASO2 targeting HOTAIR (C), or Epi cells overexpressing CTR or HOT alone or together with LSD1 (LSD1‐OE) (D). Bars correspond to mean values and confidence interval (CI) of 95%. ***P‐value < 10−4, **P‐value < 0.03 (Student t‐test, N = 48 for (B), N = 6 for (C), N = 30 for (D)).
-
EZO‐1 and GAPDH protein levels assessed in Epi cells by Western blot of whole protein extracts.
-
FQuantification of ZO‐1 levels (gray dots) in four independent Western blot experiments by ImageJ. *P‐value < 0.05 (Student's t‐test), bars correspond to mean ± standard deviation (N = 4).
-
GZO‐1 quantification of IF images performed using the Fiji software and bar‐plotted as normalized integrated densities per cell (gray dots) with bars corresponding to mean ± standard error of the mean (SEM) for at least 11 high‐field units of at least 100 cells; *P‐value < 0.05 (Student's t‐test, N = 11).
Figure EV1. In vitro EMT system used to study HOTAIR function.

- Epi and Mes cell lines corresponding to HA5‐early and HA5‐late, respectively (Castro‐Vega et al, 2013), stained for F‐actin fibers by Phalloidin‐TRITC and for DNA by DAPI (scale bar, 16 µm).
- HOTAIR levels quantified in Epi and Mes cells by random‐primed RT–qPCR, relative to RPL11 mRNA (gray dots); bars represent mean ± standard deviation for three replicates.
- Protein levels of EMT markers in whole protein extracts of parental Epi and Mes cells assessed by Western blot.
- HOTAIR quantification by random‐primed RT–qPCR in Epi cell lines normalized to RPL11 mRNA and represented as a fold change to CTR. Each dot corresponds to independent replicate; bars represent mean ± standard deviation values.
- Quantification of HOTAIR variants associated with LSD1 and EZH2 by RT–qPCR in two independent RIP experiments (R1 and R2), represented as a % of input, with fold‐enrichment.
- Distribution of full‐length and truncated variants of HOTAIR between cytoplasm (cyt), nucleoplasm (nuc), and chromatin (chr) fractions in Mes and transduced Epi cells (HOT, HOTΔP, HOTΔL) assessed by RT–qPCR relative to GAPDH mature mRNA.
- Subcellular distribution and protein levels of LSD1, RNA Pol II, H3K4me3, and GAPDH in cytoplasm, nucleoplasm, and chromatin fractions in Epi cells expressing CTR (C), HOT (H), HOTΔP (P), and HOTΔL (L).
- Protein levels of LSD1, EZH2, and GAPDH in whole protein extracts assessed by Western blot in Epi‐CTR, ‐HOT, ‐HOTΔP, and ‐HOTΔL cells. * The Lsd1 signal at 75 kD was detected only in total and cytoplasm protein fractions and may correspond to either degradation product or Lsd1 variant.
Source data are available online for this figure.
The levels of HOTAIR in Epi‐HOT cells were at least 30 times higher than in Epi‐CTR cells (Fig EV1D) and 10 times higher than in Mes cells (Fig EV1B). In addition, transduced Epi cells expressed at least two times higher HOTΔL compared to the full‐length HOTAIR or HOTΔP (Fig EV1D). RNA immunoprecipitation (RIP) experiments confirmed that truncation of the 5′ or 3′ extremity of HOTAIR resulted in disruption of HOTAIR association with EZH2 and LSD1, respectively (Fig EV1E). We also confirmed that the subcellular distributions of HOTAIR were similar in Mes cells naturally expressing HOTAIR and genetically modified Epi‐HOT, ‐HOTΔP, and ‐HOTΔL cells; in particular, ectopically expressed HOTAIR was associated with chromatin (Fig EV1F). Moreover, the subcellular localization and levels of HOTAIR protein partners EZH2 and LSD1 in total extracts were comparable in all cell lines (Fig EV1G and H, respectively).
Alterations in HOTAIR expression (overexpression or depletion) in epithelial cells are associated with changes in cell migration (Ding et al, 2014; Dong & Hui, 2016; Deng et al, 2017). We used an in vitro wound healing assay to assess a role of HOTAIR in cell migration in our system. As expected, overexpression of HOTAIR promoted a migration of Epi cells (Fig 1B; Appendix Fig S1A), and reversibly, depletion of HOTAIR by antisense oligonucleotides from highly migratory Mes cells reduced cell migration (Fig 1C; Appendix Fig S1B). These results confirmed and reinforced the observations in diverse EMT systems on the role of HOTAIR in promotion of cell migration (Wu et al, 2014; Zheng et al, 2018; Xun et al, 2019). Unexpectedly, deletion of the PRC2‐interacting domain within HOTAIR did not abolish the ability of HOTAIR to stimulate migration: Epi‐HOTΔP cells migrated as fast as Epi‐HOT cells (Fig 1B). In contrast, Epi‐HOTΔL migratory properties were similar to the control epithelial cells Epi‐CTR, both closing the wound slower than Epi‐HOT (Fig 1B). Importantly, the population doubling rates of the cell lines were similar, suggesting that the differences in wound healing efficiencies are not due to cell growth changes (Appendix Fig S1C). The migration changes strongly suggested that Epi‐HOTΔL cells maintain their epithelial identity (as Epi‐CTR) and this regardless the expression of HOTAIR with the intact PRC2‐interacting domain, whereas Epi‐HOT and Epi‐HOTΔP cells lose some epithelial traits. Both, full‐length HOTAIR and HOTΔP are able to interact with LSD1, suggesting that HOTAIR interaction with LSD1 somehow impedes LSD1 function in regulation of epithelial–mesenchymal balance. To challenge this hypothesis, we overexpressed LSD1 in Epi cells in the presence or absence of HOTAIR (Epi‐CTR‐LSD1‐OE and ‐HOT‐LSD1‐OE; Appendix Fig S2A and B). It should be noted that LSD1 overexpression resulted in a considerable increase of HOTAIR expression in both Epi‐CTR and Epi‐HOT backgrounds, that could be explained by direct or indirect effect of LSD1 on transcription or stabilization of the lncRNA. We further examined the migration capacity of cell lines overexpressing or not LSD1 and full‐length HOTAIR. In agreement with other reports, migration of epithelial cells was increased in the presence of high levels of LSD1 (+27%, Epi‐CTR‐LSD1‐OE versus Epi‐CTR; Fig 1D) (Boulding et al, 2018; Zhang et al, 2019). Remarkably, in this background, HOTAIR was not able to induce further increase in migration. Interestingly, overexpression of HOTAIR in Epi‐HOT‐LSD1‐OE resulted in 12% loss of wound healing efficiency comparing to the Epi‐HOT cell line overexpressing HOTAIR alone (P‐value < 0.004, Student's t‐test). We concluded that overexpression of LSD1 promoted migration committing epithelial cells to EMT. It can either withdraw, antagonize, or impede HOTAIR function in gain of migratory properties. And reversely, HOTAIR seems to impact negatively LSD1 capacity to stimulate migration. These findings reinforced our hypothesis of the crosstalk between HOTAIR and LSD1 in gene expression regulation involved in EMT.
Cell migration is associated with changes in cell–cell junctions, cytoskeletal organization, and apico‐basal polarity of cells (Lamouille et al, 2014). To investigate whether HOTAIR overexpression in epithelial cells affects the overall cell morphology, we performed phalloidin staining of F‐actin fibers. However, we did not detect differences in cell shape or in the formation of cell sheets (Appendix Fig S1D). During EMT, cells acquire migratory properties at least in part due to a reduction in the tight junctions that support cell‐to‐cell contacts (Tornavaca et al, 2015). Therefore, we examined whether overexpression of HOTAIR affected the tight junction protein ZO‐1/TJP1 in Epi cells. We found that ZO‐1 protein levels were decreased in Epi‐HOT and Epi‐HOTΔP cells compared to the less migratory Epi‐CTR and Epi‐HOTΔL cells (Fig 1E and F). In addition, ZO‐1 displayed a more diffused localization, especially, at cell–cell junctions, in Epi‐HOT and Ep‐HOTΔP compared to Epi‐HOTΔL and Epi‐CTR (Fig 1G; Appendix Fig S1E). In contrast, the protein levels of other epithelial markers, β‐Catenin and Claudin‐1, and mesenchymal markers, SNAI1/2, ZEB1, and Vimentin, were similar in all cell lines (P‐value > 0.05, Student's t‐test; Appendix Fig S3). Thus, the key transcription factors that reprogram epithelial cells toward a mesenchymal identity were unchanged in Epi cells expressing HOTAIR. Together, these findings suggested that HOTAIR‐LSD1 interactions in Epi cells promote migration before all by weakening cell–cell junctions resulting in a mixed epithelial–mesenchymal phenotype.
HOTAIR‐induced transcriptome changes depend distinctly on PRC2 and LSD1
To understand molecular mechanisms underlying the altered migratory properties of Epi cells expressing HOTAIR, we studied their transcriptome by RNA sequencing (RNA‐seq). First, the transcriptome of Epi‐CTR was compared to Epi cells expressing each of HOTAIR variants. We found that the ectopic expression of HOTAIR or its truncated versions in Epi cells induced global changes in mRNA levels, with an overall repressive effect (Fig 2A).
Figure 2. HOTAIR expression in Epi cells induces drastic changes in expression of protein‐coding genes, majorly dependent on the presence of both, PRC2‐ and LSD1‐interacting domains.

- Number of up‐ and downregulated protein‐coding genes (PCG) defined as differentially expressed in Epi‐HOT, ‐HOTΔP, and ‐HOTΔP cells compared to Epi‐CTR by RNA‐seq and DESeq analysis (fold change > 2 and adj. P‐value < 0.05), including those associated with EMT (Gröger set, Dataset EV2) and already identified as HOTAIR/PRC2 targets (Gupta set, Dataset EV2); nd stands for non‐determined.
- Venn diagram of intersection of down‐ and upregulated protein‐coding genes in Epi‐HOT, ‐HOTΔP, and ‐HOTΔL cells compared to Epi‐CTR. HPL‐neg and HPL‐pos are gene sets down‐ and upregulated only by the full‐length HOTAIR (Dataset EV2).
- KEGG pathways identified by DAVID as significantly enriched (adj. P‐value < 0.05) for HPL‐neg and HPL‐pos sets of protein‐coding genes, ranked by enrichment score calculated as −log10(P‐value).
Source data are available online for this figure.
A total of 755 genes showed altered expression in Epi‐HOT compared to Epi‐CTR, with a fold change (FC) above 2 and adjusted P‐value below 0.05 (Fig 2A and B, Dataset EV1). Of them, 505 were altered only by the full‐length HOTAIR and hence dependent on both PRC2‐ and LSD1‐interacting domains. We referred to this set of genes as HPL‐pos (N = 119) and HPL‐neg (N = 386) for HOTAIR‐PRC2‐LSD1 up‐ and downregulated genes (Fig 2B, Dataset EV2). Some of HPL genes were reported to be EMT markers (Gröger et al, 2012), while others were previously identified as repressed by HOTAIR‐ and PRC2‐mediated histone H3 lysine 27 methylation (Gupta et al, 2010) (Gröger and Gupta sets, Dataset EV2), including genes involved in proteolysis of extracellular matrix, SERPIN2 and MMP3, and the protocadherin gene family member PCDH18 (Gupta et al, 2010; Xu et al, 2013; Qiu et al, 2014). Gene Ontology (GO) analysis revealed that the HPL genes are enriched for several Kyoto Encyclopedia of Genes and Genomes (KEGG) pathways that are tightly linked to EMT, cancer, and metastasis (Fig 2C). The downregulated genes were enriched for extracellular matrix (ECM) receptor interactions, focal adhesion, and Hedgehog signaling, whereas the upregulated genes were enriched for Jak‐STAT and bladder cancer pathways (Fig 2C). Notably, expression of EMT drivers and key EMT transcription factors was not stimulated by HOTAIR overexpression in epithelial cells.
On the other hand, 77 and nine protein‐coding genes were down‐ and upregulated, respectively, upon expression of any of HOTAIR variants (Fig 2B). These genes were grouped into a core‐set of potential HOTAIR targets that do not require neither PRC2 nor LSD1 (Dataset EV2). According to GO analysis, these genes were involved in developmental processes, cell surface receptor signaling pathways, MAPK cascade, and apoptotic processes.
Finally, Epi cells expressing HOTΔP or HOTΔL variants showed less transcriptomic perturbations (R 2 of 0.986 and 0.982, respectively) than cells expressing full‐length HOTAIR (R 2 of 0.972) (Appendix Fig S4). Only 194 and 353 protein‐coding genes were altered in Epi‐HOTΔP and Epi‐HOTΔL, respectively (Fig 2A). Paradoxically, Epi‐HOTΔP cells with the lowest number of differentially expressed genes (N = 194) still showed increased migration similar to Epi‐HOT cells, while Epi‐HOTΔL cells with 353 differentially expressed genes lost their capacity to migrate (Fig 1C).
Together, our protein and global transcriptomic results strongly suggest that HOTAIR is not involved in full reprogramming of epithelial identity during EMT. Instead, HOTAIR modulates the epithelial–mesenchymal plasticity toward acquisition of some mesenchymal traits. Remarkably, PRC2‐ and LSD1‐interacting domains within HOTAIR contribute together but also distinctly to its regulatory function. Specifically, truncation of the LSD1‐interacting domain within HOTAIR still allows significant changes in gene expression but these perturbations are insufficient to preserve its capacity in promotion of migration.
The LSD1‐interacting domain of HOTAIR shapes the high‐migration transcriptome
To define highly expressed genes involved in the maintenance of epithelial properties in low migrating cells (Epi‐CTR and ‐HOTΔL) and, in contrast, highly expressed genes associated with the acquisition of migration properties in high migrating cells (Epi‐HOT and ‐HOTΔP), we performed anew a differential expression analysis, comparing gene expression between these two phenotypically distinct groups. All genes, except those of the core‐set, with upregulated expression (FC > 1.5 and adj. P‐value < 0.05) in low‐migrating cells were assigned as a Low Migration Signature (LMS), whereas genes with upregulated expression in high‐migrating cells were assigned as a High Migration Signature (HMS) (Fig 3A and B, Dataset EV3). In total, we defined 131 LMS and 75 HMS genes presenting gene expression patterns specific to each phenotypic group (Dataset EV2).
Figure 3. Transcriptome signatures of low‐ and fast‐migrating epithelial cells.

- Protein‐coding gene assignment to Low and High Migration Signature sets according to differential expression features.
- Heatmap of unsupervised hierarchical clustering based on Low Migration Signature (LMS) and High Migration Signature (HMS) gene expression.
- Heatmap of enrichment scores (−log10(P‐value)) for KEGG pathways significantly enriched for LMS and HMS protein‐coding genes (DAVID, P‐value < 0.05).
- LMS (red) and HMS (black) gene expression quantification in Epi cells by random‐primed RT–qPCR relative to RPL11 and represented as log2 fold change to CTR. Each dot corresponds to an independent replicate; bars represent mean ± standard deviation values.
Source data are available online for this figure.
Gene Ontology analysis showed that the LMS set is enriched for genes involved in pathways linked to cardiac development (as the integrin family), lipid biosynthesis, and cytokine–cytokine receptor interactions, whereas the HMS set includes genes of ECM–receptor interactions and focal adhesion pathways tightly linked to EMT, cancer, and metastasis (Fig 3C). Notably, transcriptome changes induced by HOTAIR did not result in a complete switch of the EMT program, but rather in a modulation (attenuation or increase) of gene expression (Fig 3B). HMS genes, highly expressed in fast‐migrating Epi‐HOT and ‐HOT∆P cells, included the cell cycle regulator CCND1 (Kim & Diehl, 2009) and the CD44 EMT marker (Zhao et al, 2016) (Fig 3D). Among LMS genes, highly expressed in Epi‐CTR and ‐HOT∆L cells, were the tumor suppressor MTUS1 (Di Benedetto et al, 2006) and the nuclear receptor PRICKLE1/RILP implicated in the nuclear trafficking of REST/NRSF and REST4 transcription repressors (Shimojo & Hersh, 2006) (Fig 3D). To compare epithelial and mesenchymal traits of Epi cells overexpressing HOTAIR, we also performed the RNA‐seq analysis of protein‐coding transcriptome of original Epi cells and their mesenchymal compeer—Mes cells. Primary epithelial kidney cells lose epithelial traits and acquire mesenchymal properties with time, through cell division and increase of genomic instability, hence undertaking EMT. When immortalized at different stages before (Epi) and after (Mes) transition, they possess very different transcriptome (Castro‐Vega et al, 2013). This was confirmed in our study by RNA‐seq and differential expression analysis: 1,274 and 1,423 protein‐coding genes were up‐ and downregulated, respectively, in Mes cells, underlying differences in cell phenotypes regarding cell morphology, migration, and expression of EMT markers (Dataset EV4, Appendix Fig S5A and B). However, these alterations were not strictly concurrent with those induced by HOTAIR overexpression in Epi cells reinforcing the idea that HOTAIR is not able to fully reprogram Epi cells to mesenchymal identity. The expression of key transcription factors driving EMT reprogramming, was not induced by HOTAIR in Epi cells, and globally, we did not observe significant enrichments of LMS or HMS groups in down‐ or upregulated genes from Mes. Only 30 genes downregulated in Mes were part of LMS, and 6 genes upregulated in Mes were found in the HMS group (Appendix Fig S5C), concurrently with low or high migration properties in each system.
In conclusion, the conversion of low‐ to high‐migration phenotype is associated with modulation of epithelial transcriptome altering above all focal adhesion and ECM–receptor interactions. These perturbations depend on the presence of the LSD1‐interacting domain within HOTAIR supporting the importance of LSD1 in maintaining epithelial identity and its altered activity during HOTAIR‐induced EMT.
The LSD1‐interacting domain of HOTAIR alters distribution of LSD1 at promoters
Epithelial–mesenchymal plasticity is determined by transcriptional program. Any change in transcription can cause or, in turn, can result from epigenetic reconfiguration of chromatin at promoters and distal cis‐regulatory elements. Thus, we decided to profile H3K27ac in Epi cells expressing HOTAIR variants. This histone modification is present at promoters of transcribed genes, reflecting transcriptional activity of the locus, but also it is a hallmark of active enhancers and super‐enhancers in the genome (Creyghton et al, 2010; Hnisz et al, 2013). We used the recently established CUT&RUN technique (Skene et al, 2018) and applied the HMCan peak calling to profile H3K27ac peaks genome‐wide. As expected, H3K27ac tags were specifically enriched in vicinity of transcription start sites (TSS) (Fig EV2A and B). Peaks within the 2‐kb window around gene TSS were assigned to promoters. We observed slightly more H3K27ac peaks, and specifically at gene promoters, in low‐migrating Epi‐CTR and ‐HOTΔL cells (Fig EV2A). Also, low‐migrating cells showed more genes with H3K27ac peaks in common than the high‐migrating Epi‐HOT and ‐HOTΔP cells (433 and 32, respectively; Fig 4A). In addition, a metagene analysis of H3K27ac distribution around TSS showed global decrease of this mark in high‐migrating cells (Fig 4B). Unsupervised hierarchical clustering based on H3K27 mean signal at promoters showed separation of low‐ from high‐migrating cells (Fig 4C). To identify potential pathways which have been reprogrammed between these two phenotypic groups, we divided genes into three classes based on H3K27ac enrichment of their promoters: higher coverage in low‐migrating CTR and HOTΔL conditions (Class 1) or higher in high‐migrating HOT and HOTΔP conditions (Class 2), and, finally, all other cases (Class 3; Fig EV2C). Comparisons of a fold change (FC) in H3K27ac density of each peak confirmed pairwise similarity (FC close to 1) between low‐migrating Epi‐CTR and ‐HOTΔL and between high‐migrating Epi‐HOT and ‐HOTΔP cells (Fig EV2D). Class 1 contained far more hyperacetylated genes than Class 2 (2,268 against 136 genes, respectively). The GO term analysis revealed involvement of Class 1 genes in regulation of cell–cell adhesion, cell migration, and actin cytoskeleton whereas Class 2 genes showed poor significance of enrichments in biological processes and the top ranked were not relevant to EMT and cancer (Fig 4D). Globally, very few GO terms were in common between these two classes. This observation was concordant with differential expression and GO term analysis between low‐ and high‐migrating cells (LMS and HMS; Fig 3C). However, comparison between H3K27ac levels at gene promoters and gene expression changes quantified by RNA‐seq in Epi cells did not show high concordance (Appendix Fig S6). Notably, Class 1 genes with increased H3K27ac at promoters in low‐migrating cells were not specifically ranked as upregulated by RNA‐seq comparing to high‐migrating cells and reverse. Only 32 genes were shared between LMS (N = 131) and Class 1 (N = 2,268) subgroups defined by transcriptomic and epigenetic analyses, respectively, including TGFB2 (Fig 4E). And only one NTNG1 gene from HMS (N = 75) made part of Class 2 (Dataset EV2). Such low overlap may point to significant differences between steady‐state transcriptome and H3K27ac status reflecting differences between chromatin modifications associated with transcriptional activity of the locus and total RNA levels at the equilibrium between RNA synthesis and stability.
Figure EV2. H3K27ac discriminates low‐ from high‐migration phenotype.

- H3K27ac reads distribution across distinct genomic features, and H3K27ac peaks identification and assignment to gene promoters in Epi‐CTR and cells expressing HOT, HOTΔP, and HOTΔL variants.
- Box‐plot distribution of H3K27ac mid‐peak to the closest TSS in Epi‐CTR (N = 5,770), ‐HOT (N = 4,103), HOTΔP (N = 4,825), and HOTΔL (N = 5,282). Central bars represent the median, boxes—lower and upper quartiles and whiskers are set to 1.5*interquartile range (IQR) above the third and below the first quartiles.
- Metagene profiling within the 10‐kb window around TSS of H3K27ac, LSD1, and H3K4me2 over IgG in Epi cells for three classes of gene promoters: enriched in H3K27ac in low‐migrating CTR and HOTΔL cells (Class 1, red) or in high‐migrating HOT and HOTΔP cells (Class 2, gray) and all other cases (Class 3, yellow). Red and yellow parallel lines correspond to peak summit values in Epi‐CTR cells for genes of Class 1 and Class 2, respectively. Epi cells expressing none (CTR) or different HOTAIR variants (HOT, HOTΔP, and HOTΔL).
- Box‐plot of Log2 fold changes (FC) of H3K27ac mean density of each peak in pairwise comparisons between four Epi cell lines expressing CTR (C), HOT (H), HOTΔP (P), and HOTΔL (L) for Class 1 (N = 7,467), Class 2 (N = 426), and Class 3 (N = 7,722) transcripts. Central bars represent the median, boxes—lower and upper quartiles and whiskers are set to 1.5*IQR above the third and below the first quartiles.
Figure 4. HOTAIR expression changes H3K27 acetylation and LSD1 occupancy of gene promoters.

- Venn diagram representing intersections of gene promoters possessing H3K27ac peaks within the 2‐kb window around their TSS in Epi cells.
- Metagene profiling within the 10‐kb window around TSS of H3K27ac, LSD1, and H3K4me2 over IgG in Epi cells expressing none (CTR) or different HOTAIR variants (HOT, HOTΔP, and HOTΔL). bp stands for base pairs.
- Heatmap of unsupervised hierarchical clustering based on H3K27ac mean values at gene promoters showing separation of two phenotypic groups.
- Biological process pathways identified by DAVID as enriched for Class 1 or Class 2 genes hyperacetylated in low‐ or high‐migrating cells, respectively (adj. P‐value < 0.05 for Class 1 and P‐value < 0.05 for Class 2). Dots represent GO term enrichment with color coding: red for high enrichment, blue for low enrichment, and sizes of the dots representing the significance score of each subset (the bigger the dot, the higher its significance).
- Visualization of the H3K27ac, Lsd1, and H3K4me2 CUT&RUN and of RNA‐seq tracks of the TGFB2 promoter region in Epi‐CTR, ‐HOT, ‐HOTΔP, and ‐HOTΔL cells.
Source data are available online for this figure.
Several studies propose LSD1 as a factor involved in regulation of promoter activities (Ferrari‐Amorotti et al, 2013; Ambrosio et al, 2017; Carnesecchi et al, 2017; Zhang et al, 2018). To address how LSD1 occupancy of promoters is affected in the presence of HOTAIR, we performed CUT&RUN profiling of LSD1 in our system. Our data revealed that HOTAIR expression rather mildly affected LSD1 overall distribution across the genome (Fig EV3A and B). However, like H3K27ac, low‐migrating cells shared more LSD1 peaks than high‐migrating cells (Fig EV3C). We observed a positive correlation between LSD1 and H3K27ac levels suggesting cooccurrence of these features at promoters (Fig 4B; Appendix Fig S7). If considering all actively transcribed protein‐coding genes, both H3K27ac and LSD1 were lower in high‐migrating cells comparing to low‐migrating cells (Fig EV2C). At chromatin, LSD1 as a part of several distinct multisubunit complexes can scaffold transcription factors, remodel nucleosomes, and demethylate histones. To determine whether the demethylation of H3K4me2, the prevailing substrate of LSD1 in actively transcribed euchromatic regions, is misregulated, we examined its distribution by CUT&RUN (Fig EV3D–F). Globally, H3K4me2 was preserved across the genome and highly enriched it the vicinity of gene TSS, with no statistically significant changes between low‐ and high‐migrating cells (Fig 4B), nor between Class 1 and Class 2 promoters separately (Fig EV2C).
Figure EV3. LSD1 and H3K4me2 profiling in Epi cells expressing HOTAIR variants.

- LSD1 tags distribution across distinct genomic features, and a summary of LSD1 peaks, regions, and gene promoters with LSD1 peaks in Epi cells expressing CTR or HOT, HOTΔP, and HOTΔL variants.
- Box‐plot distribution of LSD1 mid‐peak to the closest TSS in Epi‐CTR (N = 3,548), ‐HOT (N = 2,797), HOTΔP (N = 1,670), and HOTΔL (N = 2,754). Central bars represent the median, boxes—lower and upper quartiles and whiskers are set to 1.5*IQR above the third and below the first quartiles.
- Venn diagram representing intersections of LSD1 peak regions in Epi cells.
- H3K4me2 tags distribution across distinct genomic features, and H3K4me2 peaks identification, merging to regions and assignment to gene promoters in Epi‐CTR and cells expressing HOT, HOTΔP, and HOTΔL variants.
- Box‐plot distribution of H3K4me2 mid‐peak to the closest TSS. in Epi‐CTR (N = 22,172), ‐HOT (N = 21,636), HOTΔP (N = 22,199), and HOTΔL (N = 21,874). Central bars represent the median, boxes—lower and upper quartiles and whiskers are set to 1.5*IQR above the third and below the first quartiles.
- Venn diagram representing intersections of H3K4me2 peak regions in Epi cells.
Overall, our analysis shows that the expression of HOTAIR with its LSD1‐interacting domain is associated with changes in H3K27ac and LSD1 occupancy of EMT gene promoters, in striking accordance with the migratory phenotype observed in these cells. Notably, these variations are not concomitant with changes in H3K4me2 levels.
The LSD1‐interacting domain of HOTAIR alters distribution of LSD1 at enhancers
Transcription is regulated by enhancers and enhancer clusters, known as super‐enhancers (SE). We hypothesized that these distal regulatory elements may also contribute to fine‐tune the regulation of an EMT balance in epithelial cells expressing HOTAIR variants. Therefore, we performed the annotation of active enhancers and SEs by the LILY pipeline using H3K27ac and ROSE algorithm (Fig EV4A) (Boeva et al, 2017). Notably, the number of active enhancers in low‐migrating Epi‐CTR and ‐HOTΔL was higher than in high‐migrating Epi‐HOT and ‐HOTΔP (Fig 5A) whereas the number of SEs was rather constant among conditions (Fig EV4B). Very few SEs were cell line specific, suggesting that, globally, expression of HOTAIR or its variants did not induce a deep reprogramming of cellular identity. Hence, we further focused on enhancers and compared LILY annotations among conditions. A substantial portion of active enhancers was either specific to Epi‐CTR or ‐HOTΔL (N = 2,096) or shared by both (N = 648), but very few were inherent to high‐migrating Epi‐HOT or ‐HOTΔP (N = 595) cells or shared by both (N = 53; Fig 5A and B). It suggests that transcriptomic changes and consequent gain of migration by epithelial cells in presence of HOTAIR with intact LSD1‐interacting domain may result from changes in enhancer activity. Indeed, consistently with a global decrease in H3K27ac observed in high‐migrating cells (Fig 4B), enhancers also showed less acetylation in Epi‐HOT and ‐HOTΔP cells. (Fig 5C). CUT&RUN analysis revealed the presence of LSD1 at putative enhancers annotated by LILY (Fig 5C). Remarkably, a metagene profiling showed more LSD1 at enhancers in low‐migrating cells (Epi‐CTR and ‐HOTΔL) in comparison to high‐migrating cells (Epi‐HOT and ‐HOTΔP) (adj. P‐value < 10−12, Wilcoxon test) (Fig 5C). This was concomitant with slightly lower H3K4me2 levels (adj. P‐value < 10−10, Wilcoxon test). While considering separately putative enhancers shared by low‐ and high‐migrating cells (775 and 53, respectively), we also noticed that the enhancers of Epi‐CTR and ‐HOTΔL had higher LSD1 summit than the same enhancers in Epi‐HOT and ‐HOTΔP (adj. P‐value < 0.05, Wilcoxon test) (Fig EV5A and B). At the same time, this pattern was not observed for enhancers of the high‐migration group. Moreover, difference in LSD1 occupancy of both types of enhancers was not significantly associated with changes in H3K4me2 levels in all conditions (adj. P‐value > 0.05, Wilcoxon test; Fig EV5B and C). One such example of Lsd1‐bound regulatory element annotated as super‐enhancer by LILY is located downstream the TGFB2 gene and has been reported to control the expression of the gene in the context of fibrosis (Shin et al, 2019) (Appendix Fig S8A). In our system, TGFB2 was expressed to higher extend in low‐migrating cell (LMS set) and this was concomitant with higher Lsd1 and H3K27ac levels at its enhancer, measured by CUT&RUN. Considering the overall disbalance in enhancer numbers between these two groups, the latter observation may however suggest that the enhancers of the low‐migration group are more perturbed in presence of HOTAIR and, hence, depend on HOTAIR‐LSD1 interaction, whereas the enhancers of the high‐migration group are rather HOTAIR‐independent.
Figure EV4. Enhancers and super‐enhancers in Epi cells expressing HOTAIR variants.

- Annotation of active enhancers and super‐enhancers by LILY using H3K27ac as a hallmark, in Epi cells expressing none (CTR), full‐length (HOT) and truncated variants (HOTΔP and HOTΔL) of HOTAIR.
- Venn diagram representing intersections of active super‐enhancer regions in Epi cells.
Figure 5. HOTAIR expression perturbs LSD1 activity at enhancers.

- Venn diagram representing intersections of active enhancer regions in Epi cells.
- Diagram representing putative active enhancers identified by LILY in each cell line and shared between low‐ or high‐migrating groups, respectively.
- Metagene profiling of H3K27ac, LSD1, and H3K4me2 over IgG within the 5‐kb window of enhancers in Epi cells expressing none (CTR) or different HOTAIR variants (HOT, HOTΔP, and HOTΔL). bp stands for base pairs.
Figure EV5. LSD1 and H3K4me2 levels at enhancers shared by low‐ or high‐migrating cells.

-
AMetagene profiling of LSD1 and H3K4me2 over IgG tags ratio within the 5‐kb window of enhancers shared by low‐migrating Epi‐CTR and ‐HOTΔL cells (red) or by high‐migrating Epi‐HOT and ‐HOTΔP cells (gray). Parallel lines indicate the peak summit in Epi‐CTR, bp stands for base pairs.
-
B, CBox‐plot of Log2 LSD1 and H3K4me2 densities at enhancers shared by low‐ (red, N = 775) and high‐migrating cells (gray, N = 53). Central bars represent the median, boxes—lower and upper quartiles and whiskers are set to 1.5*IQR above the third and below the first quartiles. C = CTR, H = HOT, P = HOTΔP, L = HOTΔL. Adj. P‐value was calculated by Bonferroni method, Wilcoxon test and represented only for significant changes observed for LSD1 at enhancers shared by low‐migrating cells.
Collectively, these observations supported a model where LSD1 occupies proximal and distal regulatory elements. Expression of HOTAIR with its LSD1‐interacting domain in Epi‐HOT and ‐HOTΔP, perturbs LSD1 distribution. Its action does not seem to be exclusively due to H3K4 demethylation but elicits changes in promoter and enhancer activities. As a consequence, this may imbalance transcription attenuating expression of epithelial genes and promoting expression of mesenchymal genes responsible for cell–cell adhesion and migration (Fig 6). Hence, our results revealed an unexpected role of HOTAIR as a molecular effector of LSD1, which may contribute to EMT at the very early steps of transformation of a normal epithelial cell to a neoplastic one.
Figure 6. Model of HOTAIR activity.
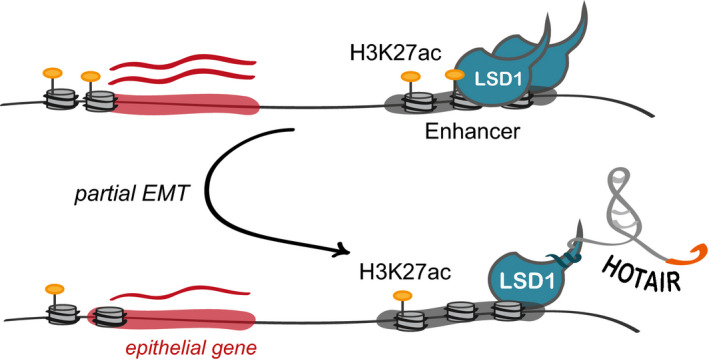
In epithelial cells, the LSD1‐interacting domain of HOTAIR perturbs LSD1 function at enhancers and promoters resulting in alteration of the transcriptional response and change in expression of genes involved in control of cell migration.
Discussion
Epithelial‐to‐mesenchymal transition is involved in development, tissue homeostasis, and repair, as well as cancer progression. During EMT, epithelial cells acquire mesenchymal traits that promote migration and invasion and thus can underlie a high metastatic potential of tumors. HOTAIR and LSD1 have been independently studied in a variety of cell‐based and clinical settings as factors associated with EMT and metastasis. Although the regulatory function of HOTAIR is unambiguously linked to the acquisition of migration and invasion capacities, the role of the histone demethylase LSD1 is rather context‐specific. LSD1 is ubiquitously expressed in both epithelial and mesenchymal cells and as a part of distinct multisubunit complexes can promote transcription repression or activation through its scaffold, demethylase, or chromatin remodeling functions (Shi et al, 2004; Wang et al, 2007; McDonald et al, 2011; Whyte et al, 2012; Li et al, 2016).
The present work revealed that HOTAIR negatively regulates the function of LSD1 in maintaining epithelial identity. HOTAIR appears to require its interaction with LSD1 but not with PRC2 to promote migration of epithelial cells. Accordingly, upon expression of HOTAIR with intact LSD1‐interacting domain, we observed a decrease in level and change in distribution of the ZO‐1 tight junction protein in high‐migration cells. We found that most of the transcriptome changes induced by HOTAIR require both PRC2‐ and LSD1‐interacting domains, suggesting that these domains have synergic and independent functions as well. Importantly, epithelial cells expressing a HOTAIR truncation that lacks the LSD1‐interacting domain (HOTΔL) still maintain epithelial identity. In this context, HOTAIR association to PRC2 is not sufficient to induce cell state changes even if the transcriptome of these cells is largely perturbed. We cannot exclude the inhibitory effect of HOTAIR on the PRC2 enzymatic activity at chromatin as proposed by another recent study (Portoso et al, 2017), but we can also consider the fact that in Epi‐HOTΔL cells, LSD1 continues to operate independently of HOTAIR. LSD1 elicits transcriptional programs upon different stimuli and transitions. It has been proposed to control the timing of transcription at enhancers during muscle and embryonic stem cell differentiation or in prostate cancer (Whyte et al, 2012; Cai et al, 2014; Scionti et al, 2017). LSD1 has been shown to regulate negatively or positively transcription from specific promoters (Ferrari‐Amorotti et al, 2013; Ambrosio et al, 2017; Carnesecchi et al, 2017; Zhang et al, 2018). In our system, expression of HOTAIR with its LSD1‐interacting domain results in drastic changes in H3K27ac status, affecting gene expression pattern. Concomitantly, we observed an overall change in LSD1 occupancy of promoters and enhancers and, specifically, at regulatory elements active in low‐migrating cells. LSD1 activity at promoters and enhancers by consequence may subordinate transcriptional response. At the same time, regulatory elements in high‐migrating cells seem to be independent of HOTAIR. The striking correlation between the loss of epithelial traits and changes in the LSD1 genomic landscape supports a pivotal role for LSD1 as a factor that prevents cells from sensing or undergoing EMT, as previously suggested (McDonald et al, 2011). Remarkably, HOTAIR activity in stimulation of cell migration can be counteracted by overexpression of LSD1. Noteworthy, in this context, LSD1 activity seems to be partially inhibited by HOTAIR. Together, these observations highlighted a functional duality of LSD1 in EMT: On one hand, LSD1 is overexpressed in many cancers, it promotes a transition to mesenchymal state and metastasis (Lv et al, 2012; Egolf et al, 2019; Xie et al, 2020) but at the same time LSD1 contributes to the maintenance of epithelial identity (Wang et al, 2009). In the light of our findings, these LSD1 functions can be in part decommissioned by HOTAIR in epithelial cells. Still a lot of questions remain open on how HOTAIR influences LSD1 activity and whether this lncRNA affects its tethering or residence at specific locations or its enzymatic or scaffold activities, at chromatin but also at proteins other than histones. Indeed, even if we could measure only slight variations in H3K4me2, erased by LSD1, they remain rather subtle, indicating that HOTAIR‐mediated LSD1 decommissioning from enhancers and/or promoters could affect more its function in chromatin remodeling, scaffolding, or tethering of transcription factors or others.
Intriguingly, several alternative splicing and TSS isoforms of HOTAIR are annotated in the human genome, some of which lack the LSD1‐ and/or PRC2‐binding domains (Mercer et al, 2012). Although the clinical relevance of these isoforms has not yet been established, our results suggest that tumors expressing isoforms of HOTAIR that lack the LSD1‐binding domain would have a lower metastatic potential and hence better prognosis. Thus, it will be of interest to assess the expression of HOTAIR isoforms in tumors of different grades and prognosis together with the LSD1 level and occupancy but also enhancer activity. Overexpression of the LSD1‐interacting domain of HOTAIR in tumor cells with high expression of LSD1 might prove to be a strategy to balance the toxic effect of LSD1 in aggressive cancers.
Materials and Methods
Cell lines and culture
Cells were cultured in a humidified 5% CO2 atmosphere at 37°C in high‐glucose DMEM with GlutaMAX for HEK293T (ATCC® CRL‐3216™) and MEM alpha without nucleosides for HA5‐late (Mes), HA5‐early (Epi), and its derivatives Epi‐HOT, ‐HOTΔP, and ‐HOTΔL. All media were supplemented with 10% fetal bovine serum, essential amino acids, and sodium pyruvate. Cell lines were systematically tested and were negative for mycoplasmas.
Plasmids and oligonucleotides
The CTR construct corresponds to pLenti CMV GFP (659‐1) (Addgene, #17445). The HOTAIR full‐length and truncated cDNA sequences were PCR amplified from the LZRS‐HOTAIR plasmid (Gupta et al, 2010), cloned into pENTR and further sub‐cloned into pLenti CMV Blast DEST (706‐1; Addgene, #17451) (Campeau et al, 2009) using the Gateway system (Thermo Fisher Scientific). LSD1 was PCR amplified from pUNO1‐hLSD1a (Isoform NM_015013.3, Invivogen) and sub‐cloned into pDEST‐ZEO (Addgene, #17294). Oligonucleotide sequences for PCR are available in Appendix Table S1.
Cell transfection and transduction
HEK293T cells at 50–70% of confluence at T25 flasks were co‐transfected with 1.3 μg of psPAX2 (Addgene, #12260), 0.8 μg of pVSVG (Addgene, #36399), and 0.8 μg of the lentiviral plasmid bearing cDNA of GFP (CTR), full‐length (HOT), truncated HOTAIR (HOTΔP and HOTΔL), or 0.4 μg of each of the above constructs and 0.4 μg of LSD1‐OE lentiviral plasmid in presence of 5 µl of Lipofectamine® 2000 Transfection Reagent according to manufacturer's protocol (Thermo Fisher Scientific). Virus supernatant was recovered, filtered 48 h post‐transfection and added to Epi cells at 50–70% of confluence. After 24 h post‐transduction, cells were sub‐cultured every 2 days at a 1:4 ratio in 6 μg/ml of blasticidin or 6 μg/ml of blasticidin and 10 μg/ml of zeocin supplemented MEM alpha medium for 1 week and then in MEMalpha medium for additional 2 weeks prior to any experiment.
Antisense oligonucleotides (Appendix Table S1) were added as a supplement to a final concentration of 10 µM to Mes cells at 50% of confluence for 2 days and again for additional 2–3 days prior to RNA extraction or wound healing assay.
Wound healing assay
Cell suspensions containing 200,000 cells were seeded to each well of the six‐well plate and left growing to 95–100% of confluence for 24–36 h. After scratching, each wound was imaged twice at time t = 0 and t = 24 h post‐scratch with a Zeiss inverted microscope with a total of 30–48 high‐field units (HFU) per cell line in transduced Epi, six HFU per cell line in ASO treated cells, and 30 HFU per cell line for LSD1‐OE. The invaded area was calculated as a ratio of migrated cell surface area to total surface area with a web‐based image automated analysis software Tscratch (Gebäck et al, 2009). Results were presented as a mean ± SEM. P‐values were calculated using the Student's t‐test.
Subcellular fractionation
This protocol was adapted from Ref. (Gagnon et al, 2014). All steps were performed on ice with ice‐cold buffers supplemented by 20 U/µl SUPERase‐IN (Thermo Fisher Scientific) for RNA extraction and 0.1 mM AEBSF (SIGMA) for protein extraction. RNA extraction from all fractions was performed using TRIzol (Thermo Fisher Scientific) at 65°C for 5 min with regular vortexing and then purified with miRNeasy kit (Qiagen) according to the manufacturer's instructions. For protein extractions, the chromatin fraction was sonicated for 8 min (30 s‐on/30 s‐off, “high power”) on the Bioruptor Plus (Diagenode). Protein content was quantified with the Thermo Fisher Scientific™ BCA Protein Assay Kit (Thermo Fisher Scientific).
Protein extraction and Western blot
Cells at 80% of confluence were lysed in RIPA buffer (Thermo Scientific) supplemented with 0.1 mM AEBSF (SIGMA). A total of 5 and 10 μg of the whole protein extract were separated on a NuPAGE Novex 4–12% Bis‐Tris Protein Gel and transferred using Thermo Fisher Scientific iBlot Dry Blotting System (Thermo Fisher Scientific). After blocking, membranes were immunoblotted with the Epithelial‐Mesenchymal Transition Western Blot Cocktail (1:2,500 dilution; Abcam, ab157392), anti‐GAPDH (Millipore, mab374), EMT Sampler kit (Cell Signaling Technology, 9782), anti‐LSD1 (Diagenode, C15410067) overnight at 4°C, then washed and incubated with a corresponding HRP‐conjugated secondary antibody (1:5,000 dilution) for 1 h at room temperature and visualized using the SuperSignal West Femto, Dura, or Pico Substrate (Thermo Fisher Scientific). Quantifications of protein amounts were performed relative to GAPDH using the ImageJ software.
Immunofluorescence
A total of 20,000 cells suspension was seeded on a 4‐well microscope slide and let growing for 24 h. Following PBS wash, cells were fixed using formaldehyde (3%)–sucrose (2%) solution for 15 min, permeabilized, and blocked with 10% goat serum (Thermo Fisher Scientific). For F‐actin staining, cells were incubated with 0.5 μg/ml DMSO solution of phalloidin‐tetramethylrhodamine isothiocyanate (TRITC; Sigma) for 40 min at room temperature. For ZO‐1, cells were incubated with the primary antibody (1:100 dilution; Cell Signaling Technology, 8193) for 40 min at 37°C, washed in PBS, and incubated with Alexa Fluor 594 Goat anti‐Rabbit secondary antibody (1:400; Thermo Fisher Scientific, A11037) for 30 min at 37°C. Slides were washed and mounted using a ½ dilution of Vectashield Mounting Medium with DAPI (Vector Laboratories).
Fluorescent microscopy and image analysis
For each cell line, three HFUs per well were acquired as stacks composed of twenty slices of 0.5 µm interval over the height of the cells with a 40X objective on a Zeiss AxioVision microscope equipped with an ApoTome module (PiCT‐BDD platform, Institut Curie). All images were captured with identical exposure time for DAPI and Alexa Fluor 594 using AxioVision software and then analyzed using the Fiji software (Schindelin et al, 2012). Stacks were processed with the “Z‐project” tool (“Sum Slices” setting) and an identical minimum threshold value was set for all images. Signal was then quantified using the “Measure” tool and normalized by the number of cells per image. Integrated density per cell was again normalized on overall image background signal to reduce hybridization biases between slides and presented as a mean ± SEM for at least 11 HFUs.
RNA extraction and reverse transcription
Total RNA extraction was performed directly from cell cultures with miRNeasy kit according to the manufacture' instructions (Qiagen). Only RNAs with the RNA integrity number (RIN) above eight were used for further experiments. Reverse transcription (RT) was performed on 500 ng of RNA with either random and oligo(dT) primers mix (iScript™ cDNA Synthesis Kit) or specific oligonucleotides (SuperScript II Reverse Transcriptase, Thermo Fisher Scientific; Appendix Table S1). Reactions without RT were included as a negative control for DNA contamination.
RNA‐seq library preparation
1 µg of RNA was depleted for ribosomal RNA with the RiboMinus™ Eukaryote Kit for RNA‐seq (Thermo Fisher Scientific) and converted into cDNA library using a TruSeq Stranded Total Library Preparation kit (Illumina). cDNA libraries were normalized using an Illumina Duplex‐specific Nuclease (DSN) protocol prior to a paired‐end sequencing on HiSeq™ 2500 (Illumina).
RNA‐seq data analysis
Reads were mapped allowing three mismatches using TopHat 2.0.4 (Trapnell et al, 2009) and the human genome version hg19. Uniquely mapped reads were assembled using the BedTools suite (Quinlan & Hall, 2010) and merged in segments if mapped in the same strand to the GENCODE v15 annotation to extract protein‐coding genes and annotated noncoding genes including lncRNA, antisense, sense_intronic, sense‐overlapped, and pseudogenes.
Differential expression analysis was performed using the DESeq R package (Anders & Huber, 2010). Only genes with an expression fold change (FC) above 2 and adjusted P‐value below 0.05 were retained as significantly differentially expressed.
CUT&RUN
The experiment was performed in two replicates following the protocol from Henikoff Lab with some modifications (Skene et al, 2018). Briefly, slowly frozen (for histone marks) or fresh (for IgG, LSD1, and EZH2) cells pelleted after scrapping were resuspended in wash buffer at 107 cells/ml. At room temperature, per sample, 10 μl of Concanavalin A beads slurry washed in bead activation buffer was added to 106 of cells suspension in the total volume of 1 ml of wash buffer and incubated for 10 min with rotation at 15–20 rpm. Antibodies against H3K4me2 (Millipore, 07‐030), H3K27ac (Millipore, MABE647), H3K9me2 (Active Motif, 39239), LSD1 (Diagenode, C15410067), and EZH2 (Active Motif, 39933) were diluted 100 times and IgG (Invitrogen, 31235)—1,100 times in 50 μl of antibody buffer (wash buffer with 0.1% digitonin, 2 mM EDTA) and added to the nuclei fixed on beads and incubated 10 min for histone marks and 1 h for LSD1, EZH2, and IgG. Afterward, the beads were washed twice with 250 µl of digitonin buffer (wash buffer with 0.1% digitonin) and resuspended in 50 µl of pAG‐MNase (CUTANA EpiCypher, 1:20 dilution) in digitonin buffer, incubated 10 min with agitation. Beads were washed twice in 250 µl of ice‐cold digitonin buffer, resuspended in 100 µl of ice‐cold digitonin buffer, kept on ice for 5 min before adding 2 µl of 100 mM CaCl₂ and incubating for 30 min on ice. The reaction was stopped by addition of 100 µl of stop buffer containing 0.1% digitonin and 10 pg/ml spike‐in DNA and incubation for 10 min at 37°C. Bead suspension was centrifuged at 16 krcf at 4°C for 5 min, beads recovered for DNA fragments purification with NEB Monarch PCR & DNA purification kit following the protocol enriching for short DNA fragments. DNA was quantified by Qubit HS DNA kit, and 5 ng of each sample was used for DNA library preparation.
CUT&RUN libraries preparation and sequencing
CUT&RUN libraries were prepared using the TruSeq ChIP‐Sample Prep Kit‐Set A and PCR Box (Illumina) from 5 ng of DNA with 10 PCR cycles for amplification following the manufacture's procedures. Concentration and quality were assessed by Qubit with dsDNA HS Assay Kit (Thermo Fisher Scientific) and High Sensitivity DNA Analysis Chip Kit (Agilent Technologies). Libraries were sequenced on a NovaSeq S1 device in a pair‐end 100 bp read length mode. DNA sequencing metrics are present in Appendix Table S2.
CUT&RUN analysis
Reads were first aligned to human genome version GRCh38 using bowtie (version 2.4.1) (Langmead & Salzberg, 2012), with options ‐I 10 ‐X 700—no‐mixed. Reads with MAPQ value ≥ 30 were kept for further analysis. To equilibrate datasets, the larger samples were randomly down‐sampled to approximately 9 million of reads. For histone marks (H3K27ac, H3K4me2) and LSD1, peaks were called relative to IgG control using HMCan (Ashoor et al, 2013) with punctuate parameters according to (github.com/BoevaLab/HMCan/tree/master/configurations/HMCan.config.punctuate.txt), keeping duplicate reads, and without correction for ploidy. Only peaks showing at least one nucleotide overlap between two replicates were retained and subsequently merged to common peaks. For further analysis, common peaks between conditions were also merged to peak regions (Dataset EV5). The merged peaks were assigned to closest genes, and the shortest distance between each peak and the closest transcript start site (TSS) coordinates were calculated using Gencode v32 annotation. H3K27ac and H3K4me2 peaks within the window of 2 kb around the TSS were assigned to promoters. Regulatory elements (enhancers and super‐enhancers) were annotated using the LILY pipeline (Boeva et al, 2017). Peaks overlap with genomic elements was retrieved from genome mapping information of Gencode transcripts using BEDtools. H3K27ac and LSD1 peaks were validated by qPCR for one enhancer regions (see Quantitative PCR section below, Appendix Fig S8B and C).
Gene features analysis
Gene ontology biological process, KEGG pathways, and cellular compartment terms enrichment analyses were performed using DAVID 6.8 or ClusterProfiler (Huang et al, 2008; Huang et al, 2009; Yu et al, 2012). Enrichment score was calculated as −log10(P‐value). Gene sets are present in Dataset EV2.
Quantitative PCR
cDNA was diluted 10–50 times and quantified by real‐time PCR with LightCycler® 480 SYBR Green I Master (SIGMA). The RPL11 gene was used as a reference to quantify a relative abundance of each cDNA (Appendix Table S1). Error bars represent standard deviations in relative quantity of cDNA prepared from at least three independent experiments. To validate CUT&RUN annotated peaks, we performed a qPCR with IP‐ or IgG‐DNA adjected to 0.5 ng/μl, using the TGFB2 SE_67 region as a region (Appendix Table S1, Appendix Fig S8).
Author contributions
Project administration and funding acquisition, AM, MP; Conceptualization, supervision and writing, MP; Draft revisions, DF, JJ; Investigation, MP, CB, JJ, DF; Formal analysis, MG, US, ZS; Expertise, AL‐V, SG.
Conflict of interest
The authors declare that they have no conflict of interest.
Supporting information
Appendix
Expanded View Figures PDF
Dataset EV1
Dataset EV2
Dataset EV3
Dataset EV4
Dataset EV5
Source Data for Expanded View/Appendix
Review Process File
Source Data for Figure 2
Source Data for Figure 3
Source Data for Figure 4
Acknowledgements
We deeply thank Rocco Cipolla, Elena Battistello, Sandra Carignon, Matthieu Lejars, and Marc Descrimes for technical contributions, Karina Jouravleva, and Luis Castro‐Vega for discussions and expertise. The HOTAIR cDNA containing LZRS plasmid was a kind gift of H.Y. Chang. RNA‐seq and CUT&RUN sequencing efforts were supported by the grant from the ICGex program of Institut Curie attributed to A.M. and benefited from the facilities and expertise of the NGS platform of Institut Curie, supported by Agence Nationale de la Recherche (ANR‐10‐EQPX‐03, ANR10‐INBS‐09‐08). A.M., M.P., and Z.S. were supported by the European Research Council (ERC‐consolidator DARK‐616180‐ERC‐2014) attributed to A.M., J.J. was supported by “La Ligue contre le Cancer.” This project has received funding from the European Union's Horizon 2020 research and innovation programme under the Marie Sklodowska‐Curie grant agreement No 795109. This funding was attributed to DF.
EMBO reports (2021) 22: e50193.
Footnotes
Correction added on 3 June, after first online publication: Information about funding from the European Union’s Horizon 2020 research and innovation programme under the Marie Sklodowska‐Curie grant agreement No 795109 to DF was added.
Contributor Information
Marina Pinskaya, Email: marina.pinskaya@curie.fr.
Antonin Morillon, Email: antonin.morillon@curie.fr.
Data availability
The datasets and computer code produced in this study are available in the following links:
-
Raw RNA‐seq and CUT&RUN datasets: Gene Expression Omnibus GSE106517 (https://www.ncbi.nlm.nih.gov/geo/query/acc.cgi?acc=GSE106517).
Computer scripts: GitHub (https://github.com/MorillonLab/HOTAIR_LSD1).
References
- Ambrosio S, Amente S, Saccà CD, Capasso M, Calogero RA, Lania L, Majello B (2017) LSD1 mediates MYCN control of epithelial‐mesenchymal transition through silencing of metastatic suppressor NDRG1 gene. Oncotarget 8: 3854–3869 [DOI] [PMC free article] [PubMed] [Google Scholar]
- Anders S, Huber W (2010) Differential expression analysis for sequence count data. Genome Biol 11: R106 [DOI] [PMC free article] [PubMed] [Google Scholar]
- Ashoor H, Hérault A, Kamoun A, Radvanyi F, Bajic VB, Barillot E, Boeva V (2013) HMCan: a method for detecting chromatin modifications in cancer samples using ChIP‐seq data. Bioinformatics 29: 2979–2986 [DOI] [PMC free article] [PubMed] [Google Scholar]
- Battistelli C, Cicchini C, Santangelo L, Tramontano A, Grassi L, Gonzalez FJ, de Nonno V, Grassi G, Amicone L, Tripodi M (2017) The Snail repressor recruits EZH2 to specific genomic sites through the enrollment of the lncRNA HOTAIR in epithelial‐to‐mesenchymal transition. Oncogene 36: 942–955 [DOI] [PMC free article] [PubMed] [Google Scholar]
- Boeva V, Louis‐Brennetot C, Peltier A, Durand S, Pierre‐Eugène C, Raynal V, Etchevers HC, Thomas S, Lermine A, Daudigeos‐Dubus Eet al (2017) Heterogeneity of neuroblastoma cell identity defined by transcriptional circuitries. Nat Genet 49: 1408–1413 [DOI] [PubMed] [Google Scholar]
- Boulding T, McCuaig Rd, Tan A, Hardy K, Wu F, Dunn J, Kalimutho M, Sutton Cr, Forwood Jk, Bert Aget al (2018) LSD1 activation promotes inducible EMT programs and modulates the tumour microenvironment in breast cancer. Sci Rep 8: 73 [DOI] [PMC free article] [PubMed] [Google Scholar]
- Cai C, He H, Gao S, Chen S, Yu Z, Gao Y, Chen S, Chen M, Zhang J, Ahmed Met al (2014) Lysine‐specific demethylase 1 has dual functions as a major regulator of androgen receptor transcriptional activity. Cell Rep 9: 1618–1627 [DOI] [PMC free article] [PubMed] [Google Scholar]
- Campeau E, Ruhl VE, Rodier F, Smith CL, Rahmberg BL, Fuss JO, Campisi J, Yaswen P, Cooper PK, Kaufman PD (2009) A versatile viral system for expression and depletion of proteins in mammalian cells. PLoS One 4: e6529 [DOI] [PMC free article] [PubMed] [Google Scholar]
- Carnesecchi J, Cerutti C, Vanacker J‐M, Forcet C (2017) ERRα protein is stabilized by LSD1 in a demethylation‐independent manner. PLoS One 12: e0188871 [DOI] [PMC free article] [PubMed] [Google Scholar]
- Castro‐Vega LJ, Jouravleva K, Liu W‐Y, Martinez C, Gestraud P, Hupé P, Servant N, Albaud B, Gentien D, Gad Set al (2013) Telomere crisis in kidney epithelial cells promotes the acquisition of a microRNA signature retrieved in aggressive renal cell carcinomas. Carcinogenesis 34: 1173–1180 [DOI] [PubMed] [Google Scholar]
- Creyghton Mp, Cheng Aw, Welstead Gg, Kooistra T, Carey Bw, Steine Ej, Hanna J, Lodato Ma, Frampton Gm, Sharp Paet al (2010) Histone H3K27ac separates active from poised enhancers and predicts developmental state. Proc Natl Acad Sci USA 107: 21931–21936 [DOI] [PMC free article] [PubMed] [Google Scholar]
- Deng J, Yang M, Jiang R, An N, Wang X, Liu B (2017) Long non‐coding RNA HOTAIR regulates the proliferation, self‐renewal capacity, tumor formation and migration of the cancer stem‐like cell (CSC) subpopulation enriched from breast cancer cells. PLoS One 12: e0170860 [DOI] [PMC free article] [PubMed] [Google Scholar] [Retracted]
- Di Benedetto M, Bièche I, Deshayes F, Vacher S, Nouet S, Collura V, Seitz I, Louis S, Pineau P, Amsellem‐Ouazana Det al (2006) Structural organization and expression of human MTUS1, a candidate 8p22 tumor suppressor gene encoding a family of angiotensin II AT2 receptor‐interacting proteins, ATIP. Gene 380: 127–136 [DOI] [PubMed] [Google Scholar]
- Ding C, Cheng S, Yang Z, Lv Z, Xiao H, Du C, Peng C, Xie H, Zhou L, Wu Jet al (2014) Long non‐coding RNA HOTAIR promotes cell migration and invasion via down‐regulation of RNA binding motif protein 38 in hepatocellular carcinoma cells. Int J Mol Sci 15: 4060–4076 [DOI] [PMC free article] [PubMed] [Google Scholar]
- Dong L, Hui L (2016) HOTAIR promotes proliferation, migration, and invasion of ovarian cancer SKOV3 cells through regulating PIK3R3. Med Sci Monit 22: 325–331 [DOI] [PMC free article] [PubMed] [Google Scholar]
- Egolf S, Aubert Y, Doepner M, Anderson A, Maldonado‐Lopez A, Pacella G, Lee J, Ko EK, Zou J, Lan Yet al (2019) LSD1 Inhibition promotes epithelial differentiation through derepression of fate‐determining transcription factors. Cell Rep 28: 1981–1992.e7 [DOI] [PMC free article] [PubMed] [Google Scholar]
- Feng J, Xu G, Liu J, Zhang Na, Li L, Ji J, Zhang J, Zhang L, Wang G, Wang Xet al (2016) Phosphorylation of LSD1 at Ser112 is crucial for its function in induction of EMT and metastasis in breast cancer. Breast Cancer Res Treat 159: 443–456 [DOI] [PubMed] [Google Scholar]
- Ferrari‐Amorotti G, Fragliasso V, Esteki R, Prudente Z, Soliera AR, Cattelani S, Manzotti G, Grisendi G, Dominici M, Pieraccioli Met al (2013) Inhibiting interactions of lysine demethylase LSD1 with snail/slug blocks cancer cell invasion. Cancer Res 73: 235–245 [DOI] [PMC free article] [PubMed] [Google Scholar]
- Gagnon KT, Li L, Janowski BA, Corey DR (2014) Analysis of nuclear RNA interference in human cells by subcellular fractionation and Argonaute loading. Nat Protoc 9: 2045–2060 [DOI] [PMC free article] [PubMed] [Google Scholar]
- Gebäck T, Schulz MMP, Koumoutsakos P, Detmar M (2009) TScratch: a novel and simple software tool for automated analysis of monolayer wound healing assays. Biotechniques 46: 265–274 [DOI] [PubMed] [Google Scholar]
- Gröger CJ, Grubinger M, Waldhör T, Vierlinger K, Mikulits W (2012) Meta‐analysis of gene expression signatures defining the epithelial to mesenchymal transition during cancer progression. PLoS One 7: e51136 [DOI] [PMC free article] [PubMed] [Google Scholar]
- Gupta RA, Shah N, Wang KC, Kim J, Horlings HM, Wong DJ, Tsai M‐C, Hung T, Argani P, Rinn JLet al (2010) Long non‐coding RNA HOTAIR reprograms chromatin state to promote cancer metastasis. Nature 464: 1071–1076 [DOI] [PMC free article] [PubMed] [Google Scholar]
- Harris W, Huang Xu, Lynch J, Spencer G, Hitchin J, Li Y, Ciceri F, Blaser J, Greystoke B, Jordan Aet al (2012) The histone demethylase KDM1A sustains the oncogenic potential of MLL‐AF9 leukemia stem cells. Cancer Cell 21: 473–487 [DOI] [PubMed] [Google Scholar]
- Hendrickson DG, Kelley DR, Tenen D, Bernstein B, Rinn JL (2016) Widespread RNA binding by chromatin‐associated proteins. Genome Biol 17: 28 [DOI] [PMC free article] [PubMed] [Google Scholar]
- Hino S, Kohrogi K, Nakao M (2016) Histone demethylase LSD1 controls the phenotypic plasticity of cancer cells. Cancer Sci 107: 1187–1192 [DOI] [PMC free article] [PubMed] [Google Scholar]
- Hnisz D, Abraham BJ, Lee TI, Lau A, Saint‐André V, Sigova AA, Hoke HA, Young RA (2013) Super‐enhancers in the control of cell identity and disease. Cell 155: 934–947 [DOI] [PMC free article] [PubMed] [Google Scholar]
- Huang J, Sengupta R, Espejo AB, Lee MG, Dorsey JA, Richter M, Opravil S, Shiekhattar R, Bedford MT, Jenuwein Tet al (2007) p53 is regulated by the lysine demethylase LSD1. Nature 449: 105–108 [DOI] [PubMed] [Google Scholar]
- Huang DW, Sherman BT, Lempicki RA (2008) Systematic and integrative analysis of large gene lists using DAVID bioinformatics resources. Nat Protoc 4: 44–57 [DOI] [PubMed] [Google Scholar]
- Huang DW, Sherman BT, Lempicki RA (2009) Bioinformatics enrichment tools: paths toward the comprehensive functional analysis of large gene lists. Nucleic Acids Res 37: 1–13 [DOI] [PMC free article] [PubMed] [Google Scholar]
- Huarte M, Marín‐Béjar O (2015) Long noncoding RNAs: from identification to functions and mechanisms. Adv Genomics Genet 5: 257–274 [Google Scholar]
- Kalwa M, Hänzelmann S, Otto S, Kuo C‐C, Franzen J, Joussen S, Fernandez‐Rebollo E, Rath B, Koch C, Hofmann Aet al (2016) The lncRNA HOTAIR impacts on mesenchymal stem cells via triple helix formation. Nucleic Acids Res 44: 10631–10643 [DOI] [PMC free article] [PubMed] [Google Scholar]
- Kim JK, Diehl JA (2009) Nuclear cyclin D1: an oncogenic driver in human cancer. J Cell Physiol 220: 292–296 [DOI] [PMC free article] [PubMed] [Google Scholar]
- Kogo R, Shimamura T, Mimori K, Kawahara K, Imoto S, Sudo T, Tanaka F, Shibata K, Suzuki A, Komune Set al (2011) Long noncoding RNA HOTAIR regulates polycomb‐dependent chromatin modification and is associated with poor prognosis in colorectal cancers. Cancer Res 71: 6320–6326 [DOI] [PubMed] [Google Scholar]
- Lamouille S, Xu J, Derynck R (2014) Molecular mechanisms of epithelial‐mesenchymal transition. Nat Rev Mol Cell Biol 15: 178–196 [DOI] [PMC free article] [PubMed] [Google Scholar]
- Lan F, Collins RE, De Cegli R, Alpatov R, Horton JR, Shi X, Gozani O, Cheng X, Shi Y (2007a) Recognition of unmethylated histone H3 lysine 4 links BHC80 to LSD1‐mediated gene repression. Nature 448: 718–722 [DOI] [PMC free article] [PubMed] [Google Scholar]
- Lan F, Zaratiegui M, Villén J, Vaughn MW, Verdel A, Huarte M, Shi Y, Gygi SP, Moazed D, Martienssen RAet al (2007b) S. pombe LSD1 homologs regulate heterochromatin propagation and euchromatic gene transcription. Mol Cell 26: 89–101 [DOI] [PubMed] [Google Scholar]
- Langmead B, Salzberg SL (2012) Fast gapped‐read alignment with Bowtie 2. Nat Methods 9: 357–359 [DOI] [PMC free article] [PubMed] [Google Scholar]
- Li Y, Wang Z, Shi H, Li H, Li L, Fang R, Cai X, Liu B, Zhang X, Ye L (2016) HBXIP and LSD1 scaffolded by lncRNA hotair mediate transcriptional activation by c‐Myc. Cancer Res 76: 293–304 [DOI] [PubMed] [Google Scholar]
- Li H‐M, Yang H, Wen D‐Y, Luo Y‐H, Liang C‐Y, Pan D‐H, Ma W, Chen G, He Y, Chen J‐Q (2017) Overexpression of LncRNA HOTAIR is associated with poor prognosis in thyroid carcinoma: a study based on TCGA and GEO data. Hormone Metab Res 49: 388–399 [DOI] [PubMed] [Google Scholar]
- Liang H, Yu T, Han Y, Jiang H, Wang C, You T, Zhao X, Shan H, Yang R, Yang Let al (2018) LncRNA PTAR promotes EMT and invasion‐metastasis in serous ovarian cancer by competitively binding miR‐101‐3p to regulate ZEB1 expression. Mol Cancer 17: 119 [DOI] [PMC free article] [PubMed] [Google Scholar]
- Lim S, Janzer A, Becker A, Zimmer A, Schüle R, Buettner R, Kirfel J (2010) Lysine‐specific demethylase 1 (LSD1) is highly expressed in ER‐negative breast cancers and a biomarker predicting aggressive biology. Carcinogenesis 31: 512–520 [DOI] [PubMed] [Google Scholar]
- Lv T, Yuan D, Miao X, Lv Y, Zhan P, Shen X, Song Y (2012) Over‐expression of LSD1 promotes proliferation, migration and invasion in non‐small cell lung cancer. PLoS One 7: e35065 [DOI] [PMC free article] [PubMed] [Google Scholar]
- Maiques‐Diaz A, Spencer GJ, Lynch JT, Ciceri F, Williams EL, Amaral FMR, Wiseman DH, Harris WJ, Li Y, Sahoo Set al (2018) Enhancer activation by pharmacologic displacement of LSD1 from GFI1 induces differentiation in acute myeloid leukemia. Cell Rep 22: 3641–3659 [DOI] [PMC free article] [PubMed] [Google Scholar]
- McDonald OG, Wu H, Timp W, Doi A, Feinberg AP (2011) Genome‐scale epigenetic reprogramming during epithelial‐to‐mesenchymal transition. Nat Struct Mol Biol 18: 867–874 [DOI] [PMC free article] [PubMed] [Google Scholar]
- Mercer TR, Gerhardt DJ, Dinger ME, Crawford J, Trapnell C, Jeddeloh JA, Mattick JS, Rinn JL (2012) Targeted RNA sequencing reveals the deep complexity of the human transcriptome. Nat Biotechnol 30: 99–104 [DOI] [PMC free article] [PubMed] [Google Scholar]
- Metzger E, Wissmann M, Yin N, Müller JM, Schneider R, Peters AHFM, Günther T, Buettner R, Schüle R (2005) LSD1 demethylates repressive histone marks to promote androgen‐receptor‐dependent transcription. Nature 437: 436–439 [DOI] [PubMed] [Google Scholar]
- Morlando M, Ballarino M, Fatica A, Bozzoni I (2014) The role of long noncoding RNAs in the epigenetic control of gene expression. ChemMedChem 9: 505–510 [DOI] [PubMed] [Google Scholar]
- Portoso M, Ragazzini R, Brenčič Ž, Moiani A, Michaud A, Vassilev I, Wassef M, Servant N, Sargueil B, Margueron R (2017) PRC2 is dispensable for HOTAIR‐mediated transcriptional repression. EMBO J 36: 981–994 [DOI] [PMC free article] [PubMed] [Google Scholar]
- Qiu J, Lin Y, Ye L, Ding J, Feng W, Jin H, Zhang Y, Li Q, Hua K (2014) Overexpression of long non‐coding RNA HOTAIR predicts poor patient prognosis and promotes tumor metastasis in epithelial ovarian cancer. Gynecol Oncol 134: 121–128 [DOI] [PubMed] [Google Scholar]
- Quinlan AR, Hall IM (2010) BEDTools: a flexible suite of utilities for comparing genomic features. Bioinformatics 26: 841–842 [DOI] [PMC free article] [PubMed] [Google Scholar]
- Quinn JJ, Chang HY (2015) Unique features of long non‐coding RNA biogenesis and function. Nat Rev Genet 17: 47–62 [DOI] [PubMed] [Google Scholar]
- Richards EJ, Zhang Gu, Li Z‐P, Permuth‐Wey J, Challa S, Li Y, Kong W, Dan Su, Bui MM, Coppola Det al (2015) Long non‐coding RNAs (LncRNA) regulated by transforming growth factor (TGF) β: LncRNA‐hit‐mediated TGFβ‐induced epithelial to mesenchymal transition in mammary epithelia. J Biol Chem 290: 6857–6867 [DOI] [PMC free article] [PubMed] [Google Scholar]
- Rinn JL, Kertesz M, Wang JK, Squazzo SL, Xu X, Brugmann SA, Goodnough LH, Helms JA, Farnham PJ, Segal Eet al (2007) Functional demarcation of active and silent chromatin domains in human HOX loci by noncoding RNAs. Cell 129: 1311–1323 [DOI] [PMC free article] [PubMed] [Google Scholar]
- Roth M, Wang Z, Chen WY (2016) SIRT1 and LSD1 competitively regulate KU70 functions in DNA repair and mutation acquisition in cancer cells. Oncotarget 7: 50195–50214 [DOI] [PMC free article] [PubMed] [Google Scholar]
- Schenk T, Chen WC, Göllner S, Howell L, Jin L, Hebestreit K, Klein H‐U, Popescu AC, Burnett A, Mills Ket al (2012) Inhibition of the LSD1 (KDM1A) demethylase reactivates the all‐trans‐retinoic acid differentiation pathway in acute myeloid leukemia. Nat Med 18: 605–611 [DOI] [PMC free article] [PubMed] [Google Scholar]
- Schindelin J, Arganda‐Carreras I, Frise E, Kaynig V, Longair M, Pietzsch T, Preibisch S, Rueden C, Saalfeld S, Schmid Bet al (2012) Fiji: an open‐source platform for biological‐image analysis. Nat Methods 9: 676–682 [DOI] [PMC free article] [PubMed] [Google Scholar]
- Scionti I, Hayashi S, Mouradian S, Girard E, Esteves de Lima J, Morel V, Simonet T, Wurmser M, Maire P, Ancelin Ket al (2017) LSD1 controls timely MyoD expression via MyoD core enhancer transcription. Cell Rep 18: 1996–2006 [DOI] [PubMed] [Google Scholar]
- Scoumanne A, Chen X (2007) The lysine‐specific demethylase 1 is required for cell proliferation in both p53‐dependent and ‐independent manners. J Biol Chem 282: 15471–15475 [DOI] [PubMed] [Google Scholar]
- Shi Y, Lan F, Matson C, Mulligan P, Whetstine JR, Cole PA, Casero RA, Shi Y (2004) Histone demethylation mediated by the nuclear amine oxidase homolog LSD1. Cell 119: 941–953 [DOI] [PubMed] [Google Scholar]
- Shi S‐J, Wang L‐J, Yu B, Li Y‐H, Jin Y, Bai X‐Z (2015) LncRNA‐ATB promotes trastuzumab resistance and invasion‐metastasis cascade in breast cancer. Oncotarget 6: 11652–11663 [DOI] [PMC free article] [PubMed] [Google Scholar]
- Shimojo M, Hersh LB (2006) Characterization of the REST/NRSF‐interacting LIM domain protein (RILP): localization and interaction with REST/NRSF. J Neurochem 96: 1130–1138 [DOI] [PubMed] [Google Scholar]
- Shin JY, Beckett JD, Bagirzadeh R, Creamer TJ, Shah AA, McMahan Z, Paik JJ, Sampedro MM, MacFarlane EG, Beer MAet al (2019) Epigenetic activation and memory at a TGFB2 enhancer in systemic sclerosis. Sci Transl Med 11: eaaw0790 [DOI] [PMC free article] [PubMed] [Google Scholar]
- Skene PJ, Henikoff JG, Henikoff S (2018) Targeted in situ genome‐wide profiling with high efficiency for low cell numbers. Nat Protoc 13: 1006–1019 [DOI] [PubMed] [Google Scholar]
- Somarowthu S, Legiewicz M, Chillón I, Marcia M, Liu F, Pyle AM (2015) HOTAIR forms an intricate and modular secondary structure. Mol Cell 58: 353–361 [DOI] [PMC free article] [PubMed] [Google Scholar]
- Sun M, Nie F, Wang Y, Zhang Z, Hou J, He D, Xie M, Xu L, De W, Wang Zet al (2016) LncRNA HOXA11‐AS promotes proliferation and invasion of gastric cancer by scaffolding the chromatin modification factors PRC2, LSD1, and DNMT1. Cancer Res 76: 6299–6310 [DOI] [PubMed] [Google Scholar]
- Tam WL, Weinberg RA (2013) The epigenetics of epithelial‐mesenchymal plasticity in cancer. Nat Med 19: 1438–1449 [DOI] [PMC free article] [PubMed] [Google Scholar]
- Tornavaca O, Chia M, Dufton N, Almagro LO, Conway DE, Randi AM, Schwartz MA, Matter K, Balda MS (2015) ZO‐1 controls endothelial adherens junctions, cell–cell tension, angiogenesis, and barrier formation. J Cell Biol 208: 821–838 [DOI] [PMC free article] [PubMed] [Google Scholar]
- Trapnell C, Pachter L, Salzberg SL (2009) TopHat: discovering splice junctions with RNA‐Seq. Bioinformatics 25: 1105–1111 [DOI] [PMC free article] [PubMed] [Google Scholar]
- Tsai M‐C, Manor O, Wan Y, Mosammaparast N, Wang JK, Lan F, Shi Y, Segal E, Chang HY (2010) Long noncoding RNA as modular scaffold of histone modification complexes. Science 329: 689–693 [DOI] [PMC free article] [PubMed] [Google Scholar]
- Tsai M‐C, Spitale RC, Chang HY (2011) Long intergenic noncoding RNAs: new links in cancer progression. Cancer Res 71: 3–7 [DOI] [PMC free article] [PubMed] [Google Scholar]
- Wang Y, Devereux W, Woster PM, Stewart TM, Hacker A, Casero RA (2001) Cloning and characterization of a human polyamine oxidase that is inducible by polyamine analogue exposure. Cancer Res 61: 5370–5373 [PubMed] [Google Scholar]
- Wang J, Scully K, Zhu X, Cai L, Zhang J, Prefontaine GG, Krones A, Ohgi KA, Zhu P, Garcia‐Bassets Iet al (2007) Opposing LSD1 complexes function in developmental gene activation and repression programmes. Nature 446: 882–887 [DOI] [PubMed] [Google Scholar]
- Wang Y, Zhang H, Chen Y, Sun Y, Yang F, Yu W, Liang J, Sun L, Yang X, Shi Let al (2009) LSD1 is a subunit of the NuRD complex and targets the metastasis programs in breast cancer. Cell 138: 660–672 [DOI] [PubMed] [Google Scholar]
- Whyte WA, Bilodeau S, Orlando DA, Hoke HA, Frampton GM, Foster CT, Cowley SM, Young RA (2012) Enhancer decommissioning by LSD1 during embryonic stem cell differentiation. Nature 482: 221–225 [DOI] [PMC free article] [PubMed] [Google Scholar]
- Wissmann M, Yin Na, Müller JM, Greschik H, Fodor BD, Jenuwein T, Vogler C, Schneider R, Günther T, Buettner Ret al (2007) Cooperative demethylation by JMJD2C and LSD1 promotes androgen receptor‐dependent gene expression. Nat Cell Biol 9: 347–353 [DOI] [PubMed] [Google Scholar]
- Wu L, Murat P, Matak‐Vinkovic D, Murrell A, Balasubramanian S (2013) Binding Interactions between long noncoding RNA HOTAIR and PRC2 proteins. Biochemistry 52: 9519–9527 [DOI] [PMC free article] [PubMed] [Google Scholar]
- Wu Z‐H, Wang X‐L, Tang H‐M, Jiang T, Chen J, Lu S, Qiu G‐Q, Peng Z‐H, Yan D‐W (2014) Long non‐coding RNA HOTAIR is a powerful predictor of metastasis and poor prognosis and is associated with epithelial‐mesenchymal transition in colon cancer. Oncol Rep 32: 395–402 [DOI] [PubMed] [Google Scholar]
- Xie Q, Tang T, Pang J, Xu J, Yang X, Wang L, Huang Y, Huang Z, Liu G, Tong Det al (2020) LSD1 Promotes Bladder Cancer Progression by Upregulating LEF1 and Enhancing EMT. Front Oncol 10: 1234 [DOI] [PMC free article] [PubMed] [Google Scholar]
- Xu Z‐Y, Yu Q‐M, Du Y‐A, Yang L‐T, Dong R‐Z, Huang L, Yu P‐F, Cheng X‐D (2013) Knockdown of long non‐coding RNA HOTAIR suppresses tumor invasion and reverses epithelial‐mesenchymal transition in gastric cancer. Int J Biol Sci 9: 587–597 [DOI] [PMC free article] [PubMed] [Google Scholar]
- Xun J, Wang C, Yao J, Gao B, Zhang L (2019) Long non‐coding RNA HOTAIR modulates KLF12 to regulate gastric cancer progression via PI3K/ATK signaling pathway by sponging miR‐618. OncoTargets Ther 12: 10323–10334 [DOI] [PMC free article] [PubMed] [Google Scholar]
- Ye X, Weinberg RA (2015) Epithelial‐mesenchymal plasticity: a central regulator of cancer progression. Trends Cell Biol 25: 675–686 [DOI] [PMC free article] [PubMed] [Google Scholar]
- Yu G, Wang L‐G, Han Y, He Q‐Y (2012) clusterProfiler: an R package for comparing biological themes among gene clusters. OMICS J Integr Biol 16: 284–287 [DOI] [PMC free article] [PubMed] [Google Scholar]
- Zeng X, Jedrychowski MP, Chen Y, Serag S, Lavery GG, Gygi SP, Spiegelman BM (2016) Lysine‐specific demethylase 1 promotes brown adipose tissue thermogenesis via repressing glucocorticoid activation. Genes Dev 30: 1822–1836 [DOI] [PMC free article] [PubMed] [Google Scholar]
- Zhang A, Zhao JC, Kim J, Fong K‐W, Yang YA, Chakravarti D, Mo Y‐Y, Yu J (2015) LncRNA HOTAIR enhances the androgen‐receptor‐mediated transcriptional program and drives castration‐resistant prostate cancer. Cell Rep 13: 209–221 [DOI] [PMC free article] [PubMed] [Google Scholar]
- Zhang L, Carnesecchi J, Cerutti C, Tribollet V, Périan S, Forcet C, Wong J, Vanacker J‐M (2018) LSD1‐ERRα complex requires NRF1 to positively regulate transcription and cell invasion. Sci Rep 8: 10041 [DOI] [PMC free article] [PubMed] [Google Scholar]
- Zhang J, Zhao D, Li Q, Du X, Liu Y, Dai X, Hong L (2019) Upregulation of LSD1 promotes migration and invasion in gastric cancer through facilitating EMT. Cancer Manag Res 11: 4481–4491 [DOI] [PMC free article] [PubMed] [Google Scholar]
- Zhao S, Chen C, Chang K, Karnad A, Jagirdar J, Kumar AP, Freeman JW (2016) CD44 expression level and isoform contributes to pancreatic cancer cell plasticity, invasiveness, and response to therapy. Clin Cancer Res 22: 5592–5604 [DOI] [PMC free article] [PubMed] [Google Scholar]
- Zheng P, Yin Z, Wu Y, Xu Y, Luo Y, Zhang T‐C (2018) LncRNA HOTAIR promotes cell migration and invasion by regulating MKL1 via inhibition miR206 expression in HeLa cells. Cell Commun Signal 16: 5 [DOI] [PMC free article] [PubMed] [Google Scholar]
Associated Data
This section collects any data citations, data availability statements, or supplementary materials included in this article.
Supplementary Materials
Appendix
Expanded View Figures PDF
Dataset EV1
Dataset EV2
Dataset EV3
Dataset EV4
Dataset EV5
Source Data for Expanded View/Appendix
Review Process File
Source Data for Figure 2
Source Data for Figure 3
Source Data for Figure 4
Data Availability Statement
The datasets and computer code produced in this study are available in the following links:
-
Raw RNA‐seq and CUT&RUN datasets: Gene Expression Omnibus GSE106517 (https://www.ncbi.nlm.nih.gov/geo/query/acc.cgi?acc=GSE106517).
Computer scripts: GitHub (https://github.com/MorillonLab/HOTAIR_LSD1).