Abstract
Bottom-up proteomics is currently the dominant strategy for proteome analysis. It relies critically upon the use of a protease to digest proteins into peptides, which are then identified by liquid chromatography-mass spectrometry (LC-MS). The choice of protease(s) has a substantial impact upon the utility of the bottom-up results obtained. Protease selection determines the nature of the peptides produced, which in turn affects the ability to infer the presence and quantities of the parent proteins and post-translational modifications in the sample. We present here the software tool ProteaseGuru, which provides in silico digestions by candidate proteases, allowing evaluation of their utility for bottom-up proteomic experiments. This information is useful for both studies focused on a single or small number of proteins, and for analysis of entire complex proteomes. ProteaseGuru provides a convenient user interface, valuable peptide information, and data visualizations enabling the comparison of digestion results of different proteases. The information provided includes data tables of theoretical peptide sequences and their biophysical properties, results summaries outlining the numbers of shared and unique peptides per protease, histograms facilitating the comparison of proteome-wide proteolytic data, protein-specific summaries and sequence coverage maps. Examples are provided of its use to inform analysis of variant-containing proteins in the human proteome, as well as for studies requiring the use of multiple proteomic databases such as a human:mouse xenograft model, and microbiome metaproteomics.
Keywords: Mass spectrometry, bottom-up, in silico digestion, experiment planning, multiple proteases, proteolytic peptides
Graphical Abstract
Introduction:
Bottom-up proteomics is the principal approach employed for the analysis of complex proteomes. In bottom-up proteomics, proteins are digested into peptides prior to chromatographic separation and tandem mass spectrometric analysis1. Their identification and quantification aids in inference of the proteins present in the sample and provides valuable information on their abundances1. Bottom-up proteomics has evolved into a widespread and high-throughput approach providing sensitive and in-depth characterization of thousands of proteins in complex proteomes2.
This peptide-centric approach is entirely reliant on proteases, and their ability to generate predictable proteolytic peptides that span the proteome and are detectable by the mass spectrometer. Often, a single protease, trypsin, is used for digestion. Trypsin is robust, reproducible, and its cleavage motif at the carboxyl side of the amino acids lysine or arginine generates peptides that ionize well3,4. In some cases, a protease other than trypsin can yield improved results identifying more critical peptides for the identification of select proteins, PTMs, or sequence variations of interest3,5. Furthermore, we and others have shown that the use of multiple proteases in parallel produces superior results, increasing the number of proteins and post-translational modifications identified through increased proteome coverage6–9.
However, it is often not straightforward to determine which protease or combination of proteases is best suited for a given experiment. Due to cost, time, and sample limitations, it is frequently infeasible to employ a trial and error approach, digesting samples with all commonly used proteases to determine which worked the best. Selection of a protease or combination of proteases for sample digestion relies on the ability to determine which proteolytic digestions will produce peptides that are the most likely to be observed via mass spectrometry (based on their biophysical properties such as length and hydrophobicity), provide adequate protein sequence coverage, and generate sufficient numbers of unique peptides to identify specific proteins, or a large portion of the proteome. The ability to identify unique peptides is always important in bottom-up proteomics, but becomes even more critical when samples include proteins from multiple species, as is the case for xenograft or microbiome samples10–12. Peptides can not only be ambiguous between proteins within a species, but also between proteins from different species, compromising the ability to draw biological conclusions from the proteomic results. This creates a need for experimental planning, in which theoretical peptides produced by potential proteolytic digests are generated and the proteases can be compared for their efficacy prior to initiating laboratory work.
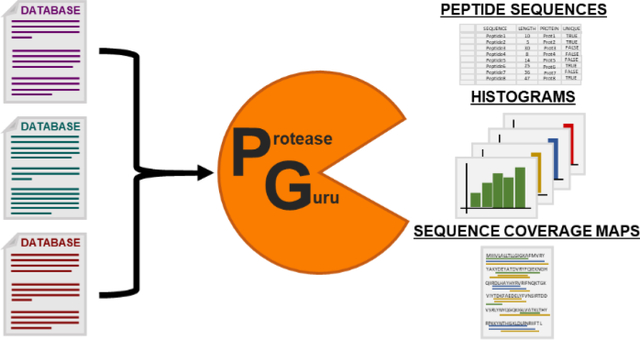
We have developed a free and open-source software tool, ProteaseGuru, to enable the comparison of candidate proteases through in silico digestion of protein databases. We designed ProteaseGuru with the goal of making it the easiest to use and most versatile in silico digestion tool to date. Users can select as many proteases as desired to digest the elements of one or more protein databases generating a pool of theoretical peptide sequences. After in silico digestion, ProteaseGuru determines several biophysical characteristics of the theoretical peptide sequences which can help to assess their uniqueness and utility for bottom-up proteomic analysis. Digestion result summaries are provided for each in silico digested database, giving the number of shared and unique peptides. When more than one database is utilized, as for the xenograft and microbiome applications mentioned above, an additional analysis is performed to determine which peptides are unique to a single protein and which are distinct to a single species. Such peptides are valuable for the identification and quantification of select proteins in complex proteomic backgrounds. ProteaseGuru provides graphical visualizations, such as histograms and protein sequence coverage maps, that aid the user in evaluation of candidate proteolytic digestions of either specific proteins of interest or on a whole proteome level. Specific examples demonstrating ProteaseGuru’s utility are shown for different experiment types, including proteogenomics, xenograft analysis, and microbiome metaproteomics.
Methods:
The Tool:
ProteaseGuru is a windows GUI application written in C# for the in silico digestion of protein databases. ProteaseGuru includes both MzLib (v1.0.485), a mass spectrometry code library (https://github.com/smith-chem-wisc/mzLib), and OxyPlot (v2.0.0), for data visualization, as Nuget packages. The application and its source code are available for download on GitHub (https://github.com/smith-chem-wisc/ProteaseGuru). The prediction of both a peptide sequence’s hydrophobicity and electrophoretic mobility are incorporated into ProteaseGuru. The hydrophobicity of unmodified peptide sequences is predicted using the SSRCalc algorithm described by Krokhin et al.13 and electrophoretic mobility of peptide sequences, including PTMs, is calculated based on a modified Cifuentes’s model14 as described in Chen et al.15.
ProteaseGuru accepts, as input, UniProt formatted XML and FASTA databases. Post-translational modifications annotated in the UniProt XML database are loaded into ProteaseGuru and are displayed within protein sequence coverage maps and annotated in the full sequence of theoretical peptides, and contribute towards the total molecular weight of the theoretical peptide. Additionally, users can choose, as part of the digestion parameters, to include carbamidomethylation of cysteine as a fixed modification and oxidation of methionine as a variable modification.
Data Analysis:
The utility of ProteaseGuru was evaluated for three different applications: 1) human:mouse xenografts, 2) identification of sequence variant-containing proteins, and 3) a subset of the human skin microbiome. Analysis was performed using ProteaseGuru version 0.0.21 with the following digestion conditions: proteases = [Arg-C, Asp-N, chymotrypsin (don’t cleave before proline), Glu-C (with asp), Lys-C (don’t cleave before proline) and trypsin (don’t cleave before proline)]; max number of missed cleavages = 2; min peptide length =7; and max peptide length = 50; and treat modified peptides as different = False.
For the xenograft application, human and mouse reference databases were downloaded from UniProt in .xml format. Only reviewed Swiss-Prot entries were included in the databases.
For the variant analysis, a proteogenomic database generated by Spritz16 (version 0.1.3) was utilized. The RNA-Seq data used as input for Spritz is publically available and can be downloaded from the GEO Sequence Read Archives with the following identifier GSE45428.
For the skin microbiome analysis, a subset of the entire microbiome was analyzed. In a review by Byrd et. al. concerning the human skin microbiome, a table was provided outlining the top 10 most abundant bacterial, eukaryotic, and viral species present in four different physiological sites (dry skin, moist skin, sebaceous skin and foot skin)17. With duplicate species removed a total of 59 species remained. Of those 59 species, 57 are present on UniProt and the corresponding protein databases in .fasta format were downloaded (See Supp. Table 1 for the specific species included, and download information).
Results and Discussion:
The utility of ProteaseGuru as an experimental planning and protease comparison tool will be demonstrated through three different case studies, representative of three distinct bottom-up proteomic applications: 1) proteomics on xenograft samples, 2) variant proteomics, and 3) microbiome analyses. We will also evaluate the relative ease of use and versatility of ProteaseGuru by benchmarking its features against those of existing tools
Analysis of Patient-Derived Xenografts
Proteomic samples are sometimes more complex than a single species’ proteome. Patient-derived xenografts (PDXs) are human tumor samples that have been transplanted into an immune-compromised, or humanized mouse. PDXs are a widely used model system for the study of cancer18–21. ProteaseGuru is applied here for PDX proteomics, performing in silico digestion and analysis of both the human and mouse UniProt databases to guide experimental design.
As part of its post-digestion processing, ProteaseGuru determines a peptide’s “uniqueness” for three different categories: 1) ‘Unique in database’ - a peptide is unique if it is the proteolytic product of a single protein within a database; 2) ‘Unique in all databases’ - a peptide is unique if it is the digestion product of a single protein within all of the databases analyzed; and 3) ‘Exclusive to this database’ – a peptide’s sequence (regardless of its shared or unique peptide status) is only found in one protein database. This categorization enables the identification of theoretical peptide sequences that can distinguish proteins and species in complex mixtures. For all uniqueness categorizations, isoleucine and leucine are treated as distinct amino acids. All three ‘uniqueness’ values are displayed in the ProteaseGuru peptide output files, and are included in result summaries, histograms, and sequence coverage maps. This feature of ProteaseGuru is critical for the combined analysis of the human and mouse databases since their proteomes have high sequence homology. Once the proteomes are digested, it can be difficult to determine which peptides belong to the human tumor, and which belong to mouse proteins. The ability to distinguish human and mouse proteins is critical to the success of many PDX studies, and their ability to inform future functional or clinical research.
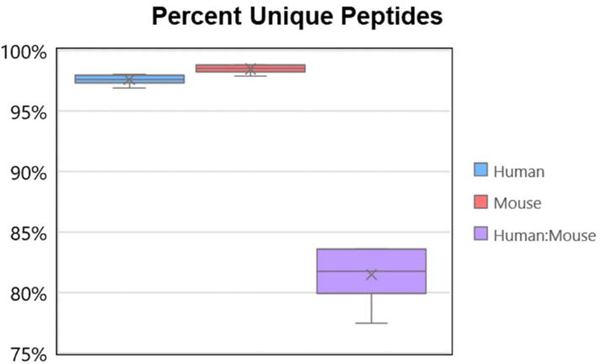
The extent to which homology between the two species complicates proteomic analysis was evaluated using the count of shared and unique peptides for the combined and individual database analyses provided in the ProteaseGuru summary file (Figure 1). The average percent unique peptide sequences for all of the in silico digestions is 97.6% for human and 98.5% for mouse (category 1). If there was no sequence homology between the two species, all peptides that were unique in the separate human and mouse analyses would remain unique peptides when the two proteomes are analyzed together, yielding a percent unique peptide value of approximately 98.01%. However, it is well documented that there is homology between the human and mouse proteome with the average degree of protein sequence conservation for orthologous human and mouse genes being approximately 85%22. When comparing the combined theoretical peptides from the human and mouse proteomes, the percent unique peptide sequences (category 2) observed was 81.5%, indicating the high homology of the human and mouse proteomes has a strong impact on the ability to identify peptides unique to a single protein.
Figure 1:
Box plot generated from the percent unique peptide sequences for all 6 proteolytic digests (Arg-C, Asp-N, Chym, Glu-C, Lys-C and Tryp) when the human and mouse databases are analyzed either separately (category 1) or together (category 2). The high sequence homology between the human and mouse protease creates a significant decrease in the percent of unique peptides, and a corresponding increase in the percent of shared peptides.
Analysis of Sequence Variant-Containing Proteins
Proteomic experiments can be focused on the entire proteome, or can be focused towards capturing a particular class of proteins, a specific protein, or a specific post-translational modification. ProteaseGuru allows selection of the protease or combination of proteases that will be most effective in achieving the goal of such proteomic experiments. Here we demonstrate this functionality by applying ProteaseGuru to a proteogenomic database generated by the software tool Spritz16. Spritz utilizes RNA-sequencing data and a reference genome to generate a protein XML database containing sequence variations present in the sample’s transcriptome.
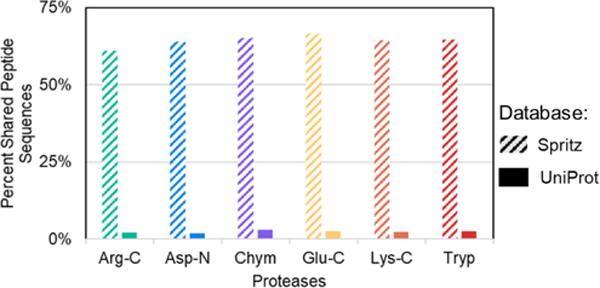
Proteins translated from variant transcripts may have zero, minor or very substantive amino acid sequence differences, depending on the nature of the nucleic acid variation(s) present. A proteogenomic database, generated from these transcripts, will include greater proteomic complexity than the standard UniProt database because the translation products derived from both alleles are represented. These homologous alleles, producing related transcripts, will give rise to translation products which also have high homology, and accordingly a greater prevalence of peptides are shared between those homologous proteins (Figure 2). The average increase in the percent of shared peptide sequences across proteases is 61.8% when comparing Spritz and UniProt database results. The dramatic increase in the percent of shared peptide sequences underscores the importance of identifying protease(s) capable of producing unique peptides for the confident identification of variant-containing proteins, as well as the importance of utilizing proteogenomic databases in general.
Figure 2:
Comparison of the percent of shared peptide sequences for each protease between the Spritz proteogenomic database and the reference UniProt database.
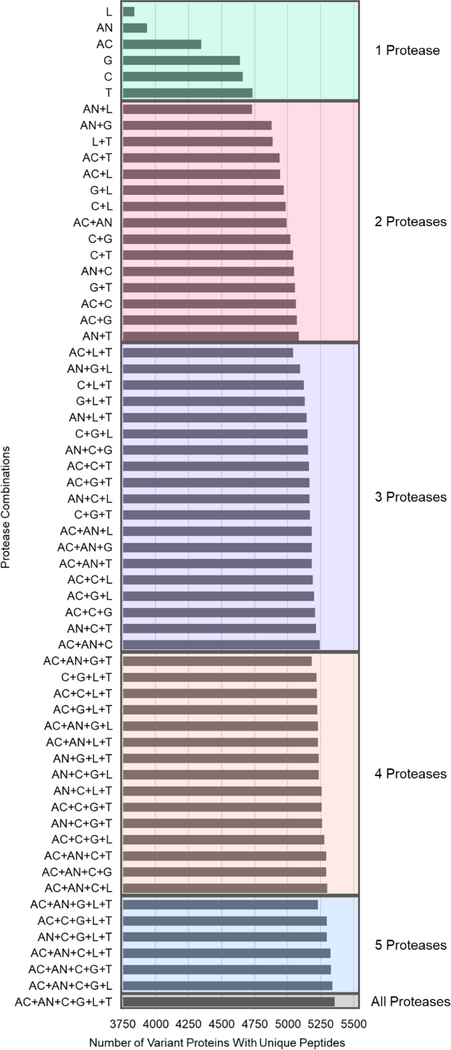
Using the peptide output files from ProteaseGuru, the following information is readily determined for each proteolytic digestion of the Spritz database: a) the number of unique peptides for variant proteins (category 1), b) the number of variant proteins which have unique peptide evidence, and c) the number of variant proteins that can only be confidently identified by theoretical peptides from this digest (see Table 1). Based on these results, it is clear certain proteolytic digests have the capability of producing more variant protein identifications (e.g. Trypsin, Chymotrypsin and Glu-C), and in order to maximize the number of variant proteins identified, a combination of proteases must be used. The maximum number of variant proteins (5355), can only be achieved when all proteolytic digests are performed since there are variant protein identifications unique to each digest. However, it is not always feasible to perform that many parallel digests, and it is prudent to determine, based on the number of digestions to be performed, the combination of proteases that captures the largest population of variant proteins. In Figure 3, the numbers of variant proteins that can be identified via a unique peptide sequence are determined for all individual proteases and all combinations of proteases.
Table 1.
Variant Protein Results
| Protease | Number of Unique Peptides for Variant Proteins (Percent of Total Unique Peptides) | Number of Variant Proteins with Unique Peptides | Number of Variant Proteins with Unique Peptides Exclusive to a Protease |
|---|---|---|---|
| Arg-C | 52453 (9.5%) | 4346 | 46 |
| Asp-N | 39981 (9.9%) | 3934 | 58 |
| Chymotrypsin | 127011 (9.7%) | 4660 | 84 |
| Glu-C | 101760 (10.3%) | 4639 | 38 |
| Lys-C | 45753 (10.0%) | 3840 | 25 |
| Trypsin | 95781 (9.9%) | 4733 | 15 |
Figure 3:
Plot for each protease and combination of proteases showing the number of variant proteins that can be confidently identified by unique peptides. This shows which protease or combination of proteases provides the best coverage of variant proteins within the proteome. (Arg-C: AC, Asp-N: AN, Chym: C, Glu-C: G, Lys-C: L, and Tryp: T)
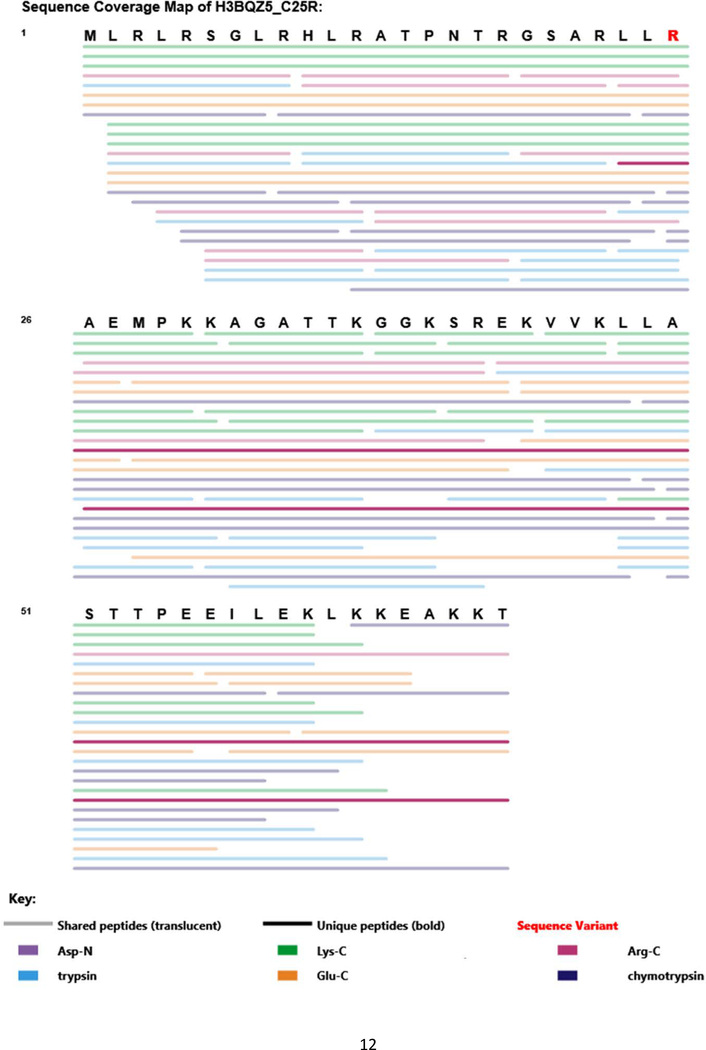
ProteaseGuru also enables the investigation of individual proteins through the generation of protein-specific digestion result summaries and protein sequence coverage maps. Sequence coverage maps enable the visualization of theoretical peptide coverage, for all proteolytic digests, for a given protein, and for its database-annotated PTMs and variants. This feature is valuable for more focused experiments because it allows the user to visualize which protease provides optimal coverage of proteins of interest, and which protease(s) can produce peptides that cross PTMs or variant sites. The sequence coverage map of UniProt protein H3BQZ5, with a single amino acid variant at residue 25 from cysteine to arginine, is shown in Figure 4. This coverage map highlights that only one of the six proteases evaluated, Arg-C, produces theoretical peptide sequences unique to this protein, and only one of those sequences crosses the variant site. This variant-crossing peptide is particularly valuable in that it confirms the presence of the variant.
Figure 4:
Sequence coverage map of variant containing protein (H3BQZ5_C25R) exported from ProteaseGuru. Theoretical peptide sequences are mapped to the protein highlighting its coverage by shared and unique peptides for all proteolytic digests. Unique peptide sequences are bold colored, where shared peptide sequences are translucent. Peptides are ordered by their starting residue. Since peptides with up to two missed cleavages are allowed, multiple peptides from the same protease can overlap but will either start or end at different residues. Multiple amino acid gaps between peptide lines correspond to regions of the proteome that are not covered by any peptide sequence due to the constraints placed on acceptable peptide length, and number of missed cleavages. For peptides that span more than one row, the line extends beyond the margin before wrapping around to the next row down. Peptide sequences unique to this specific variant protein were only obtained in the Arg-C digest, and only a single theoretical unique Arg-C peptide crosses the variant site (the upper of the two bold lines).
Analysis of Skin Microbiome
Metaproteomics encompasses the study of incredibly complex and diverse multi-species proteomes such as those for microbial communities and microbiomes23. ProteaseGuru is able to perform in silico digestions on more than 2 proteomes at once, a functionality absent from existing in silico digestion tools. It is important to note the computational requirements for these analyses scales with the number and size of the proteomes being analyzed. Shown here is the use of ProteaseGuru on 57 protein databases which compose a subset of the human skin microbiome, as described in Methods.
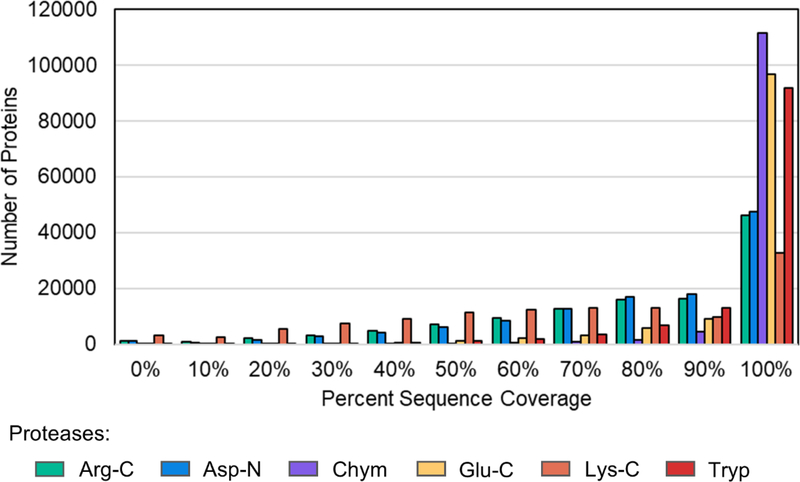
ProteaseGuru generates various histograms within the graphical user interface (GUI) to enable the comparison of proteolytic digests. These histograms and the data tables used to generate the histograms can be exported. Figure 5 shows a “Percent Protein Sequence Coverage” histogram generated by Excel for the microbiome analysis using the exported data table from ProteaseGuru. Often, peptides with fewer than seven amino acids are difficult to confidently identify via mass spectrometry3,7. Therefore, setting a minimum peptide length of seven for in silico digestion enables the generation of theoretical peptides that, based on length, are likely to be identified. Specifying peptide length digestion criteria will result in proteins where there are regions of amino acid sequence without theoretical peptide sequence coverage, approximating a lack in identifiable coverage in actual digestion results. It is desirable to select proteases that provide the greatest proteome coverage overall, and on a protein by protein basis. As may be seen in Figure 5, the ProteaseGuru results show that in silico digestion with Trypsin, Chymotrypsin and Glu-C produce peptide sequences that would provide the most comprehensive coverage of the proteome, whereas Lys-C digestion would provide the least proteome coverage.
Figure 5:
Histogram comparing the distribution of percent protein sequence coverage for the skin microbiome based on the protease used for in silico digestion.
Comparison of ProteaseGuru to existing tools
ProteaseGuru includes numerous features that provide versatility for a wide-range of bottom-up proteomic experiments. A comparison of features between ProteaseGuru and other existing in silico digestion tools is provided in Table 2. iHDPM [24] is a great tool, with many wonderful visualization features, but lacks customizability. iHDPM is limited to analysis of the human proteome, with a predetermined set of proteolytic digests. In contrast, ProteaseGuru allows the user to supply as many of their own protein databases as necessary, providing the user with more control over their analysis. ProteaseGuru is one of two tools that permits the analysis of more than one database at a time, and is the only tool that allows for the analysis of more than two databases. ProteaseGuru also does not limit the user to digestion with the default proteases provided, only two other in silico digestion tools offer that same level of flexibility. ProteaseGuru makes the process of custom protease generation easy by allowing the user to add a custom protease within the GUI- simply requiring a protease name, and cleavage motif. ProteaseGuru is also one of three tools that provides result visualizations. In silico digestion results can be visualized as histograms and in protein sequence coverage maps. Both histograms and sequence coverage maps can be exported for publication. An additional feature unique to ProteaseGuru, is the ability to export the data tables underlying the histogram which facilitates the easy recreation of the plots in the user’s software of choice. ProteaseGuru provides a combination of features and a level of user-friendliness that provides an increased degree of versatility compared to existing in silico digestion tools.
Table 2:
Comparison of in silico Digestion Tool Features
| Tool Name | Digests Whole Proteome | User Supplied Database(s) | Can Digest Multiple Databases | Runs Parallel Protease Digestions | Enables Custom Protease Generation | Determines Uniqueness of Peptides | Provides Data Visualization | Includes PTM Annotations | Cross- Platform Web Interface | Provides Theoretical Peptide Fragmentation Data |
|---|---|---|---|---|---|---|---|---|---|---|
| ProteaseGuru | Yes | Yes | Yes | Yes | Yes | Yes | Yes | Yes | No (C# GUI) | No |
| iHPDM24 | Yes | No | No | Yes | No | Yes | Yes | Yes | Yes | No |
| IPEP25 | No | No | No | Yes | No | No | Yes | No | Yes | No |
| MS-Digest | No | No | No | No | No | No | No | Yes | Yes | Yes |
| pepServe26 | No | No | No | No | No | Yes | No | Yes | Yes | No |
| PeptideCutter27 | No | No | No | No | No | No | No | No | Yes | No |
| PeptideManager10 | Yes | Yes | Yes (max:2) | No | No | Yes | No | Yes | No (C# GUI) | No |
| PeptideMass28 | No | No | No | No | No | No | No | Yes | Yes | No |
| Protein Digest | No | No | No | No | No | No | No | No | Yes | No |
| Proteogest29 | Yes | Yes | No | No | Yes | Yes | No | Yes | No (Perl application) | No |
| Rapid Peptides Generator30 | Yes | Yes | No | Yes | Yes | No | No | No | No (Python tool) | No |
Conclusion:
ProteaseGuru is a software tool designed to aid in the selection of proteases for bottom-up proteomic experiments. The in silico digestion, and subsequent analyses performed within ProteaseGuru provide result files and data visualizations that empower users to make informed choices on which proteases to select for bottom-up proteomic experiments. This eliminates the need for a trial and error approach which is costly with respect to time, samples, and money. ProteaseGuru is the most broadly applicable in silico digestion software to date, enabling its use for proteomics experiments focused on PTM or variant identification, as well as for proteome-wide experiments analyzing sample composed of one or more species. ProteaseGuru not only provides the peptide sequences that result from in silico digestions, but also a wide variety of information about each peptide to enable customized analyses based on the users’ needs such as: peptide’s modification status, length, protein of origin, position within the protein of origin, hydrophobicity, electrophoretic mobility and uniqueness. ProteaseGuru also generates several histograms to aid in the comparison of proteolytic digests, as well as providing the ability to investigate the in silico digestion of specific proteins of interest. ProteaseGuru provides numerous features, along with a user-friendly experience to facilitate experimental planning for a wide-variety of bottom-up proteomic experiments.
Supplementary Material
Supplementary Table S1. List of 57 bacterial, eukaryotic and viral species, and their UniProt access information, that compose the subset of the human skin microbiome analyzed.
Acknowledgements
This work was supported by grant R35GM126914 from the National Institute of General Medical Sciences. R.M.M. was supported by a National Institute of General Medical Sciences training grant to the Chemistry-Biology Interface Training Program T32GM008505.
Footnotes
The authors declare no competing financial interest.
References:
- 1.Zhang Y, et al. , Protein analysis by shotgun/bottom-up proteomics. Chem Rev, 2013. 113(4): p. 2343–94. [DOI] [PMC free article] [PubMed] [Google Scholar]
- 2.Gillet LC, Leitner A, and Aebersold R, Mass Spectrometry Applied to Bottom-Up Proteomics: Entering the High-Throughput Era for Hypothesis Testing. Annu Rev Anal Chem (Palo Alto Calif), 2016. 9(1): p. 449–72. [DOI] [PubMed] [Google Scholar]
- 3.Tsiatsiani L and Heck AJ, Proteomics beyond trypsin. FEBS J, 2015. 282(14): p. 2612–26. [DOI] [PubMed] [Google Scholar]
- 4.Huang Y, et al. , Statistical characterization of the charge state and residue dependence of low-energy CID peptide dissociation patterns. Anal Chem, 2005. 77(18): p. 5800–13. [DOI] [PMC free article] [PubMed] [Google Scholar]
- 5.Giansanti P, et al. , Six alternative proteases for mass spectrometry-based proteomics beyond trypsin. Nat Protoc, 2016. 11(5): p. 993–1006. [DOI] [PubMed] [Google Scholar]
- 6.Miller RM, et al. , Improved Protein Inference from Multiple Protease Bottom-Up Mass Spectrometry Data. J Proteome Res, 2019. 18(9): p. 3429–3438. [DOI] [PMC free article] [PubMed] [Google Scholar]
- 7.Swaney DL, Wenger CD, and Coon JJ, Value of using multiple proteases for large-scale mass spectrometry-based proteomics. J Proteome Res, 2010. 9(3): p. 1323–9. [DOI] [PMC free article] [PubMed] [Google Scholar]
- 8.Guo X, et al. , Confetti: a multiprotease map of the HeLa proteome for comprehensive proteomics. Mol Cell Proteomics, 2014. 13(6): p. 1573–84. [DOI] [PMC free article] [PubMed] [Google Scholar]
- 9.Biringer RG, et al. , Enhanced sequence coverage of proteins in human cerebrospinal fluid using multiple enzymatic digestion and linear ion trap LC-MS/MS. Brief Funct Genomic Proteomic, 2006. 5(2): p. 144–53. [DOI] [PubMed] [Google Scholar]
- 10.Demeure K, et al. , PeptideManager: a peptide selection tool for targeted proteomic studies involving mixed samples from different species. Front Genet, 2014. 5: p. 305. [DOI] [PMC free article] [PubMed] [Google Scholar]
- 11.Saltzman AB, et al. , gpGrouper: A Peptide Grouping Algorithm for Gene-Centric Inference and Quantitation of Bottom-Up Proteomics Data. Mol Cell Proteomics, 2018. 17(11): p. 2270–2283. [DOI] [PMC free article] [PubMed] [Google Scholar]
- 12.Heyer R, et al. , A Robust and Universal Metaproteomics Workflow for Research Studies and Routine Diagnostics Within 24 h Using Phenol Extraction, FASP Digest, and the MetaProteomeAnalyzer. Front Microbiol, 2019. 10: p. 1883. [DOI] [PMC free article] [PubMed] [Google Scholar]
- 13.Krokhin OV, Sequence-specific retention calculator. Algorithm for peptide retention prediction in ion-pair RP-HPLC: application to 300- and 100-A pore size C18 sorbents. Anal Chem, 2006. 78(22): p. 7785–95. [DOI] [PubMed] [Google Scholar]
- 14.Cifuentes A and Poppe H, Simulation and optimization of peptide separation by capillary electrophoresis. J Chromatogr A, 1994. 680(1): p. 321–40. [DOI] [PubMed] [Google Scholar]
- 15.Chen D, et al. , Predicting Electrophoretic Mobility of Proteoforms for Large-Scale Top-Down Proteomics. Anal Chem, 2020. 92(5): p. 3503–3507. [DOI] [PMC free article] [PubMed] [Google Scholar]
- 16.Cesnik AJ, et al. , Spritz: A Proteogenomic Database Engine. J Proteome Res, 2020. [DOI] [PMC free article] [PubMed] [Google Scholar]
- 17.Byrd AL, Belkaid Y, and Segre JA, The human skin microbiome. Nat Rev Microbiol, 2018. 16(3): p. 143–155. [DOI] [PubMed] [Google Scholar]
- 18.Tentler JJ, et al. , Patient-derived tumour xenografts as models for oncology drug development. Nat Rev Clin Oncol, 2012. 9(6): p. 338–50. [DOI] [PMC free article] [PubMed] [Google Scholar]
- 19.Hidalgo M, et al. , Patient-derived xenograft models: an emerging platform for translational cancer research. Cancer Discov, 2014. 4(9): p. 998–1013. [DOI] [PMC free article] [PubMed] [Google Scholar]
- 20.Ntai I, et al. , Integrated Bottom-Up and Top-Down Proteomics of Patient-Derived Breast Tumor Xenografts. Mol Cell Proteomics, 2016. 15(1): p. 45–56. [DOI] [PMC free article] [PubMed] [Google Scholar]
- 21.Bhimani J, Ball K, and Stebbing J, Patient-derived xenograft models-the future of personalised cancer treatment. Br J Cancer, 2020. 122(5): p. 601–602. [DOI] [PMC free article] [PubMed] [Google Scholar]
- 22.Makalowski W, Zhang J, and Boguski MS, Comparative analysis of 1196 orthologous mouse and human full-length mRNA and protein sequences. Genome Res, 1996. 6(9): p. 846–57. [DOI] [PubMed] [Google Scholar]
- 23.Heyer R, et al. , Challenges and perspectives of metaproteomic data analysis. J Biotechnol, 2017. 261: p. 24–36. [DOI] [PubMed] [Google Scholar]
- 24.Choong W, et al. , iHPDM: In Silico Human Proteome Digestion Map with Proteolytic Peptide Analysis and Graphical Visualizations. J. Proteome Res, 2019. 18: p. 4124–4132. [DOI] [PubMed] [Google Scholar]
- 25.Lu D, et al. , IPEP: an in silico tool to examine proteolytic peptides for mass spectrometry. Bioinformatics, 2008. 24(23): p. 2801–2. [DOI] [PubMed] [Google Scholar]
- 26.Alexandridou A, et al. , PepServe: a web server for peptide analysis, clustering and visualization. Nucleic Acids Res, 2011. 39(Web Server issue): p. W381–4. [DOI] [PMC free article] [PubMed] [Google Scholar]
- 27.Wilkins MR, et al. , Protein identification and analysis tools in the ExPASy server. Methods Mol Biol, 1999. 112: p. 531–52. [DOI] [PubMed] [Google Scholar]
- 28.Wilkins MR, et al. , Detailed peptide characterization using PEPTIDEMASS--a World-Wide-Web-accessible tool. Electrophoresis, 1997. 18(3–4): p. 403–8. [DOI] [PubMed] [Google Scholar]
- 29.Cagney G, et al. , In silico proteome analysis to facilitate proteomics experiments using mass spectrometry. Proteome Sci, 2003. 1(1): p. 5. [DOI] [PMC free article] [PubMed] [Google Scholar]
- 30.Maillet N, Rapid Peptides Generator: fast and efficient in silico protein digestion. NAR Genomics and Bioinformatics, 2020. 2. [DOI] [PMC free article] [PubMed] [Google Scholar]
Associated Data
This section collects any data citations, data availability statements, or supplementary materials included in this article.
Supplementary Materials
Supplementary Table S1. List of 57 bacterial, eukaryotic and viral species, and their UniProt access information, that compose the subset of the human skin microbiome analyzed.


