

Abstract
Stargardt disease (STGD1) is an autosomal recessive retinal dystrophy, characterised by bilateral progressive central vision loss and subretinal deposition of lipofuscin‐like substances. Recent advances in molecular diagnosis and therapeutic options are complemented by the increasing recognition of new multimodal imaging biomarkers that may predict genotype and disease progression. Unique non‐invasive imaging features of STDG1 are useful for gene variant interpretation and may even provide insight into the underlying molecular pathophysiology. In addition, pathognomonic imaging features of STGD1 have been used to train neural networks to improve time efficiency in lesion segmentation and disease progression measurements. This review will discuss the role of key imaging modalities, correlate imaging signs across varied STGD1 presentations and illustrate the use of multimodal imaging as an outcome measure in determining the efficacy of emerging STGD1 specific therapies.
Keywords: fundus autofluorescence, inherited retinal diseases, ocular coherence tomography, retina, retinal dystrophy
1. INTRODUCTION
Stargardt disease (STGD1, OMIM #248200), caused by biallelic mutations in the ATP‐binding cassette transporter subfamily A4 (ABCA4) gene,1 is one of the most common genetic inherited retinal diseases (IRDs)2 accounting for 12% of IRD‐related blindness.3 Initially described as a juvenile macular dystrophy,4 the spectrum of ABCA4‐associated retinopathy has been expanded to include childhood‐onset cone‐rod dystrophy,5 rapidly progressive pan‐retinal chorioretinal atrophy6 and the late‐onset pattern dystrophy‐like disease with foveal sparing macular atrophy.7, 8 With the emergence of ABCA4‐specific molecular and genetic therapies, it is essential that the clinical diagnosis of STGD1 is made promptly through the appropriate use of multimodal imaging to guide timely and accurate genetic analysis, allowing for the early enrolment of these patients into clinical trials of novel therapies.9
A quarter of childhood‐onset STGD1 do not have any retinal lesions at presentation.10 Without multimodal imaging, these children can be easily misdiagnosed as functional visual loss, amblyopia and other forms of IRDs given pattern electroretinography (ERG) may be normal and full‐field ERG may show electronegative waveform in the early stages.11, 12 The lack of signs on fundoscopy may lead to unnecessary neuroimaging, lumbar punctures and even psychiatric evaluation and years of inappropriate occlusion therapy.13 Similarly, without multimodal imaging late‐onset STGD1 can often be misdiagnosed as age‐related macular degeneration (AMD) due to the similar appearance of flecks and drusen on fundus examination, and the similar sight‐threatening complications of geographic atrophy and subretinal neovascular membranes.8, 14 Multimodal imaging is therefore essential in the management of both children and adults with STGD1. Furthermore, unique imaging signs in STGD1 may predict mutation severity15 and specific ABCA4 variants.16, 17, 18, 19, 20 In this era of personalised gene‐based therapy, multimodal imaging can enhance our ability to precisely measure the natural disease progression and impact novel therapies that arrest the disease progression.
Here, we review the specific multimodal imaging features of STGD1 and correlate imaging signs across a broad spectrum of disease presentations. Furthermore, we discuss the use of multimodal imaging as an outcome measure in determining the efficacy of emerging ABCA4‐specific therapies.
2. MULTIMODAL IMAGING TECHNIQUES
The typical fundus features of STGD1 are not always visible on clinical fundus examination at the initial presentation.10 Multimodal imaging is essential for detecting (a) subtle outer retinal layer changes before the appearance of a beaten bronze macula and (b) lipofuscin accumulation in the retinal pigment epithelium (RPE) prior to the formation of subretinal flecks. Detection of pre‐clinical lesion is particularly important in screening younger asymptomatic siblings of a child with established STGD1. It is also essential to perform multimodal imaging in both parents to identify asymptomatic late‐onset STGD1 masquerading as AMD or a pattern dystrophy with pseudodominant inheritance.21, 22 There have been important recent advances in the use of ocular coherence tomography (OCT) for viewing the layers of the retina and choroid and their respective vasculatures, and the use of confocal scanning laser ophthalmoscopy for mapping fundus autofluorescence (FAF), incorporating an internal reference for quantifying autofluorescence intensity or an ellipsoid mirror for an ultra‐widefield (UWF) imaging.
2.1. Ocular coherence tomography
OCT is an imaging technique that is capable of capturing structural alterations by providing in vivo quasi‐histological sections of the retina and choroid. Choroidal imaging with spectral domain OCT (SD‐OCT) has gained popularity since the introduction of the enhanced depth imaging technique whereby the zero‐phase delay line is positioned at the choroidal side of the image frame, inverting the image.23 Choroidal structure and visibility of the sclerochoroidal junction was further enhanced with the use of a swept source OCT device.24, 25 Phase‐based26, 27 and amplitude‐based28, 29 approaches have been described for extracting flow signals from serial OCT scans to re‐create a retinal or choroidal vascular map known as OCT angiography (OCTA).30 Both structural and angiographic OCT modalities have been used extensively to investigate STGD1.
2.1.1. Outer retinal changes
Previous studies using time31 and spectral‐domain32 OCT devices confirmed the subretinal and intraretinal placement of STGD1 flecks which were classified into type 1 (group A, B and C) or type 2 (group D) lesions respectively (Figure 1). Atypical drusen‐like lesions (group E) have also been noted. Despite the lack of longitudinal data and histopathological correlation, a multimodal imaging study33 suggested these flecks originated from degenerated photoreceptor inner and outer segments leading to hyper‐reflective debris on the apical surface of the RPE that gradually disrupts the interdigitation and ellipsoid zones as it reaches the external limiting membrane (ELM) causing thinning of the adjacent outer nuclear layer (ONL). The importance of multimodal imaging in the recognition of STGD1 is further supported by SD‐OCT studies which revealed subtle outer retinal layer changes that were not visible on fundoscopy.34, 35 These include occult macular dystrophy‐like features evolving into a foveal cavitation defect due to an optical gap in the subfoveal outer segment layer34, 35 and thickening of the ELM36, 37 which can be observed in pre‐symptomatic individuals (Figure 1). These OCT signs may occur in the absence of any RPE changes on clinical examination.
FIGURE 1.

Serial ocular coherence tomography (OCT) of the same region showed evolution of subretinal flecks with focal thickening of the retinal pigment epithelium (A), the flecks subsequently pushed through the ellipsoid zone (B) and then migrated into the outer retinal layers (C). This led to the formation of outer retinal atrophy (D) and further migration of the flecks into the retinal tissue (E). Unique OCT features in Stargardt disease include an optically empty gap in the fovea in those presenting with a bull's eye maculopathy (F), hyperreflective external limiting membrane (G), herniation of retinal tissue through breaks in Bruch's membrane (H) and choroidal caverns (I)
2.1.2. Choroidal features
In an early choroidal OCT imaging study, we described focal choroidal thinning in 3–6 patients with STGD1.38 This reduction in total choroidal thickness was found to be associated with preferential attenuation of the large choroidal vessels. However, with the use of a swept source OCT device, Ratra et al.39 showed no difference in choroidal thickness between healthy controls and STGD1 whereby those with STGD1 had a reduced proportion of the choroidal cross‐sectional area occupied by a vascular lumen (choroidal vascular index) in a single horizontal OCT scan. More recently, Arrigo et al.40 demonstrated reduced choroidal thickness in 100 eyes of 50 STGD1 patients as compared to controls. They proposed four patterns of altered choroidal structure namely, normal choroid (pattern 1, 15%), reduced Sattler or Haller layers (pattern 2, 29%), reduced Sattler and Haller layers (pattern 3, 26%) and reduced Sattler and Haller layers with choroidal caverns (pattern 4, 30%).40 In addition to altered vascular structures, hyperreflective foci within the choroidal stroma have also been described.41 These lesions have been associated with more severe choroidal vascular remodelling, retinal atrophy, visual loss and longer disease duration.40, 41, 42 Herniation of atrophic retinal tissue into the choroid through a focal defect in the Bruch's membrane has also been described as focal choroidal excavation (Figure 1).43 However, it is worth noting that the configuration of excavation in STGD1 differs markedly from the original description of the focal choroidal excavation, in which the RPE and photoreceptors were intact in the setting of an otherwise normal eye.44 These unique features of ABCA4‐associated choroidopathy warrant further investigation.
2.1.3. Ocular coherence tomography angiography
In contrast to AMD, previous indocyanine green angiography studies in STGD1 subjects have demonstrated a complete loss of the choriocapillaris, known as dark atrophy, in areas where RPE was absent.45, 46 OCTA studies47, 48 have now confirmed these angiographic findings and shown that this region of choriocapillaris loss was confined to within the boundary of the RPE atrophy suggesting the latter was the primary event (Figure 2).45, 46, 49 However, a comparative study between AMD and STGD1 on the flow signal texture in the choriocapillaris showed a reduced flow signal beyond the area of RPE atrophy suggesting an inner choroidal vascular pathology may precede the RPE loss in AMD (Figure 2).50 One study51 reported attenuation of the choriocapillaris vessel density beyond the region of RPE atrophy, but this may be attributed to shadowing generated by fleck lesions.50 It remains to be determined whether the altered choriocapillaris flow signals outside the region of RPE atrophy are solely due to choroidal OCTA image artefact we described previously.52 OCTA studies of the retinal circulation have also demonstrated reduced superficial and deep vessel densities,53 vessel tortuosity,40 vessel surface area and vessel volume.54 Correlation of more extensive retinal vessel losses in the presence of RPE atrophy suggests the neurosensory retinal tissue loss leads to secondary capillary loss.54 OCTA may be useful for the detection of abnormal flow signal within a macular choroidal neovascular membrane complicating late‐onset STGD1 (Figure 2) or within a peripheral retinal pigmented lesion or hypolipofuscinosis with subretinal fibrosis.55
FIGURE 2.

Fundus autofluorescence (FAF) imaging of a 34 year old female (c.[3322C>T];[2588G>C;5603A>T]) showing macular flecks (A) with a central area of questionable decreased autofluorescence (QDAF) on short‐wavelength AF (B) and more extensive hypoAF and ‘dark flecks’ on near‐infrared (IR) AF (C). The superficial retinal capillary map (D) was within normal limits. The choriocapillaris map showed focal regions of flow void which corresponded to flecks and areas of QDAF (E). FAF imaging of an 82‐year‐old male (c.[4577C>T];[5603A>T]) showing peripapillary flecks and central geographic atrophy (F). These regions of definite DAF had well defined borders on SWAF (G). IRAF showed preservation of a foveal island not seen with SWAF (H). The superficial capillary map (I) was within normal limits. The choriocapillaris map showed loss of capillaries in the region of DAF and increased visibility of choroidal vessel flow signals (J). A 91‐year‐old male (c.[2549A>G;4667+5G>T;4882G>A];[5603A>T]) with central macular atrophy as shown by the well‐defined defect in choriocapillaris on ocular coherence tomography angiography (OCTA) (K). Adjacent OCTA scans showed flow signals (red markings) within the pigmented epithelial detachment temporal to the fovea and nasal intraretinal fluid indicating an active choroidal neovascular membrane (L, M)
2.2. Fundus autofluorescence
FAF is a non‐invasive technique for mapping the distribution of RPE fluorophores.56 In STGD1, impaired ABCA4 flippase function within the photoreceptors and RPE leads to cellular dysfunction, formation of subretinal clumps of lipofuscin‐rich degenerate outer segments (flecks) and subsequent RPE and photoreceptor cell death.33, 57 Upon exposure to blue light (λ = 488 nm), lipofuscin fluorophores within the RPE and flecks are visualised through a barrier filter that eliminates reflected light by blocking λ < 500 nm.58 Therefore, increased lipofuscin within the RPE and focal subretinal accumulation of lipofuscin‐rich debris results in generalised and focal hyperautofluorescence, respectively, on blue AF (BAF) imaging.59 Subsequent RPE cell death59 or masking by RPE hyperplasia60 and hyperlipofuscinosis with subretinal fibrosis61 results in areas of hypoautofluorescence. Near‐infrared light (λ = 787 nm) has also been used to elicit a FAF signal from melanin‐associated fluorophores.62 Since the description of a uniquely altered IRAF pattern by Cideciyan et al.,63 BAF and IRAF have both been incorporated into multimodal imaging protocols for STGD1.64, 65, 66, 67 FAF imaging using a green excitation light (λ = 518 nm, GAF) has also been used for the visualisation of small, central lesions as this light is not absorbed by macular pigment (meso‐zeaxanthin, zeaxanthin and lutein) in contrast to BAF.68 Given the elevated background BAF signal in STGD1 a method for its quantification, developed by Delori et al.,69 has enabled inter‐individual comparison of BAF to facilitate genotype–phenotype correlations.70, 71, 72 The extent of peripheral retinal involvement in STGD1 has been difficult to visualise and document without the use of wide field FAF. The incorporation of an ellipsoid mirror into a scanning laser ophthalmoscope (Optos PLC, Dunfermline, UK) has enabled the capture of pre‐equatorial GAF (λ = 532 nm) alterations.73 This device allows the coverage of 892 mm2 of retinal area (82% of total retinal surface) with a 135° field angle.74, 75
2.2.1. Hyperautofluorescent and hypoautofluorescent lesions
Hyperautofluorescent lesions are one of the earliest FAF features, often seen before they are visible as flecks on clinical examination or colour photography. These lesions have varied shapes and sizes, and their natural life cycle tends to progress to discrete areas of RPE atrophy (Figure 3).76 Regions affected by flecks have reduced function77 but this imaging feature alone was not predictive of future sensitivity loss.78 Nevertheless, changes in hyperautofluorescent lesion area have been proposed as a potential clinical trial endpoint using an automated segmentation algorithm to delineate the lesion boundaries.79, 80 Another key FAF feature is the mapping of regions with decreased autofluorescence (DAF). Varied levels of darkness, as compared to the absent FAF signal at blood vessels and the optic nerve head, have been used to classify these lesions into definitely and questionably DAF (DDAF, QDAF respectively).81 The evolution of QDAF into DDAF may represent the clearance of residual subretinal acellular lipofuscin material. The area of DDAF has been used as an endpoint in natural history studies to examine predictors of atrophy expansion rate (ER).15, 82, 83 Furthermore, DDAF area has been proposed as a trial endpoint in emerging treatments for STGD1. However, several publications have alluded to the difficulty in distinguishing the boundaries between QDAF and DDAF, and inter‐observer reliability was poor for the segmentation of DAF areas with poorly defined boundaries.67, 81, 84
FIGURE 3.

Short‐wavelength (A) and near‐infrared (IR) (B) fundus autofluorescence (AF) of a 60‐year‐old male with late‐onset disease. Magnified images of SWAF (C) and IRAF (D) showed progression of the flecks to large areas of atrophy sparing the fovea (*). Ultra‐widefield (UWF) image of a 20‐year‐old showing peripheral pigmented lesions (E) within the demarcation line between the speckled hyperAF zone and the uniform peripheral region (F). ocular coherence tomography (OCT) through the peripheral region (G) (red line) showed a preserved ellipsoid zone. OCT through the speckled hyperAF region (H) (green line) showed loss of the ellipsoid zone and focal pigment epithelial detachments corresponding to the pigmented lesions. UWF image of a 26‐year‐old showing a large pigmented peripheral retinal lesion typically seen in childhood‐onset diseases (I). The pigmented lesion is hypoAF (J). OCT through the superior (red line) (K) and temporal (green line) (L) portions showed diffuse hyperreflective subretinal and subretinal pigment epithelium deposits
In contrast to BAF, IRAF imaging tends to show more widespread hypoautofluorescent lesions (Figure 3).65 Hyperautofluorescent flecks as seen on BAF are generally hypoautofluorescent on IRAF.33 In STGD1 the area of DAF on IRAF has been shown to be greater indicating earlier loss of melanin‐associated fluorophores in the RPE.65, 85, 86 Lois et al.59 reported an absence of flecks or RPE atrophy in the peripapillary region as a unique feature of STGD1. Using IRAF, Nassisi et al.87 assessed the integrity of the peripapillary RPE and correlated the area spared with the degree of photoreceptor impairment on ERG assessment. Although both peripapillary and foveal sparing have been reported as unique FAF features of STGD1,14, 88 there is not an absolute association.71, 89
2.2.2. Utility of UWF‐FAF
The role of UWF retinal imaging, in both colour and AF modes, has gained increasing awareness in STGD1.90 UWF imaging should be incorporated into a standard STGD1 phenotyping protocol as it enables visualization of the centrifugal spread of hyperautofluorescent and hypoautofluorescent flecks15 and unique peripheral retinal pigmented lesions (Figure 3).55, 60, 61, 91 Fernanda Ablem et al.92 showed peripheral changes detected by UWF‐FAF imaging in STGD1 were correlated with ERG and kinetic perimetry, thus supporting the use of this more accessible and objective tool for evaluating peripheral retinal involvement. In addition, UWF‐FAF utilises a green wavelength (λ = 532 nm) which is not absorbed by macular xanthophyll pigment. Depending on the extent of peripheral retinal involvement and atrophy UWF‐FAF has been classified by Klufas et al.93 into three groups. Arrigo et al.40 reported that each of these three groups was associated with increasing severity of OCT abnormalities. More recently, Chen et al.94 used UWF imaging to examine lesion extent in STGD1. They found only 26% of patients with STGD1 had lesions confined to the central 30° × 30° field. Similarly, Klufas et al.93 found the majority of 29 STGD1 patients (76% of eyes) had peripheral UWF‐FAF‐detected lesions.
2.2.3. The emerging role of quantitative autofluorescence
Quantitative AF (qAF) has been used as a surrogate marker for lipofuscin accumulation within the retina. Although lipofuscin within the RPE accumulates with age in healthy eyes,69 Burke et al.95 found STGD1 eyes had high qAF levels even in regions of the retina that did not have hyperautofluorescence fleck lesions to confound background qAF measurements (Figure 4). They reported a repeatability of ±10% in the mean qAF which was similar to healthy subjects.90 The proportion of STGD1 patients with qAF values greater than the 95% confidence interval of an age‐matched control group varied from 84% to 86%.71, 95 More recently, Muller et al.72 found a lower proportion of STGD1 patients (77%) had qAF levels greater than the 95% prediction interval of an age‐matched control group.72 In addition, nullizygous patients with biallelic truncating or nonsense mutations presented with extremely high qAF levels earlier in life (Figure 4), which rapidly declined to low normal levels as foveal atrophy and hypoautofluorescent ‘flecks’ encompassed the mid ring zone used for calculation.72 In contrast, those with one mild variant in combination with a severe variant or bull's eye maculopathy phenotype had a less extreme elevation of qAF (Figure 4).70, 72 Further studies have found ABCA4 mutation carriers do not have an elevated qAF, while 50% of those with a PRPH2‐associated pattern dystrophy manifesting flecks have qAF above the 95% confidence interval for healthy eyes. Thus, the accumulation of lipofuscin within the RPE beyond the level expected from aging, as determined by qAF, is dependent upon the combined severity of biallelic ABCA4 variants and this accumulation precedes functional changes.72
FIGURE 4.

Fundus autofluorescence (AF) images (A–G) and quantitative AF (qAF) mapping (H–N) in a 21‐year‐old healthy patient (A, H), a 15‐year‐old girl (c.[2905G>A];[1922G>C]) with symptoms from the age of 9 (B, I), a 34‐year‐old female (c.[3322C>T];[2588G>C;5603A>T]) with symptoms from the age of 32 (C, J), a 36‐year‐old female (c.[3323G>T];[5882G>A]) with symptoms from the age of 25 (D, K), a 59‐year‐old female (c.[5603A>T];[4670A>G;6148G>C]) with symptoms from the age of 48 (E, L), a 78‐year‐old female (c.[5603A>T[;[2894A>G]) with symptoms from the age of 76 (F, M), and a 70‐year‐old healthy patient (G, N). Healthy subjects have qAF values increasing from 200 to 400 units between 20 and 70 years of age. Patients with Stargardt disease typically have qAF values ranging from 400 to 800 units
3. MULTIMODAL IMAGING CHARACTERISTICS AND GENOTYPE–PHENOTYPE CORRELATIONS
Large case series of patients with genetically confirmed STGD1 reported a wide spectrum in the age of symptom onset and clinical manifestations.76, 84, 96, 97, 98 The age of presentation can be divided into childhood‐onset, early adult‐onset and late adult‐onset. However, the boundaries for these age brackets varied significantly across publications. Therefore, it may be more useful to consider multimodal imaging signs for specific ABCA4 variants in light of the significant genetic variability and correlation between clinical phenotype and residual ABCA4 protein function. Cremers et al.76 proposed that specific mild, intermediate and severe or null ABCA4 variants were associated with distinct clinical phenotypes. The multimodal imaging findings of specific genotype–phenotype groups are summarised below.
3.1. Cone‐rod dystrophy: childhood and adolescent onset
Biallelic deleterious ABCA4 variants result in a childhood‐onset cone‐rod dystrophy (CORD3, OMIM 604116) or early‐onset severe retinal dystrophy (OMIM 248200) with central vision loss developing from the age of 5 to 11 years.6, 10, 13, 99 Although there may be no initial fundus abnormalities these early onset cases rapidly progress to advanced pan‐retinal disease resulting in extensive retinal degeneration and often pigment migration, causing confusion with retinitis pigmentosa (Figure 5).100 In children with no abnormalities on clinical examination, FAF has demonstrated discrete hyperautofluorescent dots confined to the foveola and even mild hyperautofluorescent in the perifoveal region (Figure 5).11 One key imaging feature of the rapid‐onset chorioretinopathy phenotype includes the short interval of markedly increasing AF signal in the macular region early in the disease process.6 Over time RPE atrophy rapidly progresses throughout the fundus in a multifocal pattern within the third decade of life (Figure 5).101 Khan et al.11 described an increased reflectivity of the outer retinal band, thought to represent the ELM and ONL, as a highly reproducible finding that was present in all subjects in their cohort. A thickened ELM as seen on SD‐OCT may provide an early marker for childhood‐onset disease (Figure 5).11 Lee et al.37 also described a thickened ELM in all of their 26 cases. This thickening demonstrated a maximal prominence at the foveola that decreased symmetrically with increasing eccentricity. These changes may represent disruption of the ONL within the cones and this is consistent with cone photoreceptor nuclei residing close to the ELM in the perifoveal region.37 Conversely, Bax et al.13 only reported a thickened ELM in two patients with normal fundi at 6 and 12 months after disease onset where all children showed disorganisation and loss of the RPE on OCT scans. Sequential OCT images have illustrated focal collapse of the inner retinal layers, secondary to loss of the outer retinal structures.13 These changes appear to preferentially affect perifoveal areas. As the retinal degeneration expands beyond the equator, peripheral pigmented retinal lesions may develop in some patients. These lesions were initially thought to resemble congenital hypertrophy of the RPE however irregular elevations of the RPE are not consistent with the known OCT features of congenital hypertrophy of the RPE (Figure 3).102 Some have proposed massive release of toxic bisretinoid from the RPE as the cause of RPE hyperplasia and subretinal fibrosis.55, 61 Patients with an intermediate ABCA4 variant in trans with a null‐like allele tend to have a symptom onset in their second decade. Although they may have a slower progression of the lesion centrifugally, the extent of retinal involvement may be similar to those with two null‐like or severe alleles albeit delayed by one decade (Figure 3).101
FIGURE 5.

Fundus autoflluorescence (AF) of an 11‐year‐old boy (A) showing foveal hyperAF dots (insert) and perifoveal hyperaAF flecks. These flecks later evolved into hypoAF patches (B). Optical coherence tomography at age 11 (C) and 14 (D) showed increased reflectivity of the external limiting membrane and development of microcystoid changes in the inner nuclear layer and thinning of the outer nuclear layers. Widefield AF of the same patient at age 7 (E) with no flecks. Flecks were then visible even beyond the vascular arcade at age 11 (F). A 35‐year‐old male with biallelic severe variants showing prominent bone spicules (G) and masking of the equatorial AF signal and obscuration of the boundary of macular atrophy (H). A 51‐year‐old female with biallelic severe variants with extensive atrophy (I) and loss of fundus AF (J). A 58‐year‐old male carrying c.[2588G>C;5603A>T] showing widespread flecks with atrophy limited to the posterior pole (K). A 50‐year‐old male with the intermediate severity allele c.6079C>T showing widespread flecks with posterior pole atrophy (L)
3.2. Bull's eye and foveal disease: c.5882G>A, p.(Gly1961Glu) variant
Patients harbouring the c.5882G>A, p.(Gly1961Glu) allele have a markedly different clinical phenotype to those described above, characterised by a bull's‐eye maculopathy19 or localised foveal atrophy surrounded by parafoveal flecks (Figure 6).103 These patients present with mild central vision loss typically in their second or third decade of life.103 In early disease stages, the localised ellipsoid zone loss, resulting in an ‘optical gap’ or ‘foveal cavitation’ on OCT, may cause confusion with a cone dysfunction syndrome (Figure 6).16, 34 A typical early FAF feature is a diamond shaped region of decreased AF without surrounding hyperautofluorescent or the type B bull's‐eye lesion.16, 104 With age, the optical gap on OCT is replaced by build‐up of subretinal debris followed by the complete loss of foveal tissue.16, 105 FAF shows the development of a hyperautofluorescent ring around a large oval region of foveal hypoautofluorescent (type A bull's‐eye lesion).16, 70, 105 Some patients may have a speckled appearance (type C bull's‐eye lesion) evolving into a central hypoautofluorescent region surrounded by hyperautofluorescent flecks. There is significant intra‐familial variation even in the OCT and FAF phenotype.16 On UWF‐FAF imaging, there is no abnormal AF signal beyond the affected fovea.15, 101 The mean ± standard deviation (range) qAF measurements in the 7°–9° zone were 366 ± 72 (251–513) units in those younger than 30 years of age.70 While patients under 30 years have qAF values consistently above the 95% confidence interval for healthy eyes,70 those over 30 years may have qAF values above68 or within105 the 95% confidence interval.
FIGURE 6.

Fundus autofluorescence (AF) and ocular coherence tomography (OCT) of patients carrying the c.5882G>A variant. An 18‐year‐old male (A) followed for 9 years (B) showing conversion of a central area of questionable to definite decreased AF surrounded by flecks. OCT showed an optically empty gap at the fovea (C). A 27‐year‐old female (D) with foveal atrophy which enlarged over a 6‐year period (E). OCT showed loss of outer retinal layers and an absence of foveal tissue (F). A 33‐year‐old male with a ring of hyperAF (G) progressing to perifoveal flecks and enlarging atrophy 7 years later (H). OCT showed severe outer retinal layer loss. A 44‐year‐old female with perifoveal flecks and localised atrophy (J) progressing over 10 years (K). OCT showed large choroidal caverns (L)
3.3. Foveal sparing: late‐onset and asymptomatic disease
Large case series have reported a distinct foveal‐sparing phenotype defined by an age of symptom onset ranging from ≥35 to ≥45 years.7, 8, 14, 106 As half of these patients had only one ABCA4 variant identified,8, 14 some had erroneously been labelled as AMD. The concept of a unique late‐onset STGD1 phenotype was founded by the discovery of the c.5603A>T (p.Asn1868Ile) variant, previously considered benign, accounting for 80% of these single ABCA4 mutation cases.107 Since 2017, this hypomorphic variant has been recognised as pathogenic in trans with a deleterious ABCA4 mutation and its non‐penetrance is enhanced by male gender.108 Similarly to the c.5882G>A variant, patients with c.5603A>T manifest a distinct clinical phenotype. In a case series of 27 patients with c.5603A>T in trans with a deleterious variant, 3 were asymptomatic and the remaining cohort had a median and mean (range) age of symptom onset of 41.5 and 39.7 (17–71) years, respectively. Initially flecks and atrophy are absent, and OCT and FAF may be normal. The earliest abnormality seen on OCT is enhancement of the parafoveal ELM with hyperreflective ONL foci.17 Localised hyperautofluorescent subretinal flecks may be seen in the macula with foveal sparing, nasal peripapillary region (without peripapillary sparing) or extend anteriorly beyond the equator.101 The subretinal flecks tend to be larger and polymorphic.76 FAF imaging shows enlarging hyperautofluorescent flecks evolving into regions of paracentral RPE atrophy (Figure 7). As the disease progresses, these paracentral patches of RPE atrophy coalesce circumferentially leaving a peninsula of RPE which is eventually pinched off leaving a small central island of RPE.14, 106 Many of the asymptomatic late‐onset cases are identified during retinal screening for AMD or as part of familial workup in parents of children presenting with childhood STGD1. Symptomatic late‐onset cases may present with secondary choroidal neovascularisation109, 110 or encroachment of RPE atrophy into the fovea. Consequently, patients may be misdiagnosed with neovascular AMD if the unique OCT and FAF imaging features of subretinal flecks and foveal sparing are not recognised. Increased qAF values may also be used to differentiate atrophy from late‐onset STGD1 from AMD which has a reduced qAF measurement.72, 111 Other mild ABCA4 mutations such as c.587C>T (p.Pro196Leu), c.3113C>T (p.Ala1038Val), c.5537T>C (p.Ile1846Asn), c.5761G>A (p.Val1921Met) may share similar multimodal imaging features with the c.5603A>T variant when found in trans with a deleterious variant (Figure 7).14, 101
FIGURE 7.
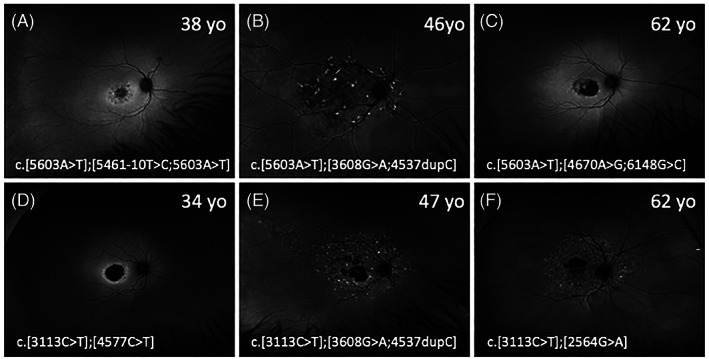
Widefield fundus autofluorescence (FAF) images from patients with the c.5603A>T variant, in trans with a severe variant (A–C) and patients with the c.3113C>T variant, in trans with a severe variant (D–F). Most patients had lesions confined to within the vascular arcades except for patients B, E and F. Patients B and E were brothers. Their mother with the c.[5603A>T];[3113C>T] variant had normal FAF imaging at age 67
4. IMAGING ENDPOINTS FOR STGD1 THERAPY TRIALS
Reliable imaging endpoints for determining STGD1 progression are vital given the variable disease course and the large number of potential treatments being developed in clinical trials.76 Multimodal imaging using FAF and SD‐OCT is superior to conventional colour fundus photography or clinical examination in detecting disease onset and progression.112
4.1. Metabolic consequences of an impaired visual cycle
ABCA4 flippase dysfunction accounts for the generalised and focal lipofuscin deposition within the RPE and outer segments of the photoreceptors, respectively. Prior to clinically visible flecks or atrophic lesions, qAF values are increased70 with thickening of the ELM in both childhood36, 37 and late‐onset17 STGD1. Muller et al.72 proposed the use of qAF as an outcome measure but noted several drawbacks including the slow annual increase (20–50 units/year), discomfort, theoretical phototoxicity and the large test–retest variability of ±9% even in healthy eyes.90 However, qAF monitoring may be particularly beneficial for lipofuscin‐targeted therapies. Degenerate photoreceptor remnants in the subretinal space may also be tracked given the dynamic temporal and spatial characteristics of these lipofuscin‐rich flecks.76 To date, time and ambiguity of manual boundary segmentation have impeded the widespread adoption of this technique in clinical trials. The development of a deep learning‐based segmentation algorithm by Charng et al.80 may improve the accuracy and efficiency of measuring hyperautofluorescent fleck area.
4.2. Quantifying the extent and progression of cell death
The excessive build‐up of all‐trans retinal from ABCA4 impairment leads to activation of an apoptosis pathway and subsequent RPE and photoreceptor cell death.60 The ideal method to quantify and monitor retinal cell death in STGD1 would be to visualise dying cells in real‐time in vivo with the use of a fluorescent biomarker.113 This technique, called detection of apoptosing retinal cells, is yet to be validated for the imaging of photoreceptor or RPE cells.114 Currently, the extent of RPE loss is monitored by measuring the growth of hypoautofluorescence areas whilst the collective loss of photoreceptors and RPE is indirectly measured by monitoring the residual retinal volume or mean thickness with SD‐OCT. Both techniques are being explored as key structural endpoints in the Progression of Atrophy Secondary to Stargardt Disease (ProgStar) studies (NCT019778465).115 It is worth noting that over 50% of patients with STGD1 may not have any areas of DDAF, while the median time to develop DDAF lesions was 4.9 years.82
4.2.1. Monitoring of definitely DAF
ER of DDAF area has been used as the primary outcome measure in most STGD1 clinical trials and natural history studies. The ER reflects directly the extent of RPE damage.116 However, similar to geographic atrophy in AMD,117 the area growth rate in STGD1 is dependent on baseline lesion size. Therefore (1) a logarithmic transformed growth rate (percentage DDAF area increase)79, 118, 119 and (2) a square‐root transformed DDAF15, 117, 120, 121 area (SRA) or effective radius () growth rate (ERGR),85, 122 linearises the relationship between lesion size and time, enabling the use of linear mixed modelling.123 The growth rate of DDAF area has been reported to range from 0.39 to 2.45 mm2 per year and this is highly dependent on the initial lesion size (Figure 8).15, 79, 82, 83, 84, 85, 106, 124, 125, 126 Subgroup analysis has shown significant variability in growth rate related to electrophysiology grouping,84, 121, 125, 127 FAF pattern grading85 and baseline lesion size.82, 83, 126 More recently, Georgiou et al.84 also reported a mean ER of 0.69, 0.78 and 0.40 mm2/year for children, adults with childhood‐onset and adults with late‐onset STGD1 suggesting the importance of genotype in determining ER. Fujinami et al.3 also assessed the effect of specific genotypes on DDAF progression and found an atrophy ER of 0.45 and 0.39 mm2/year in patients harbouring c.5461‐10T>C and c.6079C>T variants, respectively.127 In contrast, those with c.5882G>A showed an ER of only 0.20 mm2/year. However, these studies did not take into consideration the effect of baseline lesion size by square‐root transformation of the DDAF area,122 and they were unable to examine larger lesions as they only used the 30° × 30° and 55° × 55° lenses on the Heidelberg system. Shen et al. showed the overall ERGR was 0.104 mm/year across studies but also noted a bimodal distribution in the individual ERGR suggesting genotype effect.122 By using UWF‐FAF imaging and controlling for baseline lesion size (SRA ER) we showed those with biallelic severe/null alleles had significantly higher SRA ER compared to those patients with at least one mild or intermediate mutations in trans with a severe/null variant (Figure 9).101 ER based on IRAF imaging has been shown to be slightly greater than ER based on SWAF.85 Conversely, ERGF derived from en face OCT was 5.5 times lower than ERGF derived from FAF.118, 122, 128
FIGURE 8.

A scatter plot showing the relationship between baseline area of definite decreased autofluorescence (DDAF) and total area growth rate (A). Effective radius growth rates averaged around 0.1 mm/year (0.05–0.15 mm/year) and were not dependent on the baseline DDAF total area (B). The square denotes the ProgStar study reports. Triangle denotes recalculated values from a meta‐analysis by Shen et al. Circles denote the remaining prospective and retrospective studies
FIGURE 9.
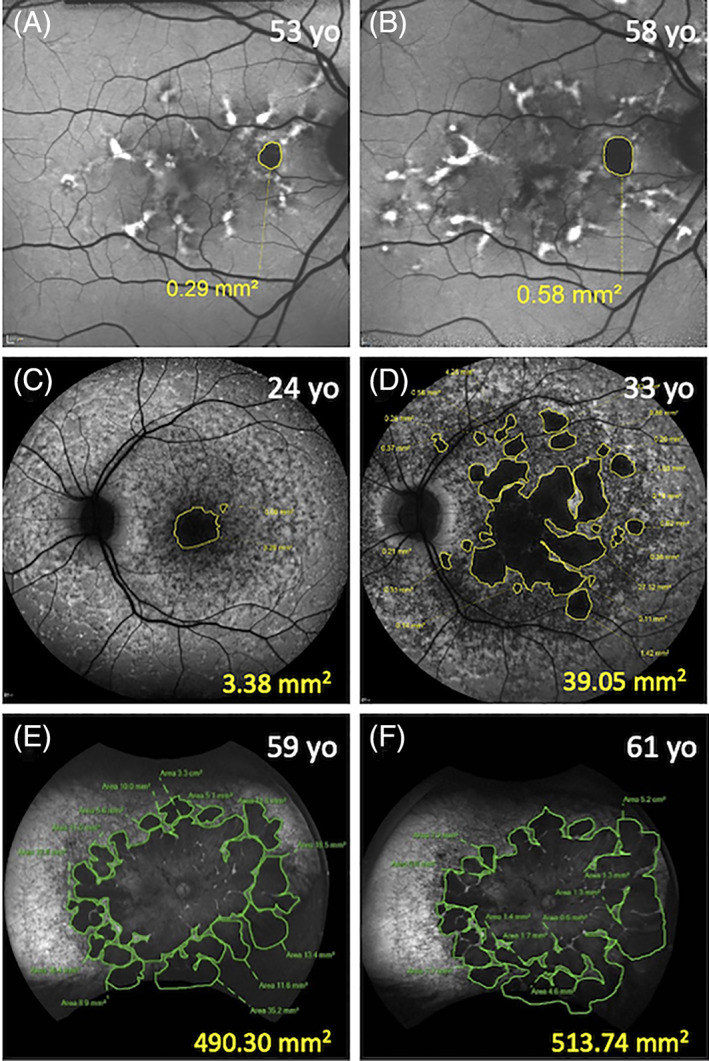
Images showing increasing areas of definite decreased autofluorescence (DDAF) using the 30° × 30° (A, B) and 55° × 55° (C, D) Heidelberg and 200° (E, F) Optos device. A 53‐year‐old male (c.5603A>T) with an age of symptom onset of 50 years (A). His unifocal atrophy had enlarged by 0.29 mm2 over the 5‐year follow‐up period (B). A 24‐year‐old female (c.[768G>T];[67‐1860A>G;6079C>T]) (C) with an age of symptom onset of 11 years. Her DDAF became multifocal and increased by 35.67 mm2 over 9 years (D). A 59‐year‐old female (c.[2915C>A];[3041T>G]) (E) with an age of symptom onset of 10 years had extensive atrophy. Her atrophy expanded by 23.44 mm2 over 2 years (F)
4.2.2. Monitoring of retinal thickness and volume change
One longitudinal study that examined serial horizontal cross‐section SD‐OCT scans demonstrated progressive thinning of the ONL with inner nuclear layer remodelling and thickening. Despite the inner retinal layer remodelling, Strauss et al.129 reported a 0.118 mm3/year (1.78%) decline in total macular volume. The greatest decline in volume (% of baseline value) was noted in the outer ring (0.079 mm3/year, 1.5%), followed by the inner ring (0.032 mm3/year, 2.2%) and the central 1 mm subfield (0.004 mm3/year, 3.1%). More recently, Whitmore et al.130 showed macular thinning was predominantly driven by the ONL with a decline in outer retinal layer of 3.35 (7.7%), 3.39 (5.3%), 2.84 (3.4%) μm/year in the central 1 mm subfield, inner ring and outer ring respectively. There was also a statistically significant increase in inner retinal thickness in the inner ring by 0.89 (0.6%) μm/year. The key limitation to OCT analysis of STGD1 progression is the reproducibility and accuracy of time consuming manual retinal sublayer boundary segmentation.131 We132 and others133 have developed automated algorithms for STGD1 OCT scans but these have not been validated in OCT images from across a range of SD‐OCT devices. Although factors influencing total and sublayer thinning of the STGD1 macula remains to be investigated, genotype severity is likely to be the most important determinant (Figure 10).
FIGURE 10.

A 13‐year‐old girl (c.[4139C>T];[5461‐10T>C;5603A>T] with perimacular hyperautofluorescent flecks which progressed to a central region of questionable decreased autofluorescence (QDAF) over 7 years (A). Prior to the formation of QDAF, there was a reduction in the retinal thickness in the macular region (B). The reduction was 2.11 mm3 over 7 years and was located predominantly in the outer ring (C). A 31‐year‐old asymptomatic female (c.[5603A>T];[6088C>T]) presented with central QDAF which later developed a new ring of hyperautofluorescence (D). The retinal thickness in the macular region declined over 4 years (E). The reduction of 0.10 mm3 was predominantly seen in the inner ring (F)
5. CONCLUDING REMARKS AND FUTURE PROSPECTS
Multimodal imaging reveals a range of pre‐clinical lesions and a wide spectrum of STGD1 phenotype. Longitudinal studies have demonstrated the feasibility and utility of FAF and OCT in monitoring disease progression predominantly in lesions limited to the macula. Recognition of the unique imaging features related to specific ABCA4 variants and mutation severity is important in guiding genetic testing and genetic counselling of patients. Emerging cellular and molecular therapies are now paralleled by the development of high‐resolution cellular imaging using adaptive optics technology134, 135, 136 and metabolic imaging of all‐trans retinal and lipofuscin by measuring fluorescence decay times.137 The future of multimodal imaging in STGD1 may incorporate real‐time in vivo retinal imaging of signalling processes such as detection of apoptosing retinal cell114 in cellular resolution.
ETHICS STATEMENT
Ethics approval was obtained from the Human Ethics Office of Research Enterprise, the University of Western Australia (RA/4/1/7916) and Sir Charles Gairdner Hospital Human Research Ethics Committee (2001‐053).
FUNDING SOURCES
National Health & Medical Research Council of Australia (Fred K. Chen) (project and fellowship grant no.: GNT116360, GNT1188694, GNT1054712 and MRF1142962), a Macular Disease Foundation Australia grant (Fred K. Chen), the Telethon‐Perth Children's Hospital research fund (FKC), the McCusker Charitable Foundation (Fred K. Chen) and Miocevich Retina Fellowship (Rachael C. Heath Jeffery).
CONFLICT OF INTEREST
None declared.
ACKNOWLEDGEMENTS
The authors would like to thank Maryam Saadat and Quang Pham for performing retinal imaging and the Australia Inherited Retinal Disease Registry (AIRDR) from the Department of Medical Technology and Physics at Sir Charles Gairdner Hospital for their expertise in genetic testing, analysis and interpretation of ABCA4 variants for cases included within this review.
Heath Jeffery RC, Chen FK. Stargardt disease: Multimodal imaging: A review. Clin Experiment Ophthalmol. 2021;49:498–515. 10.1111/ceo.13947
Funding information Miocevich Retina Fellowship; McCusker Charitable Foundation; Telethon‐Perth Children's Hospital research fund; Macular Disease Foundation Australia; National Health & Medical Research Council of Australia, Grant/Award Numbers: MRF1142962, GNT1054712, GNT1188694, GNT116360
REFERENCES
- 1.Allikmets R, Singh N, Sun H, et al. A photoreceptor cell‐specific ATP‐binding transporter gene (ABCR) is mutated in recessive Stargardt macular dystrophy. Nat Genet. 1997;15:236‐246. [DOI] [PubMed] [Google Scholar]
- 2.De Roach JN, McLaren TL, Thompson JA, et al. The Australian Inherited Retinal Disease Registry and DNA Bank. Tasman Med J. 2020;2:60‐67. [Google Scholar]
- 3.Heath Jeffery RC, Mukhtar SA, McAllister IL, Morgan WH, Mackey DA, Chen FK. Inherited retinal diseases are the most common cause of blindness in the working‐age population in Australia. Ophthalmic Genet. 2021;1‐9. 10.1080/13816810.2021.1913610. [DOI] [PMC free article] [PubMed] [Google Scholar]
- 4.Stargardt K. Über familiäre, progressive Degeneration in der Maculagegend des Auges. Albrecht von Graefes Arch Ophthalmol. 1909;71:534‐550. [Google Scholar]
- 5.Maugeri A, Klevering BJ, Rohrschneider K, et al. Mutations in the ABCA4 (ABCR) gene are the major cause of autosomal recessive cone‐rod dystrophy. Am J Hum Genet. 2000;67:960‐966. [DOI] [PMC free article] [PubMed] [Google Scholar]
- 6.Tanaka K, Lee W, Zernant J, et al. The rapid‐onset chorioretinopathy phenotype of ABCA4 disease. Ophthalmology. 2018;125:89‐99. [DOI] [PMC free article] [PubMed] [Google Scholar]
- 7.Yatsenko AN, Shroyer NF, Lewis RA, Lupski JR. Late‐onset Stargardt disease is associated with missense mutations that map outside known functional regions of ABCR (ABCA4). Hum Genet. 2001;108:346‐355. [DOI] [PubMed] [Google Scholar]
- 8.Westeneng‐van Haaften SC, Boon CJ, Cremers FP, Hoefsloot LH, den Hollander AI, Hoyng CB. Clinical and genetic characteristics of late‐onset Stargardt's disease. Ophthalmology. 2012;119:1199‐1210. [DOI] [PubMed] [Google Scholar]
- 9.Sears AE, Bernstein PS, Cideciyan AV, et al. Towards treatment of Stargardt disease: workshop organized and sponsored by the Foundation Fighting Blindness. Transl Vis Sci Technol. 2017;6:6. [DOI] [PMC free article] [PubMed] [Google Scholar]
- 10.Lambertus S, van Huet RA, Bax NM, et al. Early‐onset Stargardt disease: phenotypic and genotypic characteristics. Ophthalmology. 2015;122:335‐344. [DOI] [PubMed] [Google Scholar]
- 11.Khan KN, Kasilian M, Mahroo OAR, et al. Early patterns of macular degeneration in ABCA4‐associated retinopathy. Ophthalmology. 2018;125:735‐746. [DOI] [PMC free article] [PubMed] [Google Scholar]
- 12.Audo I, Robson AG, Holder GE, Moore AT. The negative ERG: clinical phenotypes and disease mechanisms of inner retinal dysfunction. Surv Ophthalmol. 2008;53:16‐40. [DOI] [PubMed] [Google Scholar]
- 13.Bax NM, Lambertus S, Cremers FPM, Klevering BJ, Hoyng CB. The absence of fundus abnormalities in Stargardt disease. Graefes Arch Clin Exp Ophthalmol. 2019;257:1147‐1157. [DOI] [PubMed] [Google Scholar]
- 14.van Huet RA, Bax NM, Westeneng‐Van Haaften SC, et al. Foveal sparing in Stargardt disease. Invest Ophthalmol Vis Sci. 2014;55:7467‐7478. [DOI] [PubMed] [Google Scholar]
- 15.Heath Jeffery RC, Thompson JA, Lo J, et al. Atrophy expansion rates in Stargardt disease using ultra‐widefield fundus autofluorescence. Ophthalmol Sci. 2021;1:100005. [DOI] [PMC free article] [PubMed] [Google Scholar]
- 16.Cella W, Greenstein VC, Zernant‐Rajang J, et al. G1961E mutant allele in the Stargardt disease gene ABCA4 causes bull's eye maculopathy. Exp Eye Res. 2009;89:16‐24. [DOI] [PMC free article] [PubMed] [Google Scholar]
- 17.Collison FT, Lee W, Fishman GA, et al. Clinical characterization of Stargardt disease patients with the p.N1868I ABCA4 mutation. Retina. 2019;39:2311‐2325. [DOI] [PMC free article] [PubMed] [Google Scholar]
- 18.Genead MA, Fishman GA, Stone EM, Allikmets R. The natural history of Stargardt disease with specific sequence mutation in the ABCA4 gene. Invest Ophthalmol Vis Sci. 2009;50:5867‐5871. [DOI] [PubMed] [Google Scholar]
- 19.Michaelides M, Chen LL, Brantley MA Jr, et al. ABCA4 mutations and discordant ABCA4 alleles in patients and siblings with bull's‐eye maculopathy. Br J Ophthalmol. 2007;91:1650‐1655. [DOI] [PMC free article] [PubMed] [Google Scholar]
- 20.Runhart EH, Sangermano R, Cornelis SS, et al. The common ABCA4 variant p.Asn1868Ile shows nonpenetrance and variable expression of Stargardt disease when present in trans with severe variants. Invest Ophthalmol Vis Sci. 2018;59:3220‐3231. [DOI] [PubMed] [Google Scholar]
- 21.Huang D, Thompson JA, Charng J, et al. Phenotype–genotype correlations in a pseudodominant Stargardt disease pedigree due to a novel ABCA4 deletion–insertion variant causing a splicing defect. Mol Genet Genomic Med. 2020;8:e1259. [DOI] [PMC free article] [PubMed] [Google Scholar]
- 22.Huckfeldt RM, East JS, Stone EM, Sohn EH. Phenotypic variation in a family with pseudodominant Stargardt disease. JAMA Ophthalmol. 2016;134:580‐583. [DOI] [PubMed] [Google Scholar]
- 23.Spaide RF, Koizumi H, Pozzoni MC. Enhanced depth imaging spectral‐domain optical coherence tomography. Am J Ophthalmol. 2008;146:496‐500. [DOI] [PubMed] [Google Scholar]
- 24.Huynh E, Chandrasekera E, Bukowska D, McLenachan S, Mackey DA, Chen FK. Past, present, and future concepts of the choroidal scleral interface morphology on optical coherence tomography. Asia Pac J Ophthalmol (Phila). 2017;6:94‐103. [DOI] [PubMed] [Google Scholar]
- 25.Chandrasekera E, Wong EN, Sampson DM, Alonso‐Caneiro D, Chen FK. Posterior choroidal stroma reduces accuracy of automated segmentation of outer choroidal boundary in swept source optical coherence tomography. Invest Ophthalmol Vis Sci. 2018;59:4404‐4412. [DOI] [PubMed] [Google Scholar]
- 26.Fingler J, Readhead C, Schwartz DM, Fraser SE. Phase‐contrast OCT imaging of transverse flows in the mouse retina and choroid. Invest Ophthalmol Vis Sci. 2008;49:5055‐5059. [DOI] [PubMed] [Google Scholar]
- 27.Kim DY, Fingler J, Werner JS, Schwartz DM, Fraser SE, Zawadzki RJ. In vivo volumetric imaging of human retinal circulation with phase‐variance optical coherence tomography. Biomed Opt Express. 2011;2:1504‐1513. [DOI] [PMC free article] [PubMed] [Google Scholar]
- 28.Jia Y, Tan O, Tokayer J, et al. Split‐spectrum amplitude‐decorrelation angiography with optical coherence tomography. Opt Express. 2012;20:4710‐4725. [DOI] [PMC free article] [PubMed] [Google Scholar]
- 29.Mariampillai A, Standish BA, Moriyama EH, et al. Speckle variance detection of microvasculature using swept‐source optical coherence tomography. Opt Lett. 2008;33:1530‐1532. [DOI] [PubMed] [Google Scholar]
- 30.Spaide RF, Fujimoto JG, Waheed NK, Sadda SR, Staurenghi G. Optical coherence tomography angiography. Prog Retin Eye Res. 2018;64:1‐55. [DOI] [PMC free article] [PubMed] [Google Scholar]
- 31.Querques G, Leveziel N, Benhamou N, Voigt M, Soubrane G, Souied EH. Analysis of retinal flecks in fundus flavimaculatus using optical coherence tomography. Br J Ophthalmol. 2006;90:1157‐1162. [DOI] [PMC free article] [PubMed] [Google Scholar]
- 32.Voigt M, Querques G, Atmani K, et al. Analysis of retinal flecks in fundus flavimaculatus using high‐definition spectral‐domain optical coherence tomography. Am J Ophthalmol. 2010;150:330‐337. [DOI] [PubMed] [Google Scholar]
- 33.Sparrow JR, Marsiglia M, Allikmets R, et al. Flecks in recessive Stargardt disease: short‐wavelength autofluorescence, near‐infrared autofluorescence, and optical coherence tomography. Invest Ophthalmol Vis Sci. 2015;56:5029‐5039. [DOI] [PMC free article] [PubMed] [Google Scholar]
- 34.Leng T, Marmor MF, Kellner U, et al. Foveal cavitation as an optical coherence tomography finding in central cone dysfunction. Retina. 2012;32:1411‐1419. [DOI] [PubMed] [Google Scholar]
- 35.Sisk RA, Leng T. Multimodal imaging and multifocal electroretinography demonstrate autosomal recessive Stargardt disease may present like occult macular dystrophy. Retina. 2014;34:1567‐1575. [DOI] [PubMed] [Google Scholar]
- 36.Burke TR, Yzer S, Zernant J, Smith RT, Tsang SH, Allikmets R. Abnormality in the external limiting membrane in early Stargardt disease. Ophthalmic Genet. 2013;34:75‐77. [DOI] [PMC free article] [PubMed] [Google Scholar]
- 37.Lee W, Nõupuu K, Oll M, et al. The external limiting membrane in early‐onset Stargardt disease. Invest Ophthalmol Vis Sci. 2014;55:6139‐6149. [DOI] [PMC free article] [PubMed] [Google Scholar]
- 38.Yeoh J, Rahman W, Chen F, et al. Choroidal imaging in inherited retinal disease using the technique of enhanced depth imaging optical coherence tomography. Graefes Arch Clin Exp Ophthalmol. 2010;248:1719‐1728. [DOI] [PubMed] [Google Scholar]
- 39.Ratra D, Tan R, Jaishankar D, et al. Choroidal structural changes and vascularity index in Stargardt disease on swept source optical coherence tomography. Retina. 2018;38:2395‐2400. [DOI] [PubMed] [Google Scholar]
- 40.Arrigo A, Romano F, Aragona E, et al. OCTA‐based identification of different vascular patterns in Stargardt disease. Transl Vis Sci Technol. 2019;8:26. [DOI] [PMC free article] [PubMed] [Google Scholar]
- 41.Piri N, Nesmith BL, Schaal S. Choroidal hyperreflective foci in Stargardt disease shown by spectral‐domain optical coherence tomography imaging: correlation with disease severity. JAMA Ophthalmol. 2015;133:398‐405. [DOI] [PubMed] [Google Scholar]
- 42.Battaglia Parodi M, Sacconi R, Romano F, Bandello F. Hyperreflective foci in Stargardt disease: 1‐year follow‐up. Graefes Arch Clin Exp Ophthalmol. 2019;257:41‐48. [DOI] [PubMed] [Google Scholar]
- 43.Battaglia Parodi M, Casalino G, Iacono P, Introini U, Adamyan T, Bandello F. The expanding clinical spectrum of choroidal excavation in macular dystrophies. Retina. 2018;38:2030‐2034. [DOI] [PubMed] [Google Scholar]
- 44.Margolis R, Mukkamala SK, Jampol LM, et al. The expanded spectrum of focal choroidal excavation. Arch Ophthalmol. 2011;129:1320‐1325. [DOI] [PubMed] [Google Scholar]
- 45.Schwoerer J, Secrétan M, Zografos L, Piguet B. Indocyanine green angiography in fundus flavimaculatus. Ophthalmologica. 2000;214:240‐245. [DOI] [PubMed] [Google Scholar]
- 46.Giani A, Pellegrini M, Carini E, Peroglio Deiro A, Bottoni F, Staurenghi G. The dark atrophy with indocyanine green angiography in Stargardt disease. Invest Ophthalmol Vis Sci. 2012;53:3999‐4004. [DOI] [PubMed] [Google Scholar]
- 47.Battaglia Parodi M, Cicinelli MV, Rabiolo A, Pierro L, Bolognesi G, Bandello F. Vascular abnormalities in patients with Stargardt disease assessed with optical coherence tomography angiography. Br J Ophthalmol. 2017;101:780‐785. [DOI] [PubMed] [Google Scholar]
- 48.Pellegrini M, Acquistapace A, Oldani M, et al. Dark atrophy: an optical coherence tomography angiography study. Ophthalmology. 2016;123:1879‐1886. [DOI] [PubMed] [Google Scholar]
- 49.Guduru A, Lupidi M, Gupta A, Jalali S, Chhablani J. Comparative analysis of autofluorescence and OCT angiography in Stargardt disease. Br J Ophthalmol. 2018;102:1204‐1207. [DOI] [PubMed] [Google Scholar]
- 50.Müller PL, Pfau M, Möller PT, et al. Choroidal flow signal in late‐onset Stargardt disease and age‐related macular degeneration: an OCT‐angiography study. Invest Ophthalmol Vis Sci. 2018;59:Amd122‐AMD131. [DOI] [PubMed] [Google Scholar]
- 51.Alabduljalil T, Patel RC, Alqahtani AA, et al. Correlation of outer retinal degeneration and choriocapillaris loss in Stargardt disease using en face optical coherence tomography and optical coherence tomography angiography. Am J Ophthalmol. 2019;202:79‐90. [DOI] [PMC free article] [PubMed] [Google Scholar]
- 52.Chen FK, Viljoen RD, Bukowska DM. Classification of image artefacts in optical coherence tomography angiography of the choroid in macular diseases. Clin Experiment Ophthalmol. 2016;44:388‐399. [DOI] [PubMed] [Google Scholar]
- 53.Mastropasqua R, Toto L, Borrelli E, et al. Optical coherence tomography angiography findings in Stargardt disease. PLoS One. 2017;12:e0170343. [DOI] [PMC free article] [PubMed] [Google Scholar]
- 54.Reich M, Dreesbach M, Boehringer D, et al. Negative vessel remodeling in Stargardt disease quantified with volume‐rendered optical coherence tomography angiography. Retina. 2021. 10.1097/IAE.0000000000003110. [DOI] [PubMed] [Google Scholar]
- 55.Han IC, Menzel MC, Stone EM. Hyperlipofuscinosis with subretinal fibrosis and choroidal vascular remodeling in Stargardt disease. JAMA Ophthalmol. 2021;139:e205438. [DOI] [PubMed] [Google Scholar]
- 56.von Rückmann A, Fitzke FW, Bird AC. Distribution of fundus autofluorescence with a scanning laser ophthalmoscope. Br J Ophthalmol. 1995;79:407‐412. [DOI] [PMC free article] [PubMed] [Google Scholar]
- 57.Sparrow JR, Gregory‐Roberts E, Yamamoto K, et al. The bisretinoids of retinal pigment epithelium. Prog Retin Eye Res. 2012;31:121‐135. [DOI] [PMC free article] [PubMed] [Google Scholar]
- 58.Delori FC, Dorey CK, Staurenghi G, Arend O, Goger DG, Weiter JJ. In vivo fluorescence of the ocular fundus exhibits retinal pigment epithelium lipofuscin characteristics. Invest Ophthalmol Vis Sci. 1995;36:718‐729. [PubMed] [Google Scholar]
- 59.Lois N, Halfyard AS, Bird AC, Holder GE, Fitzke FW. Fundus autofluorescence in Stargardt macular dystrophy‐fundus flavimaculatus. Am J Ophthalmol. 2004;138:55‐63. [DOI] [PubMed] [Google Scholar]
- 60.Zhao PY, Abalem MF, Nadelman D, et al. Peripheral pigmented retinal lesions in Stargardt disease. Am J Ophthalmol. 2018;188:104‐110. [DOI] [PMC free article] [PubMed] [Google Scholar]
- 61.De Laey JJ, Verougstraete C. Hyperlipofuscinosis and subretinal fibrosis in Stargardt's disease. Retina. 1995;15:399‐406. [DOI] [PubMed] [Google Scholar]
- 62.Keilhauer CN, Delori FC. Near‐infrared autofluorescence imaging of the fundus: visualization of ocular melanin. Invest Ophthalmol Vis Sci. 2006;47:3556‐3564. [DOI] [PubMed] [Google Scholar]
- 63.Cideciyan AV, Swider M, Aleman TS, et al. Reduced‐illuminance autofluorescence imaging in ABCA4‐associated retinal degenerations. J Opt Soc Am A Opt Image Sci Vis. 2007;24:1457‐1467. [DOI] [PMC free article] [PubMed] [Google Scholar]
- 64.Duncker T, Marsiglia M, Lee W, et al. Correlations among near‐infrared and short‐wavelength autofluorescence and spectral‐domain optical coherence tomography in recessive Stargardt disease. Invest Ophthalmol Vis Sci. 2014;55:8134‐8143. [DOI] [PMC free article] [PubMed] [Google Scholar]
- 65.Greenstein VC, Schuman AD, Lee W, et al. Near‐infrared autofluorescence: its relationship to short‐wavelength autofluorescence and optical coherence tomography in recessive Stargardt disease. Invest Ophthalmol Vis Sci. 2015;56:3226‐3234. [DOI] [PMC free article] [PubMed] [Google Scholar]
- 66.Kellner S, Kellner U, Weber BH, Fiebig B, Weinitz S, Ruether K. Lipofuscin‐ and melanin‐related fundus autofluorescence in patients with ABCA4‐associated retinal dystrophies. Am J Ophthalmol. 2009;147:895‐902.e1. [DOI] [PubMed] [Google Scholar]
- 67.Strauss RW, Muñoz B, Jha A, et al. Comparison of short‐wavelength reduced‐illuminance and conventional autofluorescence imaging in Stargardt macular dystrophy. Am J Ophthalmol. 2016;168:269‐278. [DOI] [PMC free article] [PubMed] [Google Scholar]
- 68.Müller PL, Pfau M, Mauschitz MM, et al. Comparison of green versus blue fundus autofluorescence in ABCA4‐related retinopathy. Transl Vis Sci Technol. 2018;7:13. [DOI] [PMC free article] [PubMed] [Google Scholar]
- 69.Delori F, Greenberg JP, Woods RL, et al. Quantitative measurements of autofluorescence with the scanning laser ophthalmoscope. Invest Ophthalmol Vis Sci. 2011;52:9379‐9390. [DOI] [PMC free article] [PubMed] [Google Scholar]
- 70.Duncker T, Tsang SH, Lee W, et al. Quantitative fundus autofluorescence distinguishes ABCA4‐associated and non‐ABCA4‐associated bull's‐eye maculopathy. Ophthalmology. 2015;122:345‐355. [DOI] [PMC free article] [PubMed] [Google Scholar]
- 71.Duncker T, Tsang SH, Woods RL, et al. Quantitative fundus autofluorescence and optical coherence tomography in PRPH2/RDS‐ and ABCA4‐associated disease exhibiting phenotypic overlap. Invest Ophthalmol Vis Sci. 2015;56:3159‐3170. [DOI] [PMC free article] [PubMed] [Google Scholar]
- 72.Müller PL, Gliem M, McGuinnes M, Birtel J, Holz FG, Charbel IP. Quantitative fundus autofluorescence in ABCA4‐related retinopathy‐functional relevance and genotype–phenotype correlation. Am J Ophthalmol. 2021;222:340‐350. [DOI] [PubMed] [Google Scholar]
- 73.Witmer MT, Kiss S. Wide‐field imaging of the retina. Surv Ophthalmol. 2013;58:143‐154. [DOI] [PubMed] [Google Scholar]
- 74.Atkinson A, Mazo C. Imaged area of the retina. https://wwwfreelistsorg/archives/optimal/02-2017/pdf91WmMGLh6Qpdf. Accessed May 9, 2021.
- 75.Patel M, Kiss S. Ultra‐wide‐field fluorescein angiography in retinal disease. Curr Opin Ophthalmol. 2014;25:213‐220. [DOI] [PubMed] [Google Scholar]
- 76.Cremers FPM, Lee W, Collin RWJ, Allikmets R. Clinical spectrum, genetic complexity and therapeutic approaches for retinal disease caused by ABCA4 mutations. Prog Retin Eye Res. 2020;79:100861. [DOI] [PMC free article] [PubMed] [Google Scholar]
- 77.Verdina T, Tsang SH, Greenstein VC, et al. Functional analysis of retinal flecks in Stargardt disease. J Clin Exp Ophthalmol. 2012;3. 10.4172/2155-9570.1000233. [DOI] [PMC free article] [PubMed] [Google Scholar]
- 78.Dhooge PPA, Runhart EH, Lambertus S, et al. Correlation of morphology and function of flecks using short‐wave fundus autofluorescence and microperimetry in patients with Stargardt disease. Transl Vis Sci Technol. 2021;10:18. [DOI] [PMC free article] [PubMed] [Google Scholar]
- 79.Chen B, Tosha C, Gorin MB, Nusinowitz S. Analysis of autofluorescent retinal images and measurement of atrophic lesion growth in Stargardt disease. Exp Eye Res. 2010;91:143‐152. [DOI] [PubMed] [Google Scholar]
- 80.Charng J, Xiao D, Mehdizadeh M, et al. Deep learning segmentation of hyperautofluorescent fleck lesions in Stargardt disease. Sci Rep. 2020;10:16491. [DOI] [PMC free article] [PubMed] [Google Scholar]
- 81.Kuehlewein L, Hariri AH, Ho A, et al. Comparison of manual and semiautomated fundus autofluorescence analysis of macular atrophy in Stargardt disease phenotype. Retina. 2016;36:1216‐1221. [DOI] [PubMed] [Google Scholar]
- 82.Strauss RW, Muñoz B, Ho A, et al. Progression of Stargardt disease as determined by fundus autofluorescence in the retrospective progression of Stargardt disease study (ProgStar report no. 9). JAMA Ophthalmol. 2017;135:1232‐1241. [DOI] [PMC free article] [PubMed] [Google Scholar]
- 83.Strauss RW, Kong X, Ho A, et al. Progression of Stargardt disease as determined by fundus autofluorescence over a 12‐month period: ProgStar report no. 11. JAMA Ophthalmol. 2019;137:1134‐1145. [DOI] [PMC free article] [PubMed] [Google Scholar]
- 84.Georgiou M, Kane T, Tanna P, et al. Prospective cohort study of childhood‐onset Stargardt disease: fundus autofluorescence imaging, progression, comparison with adult‐onset disease, and disease symmetry. Am J Ophthalmol. 2020;211:159‐175. [DOI] [PMC free article] [PubMed] [Google Scholar]
- 85.Jauregui R, Nuzbrokh Y, Su PY, et al. Retinal pigment epithelium atrophy in recessive Stargardt disease as measured by short‐wavelength and near‐infrared autofluorescence. Transl Vis Sci Technol. 2021;10:3. [DOI] [PMC free article] [PubMed] [Google Scholar]
- 86.Müller PL, Birtel J, Herrmann P, Holz FG, Charbel Issa P, Gliem M. Functional relevance and structural correlates of near infrared and short wavelength fundus autofluorescence imaging in ABCA4‐related retinopathy. Transl Vis Sci Technol. 2019;8:46. [DOI] [PMC free article] [PubMed] [Google Scholar]
- 87.Nassisi M, Mohand‐Saïd S, Andrieu C, et al. Peripapillary sparing with near infrared autofluorescence correlates with electroretinographic findings in patients with Stargardt disease. Invest Ophthalmol Vis Sci. 2019;60:4951‐4957. [DOI] [PubMed] [Google Scholar]
- 88.Cideciyan AV, Swider M, Aleman TS, et al. ABCA4‐associated retinal degenerations spare structure and function of the human parapapillary retina. Invest Ophthalmol Vis Sci. 2005;46:4739‐4746. [DOI] [PMC free article] [PubMed] [Google Scholar]
- 89.Hwang JC, Zernant J, Allikmets R, Barile GR, Chang S, Smith RT. Peripapillary atrophy in Stargardt disease. Retina. 2009;29:181‐186. [DOI] [PMC free article] [PubMed] [Google Scholar]
- 90.Greenberg JP, Duncker T, Woods RL, Smith RT, Sparrow JR, Delori FC. Quantitative fundus autofluorescence in healthy eyes. Invest Ophthalmol Vis Sci. 2013;54:5684‐5693. [DOI] [PMC free article] [PubMed] [Google Scholar]
- 91.Al‐Ani HH, Sheck L, Vincent AL. Peripheral pigmented lesions in ABCA4‐associated retinopathy. Ophthalmic Genet. 2021;1‐9. 10.1080/13816810.2021.1897850. [DOI] [PubMed] [Google Scholar]
- 92.Abalem MF, Otte B, Andrews C, et al. Peripheral visual fields in ABCA4 Stargardt disease and correlation with disease extent on ultra‐widefield fundus autofluorescence. Am J Ophthalmol. 2017;184:181‐188. [DOI] [PMC free article] [PubMed] [Google Scholar]
- 93.Klufas MA, Tsui I, Sadda SR, Hosseini H, Schwartz SD. Ultrawidefield autofluorescence in ABCA4 Stargardt disease. Retina. 2018;38:403‐415. [DOI] [PubMed] [Google Scholar]
- 94.Chen L, Lee W, de Carvalho JRL Jr, et al. Multi‐platform imaging in ABCA4‐associated disease. Sci Rep. 2019;9:6436. [DOI] [PMC free article] [PubMed] [Google Scholar]
- 95.Burke TR, Duncker T, Woods RL, et al. Quantitative fundus autofluorescence in recessive Stargardt disease. Invest Ophthalmol Vis Sci. 2014;55:2841‐2852. [DOI] [PMC free article] [PubMed] [Google Scholar]
- 96.Del Pozo‐Valero M, Riveiro‐Alvarez R, Blanco‐Kelly F, et al. Genotype‐phenotype correlations in a Spanish cohort of 506 families with biallelic ABCA4 pathogenic variants. Am J Ophthalmol. 2020;219:195‐204. [DOI] [PubMed] [Google Scholar]
- 97.Holtan JP, Aukrust I, Jansson RW, et al. Clinical features and molecular genetics of patients with ABCA4‐retinal dystrophies. Acta Ophthalmol. 2020. 10.1111/aos.14679. [DOI] [PubMed] [Google Scholar]
- 98.Mena MD, Moresco AA, Vidal SH, et al. Clinical and genetic spectrum of Stargardt disease in Argentinean patients. Front Genet. 2021;12:646058. [DOI] [PMC free article] [PubMed] [Google Scholar]
- 99.Fujinami K, Zernant J, Chana RK, et al. Clinical and molecular characteristics of childhood‐onset Stargardt disease. Ophthalmology. 2015;122:326‐334. [DOI] [PMC free article] [PubMed] [Google Scholar]
- 100.Lorenz B, Preising MN. Age matters – thoughts on a grading system for ABCA4 mutations. Graefes Arch Clin Exp Ophthalmol. 2005;243:87‐89. [DOI] [PubMed] [Google Scholar]
- 101.Heath Jeffery RC, Thompson JA, Lamey TM, et al. Classifying ABCA4 mutation severity using age‐dependant ultra‐widefield fundas autofluorescence‐derived total lesion size. Retina. 2021. [DOI] [PubMed] [Google Scholar]
- 102.Fung AT, Pellegrini M, Shields CL. Congenital hypertrophy of the retinal pigment epithelium: enhanced‐depth imaging optical coherence tomography in 18 cases. Ophthalmology. 2014;121:251‐256. [DOI] [PubMed] [Google Scholar]
- 103.Fishman GA, Stone EM, Grover S, Derlacki DJ, Haines HL, Hockey RR. Variation of clinical expression in patients with Stargardt dystrophy and sequence variations in the ABCR gene. Arch Ophthalmol. 1999;117:504‐510. [DOI] [PubMed] [Google Scholar]
- 104.Kurz‐Levin MM, Halfyard AS, Bunce C, Bird AC, Holder GE. Clinical variations in assessment of bull's‐eye maculopathy. Arch Ophthalmol. 2002;120:567‐575. [DOI] [PubMed] [Google Scholar]
- 105.Lee W, Schuerch K, Zernant J, et al. Genotypic spectrum and phenotype correlations of ABCA4‐associated disease in patients of south Asian descent. Eur J Hum Genet. 2017;25:735‐743. [DOI] [PMC free article] [PubMed] [Google Scholar]
- 106.Lambertus S, Lindner M, Bax NM, et al. Progression of late‐onset Stargardt disease. Invest Ophthalmol Vis Sci. 2016;57:5186‐5191. [DOI] [PubMed] [Google Scholar]
- 107.Zernant J, Lee W, Collison FT, et al. Frequent hypomorphic alleles account for a significant fraction of ABCA4 disease and distinguish it from age‐related macular degeneration. J Med Genet. 2017;54:404‐412. [DOI] [PMC free article] [PubMed] [Google Scholar]
- 108.Runhart EH, Khan M, Cornelis SS, et al. Association of sex with frequent and mild ABCA4 alleles in Stargardt disease. JAMA Ophthalmol. 2020;138:1035‐1042. [DOI] [PMC free article] [PubMed] [Google Scholar]
- 109.Querques G, Bocco MC, Soubrane G, Souied EH. Intravitreal ranibizumab (Lucentis) for choroidal neovascularization associated with Stargardt's disease. Graefes Arch Clin Exp Ophthalmol. 2008;246:319‐321. [DOI] [PubMed] [Google Scholar]
- 110.Souied EH, Pawlak D, Algan M, Sayag D, Coscas G, Soubrane G. Photodynamic therapy for choroidal neovascularization on late‐onset fundus flavimaculatus. Am J Ophthalmol. 2005;140:312‐314. [DOI] [PubMed] [Google Scholar]
- 111.Gliem M, Müller PL, Finger RP, McGuinness MB, Holz FG, Charbel IP. Quantitative fundus autofluorescence in early and intermediate age‐related macular degeneration. JAMA Ophthalmol. 2016;134:817‐824. [DOI] [PubMed] [Google Scholar]
- 112.Ervin AM, Strauss RW, Ahmed MI, et al. A workshop on measuring the progression of atrophy secondary to Stargardt disease in the ProgStar studies: findings and lessons learned. Transl Vis Sci Technol. 2019;8:16. [DOI] [PMC free article] [PubMed] [Google Scholar]
- 113.Normando EM, Turner LA, Cordeiro MF. The potential of annexin‐labelling for the diagnosis and follow‐up of glaucoma. Cell Tissue Res. 2013;353:279‐285. [DOI] [PubMed] [Google Scholar]
- 114.Yang E, Al‐Mugheiry TS, Normando EM, Cordeiro MF. Real‐time imaging of retinal cell apoptosis by confocal scanning laser ophthalmoscopy and its role in glaucoma. Front Neurol. 2018;9:338. [DOI] [PMC free article] [PubMed] [Google Scholar]
- 115.Strauss RW, Ho A, Muñoz B, et al. The natural history of the progression of atrophy secondary to Stargardt disease (ProgStar) studies: design and baseline characteristics: ProgStar report no. 1. Ophthalmology. 2016;123:817‐828. [DOI] [PubMed] [Google Scholar]
- 116.Kong X, Strauss RW, Munoz B, West S, Cheetham J, HPN S. Re: Shen et al.: Natural history of autosomal recessive Stargardt disease in untreated eyes: a systematic review and meta‐analysis of study and individual level data (Ophthalmology. 2019;126:1288–1296). Ophthalmology. 2020;127:e28‐e29. [DOI] [PubMed] [Google Scholar]
- 117.Feuer WJ, Yehoshua Z, Gregori G, et al. Square root transformation of geographic atrophy area measurements to eliminate dependence of growth rates on baseline lesion measurements: a reanalysis of age‐related eye disease study report no. 26. JAMA Ophthalmol. 2013;131:110‐111. [DOI] [PMC free article] [PubMed] [Google Scholar]
- 118.Melillo P, Testa F, Rossi S, et al. En face spectral‐domain optical coherence tomography for the monitoring of lesion area progression in Stargardt disease. Invest Ophthalmol Vis Sci. 2016;57:Oct247‐Oct252. [DOI] [PMC free article] [PubMed] [Google Scholar]
- 119.Sung YC, Yang CH, Yang CM, et al. Genotypes predispose phenotypes‐clinical features and genetic spectrum of ABCA4‐associated retinal dystrophies. Genes (Basel). 2020;11:1421. [DOI] [PMC free article] [PubMed] [Google Scholar]
- 120.Lindner M, Lambertus S, Mauschitz MM, et al. Differential disease progression in atrophic age‐related macular degeneration and late‐onset Stargardt disease. Invest Ophthalmol Vis Sci. 2017;58:1001‐1007. [DOI] [PubMed] [Google Scholar]
- 121.Müller PL, Pfau M, Treis T, et al. Progression of ABCA4‐related retinopathy: prognostic value of demographic, functional, genetic, and imaging parameters. Retina. 2020;40:2343‐2356. [DOI] [PubMed] [Google Scholar]
- 122.Shen LL, Sun M, Grossetta Nardini HK, Del Priore LV. Natural history of autosomal recessive Stargardt disease in untreated eyes: a systematic review and meta‐analysis of study‐ and individual‐level data. Ophthalmology. 2019;126:1288‐1296. [DOI] [PubMed] [Google Scholar]
- 123.Shen LL, Del Priore LV. Reply. Ophthalmology. 2020;127:e29‐e30. [DOI] [PubMed] [Google Scholar]
- 124.Kong X, West SK, Strauss RW, et al. Progression of visual acuity and fundus autofluorescence in recent‐onset Stargardt disease: ProgStar study report #4. Ophthalmol Retina. 2017;1:514‐523. [DOI] [PubMed] [Google Scholar]
- 125.McBain VA, Townend J, Lois N. Progression of retinal pigment epithelial atrophy in Stargardt disease. Am J Ophthalmol. 2012;154:146‐154. [DOI] [PubMed] [Google Scholar]
- 126.Cicinelli MV, Rabiolo A, Brambati M, Viganò C, Bandello F, Battaglia PM. Factors influencing retinal pigment epithelium‐atrophy progression rate in Stargardt disease. Transl Vis Sci Technol. 2020;9:33. [DOI] [PMC free article] [PubMed] [Google Scholar]
- 127.Fujinami K, Lois N, Mukherjee R, et al. A longitudinal study of Stargardt disease: quantitative assessment of fundus autofluorescence, progression, and genotype correlations. Invest Ophthalmol Vis Sci. 2013;54:8181‐8190. [DOI] [PubMed] [Google Scholar]
- 128.Di Iorio V, Orrico A, Esposito G, et al. Association between genotype and disease progression in Italian Stargardt patients: a retrospective natural history study. Retina. 2019;39:1399‐1409. [DOI] [PubMed] [Google Scholar]
- 129.Strauss RW, Muñoz B, Wolfson Y, et al. Assessment of estimated retinal atrophy progression in Stargardt macular dystrophy using spectral‐domain optical coherence tomography. Br J Ophthalmol. 2016;100:956‐962. [DOI] [PMC free article] [PubMed] [Google Scholar]
- 130.Whitmore SS, Fortenbach CR, Cheng JL, et al. Analysis of retinal sublayer thicknesses and rates of change in ABCA4‐associated Stargardt disease. Sci Rep. 2020;10:16576. [DOI] [PMC free article] [PubMed] [Google Scholar]
- 131.Velaga SB, Nittala MG, Jenkins D, et al. Impact of segmentation density on spectral domain optical coherence tomography assessment in Stargardt disease. Graefes Arch Clin Exp Ophthalmol. 2019;257:549‐556. [DOI] [PubMed] [Google Scholar]
- 132.Kugelman J, Alonso‐Caneiro D, Chen Y, et al. Retinal boundary segmentation in Stargardt disease optical coherence tomography images using automated deep learning. Transl Vis Sci Technol. 2020;9:12. [DOI] [PMC free article] [PubMed] [Google Scholar]
- 133.Mishra Z, Wang Z, Sadda SR, Hu Z. Automatic segmentation in multiple OCT layers for Stargardt disease characterization via deep learning. Transl Vis Sci Technol. 2021;10:24. [DOI] [PMC free article] [PubMed] [Google Scholar]
- 134.Chen Y, Ratnam K, Sundquist SM, et al. Cone photoreceptor abnormalities correlate with vision loss in patients with Stargardt disease. Invest Ophthalmol Vis Sci. 2011;52:3281‐3292. [DOI] [PMC free article] [PubMed] [Google Scholar]
- 135.Song H, Rossi EA, Latchney L, et al. Cone and rod loss in Stargardt disease revealed by adaptive optics scanning light ophthalmoscopy. JAMA Ophthalmol. 2015;133:1198‐1203. [DOI] [PMC free article] [PubMed] [Google Scholar]
- 136.Song H, Rossi EA, Yang Q, Granger CE, Latchney LR, Chung MM. High‐resolution adaptive optics in vivo autofluorescence imaging in Stargardt disease. JAMA Ophthalmol. 2019;137:603‐609. [DOI] [PMC free article] [PubMed] [Google Scholar]
- 137.Dysli C, Wolf S, Hatz K, Zinkernagel MS. Fluorescence lifetime imaging in Stargardt disease: potential marker for disease progression. Invest Ophthalmol Vis Sci. 2016;57:832‐841. [DOI] [PubMed] [Google Scholar]