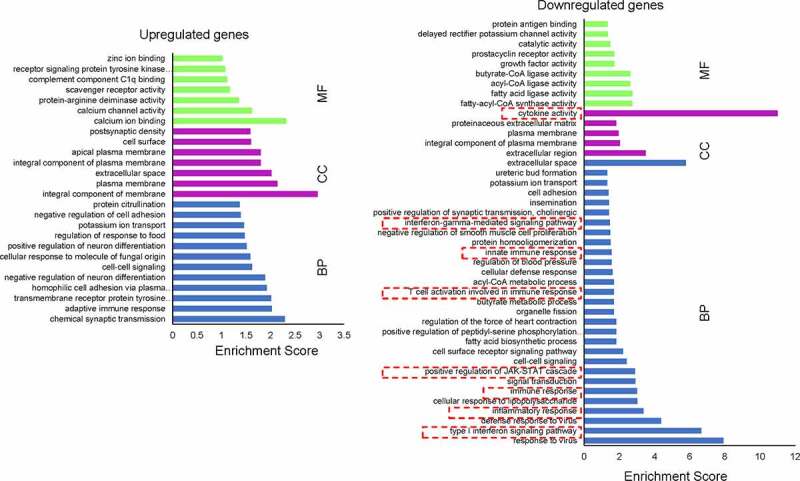
Figure 4.

Gene ontology enrichment analysis of differentially expressed genes after co-culture. The differentially expressed genes between the two CAR-T cells were subjected to GO analysis using the online bioinformatics tool: DAVID Bioinformatics Resources 6.8. Fisher’s exact test was used for the gene enrichment analysis. BP, biological process; CC, cellular component; MF, molecular function
