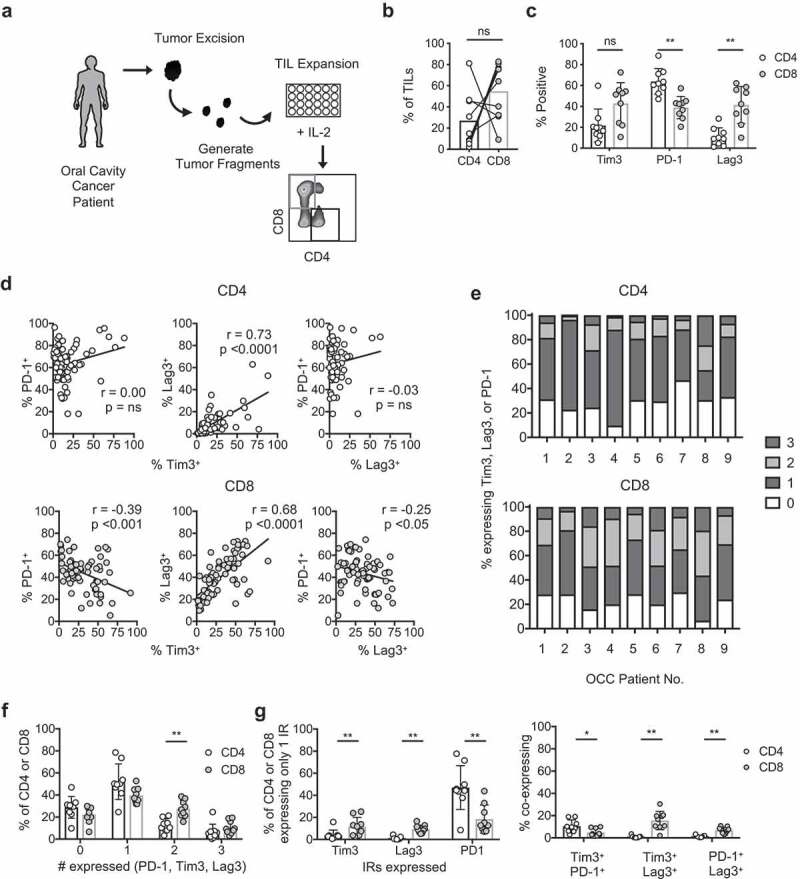
Figure 3.

Inhibitory receptor expression dynamics in T cell subsets expanded from human OCSCC tumors
a) TIL expansion schematic. Tumor biopsies were obtained from patients with oral cavity squamous cell carcinoma (OCC). Tumors were diced and plated in 6000IU IL-2/mL and expanded for 4 weeks prior to analysis. Gating strategy for CD4+ and CD8+ T cell subsets shown. b) Frequency of CD4+ and CD8+ T cells in expanded TIL. n = 9 OCC. c) Frequency of cells expressing inhibitory receptors in OCC patients. d) Correlation of cells expressing pairs of inhibitory receptors from all individual TIL cultures of OCC patients. e–g) OCC TIL were assessed for co-expression of Tim-3, PD-1, and Lag-3. Cells can express from 0 to 3 of these receptors. e) Fraction of all TIL within CD4+ and CD8+ T cell populations expressing 0, 1, 2, or 3 IRs displayed per OCC patient. n = 9 OCC patients. f) Statistical comparison of data displayed in E. g) Frequency of T cells expressing only one or two inhibitory receptors, defined and compared between T cell subsets. n = 9 OCC patients. Statistical tests: B, C, F, G) Wilcoxon sign rank test, d) Spearman correlation. **p < .01; ns, not significant.
