

Abstract
The yeast DNA polymerase gamma, Mip1, is a useful tool to investigate the impact of orthologous human disease variants on mitochondrial DNA (mtDNA) replication. However, Mip1 is characterized by a C-terminal extension (CTE) that is not found on orthologous metazoan DNA polymerases, and the CTE is required for robust enzymatic activity. Two MIP1 alleles exist in standard yeast strains, encoding Mip1[S] or Mip1[Σ]. Mip1[S] is associated with reduced mtDNA stability and increased error rates in vivo. Although the Mip1[S] allele was initially identified in S288c, the Mip1[Σ] allele is widely present among available yeast genome sequences, suggesting it is the wild-type (WT) allele. We developed a novel non-radioactive polymerase gamma assay to assess Mip1 functioning at its intracellular location, the mitochondrial membrane. Membrane fractions were isolated from yeast cells expressing full-length or CTE truncation variants of Mip1[S] or a chimeric Mip1[S] isoform harboring the Mip1[Σ]-specific T661 residue (cMip1 T661). Relative incorporation of digoxigenin (DIG)-11-deoxyuridine monophosphate (DIG-dUMP) by cMip1 T661 was higher than that by Mip1[S]. A cMip1 T661variant lacking 175 C-terminal residues maintained WT levels of DIG-dUMP incorporation while the C-terminal variant lacking 205 residues displayed a significant decrease in incorporation. Newly synthesized DIG-labeled DNA decreased during later phases of reactions carried out at 37°C, suggesting temperature-sensitive destabilization of the polymerase domain and/or increased shuttling of the nascent DNA into the exonuclease domain. Comparative analysis of Mip1 enzyme functions using our novel assay has further demonstrated the importance of the CTE and T661 encoded by MIP1[Σ] in yeast mtDNA replication.
Keywords: mitochondrial DNA (mtDNA), Mip1 DNA polymerase gamma, Saccharomyces cerevisiae, S288c, sigma 1278b, digoxigenin
Graphical Abstract

We developed a digoxigenin (DIG)-dUMP incorporation assay to measure DNA synthesis by purified mitochondrial membrane fractions separately harboring various isoforms of the yeast Mip1 DNA polymerase gamma. We show that: 1) The cMip1 T661 chimeric version of Mip1 containing the Σ1278b T661 residue, has more robust DNA synthesis as compared to the S288c Mip1[S] version with the A661 residue, 2) A truncation of 205 C-terminal residues in either version of Mip1 causes a decrease in DIG-dUMP incorporation, and 3) After prolonged DNA synthesis at 37°C, each enzyme isoform loses the DIG-dUMP incorporation signal suggesting that DNA degradation results from a temperature-sensitive imbalance in the ratio of the Mip1 DNA polymerase to exonuclease activities.
Introduction
The Saccharomyces cerevisiae DNA polymerase gamma (mtDNA polymerase, Mip1) is an enzyme of interest due to its utility in assessing the impact of orthologous human disease-causing variants (see (Lodi et al., 2015) and references therein) and due to the presence of a C-terminal extension that is observed in many ascomycetous fungi (Young, Theriault, Li, & Court, 2006). In the pool of commonly used S. cerevisiae lab strains, two isoforms of Mip1 exist, Mip1[Σ] and Mip1[S]. Comparison of the MIP1[Σ] and MIP1[S] shows 26 single nucleotide variants between the two genes, 10 of which are non-synonymous changes. Of the 10 non-synonymous changes noted between these two isoforms (Supplementary Fig. 1), that encoding amino acid position 661, has a significant impact on mtDNA maintenance (Young & Court, 2008); (Baruffini, Lodi, Dallabona, & Foury, 2007). Furthermore, Mip1 T661 is well conserved among select Opisthokonta, and utilizing the PROVEAN prediction tool, T661A is expected to be deleterious to Mip1 function (Table 1). The remaining 9 variants are predicted to be neutral substitutions and are not well conserved. The Mip[S] isoform, found in the S288c strain and derivatives thereof, has an alanine at this position (A661) and is associated with increased loss and spontaneous mutation of mtDNA, particularly at increased temperatures. In contrast, in two strains that express the Σ1278b Mip1[Σ] (S150 and Sigma1278b), mtDNA stability is considerably higher than YPH499 and S288c strains expressing the Mip1[S] variant (Young & Court, 2008); (Baruffini et al., 2007). Site-specific mutagenesis of MIP1[S], revealed that the replacement of alanine with threonine at position 661 was sufficient to generate a Mip1[S] isoform with biological properties similar to that of Mip1[Σ] (Baruffini et al., 2007).
Table 1.
Mip1[S] and [Σ] harbor 10 non-synonymous amino acid substitutions. The S288c Mip1 T661A substitution is predicted to have deleterious functional effect.
| S288c varianta | PROVEAN Scoreb | PROVEAN Prediction (cutoff = −4.1) | Praline Consistency Score (Opisthokonta)c | S288c residue present in other Opisthokontad |
|---|---|---|---|---|
| F8S (MTS) | 0.759 | Neutral | 4 | Y (7) |
| A35T (MTS) | 0.418 | Neutral | 3 | N |
| V222I | 0.527 | Neutral | 7 | Y (3) |
| K357E | −3.067 | Neutral | 5 | Y (2) |
| M540T | 0.613 | Neutral | 4 | Y (2) |
| N541H | −0.429 | Neutral | 3 | Y (1) |
| N616S | −0.567 | Neutral | 5 | N |
| T661A | −4.925 | Deleterious | 9 | N |
| P978S | −0.538 | Neutral | 5 | N |
| S986N | −0.15 | Neutral | 0 | N |
Residues localizing to the MitoProt II v1.101 predicted mitochondrial targeting sequence are listed with MTS in brackets (Claros & Vincens, 1996). The six S288c residues replaced in cMip1 T661 are highlighted in bold text.
Functional effects of S288c variants were predicted using the Sigma1278b Mip1 amino acid sequence as the query sequence in the online Protein Variation Effect Analyzer (PROVEAN) v1.1 tool. The ten amino acid variations listed in the left column of the table were entered into the PROVEAN tool (Step 2). Clustering of BLAST hits is performed and the top 30 clusters of related sequences form a supporting sequence set used to generate the prediction. A score is calculated for each supporting sequence and the final score is computed from averages of scores within and across clusters. A stringent threshold value of −4.1 was used to estimate deleterious variants with high confidence. One of two binary classifications is reported, deleterious, or neutral (Choi, Sims, Murphy, Miller, & Chan, 2012). See http://provean.jcvi.org/about.php#about_1c.
Seventeen Opisthokonta from the NCBI HomoloGene database were used to generate an alignment in PRALINE (see Supplementary Figure 2) (Simossis & Heringa, 2003), and conservation/consistency scores are presented. ‘Consistency’ refers to how consistently an amino acid is found at a given position in the final multiple alignment and in pre-processed alignment blocks (Heringa, 1999). In the 10-point consistency scale, 0 indicates the least conserved alignment position, while 10 indicates the most conserved positions.
S288c residue present in alignment sequences of select Opisthokonta, yes (Y) or no (N). The number of protein sequences in the alignment harboring the S288c residue are listed in brackets. The alignment and sequences used in this analysis are shown in Supplementary Fig. 2.
Carboxyl-terminal extensions (CTEs) on fungal mtDNA polymerases were first noted in Saccharomyces (Hu, Vanderstraeten, & Foury, 1995) and Neurospora (Ko T, Bertrand H, Michigan State University, personal communication) and are of variable lengths on enzymes from ascomycetous fungi, including yeast-like fungi, pyrenomycetes, and plectomycetes (Young et al., 2006). The terminal 216 residues of the CTE of both the Mip1[Σ] and Mip1[S] isoforms have been demonstrated to be essential for respiratory growth in vivo (Young et al., 2006); (Trasvina-Arenas et al., 2019) and are required for robust activity of the recombinant Mip1[S] enzyme purified from E. coli (Viikov, Jasnovidova, Tamm, & Sedman, 2012). In vivo expression of the Mip1 variant lacking the 216 C-terminal residues (Mip1[Σ]Δ216) causes an increase in mtDNA mutations, a decrease in mtDNA copy number during respiratory growth, and a complete failure to maintain mtDNA during non-selective, fermentative growth, summarized in Fig. 1A (and see (Young et al., 2006)). In vitro, the ratio of Mip1[S]Δ216 polymerase/exonuclease and strand displacement activities are decreased, possibly due to decreased protein stability in the absence of this critical part of the enzyme as proposed in (Young, 2008; Young et al., 2006), and demonstrated by (Viikov et al., 2012). In contrast, cells expressing a polymerase lacking 175 C-terminal residues (Mip1[Σ]Δ175) maintain wild-type (WT) levels of respiratory competence, mtDNA, and mtDNA point mutations in vivo (Young et al., 2006). In vitro, Mip1[S]Δ175 is indistinguishable from WT Mip1 with respect to DNA polymerase specific activity, the balance between DNA polymerase and 3’–5’ exonuclease, and strand displacement activity, although it is more processive than the WT enzyme (Viikov et al., 2012).
Figure 1.

A. Summary of in vitro and in vivo data pertaining to Mip1 truncation variants. The positions of the truncations are indicated by arrows on the horizontal line; variants are named according to the number of residues removed from the CTE. Above and below each arrow, in vivo and in vitro data are indicated by WT (wild-type), ↑ for increases, ↓ for decreases, and nd for no detectable activity. For data regarding petite formation, the thick upward arrow indicates that over 95% of cells were petite; for other variants between 30 and 40% of cells were petite. Pol, mtDNA polymerase activity; Exo, 3’–5’ DNA exonuclease activity as measured on dsDNA primer-templates in the absence of dNTPs; Exo/Pol, exonuclease to polymerase activity ratio on dsDNA in the presence of dNTP; bold upward-facing arrows indicate detectable exonuclease activity without detectable polymerase activity. Citations are indicated by V from (Viikov et al., 2012), T from (Trasvina-Arenas et al., 2019), Y from (Young et al., 2006), and C, from the current study; ErR, erythromycin-resistance; Aff., affinity for template DNA; Proc., processivity; St.Dis., strand displacement. B. CLUSTALW (http://align.genome.jp/) alignment of the C-termini of Mip1 sequences of S150 (MIP1[Σ]) and YPH499 (MIP1[S]) laboratory strains (see (Young & Court, 2008) for details). The C-terminal polymerase (Pol III) motif (white box) is as defined by (Ito & Braithwaite, 1990) and DNA polymerase γ-specific sequences (γ5 and γ6, black lines under both sequences) are as defined by (Luo & Kaguni, 2005) (and personal communication from Laurie S. Kaguni, Michigan State University). Within the carboxyl-terminal extension (CTE, carboxyl-terminal 279 amino acid residues) black bars between the two sequences are predicted α-helical regions (Young et al., 2006). Various truncations are represented as Mip1 and the number of carboxyl-terminal amino acid residues deleted from the CTE. Residues 1033 to 1038 are emphasized by gray bold font. In cMip1 T661, the residues at the polymorphic sites are highlighted as white letters on a black background. The complete alignment can be found in Supplementary Fig. 1.
In the present study, we: 1) developed a non-radioactive assay to compare net polymerase activity in yeast mitochondrial membrane fractions containing Mip1 or variants thereof, 2) investigated the net polymerase activities of Mip1[S] and a chimeric Mip1[S] isoform harboring the Mip1[Σ] specific T661 residue (cMip1 T661) and 3) attempted to refine the essential portion of the CTE that resides between the truncations in the functional cMip1 T661-Δ175 and non-functional cMip1 T661-Δ279.
Materials and Methods
General methods
General molecular biological procedures were carried out according to (Sambrook & Russell, 2001) and yeast transformations were carried out according to (Gietz & Woods, 2002).
E. coli cells were grown in LB media with ampicillin (100 μg/ml). Yeast were grown on various media including: YP (1% yeast extract, 2% peptone with various carbon sources: YPG (3% glycerol); YPGal (2% galactose); YP2D or YP10D (2% or 10% dextrose) and various synthetic complete media, 0.67% Difco™ nitrogen base pH 5.6 without amino acids, 4% dextrose (SC) or 2% raffinose (SRaff), and all amino acids except ones needed for selection; amino acid concentrations were as described by (Sherman, 1991).
Yeast methods
Yeast genomic DNA was isolated according to (Philippsen, Stotz, & Scherf, 1991) from 2.8 ml of a culture grown for 19–20 hours in YP10D at 30°C. Plasmids were constructed using homologous recombination in yeast (Colot et al., 2006) and electroporated into yeast using the “Sc2” program with a BioRad Micropulser. After four days of incubation at 30°C, DNA was collected from the colonies on the plate by a “smash-and-grab” crude DNA preparation as described in (Hoppins, 2005). This DNA was used to transform DH5α E. coli.
Strain and plasmid construction
Primers used to construct and confirm strains and plasmids, and plasmids used are listed in Supplementary Tables 1 and 2. pBG1805::MIP1 was purchased from Horizon Discovery Ltd. (Dharmacon Inc., Lafayette, CO), and the ORF was confirmed by sequencing. pBG1805::MIP1 encodes Mip1[S] fused in-frame at the C-terminal end with the triple affinity tag, His6-HAepitope-3Cprotease site-ZZproteinA (Gelperin et al., 2005). pBG1805::MIP1 was engineered based on conceptual translation starting at an upstream methionine to yield a 1280-amino acid preprotein. However, S1 nuclease mapping of the 5’-termini of MIP1 transcripts showed that transcription initiates after the first putative translational start codon of the ORF and thus translation begins at an in-frame ATG, resulting in a 1254-residue protein (Foury, 1989). Therefore, 78 bp of the 5’-region, including the first ATG, were removed using recombination between SphI-linearized pBG1805::MIP1 and annealed and extended integrative recombinant oligonucleotides (IROs) NtermMIPFixUS and NtermMIPFixDS, Supplementary Table 1. The URA3 marker in the resulting plasmid, pNTBG1805::MIP1, was replaced by the LEU2 marker using recombination between StuI–cleaved pNTBG1805::MIP1 and a PCR–amplified LEU2 gene from YEp13 (Broach, Strathern, & Hicks, 1979). Recombination was carried out in S150Δmip1, which was generated by replacing the MIP1 ORF with a cassette composed of the TRP1 marker gene, and a gene for the mitochondrial-targeted dsRED fluorescent protein obtained from Dr. J. Nunnari (University of California, Davis), via PCR-mediated gene disruption. The resulting pNTBG1805::MIP1+LEU plasmid construct was confirmed by DNA sequencing and used to construct genes encoding Mip1 variants.
Variant MIP1 genes were created using a modification of the delitto perfetto method (Storici & Resnick, 2006). All of the MIP1 plasmid variants encoding various truncation mutants were initially constructed using the pNTBG1805::MIP1-ADH1Term+Leu (pMIP1[S]) plasmid, which harbors the MIP1 gene cloned from BY4700 (Gelperin et al., 2005), an S288c-related strain (MIP1[S], (Baruffini et al., 2007)). Plasmids encoding the cMip1 T661 polymerase domain were also constructed (see below).
Construction of pMIP1[S]
To create pMIP1[S] from pNTBG1805::MIP1+LEU, a stop codon, and an ADH1 terminator (PCR amplified from pKT128, (Sheff & Thorn, 2004)) were added after the coding sequence of the in-frame His6-HAepitope sequence. The ADH1_For/ADH1_Rev PCR product was used to introduce the stop codon and ADH1 terminator. Removal of the 3’-end of the ORF encoding 3Cprotease site-ZZproteinA and the addition of the stop codon and the ADH1 terminator was carried out in a single step. pNTBG1805::MIP1+LEU was linearized with AscI (located adjacent to the ZZproteinA coding region) and co-precipitated with the ADH1-terminator PCR product flanked with sequence homology to the 3’-end of the ORF and the vector sequence downstream of the region to be removed. This mixture was electroporated into S150 mip1Δ. The correct recombination at the 3’-end of the MIP1 gene was confirmed by sequencing. The final plasmid, pMIP1[S], encodes the S288c derived MIP1[S] gene fused in-frame to the sequence encoding NPAFLYKVVD VSRHHHHHHG RIFYPYDVPD YA. pMIP1[S] was used for subsequent in vitro analyses as well as to construct all other S288c-MIP1-truncation plasmids and the cMip1 T661 plasmid (see below).
pMIP1[S]Δ175, pMIP1[S]Δ205, pMIP1[S]Δ216, pMIP1[S]Δ222, and pMIP1[S]Δ279
Plasmids were named by their characteristic deletion in and structure of the MIP1 gene i.e. pMIP1[S]Δ205 encodes the Mip1 from S288c (Mip1[S]) with a carboxyl-terminal deletion (Δ) of 205 amino acids. All plasmid variants were constructed similarly. pMIP[S] was cut with PstI (located in the coding region of the CTE, see Supplementary Fig. 1) and IROs engineered for the coding sequence in MIP1Δ205, MIP1Δ216, MIP1Δ222, and MIP1Δ279 (Supplementary Table 1) were annealed, extended, mixed with vector, precipitated, and electroporated into yeast. The resulting plasmids were collected from yeast and electroporated into E. coli to produce DNA for further analysis. All constructs were confirmed by AscI/SphI digestion and sequencing.
pMIP1[S]Δ175 was generated by cutting pMIPS28 that had been passed through the dam− E. coli strain GM2163, with BclI, which is blocked by dam methylation by DH5α. The BclI site is located downstream of the PstI site in the MIP1 CTE coding region.
pcMIP1 T661, pcMIP1 T661-Δ175, pcMIP1 T661-Δ205, pcMIP1 T661-Δ216, pcMIP1 T661-Δ222, and pcMIP1 T661-Δ279
Based on the recently published Mip1 structural homology model, here we define the 1254 amino acid residue Mip1 polymerase domain to encompass residue Y393 (of the γ1 conserved signature sequence) to D990, (Trasvina-Arenas et al., 2019). pcMIP1 T661 containing the MIP1[Σ] polymerase domain sequence (Baruffini et al., 2007) (see Supplementary Fig. 1) was constructed by cutting pMIP1[S] with AvrII and PstI to remove a 1539-bp fragment, followed by recombination in S150 mip1Δ with the corresponding PCR product generated from S150 (MIP1[Σ]) genomic DNA. Recombination using the AvrII/PstI cut plasmid backbone and the MIP4_F_PolyFix/RevPolyFix PCR product exchanged the Mip1 [S] DNA polymerase domain variants with the [Σ] variants, all encoding the replacements T540M, H541N, S616N, A661T, S978P, and N986S. The entire MIP1 gene in pcMIP1 T661 was confirmed by Sanger sequencing. Plasmids encoding cMip1 T661 polymerase domain truncation variants were created and confirmed exactly as their S288c-counterparts described above.
cMIP1 T661 single amino acid residue replacements
Fragments of cMIP1 T661 containing glycine replacement codons for residues 1033 to 1037 were created by overlap extension PCR, using primers in Supplementary Table 1. The resulting 256-bp fragments were co-transformed into S150Δmip1 with PstI-linearized and dephosphorylated pcMIP1 T661 via electroporation to allow homologous recombination. Cells containing recombinant plasmids were selected on plates lacking leucine and tryptophan; candidate plasmids were isolated, transformed into E. coli, and confirmed by sequencing as described for the truncation variants.
Induction of recombinant Mip1[S] and cMIP1 T661 and CTE variants
WT S150 was chosen over S150 mip1Δ as the background strain for expression of all Mip1 variants as it gave the best expression and mitochondrial membrane protein fractions isolated from untransformed S150 cells gave minimal background polymerase activity (Supplementary Fig. 3). S150 was separately electroporated with each of the plasmids encoding Mip1[S], cMip1 T661 and the truncation variants described above. Transformants were selected on SC-LEU plates after three or four days’ growth at 30°C, collected in SC-LEU, mixed with glycerol to a final concentration of 20%, and stored at −60°C.
Induction of transcription of the plasmid-borne MIP1-genes from the GAL1 promoter was carried out according to (Gelperin et al., 2005) with the following modifications. One aliquot of cells from −60°C was used to inoculate 50 ml of SC-LEU and allowed to grow approximately 14 hrs at 30°C with shaking. Approximately 50 OD600nm of cells was centrifuged at 4,300 × g at room temperature for 10 minutes, followed by resuspension of the pellet in 50 ml SRaff-LEU. These cells were grown for nine hours at 30°C and then subcultured into 500 ml SRaff-LEU to give an OD600nm/ml of 0.1. The cultures were grown for another twelve hours to an OD600nm/ml of 1 to 2. Induction of recombinant polymerase was initiated by adding 250 ml of 3x YPGal in the morning and allowing cultures to grow an additional five hours. After induction, the culture was centrifuged at 5850 × g for 10 minutes at 4°C and the supernatant was decanted. The cells were resuspended in 2 ml of 50 mM Tris-Cl, pH 8.0, 30% glycerol (TG), and then aliquoted to microfuge tubes on ice. Cells were centrifuged for 2 minutes at 2,800 × g in a Sorvall® pico microfuge, the supernatant was removed and the wet weight of cells in each tube was determined. 0.5 ml of TG was added to each pellet and mixed, followed by a 10-sec vortex. Cells in 0.5 ml TG were immediately frozen down at −60°C for preparing mitochondrial membrane fractions.
Isolation of mitochondrial membrane fractions
Procedures for isolation of mitochondria and mitochondrial membrane proteins were derived from those of (Mueller et al., 2004) and (Lewandowska, Gierszewska, Marszalek, & Liberek, 2006). 1 to 2 g wet weight of induced frozen cell pellets were thawed at room temperature; all subsequent steps were carried out at 4°C or on ice. Cells were collected by centrifugation at 2,800 × g in a Sorvall® pico microfuge for 2 minutes and then were resuspended in one volume of cold yeast breaking buffer (YBB, 0.65 M sorbitol, 0.1 M Tris-Cl, 5 mM EDTA, 0.2% BSA, pH 8.0, 1 mM PMSF) and pooled in a 15 ml conical tube. Two volumes of YBB were added and samples were vortexed for 5 seconds. Next, three volumes of glass beads (0.45 – 0.53 mm) were added and the tube was vortexed for 1 minute followed by a 1-minute incubation on ice. This step was repeated five additional times. Samples were centrifuged at 2,400 × g for 5 minutes in a ThermoFisher Legend X1R centrifuge to remove cell debris and the supernatant was transferred to microfuge tubes and kept on ice (Sup 1). The cell pellet was extracted a second time by resuspending it in 2.2 volumes of fresh YBB and vortexing for 1 minute followed by incubation on ice for 1 minute. Vortexing was repeated twice more followed by centrifugation at 2,400 × g for 6 minutes. The supernatant was transferred into fresh microfuge tubes and kept on ice (Sup 2). Microfuge tubes containing Sup 1 and Sup 2 were then spun at 11,000 × g for 8 min to collect mitochondria-containing pellets. The supernatant obtained from the Sup 2-tubes was discarded, while the more concentrated supernatant from the Sup 1-tubes was aliquoted to new microfuge tubes (Sup 3), centrifuged, and mitochondria-enriched pellets were collected. Each of the pellets was washed with 500 μl SEM (250 mM sucrose, 1 mM EDTA, 10 mM MOPS, pH 7.5) followed by centrifugation at 1000 × g for 4 minutes. The resulting supernatant was transferred to fresh microfuge tubes and spun at 11,000 × g for 8 min to collect mitochondria. For every 1.2 g of wet weight cells, mitochondria were resuspended in 0.6 ml of hypotonic lysis buffer (20 mM MOPS, pH 8.5, 3 mM β-mercaptoethanol, 1 mM PMSF, 1 μg/ml leupeptin) and the final concentration was typically 3.9 – 4.3 mg mitochondrial protein per 0.6 ml hypotonic lysis buffer. A 20-μl aliquot of mitochondria was mixed with an equal volume of 2x SDS-PAGE sample buffer (0.0625 M Tris-Cl, pH 6.8, 10% glycerol, 2% SDS, 5% β-mercaptoethanol, and 0.05% bromophenol blue) for determining the release of mitochondrial matrix proteins (see below) and a 3-μl aliquot was frozen at −20°C for determining the protein concentration via a Bradford assay (Sigma-Aldrich, St. Louis, MO).
The remaining mitochondria were subjected to homogenization with a 27 ½ G needle through eleven cycles of drawing up and expelling the sample. The material was vortexed for 30 seconds followed by incubation on ice for 30 seconds and then vortexed and incubated on ice again. One-tenth of the volume of 20 mM MOPS, pH 8.5, 4 M NaCl, 3 mM β-mercaptoethanol, 1 mM PMSF, and 1 μg/ml leupeptin was added to the homogenized mitochondria to bring the salt concentration to 0.4 M. The homogenization step was repeated through eleven more cycles of passage through the needle and vortexing and a final eleven cycles, without vortexing. 3 μl was taken for a Bradford assay, and a 50 μl aliquot was taken and centrifuged at 13,000 × g for 15 min to obtain a supernatant and a pellet fraction to measure the release of mitochondrial matrix proteins (see below). The supernatant was mixed with an equal volume of 2x SDS-PAGE sample buffer and an equal volume of 2x SDS-PAGE sample buffer was added to the pellet. Both were heated at 95°C for 3 minutes and then stored at −60°C.
The remaining homogenized mitochondria were loaded onto a sucrose gradient (0.25 ml of 60%, 0.25 ml of 55%, and 2.25 ml of 18% (wt/wt) sucrose in 20 mM Tris-Cl pH 7.4, 0.5 mM EDTA, 5 mM β-mercaptoethanol) and centrifuged in a Beckman TLA 100.3 rotor at 150,000 × g for 1 hour at 4°C. 75 μl fractions containing mitochondrial membrane proteins from the interface between 55% and 60% sucrose were collected (Lewandowska et al., 2006). For each fraction 3 μl and 12 μl aliquots were taken for Bradford assay and SDS-PAGE respectively. The remaining ~60 μl was mixed with 50 μl sterile glycerol and 11 μl aliquots were frozen at −60°C.
Western blotting
12 % SDS-PAGE gels were transferred to nitrocellulose membranes and the membranes were stained with Ponceau S (0.2% Ponceau S in 3.15% TCA) and cut into appropriate parts for probing. The section of the blot containing C-terminally HA-tagged Mip1 was incubated with a 1:1000 dilution of Anti-HA Tag mouse monoclonal antibody (Applied Biological Material Inc., Richmond, BC) and the lower parts with a 1:1000 dilution of anti-Tim17 rabbit polyclonal antibody (a gift from Dr. K. Hell, University of Munich) or a 1:1000 dilution of anti-Put2 rabbit polyclonal antibody (a gift from Dr. D. Pain, New Jersey Medical School, Newark, NJ). Secondary antibodies were anti-mouse IgG (whole molecule)–alkaline phosphatase antibody produced in goat (Sigma-Aldrich) or goat anti-rabbit IgG (H + L) alkaline phosphatase conjugate (ZYMED, San Francisco, CA). Images were developed with CDP-Star™ (Roche Laval, Quebec) and detected using the Alpha Innotech FluorChem 8900 according to manufacturer’s procedures.
DNA polymerase activity measurement of mitochondrial membrane protein fractions using the incorporation of Digoxigenin-11-dUMP
Digoxigenin-11-2’-deoxy-uridine-5’- triphosphate, alkali-stable (DIG-11-dUTP) was purchased from Roche (Laval, Quebec). The 10x nucleotide mixture contained 1 mM each of dATP, dGTP, dCTP, 0.9125 mM dTTP, 0.0875 mM DIG-11-dUTP in 10 mM Tris-Cl pH 7.5. An approximately 4-kb plasmid (pBluescript::MIP1-F3, (Young et al., 2006) was linearized with EcoRI and denatured by boiling for 10 minutes (template). Polymerase reactions were set up in 10 μl volumes as follows: 7 μg of mitochondrial membrane protein fraction, 675 ng of linearized, denatured template, 1 μl 10x hexanucleotide mix (Roche), 1 μl 10x nucleotide mix, 0.5 μl 1 mg/ml aphidicolin in 10% DMSO. The 10x hexanucleotide mix contained 0.5 M Tris-Cl, 0.1 M MgCl2, 1 mM dithioerythritol (DTE), 2 mg/ml BSA, hexanucleotides, 62.5 A260 units/ml, pH 7.2. At 5, 10, 15, and 30 minutes, 2 μl aliquots of each polymerase reaction were mixed with 6 μl 24.25 mM EDTA/10 mM Tris pH 8.0 to stop DNA polymerase activity, and samples were stored at −20°C. For each time point of the experiment, l μl samples were spotted in triplicate onto Hybond-N nylon (Fisher Scientific) and the dot blot was UV-crosslinked for 3 minutes. Following crosslinking the blot was equilibrated in a malic acid buffer (0.1 M malic acid, 0.15 M NaCl, pH 7.5) for 2 minutes and then incubated in a blocking buffer (malic acid buffer/1x blocking reagent, Roche) with 0.015% SDS with shaking for 30 minutes. Anti-Digoxigenin-AP conjugate (Roche) was then added to the dot blot in blocking buffer/0.015% SDS at a 1:10,000 dilution and it was incubated with shaking for 1 hour. The blot was rinsed three times with distilled H2O and twice for 15 minutes each with malic acid buffer/0.3% Tween 20/0.015% SDS with shaking. Finally, the blot was equilibrated for 2 minutes in detection buffer (0.1 M Tris-Cl, 0.1 M NaCl, pH 9.5) and then 1 ml of a 1 in 100 dilution of CDP-Star™, in detection buffer, was rinsed over the blot. Quantitation and detection were carried out using the Alpha Innotech FluorChem 8900 according to the manufacturer’s procedures. See Supplementary Fig. 3 for images.
Results
Enrichment of Mip1[S] and cMip1 T661 isoforms with mitochondrial membranes
Meeusen and Nunnari proposed a two membrane-spanning (TMS), autonomous mtDNA replisome comprised of 1) the Rad52-related protein Mgm101, a component of the mitochondrial nucleoid essential for mtDNA maintenance and possibly required for repair of oxidative mtDNA damage; 2) Mmm1, a trans-outer membrane protein required for mtDNA maintenance that has a role in mitochondrial morphology; 3) Mip1, as shown by colocalization with an Mmm1-dsRed fusion protein, and 4) replicating mtDNA (Meeusen & Nunnari, 2003). Therefore, the association of Mip1 with mitochondrial membranes and its functional activity were investigated in the current study. The S150 (MIP1[Σ]) laboratory strain was employed for polymerase expression, as it allowed over-expression of Mip1 (Supplementary Fig. 4), and mitochondrial membrane protein fractions isolated from untransformed cells gave minimal background polymerase activity (Supplementary Fig. 3). Mitochondria from S150 cells over-expressing either recombinant HA-tagged Mip1[S] or cMip1 T661 were isolated, homogenized in a hypotonic buffer to disrupt the organelles, and the resulting membrane fractions were enriched via sucrose gradients. Mip1, and the inner membrane-anchored Tim17, were present in the insoluble material after hypotonic lysis, and in the enriched membrane fraction (Fig. 2). In contrast, the matrix protein Put2 was found in both pellet and supernatant fractions (S), suggesting incomplete lysis of mitochondria. Put2 was detected to a lesser degree in the membrane-enriched fractions. The membrane-enriched preparations containing Mip1 were used to develop a non-radioactive DNA polymerase assay.
Figure 2.
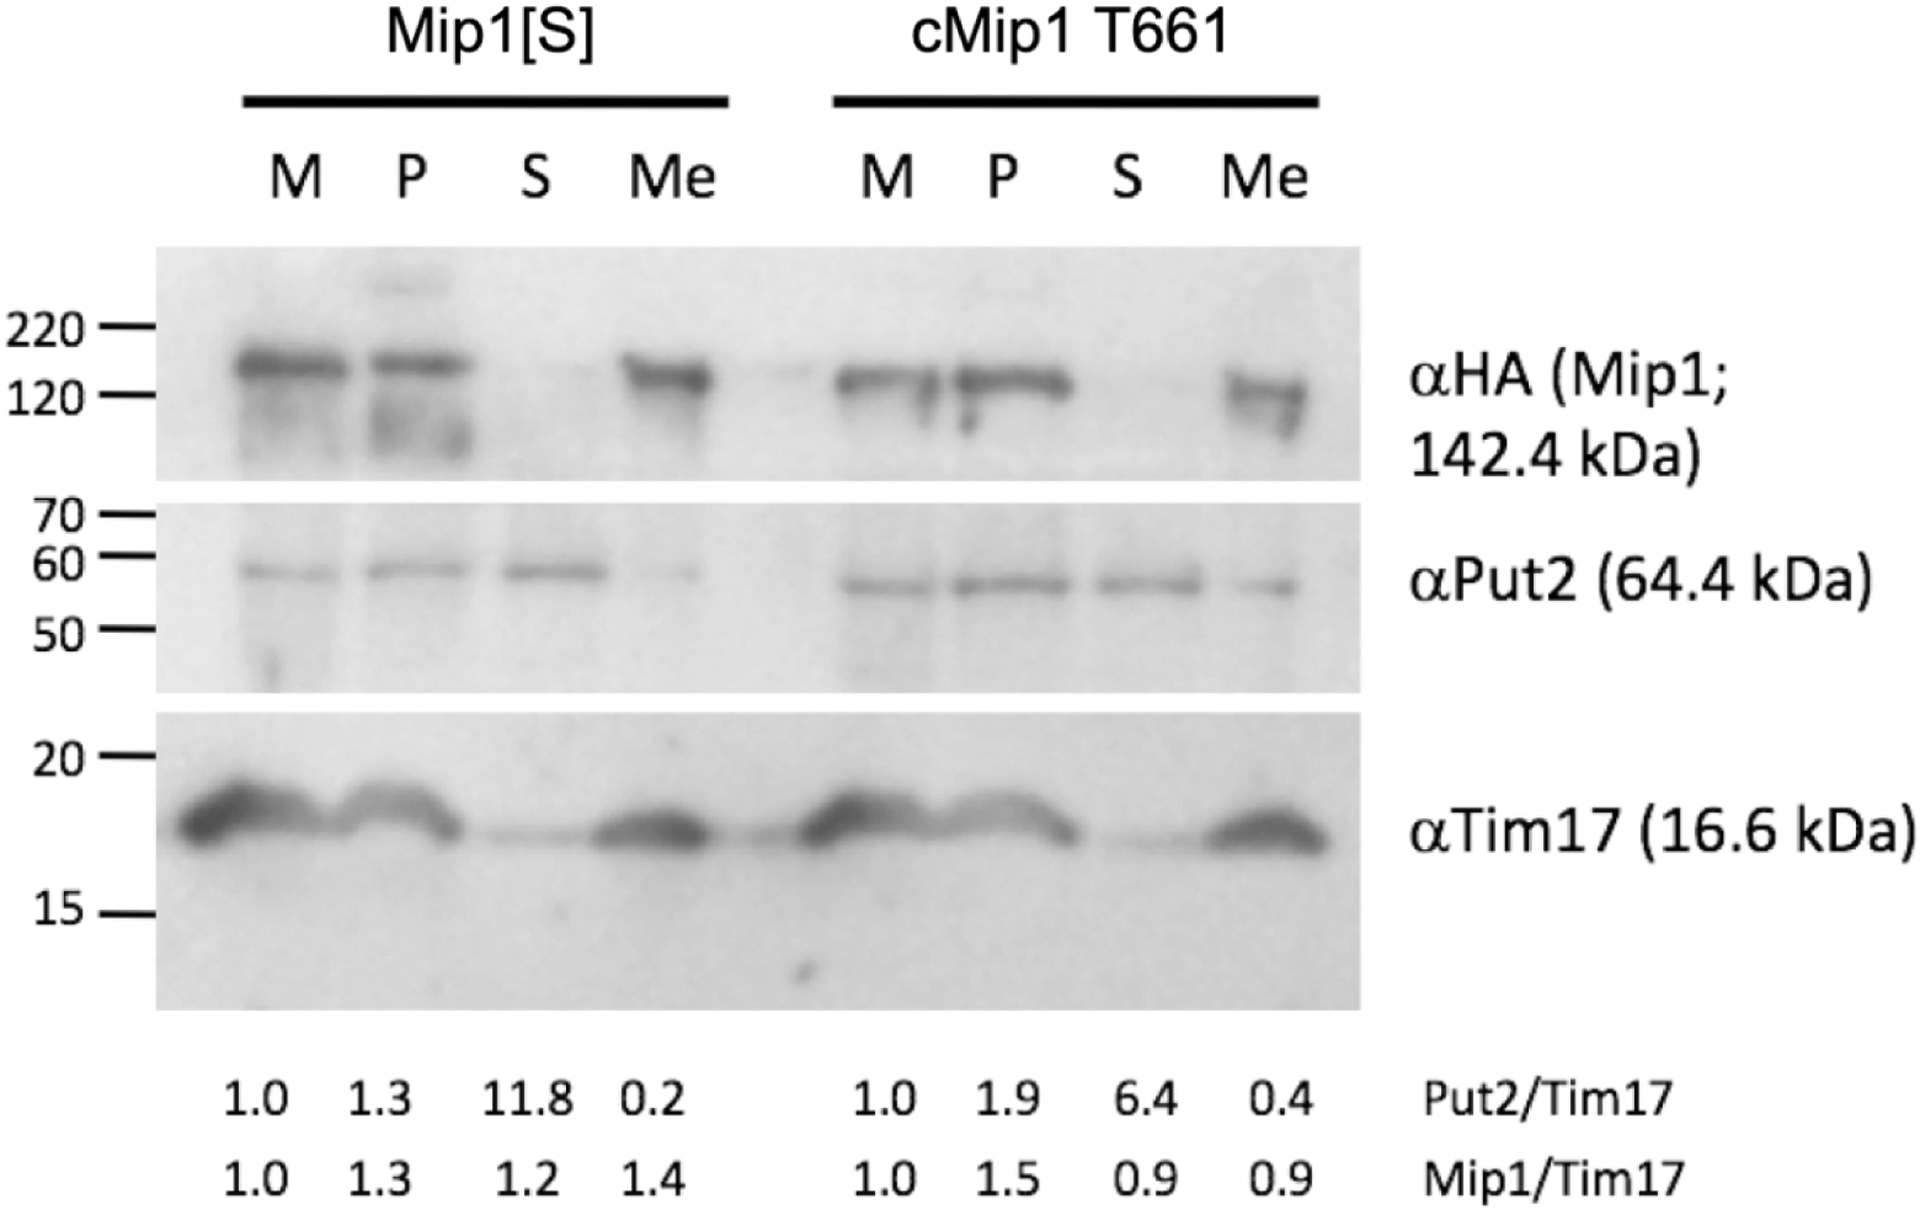
Submitochondrial fractionation and localization of Mip1. Mitochondria resuspended in hypotonic lysis buffer before homogenization and centrifugation (M); corresponding amounts of mitochondrial pellet obtained after homogenization and centrifugation (P); supernatant after homogenization and centrifugation (S); and mitochondrial membrane fractions (Me) isolated via sucrose gradient centrifugation were run on a 12% SDS-PAGE gel, transferred to nitrocellulose and subjected to immunodetection with: 1) anti-HA mouse monoclonal antibody to detect the HA-tagged Mip1[S] and cMip1 T661 variants (top of blot); antibodies against the mitochondrial matrix protein Put2 (middle panel) and the mitochondrial inner membrane protein Tim17 (lower panel). Molecular weight markers on the left-hand side are indicated in kDa. The ratio of Put2 to Tim17 (Put/Tim) and Mip1 to Tim17 (Mip/Tim) are presented below the blot. The amount of Put1 and Mip1 for each of Mip1[S] and cMip1 T661 in the M fraction was set to 1.
Expression and partial purification of Mip1 truncation variants
Mip1 variants lacking the terminal 175 (Mip1Δ175), 205 (Mip1Δ205), 216 (Mip1Δ216), 222, (Mip1Δ222), or 279 (Mip1Δ279) residues (Fig. 1B) were separately generated utilizing both the MIP1[S] and the cMIP1 T661 polymerase domain recombinant alleles. Mip1 expression was confirmed by western blot analysis of mitochondrial membrane fractions obtained from S150 expressing each C-terminal HA epitope-tagged variant (Fig. 2, Supplementary Fig. 4). These fractions also contained high levels of Tim17, and residual Put2, leading to an estimated 3-fold enrichment of membranes. Most of the polymerase variants underwent very little N-terminal degradation as indicated by the absence of species migrating faster than that of the full-length mtDNA polymerase.
A non-radioactive assay for mtDNA polymerase
DNA polymerase assays utilizing radioactive nucleotides have been used for determining Mip1 activity from intact mitochondria and mitochondrial extracts (Genga, Bianchi, & Foury, 1986) and Mip1 expressed in E. coli (Viikov et al., 2012). To avoid the use of radioactivity, an assay was developed that is based on the Roche Digoxigenin (DIG) DNA Labeling Kit (Laval, Quebec). Isolated mitochondrial membrane fractions were combined with DIG-11-dUTP nucleotide mix, linear template DNA, reaction buffer plus hexanucleotide primers, and aphidicolin, an inhibitor of nuclear DNA polymerases (Pol1, Pol2, Pol3, and Pol5; (Budd, Sitney, & Campbell, 1989); (Shimizu et al., 2002)). Following the polymerase reactions, samples were spotted in triplicate on nitrocellulose membranes and DIG-labeled DNA was detected with anti-DIG antibody and CDP-Star™ substrate. A minimal amount of background DNA synthesis was obtained with control mitochondrial membrane protein fractions isolated from the untransformed expression strain S150 (Supplementary Fig. 3) and the signal at each time point was therefore subtracted as background from the corresponding time points of experiments using membrane fractions containing overexpressed polymerases. As discussed below, reactions were run for 30 minutes, but the signal obtained after 5 minutes was used to compare the activity of the Mip1 polymerase fractions, as processive DNA synthesis was maintained for this time in the in vitro experiments described by (Viikov et al., 2012).
The non-radioactive DNA polymerase assay was used to explore three questions: i) Are differences observed between the cMip1 T661 and Mip1[S] in terms of mtDNA stability (Baruffini et al., 2007) reflected in terms of polymerase activity? ii) What are the relative activities of the truncation and single amino acid residue replacement variants? iii) Do the data obtained from the membrane-associated variant enzymes support data demonstrating different ratios of polymerase and exonuclease activities?
Relative activities of cMip1 T661 and Mip1[S]
Common laboratory strains of S. cerevisiae harbor either the MIP1[Σ] or MIP1[S] alleles of the MIP1 gene (Baruffini et al., 2007); (Young & Court, 2008). Compared to MIP1[Σ], the MIP1[S] allele is associated with increased mutation rates, as measured by the acquisition of resistance to erythromycin (Young & Court, 2008) (Baruffini et al., 2007), and with increased petite and ρ° formation at both 28°C and 37°C (Baruffini et al., 2007), both of which are indicative of defective mtDNA replication. The incorporation of DIG-11-deoxyuridine monophosphate (DIG-dUMP) by fractions containing each Mip1 polymerase was examined with the non-radioactive assay. For Mip1[S]-containing membranes, at 30°C and 37°C, the initial rate of accumulation of DIG-labeled nucleotide was indeed 30% – 50% of that of the cMip1 T661 samples (Fig. 3A), as might be expected for an enzyme associated with defective mtDNA replication (Baruffini et al., 2007) (Young & Court, 2008). Synthesis by cMip1 T661 reached a plateau within a 30-minute reaction at 30°C but that by Mip1[S] did not (Fig. 4A; Supplementary Fig. 6A and C).
Figure 3.

Incorporation of DIG-dUMP by Mip1-containing membranes. A. Assays of full-length polymerases and truncation variants and B. variants with amino acid residue replacements were carried out for 5 minutes as described in Materials and Methods, at the indicated temperatures. Chemiluminescence signals obtained from three replicate spots of each were quantitated with an Alpha Innotech FluorChem 8900. The background DNA synthesis contributed by the endogenous Mip1 was estimated in DNA polymerase assays utilizing a mitochondrial membrane fraction derived from a culture of untransformed S150 cells (Supplementary Fig. 3). To estimate the amount of DNA synthesized by a recombinant Mip1-containing reaction, the background DNA synthesis signal at each time point was subtracted from that of the corresponding signal obtained with the experimental membranes. The amount of DNA synthesized by each membrane fraction was then normalized to the level of its respective recombinant Mip1 because different levels of polymerase expression were detected by Western blot analysis (see Supplementary Fig. 4). Data shown are averages of three or four biological replicates, with standard deviations, except for the N1033G, and R1034G data, from single replicates at (37°C) and L1035G, from one replicate at 30°C. Horizontal lines join the pairs of columns for which the averages are statistically different (Student’s t-test, p < 0.05).
Figure 4.

Average DIG-dUMP incorporation by cMip1 T661, Mip1[S], and Δ205 truncation variant-containing membrane fractions over a 30-minute timeline. Samples were taken at 5, 10, 15, and 30 minutes. Membrane fractions containing cMip1 T661 or Mip1[S] were examined at A. 30°C or B. 37°C. Also, cMip1 T661-Δ205 and Mip1[S]Δ205-containing membrane fractions were examined at C. 30°C and D. 37°C. In all panels, data from cMip1 T661, or its derivative cMip1 T661-Δ205, are shown as black circles, with black trendlines and error bars. Mip1[S] and Mip1[S]Δ205 data are shown as gray squares, with dashed trendlines and gray error bars. Fractions containing either cMip1 T661 or Mip1[S] or the corresponding variants were assayed in concurrent experiments, allowing comparison of the polymerase activities under the same conditions. At each time point, 2-μl aliquots were removed, reactions were stopped by mixing with 4-μl of 32.25 mM EDTA, and then three 1-μl aliquots of the mixture were spotted on to the membrane (technical replicates), probed with anti-DIG antibodies coupled to alkaline phosphatase, and detected with CDP-Star (see Supplementary Fig. 3). First, the background chemiluminescent signal from the blot was subtracted from all data points followed by subtraction of the negative control untransformed cell mitochondrial membrane fraction signals at the same time point for each DNA synthesis reaction. Second, averages were calculated for each triplicate technical replicate. For each experiment, the maximum signal from the cMip1 T661 fraction at 30°C was set to 100%; this was the 30-minute time point. The signals from the other time points for all polymerase fraction reactions were scaled accordingly. Next, the scaled values from the three replicate assays were used to generate the average data presented here, in which the signals for Mip1[S] and the truncation variants at both temperatures, and cMip1 T661 at 37°C, are shown relative to the 100% cMip1 T661 signal at 30°C. Errors are standard deviations and asterisks indicate values that are significantly different from that at the same time for Mip1 T661 at 30°C (student’s t-test, p < 0.05).
Mip1 CTE truncation variants
To further refine the region of the CTE required for normal function a series of truncation variants were generated in both the cMip1 T661 (Mip1[Σ]-like) and Mip1[S] backgrounds; this group included Mip1[Σ] variants assessed in vivo (Mip1Δ279, Mip1Δ216, and Mip1Δ175), and two further variants, Mip1Δ222 and Mip1Δ205 (Fig. 1B). It was previously shown that Mip1[Σ]Δ216, but not Mip1[Σ]Δ175, is associated with the loss of mtDNA (Young et al., 2006). An alignment of CTEs from ten representatives of the Saccharomycetales revealed three potential alpha-helical regions within the amino-terminal 100 residues of the CTEs (Young et al., 2006), Fig. 1B). All three of these putative helices are absent from Mip1Δ279, which is associated with loss of mtDNA (Young et al., 2006) and polymerase activity when expressed from E. coli (Viikov et al., 2012). In the partially functional Mip1Δ216, only one predicted helix (α1) is maintained, and nearly two-thirds of the largest predicted helix (α2) is truncated (Fig. 1B). Mip1Δ222 maintains α1 but lacks both potential helices (α2 and α3) and respiratory-competent transformants expressing this variant were not obtained, suggesting that Mip1Δ222 is a non-functional DNA polymerase and that α2 and α3 are of functional importance. In contrast, cells expressing Mip1[Σ]Δ205, which retains helices α1 and α2, maintain WT levels of respiratory competence (96% after 4 days at 30°C) and low levels of point mutations in the mtDNA (4.5 erythromycin-resistant colonies per 108 cells plated). For comparison, WT values are 97 % respiratory competent and 2 erythromycin-resistant colonies per 108 cells (Young & Court, 2008).
The variant polymerases were over-expressed in WT S150 yeast (Supplementary Fig. 4). DNA synthesis was not detectable in fractions from yeast cultures expressing Mip1Δ279, Mip1Δ222, and Mip1Δ216 (Supplementary Fig. 3). In fact, the signals produced by these variants were less than those from samples of untransformed cells, suggesting a loss of DNA (see discussion). A lack of additional synthesis was expected for Mip1Δ279, and Mip1Δ222, which do not maintain mtDNA in vivo (Mip1[Σ]Δ279, (Young et al., 2006)). Furthermore, Mip1[S]Δ279 is inactive in vitro (Viikov et al., 2012). However, the result with cMip1 T661-Δ216 is unexpected, because this enzyme can support mtDNA maintenance under selective conditions (Young et al., 2006) and the purified Mip1[Σ]Δ216 enzyme has ~70% of the specific activity of the full-length enzyme on calf thymus DNA and is active on singly primed single-stranded DNA (Viikov et al., 2012). Given the undetectable signal from cMip1 T661-Δ216 fractions, it was expected that the cMip1 T661-Δ222–containing fractions would not show detectable activity; similarly, Mip1[S]Δ227 was demonstrated to be inactive in vitro (Trasvina-Arenas et al., 2019).
In the cMip1 T661 recombinant polymerase domain background, the rate of DIG-dUMP incorporation at 30°C for the variant harboring a deletion of 175 residues was similar to that of WT (Fig. 3A), in agreement with data obtained from isolated enzymes (Viikov et al., 2012) and as expected from the maintenance of mtDNA in vivo (Young et al., 2006). Both variants lacking the C-terminal 205 residues incorporated DIG-dUMP into DNA. In the cMip1 T661 background, there was a significant decrease in cMip1 T661-Δ205 compared to the full-length enzyme. The signal from Mip1[S] (A661) was low, and an apparent difference between the data obtained for the full-length and Mip1[S]Δ205 was observed, though it is not statistically significant, due to the relatively high standard deviation in samples with low net incorporation. An in vitro assay may provide a better resolution of the activity of these two enzymes. At 37°C, the incorporation by both Δ205 variants was very low and indistinguishable from that by the same enzyme at 30°C (Fig. 3A).
Cells harboring Mip1[Σ]Δ205 retain mtDNA and respiratory function, while those expressing Mip1[Σ]222 do not, indicating the importance of the N-terminal portion of α2 (residues 1033–1048; see Fig. 1B). The importance of Mip1 residues 1028–1038 has been demonstrated with Mip1[Σ]Δ216 and Mip1[S]Δ227 variants in vitro whereby the balance between polymerase and exonuclease activities is skewed in the Mip1[S]Δ227 variant, which synthesizes very little DNA in vitro (Viikov et al., 2012); (Trasvina-Arenas et al., 2019). Therefore, to assess the role of the residues in α2 that distinguish Mip1[Σ]Δ205 and Mip1[Σ]Δ222, mutations were made in the cMip1 T661 (Mip1[Σ]-like) gene to replace codons for residues 1033 to 1037 in this segment with that for glycine (Supplementary Fig. 5). The resulting proteins were over-expressed and membrane fractions were collected. In most cases, the DNA polymerase activity observed when these isoforms were overexpressed in yeast was similar to WT at both 30°C and 37°C (Fig. 3B), with a slight increase in activity for the E1036G variant. This replacement is predicted to increase the propensity of the region to fold into a β-strand, instead of an α-helix (see Supplementary Fig. 5), which may be responsible for the increased activity.
Insights into polymerase versus exonuclease activity.
As seen with Mip1 polymerase assays carried out in organello or with partially purified extracts (for example see (Genga et al., 1986)), the rate of nucleotide incorporation by Mip1-containing membrane fractions decreased with time at 30°C (Fig. 4A). This slower rate could reflect the consumption of substrate, limited strand displacement, or destabilization of the enzyme under assay conditions. Also, the ratio of the DNA polymerase to exonuclease activity may decrease, in response to differential instability of the polymerase and proofreading domains of the enzyme (Young, 2008), or in response to decreasing dNTP levels (Viikov et al., 2012). A change in the ratio of polymerase/exonuclease predicts an eventual reduction in DIG-dUMP labeled DNA. To pursue this question, the assays of cMip1 T661 and Mip1[S], and the corresponding truncation variants lacking the C-terminal 205 residues, were carried out for 30 minutes (Fig. 4), and the polymerase-containing fractions also were assayed at 37°C (Fig. 4B & D), which might enhance destabilization of the protein. For the full-length and truncated enzymes, there was a trend toward increased activity at 37°C during the first 5 minutes (see Fig. 3A); this trend was not observed for several of the variants with amino acid residue replacements (Fig. 3B). In most cases, for the full-length enzymes, the maximal signal was obtained in the first 5 or 10 minutes of the reaction at 37°C, and at 30°C, there was a slight increase in DNA synthesis from 15–30 minutes (compare A & B in Fig. 4 and A & B and C & D in Supplementary Fig. 6). In contrast, at 37°C, the average signal from cMip1 T661-and Mip1[S]-fractions decreased over the course of the experiment (Fig. 4B, Supplementary Fig. 6B & D). The most inter-assay variation was seen at the later time points for cMip1 T661 (15 and 30 minutes; Supplementary Fig. 6B), which may reflect differences in enzyme stability and the associated onset of misfolding events within each assay. Similar results were obtained with the Δ205 variants (Fig. 4C & D, Supplementary Fig. 7C & D). Together, the reduction in the DNA synthesis signal at 37°C supports the hypothesis of a decrease in the balance of the Mip1 polymerase activity to the 3’–5’ exonuclease activity over time, resulting in a net degradation of DNA.
Discussion
In yeast, mtDNA synthesis is associated with a membrane-bound complex (Meeusen et al., 1999) and thus our analysis of Mip1-containing membrane fractions complements detailed studies utilizing Mip1 expressed and purified from E. coli (Trasvina-Arenas et al., 2019); (Viikov et al., 2012). Here we demonstrated that the membrane-associated Mip1[S] polymerase domain isoform incorporates a lower net amount of DIG-dUMP than does cMip1 T661 at 30 and 37°C (Fig. 3A). This may reflect different synthetic rates and/or the processivity of the enzymes. Also, the ability for displacement synthesis could vary, as synthesis in the randomly primed assay used herein would lead to double-stranded regions of the template that could impede replication. Alternatively, exonuclease activity could be increased due to increased occupancy of the exonuclease domain by base-paired termini. Increased net exonuclease activity due to structural perturbations in the absence of the CTE could also explain the observation of reduced signal in samples containing polymerases with truncations of more than 216 amino acids.
One of several mutations in the mitochondrial 21S rRNA gene confers erythromycin-resistance (Sor & Fukuhara, 1982); (Vanderstraeten, Van den Brule, Hu, & Foury, 1998) and therefore, reflects the mtDNA mutation frequency. In vivo, at standard temperatures (28–30°C), Mip1[S] is associated with 2–6 times higher rates of erythromycin-resistance than those of Mip1[Σ], suggesting that proofreading is slightly impaired in the Mip1[S] variant (Young & Court, 2008); (Baruffini et al., 2007). However, these rates of point mutation are far lower than those observed in mutator Mip1 variants with changes in the exonuclease active site (200–4800 erythromycin-resistant colonies/108 cells, (Hu et al., 1995).
At 37°C, the initial rates of DIG-dUMP incorporation were higher than at 30°C, but the signal declined by the end of 30 minutes with Mip1[S] and on average with cMip1 T661, suggesting net degradation of newly synthesized DNA, likely by the proofreading domain of the enzyme. This domain has the capacity for DNA degradation, as shown for the mitochondrial DNA polymerase γ of mice, where the enzyme plays an important role in degrading linear DNA fragments (Nissanka, Bacman, Plastini, & Moraes, 2018). Furthermore, the exonuclease activity of the human mtDNA polymerase gamma (Polγ), located in the p140 catalytic subunit, works in concert with MGME1 to remove flap structures generated during mtDNA replication or to rapidly degrade linear mtDNA (Peeva et al., 2018). An increase in net degradation could be exacerbated by the destabilization of the polymerase domain of the enzyme with time at a higher temperature (Young, 2008). This would suggest that the higher frequency of petite and ρ° cells in strains expressing Mip1[S] in comparison to Mip1[Σ], particularly at 36°C (Baruffini et al., 2007), is due to insufficient completion of mtDNA replication or the introduction of deleterious mutations during each round of the cell cycle.
The amino acid residue at position 661 is the critical difference between Mip1[S](A661) and Mip1[Σ] (T661) concerning mtDNA maintenance in vivo (Baruffini et al., 2007). Based on alignments with and fold predictions based on the human DNA polymerase gamma (Fig. 5), this residue is located in the “palm” of the polymerase domain (Fig. 5A), in a spacer region that is characteristic of mitochondrial Family A polymerases, but is not present in phage (T7) or bacterial (E. coli DNA polymerase I) enzymes. In Polγ, the residue corresponding to Mip1 T661 (p140 T858) does not make direct contact with DNA and is not located in the active site (Sohl et al., 2015), Fig. 5B). However, as it resides in a domain predicted to have a low degree of secondary structure, it may be involved indirectly in ensuring appropriate interactions between the residues in the conserved polymerase domains and DNA. This could influence catalytic rate, or the relative occupancy of the polymerase domain by mispaired termini (see (Kaguni, 2004) for discussion), thereby altering the relative rates of exonuclease and polymerase activities. Notably, in the predicted structure of yeast mtDNA polymerase, the alanine residue at position 661 is close to Mip1 R607 (p140 R807), Fig. 5B, which is highly conserved and is associated with mitochondrial disease (Ferreira et al., 2011). In the crystal structure of the Polγ-DNA complex, the positively charged p140 R807 side chain is located 4.1 Å from the dsDNA and its main chain carbonyl group makes an intramolecular hydrogen bond with the p140 T858 (Mip1 T661) side chain hydroxyl group (Szymanski et al., 2015). We speculate that the positively charged p140 R807 (Mip1 R607) residue plays a key role in positioning DNA into the polymerase domain and that disruption of the Mip1 R607/T661 intramolecular H-bond by the yeast T661A mutation could alter DNA positioning at the polymerase domain and enhance shuttling to the exonuclease domain.
Figure 5.

Structural models of Mip1[S]. A. Structural model of Mip1[S]. The Mip1 primary sequence (P15801) was aligned with that of human DNA polymerase γ (PDB 3ikm, chain D) using Phyre2 (Kelley, Mezulis, Yates, Wass, & Sternberg, 2015). The structural prediction encompassed resides 40–987 of Mip1[S], with a confidence level of 100%. This Mip1 model subsequently was aligned in PyMOL with DNA polymerase γ with oligonucleotide primer and template (PDB 5c53, (Sohl et al., 2015)). The protein chains from PDB 5c53 were hidden from the alignment to show the estimated position of the DNA. The “palm” region is highlighted in red, the “thumb” in green, the “fingers” in blue, A661 in white, and R607 in yellow. Note that Mip1 R607 aligns with R807 of DNA polymerase γ (see text) B. Predicted position of Mip1 residues R607 and A661 with respect to DNA. The magnified view of the model shown in A highlights the relative positions of these residues and DNA.
The T661 allele is found in the vast majority of available S. cerevisiae Mip1 sequences, those of the Saccharomycetales and those from a fungal dataset that excludes the Saccharomycetales (Supplementary Tables 3–6). Thus, the MIP1 allele present in the first sequenced yeast strain (S288c, (Goffeau et al., 1996)) appears to be a mutant form; this is supported by the Provean analysis (Table 1). Other residues were found infrequently at position 661 in the sample set analyzed; they include a cysteine in Hanseniaspora osmophila (Supplementary Tables 3 and 4), a leucine in Tropilaelaps mercedesae, an alanine in Copidosoma floridanum, a leucine in Brugia malayi, and a leucine in Brugia pahangi (Supplementary Table 6). Interestingly, the equivalent threonine residue is present in a sample of metazoan mtDNA polymerases (Supplementary Table 6), although in mammalian sequences it is on the C-terminal side of a proline, which may indicate that these regions fold differently in animals and yeast polymerases.
C-terminal truncation variants
DIG-dUMP incorporation by the C-terminal truncation cMip1 T661 variant lacking 175 residues was indistinguishable from that of WT (Fig. 3A), as observed for Mip1[S]Δ175 on activated calf thymus DNA (Viikov et al., 2012) or singly primed deoxynucleotides (Viikov et al., 2012); (Trasvina-Arenas et al., 2019). The latter variant is associated with increased affinity for template:primer and as a result is more processive (Viikov et al., 2012). In vivo, Mip1[Σ]Δ175 is associated with WT levels of respiratory-competent cells, while Mip1[S]Δ175 and Mip1[S] are linked to a small increase in the formation of petite cells. This difference may reflect elements of the strains used for the experiments (discussed in (Young & Court, 2008) and (Trasvina-Arenas et al., 2019)). Interestingly, the rate of point mutation formation is lower for this variant (Young et al., 2006), (Trasvina-Arenas et al., 2019) perhaps suggesting a link between processivity and proofreading.
In contrast, cMip1 T661-Δ205 displayed reduced DIG-dUMP incorporation (Fig. 4). Mip1[S]Δ196, harboring a smaller truncation, has a higher exonuclease/polymerase activity ratio than the full-length enzyme and has about 30% of the polymerase activity of the WT enzyme (Trasvina-Arenas et al., 2019), in keeping with the data for cMip1 T661-Δ205. Also, efficient strand displacement requires at least the terminal 216 residues of Mip1 (Viikov et al., 2012), and it is possible that because the assay used herein is based on random priming of template DNA, the truncated Mip1 would encounter regions of double-stranded templates and stall, thereby reducing overall synthesis. The lack of alpha-helix 3 (α3) in cMip1 T661-Δ205 (Fig. 1B) compromised enzyme function relative to WT using our in vitro DIG-dUMP incorporation assay (Figs. 3A and 4); however, in vivo cells expressing Mip1[Σ]Δ205 maintain WT levels of respiratory competence and low levels of mtDNA point mutations. Thus, α3 is likely dispensable for Mip1 function.
cMip1 T661-Δ216 did not produce a detectable signal, which was unexpected, as the equivalent enzyme purified from E. coli is active, although the activity is reduced and it displays increased processivity and decreased strand displacement activity (Viikov et al., 2012). Further, this strain can maintain mtDNA, albeit only under conditions selecting for respiratory growth (Young et al., 2006). This truncated enzyme may be unable to utilize the template/primer system in the current assay.
After prolonged synthesis at 37°C, the signal from DIG-dUMP decreased for both full-length polymerases (Fig. 4), although variable results were shown for cMip1 T661 (Supplementary Fig. 6B). These results suggest that exonuclease activity exceeds polymerase activity at increased temperature and could reflect differential stability of the two domains at the higher temperature. This is in agreement with the increased numbers of ρ° cells seen at 37°C (Baruffini et al., 2007), in which case excess DNA degradation could contribute to the loss of mtDNA. In addition, as shown with T7 DNA polymerase, exonuclease activity can be increased in the presence of “replication hurdles”, such as DNA secondary structure or weakened interactions with helicases or other components of the replication machinery (Singh et al., 2020). These structural issues could impact the truncation variants of Mip1 more severely, leading to increased DNA degradation.
Taken together, various approaches have revealed the importance of the C-terminal residues maintained in the Δ216 variant but lost in the non-functional Δ222 variant (Young et al., 2006); (Trasvina-Arenas et al., 2019); (Viikov et al., 2012). Relative to cMip1 T661, replacements of amino acid residues with glycine substitutes within this region (Fig. 3B) had no significant effect on synthesis at 30°C and 37°C. Interestingly, cMip1 T661-E1036G is associated with increased synthesis at 30°C, although there is no effect at 37°C. The reduction in the negative charge of this sequence, or regional changes to the secondary structure may be important, (Supplementary Fig. 5).
In summary, the analysis of the CTE of Mip1 using multiple approaches has revealed its importance in error-free DNA synthesis. Our comparative analysis of Mip1[S] and Mip1[Σ] polymerase domains has further demonstrated the importance of the threonine at position 661 for enhancing mtDNA synthesis ((Baruffini et al., 2007), this work). We anticipate that a deeper understanding of the CTE and its interactions with the N-terminus of the protein (Trasvina-Arenas et al., 2019) will be gained by future detailed structural studies.
Supplementary Material
Supplementary Table 1 – Primers and IROs for generating truncation variants, Mip1[S] and cMip1 T661 plasmids, and amino acid residue replacements.
Supplementary Table 2 – Plasmids used in the current study.
Supplementary Tables 3–6.
To estimate the proportion of mitochondrial DNA polymerases with threonine at position 661, BlastP searches were carried out using the Mip1 protein sequence from Saccharomyces cerevisiae 288c (P15801) and the NCBI non-redundant sequence database (November 20, 2019). Four searches were carried out: Supplementary Table 3 – no restrictions; Supplementary Table 4 – Saccharomyces cerevisiae sequences (Tax ID 4932) were excluded; Supplementary Table 5 – sequences from the Order Saccharomycetales (Tax ID 4892) were excluded; Supplementary Table 6 – fungi (Tax ID 4751) were excluded. Cobalt sequence alignments (https://www.ncbi.nlm.nih.gov/tools/cobalt/re_cobalt.cgi) were examined visually for the residue at the position in the alignment corresponding to 661 in P15801. 100 hits were examined for each category.
Supplementary Figure 1. CLUSTALW (http://align.genome.jp/) alignment of Mip1 sequences (1254 amino acid residues) obtained from in-house sequencing of the MIP1 genes from S150 (Mip1[Σ]) and YPH499 (Mip1[S]) laboratory strains. These sequences are identical to those from strains Sigma1278b (ACVY01000010.1) and S288C (P15801), respectively. Bold residues in the alignment represent polymorphisms identified by sequencing that have been previously defined by Baruffini et al. ((Baruffini et al., 2007)). Residues highlighted in yellow are present in cMip1 T661 and were introduced from the Mip1[Σ] allele (see Materials and methods). The strictly conserved threonine 661 residue is represented by a bold number. Exonuclease (Exo) and polymerase (Pol) motifs (white boxes) are as defined by Ito and Braithwaite (Ito & Braithwaite, 1990) and gamma specific sequences (γ1 – γ6, the black lines under both sequences) are as defined by Luo and Kaguni ((Luo & Kaguni, 2005) and personal communication from Laurie S. Kaguni). Within the carboxyl-terminal extension (CTE, carboxyl-terminal 279 amino acid residues) black bars between the two sequences are predicted alpha-helical regions defined by Young et al. ((Young et al., 2006)). Various truncations are represented as Mip1 and the number of carboxyl-terminal amino acid residues deleted from the CTE. The two unlabeled arrows above and below the sequences delimit the region encoded by the PCR product generated from S150 genomic DNA using the primers MIP4_F_PolyFix and RevPolyFix. This PCR fragment was used to replace the region between AvrII and PstI restriction endonuclease sites within the pMIP1[S] plasmid (see text for details).
Supplementary Figure 2. Praline alignment (Simossis & Heringa, 2003) of 17 Opisthokonta DNA polymerase gamma amino acid sequences from the NCBI HomoloGene database. The 10 amino acid substitutions found in yeast Mip1 mtDNA polymerases are highlighted by purple arrows. Saccharomyces cerevisiae S288C (S_cer_S288c_NP_014975.2), Ashbya gossypii (A_gos_NP_984453.1), Schizosaccharomyces pombe (S_pombe_NP_588025.2), Magnaporthe oryzae (M_ory_XP_003713942.1), Neurospora crassa (N_cras_XP_957747.2), Homo sapiens (H_sap_NP_001119603.1), Pan troglodytes (P_tro_XP_523149.2), Macaca mulatta (M_mul_XP_001092360.1), Canis lupus familiaris (C_lup_fam_XP_005618410.1), Bos taurus (B_taur_XP_002696610.2), Mus musculus (M_mus_NP_059490.2), Rattus norvegicus (R_nor_NP_445980.1), Gallus gallus (G_gal_XP_425079.4), Danio rerio (D_rerio_XP_001921130.3), Xenopus tropicalis (X_trop_XP_002932281.2), Drosophila melanogaster (D_mel_NP_476821.1), and Anopheles gambiae (A_gamb_XP_311006.5). In the 10-point consistency scale, 0 indicates the least conserved alignment position, while 10 indicates the most conserved positions. The consistency score is explained in the footnote for Table 1 and in (Simossis & Heringa, 2003).
Supplementary Figure 3. Dot blot of DIG-dUMP incorporated into DNA by mitochondrial membrane protein fractions. Cells expressing Mip1[S] and cMip1 T661 WT and truncation variants were examined for the ability of their mitochondrial membrane protein fractions to synthesize DNA. DNA polymerase activity was monitored over 30 minutes at 30 and 37°C for each fraction as indicated. At 5, 10, 15, and 30 minutes of the experiment, an aliquot was removed and the reaction was stopped. 1 μl of the reaction was spotted onto the nylon membrane in triplicate, and DIG-dUMP was detected as described in materials and methods. M, mitochondrial membrane protein fraction from untransformed S150. The DIG-labeled standards used ranged from 10–200 pg/μl in A., 2.5–200 pg/μl in B. and 5–200 pg/μl in C., and 0.01 units of Klenow were used in the reactions labeled Klenow.
Supplementary Figure 4. Western blot analysis of sucrose gradient-purified membrane protein fractions from yeast cells expressing Mip1[S] and cMip1 T661 truncation variants. Samples from the sucrose gradient purified mitochondrial membranes representing 14 μg of protein were loaded in each well. M, extracts from untransformed S150 mitochondrial membranes; 279, 222, 216, 205, 175, and Wt, extracts from cells expressing Mip1Δ279, Mip1Δ222, Mip1Δ216, Mip1Δ205, Mip1Δ175, and WT Mip1 respectively. Versions of recombinant enzymes harboring either the Mip1[S] or cMip1 T661 polymerase domain are indicated at the top of the figure. The blot was cut into three strips; the top strip was probed with an anti-HA antibody to detect the HA-tagged Mip1 variants. Predicted molecular weights of N-terminally-processed mature polymerases are 109.8, 116.6, 117.3, 118.7, 122.1, and 142.4 kDa for Mip1Δ279, Mip1Δ222, Mip1Δ216, Mip1Δ205, Mip1Δ175 variants, and WT, respectively. The middle strip was probed with anti-Put2 antibody and the lower strip with anti-Tim17 antibody; molecular weight markers on the left-hand side are indicated in kDa.
Supplementary Figure 5. Predicted secondary structures of the region of Mip1 including residues 1033–1037 (bold). The amino acid introduced as a replacement is underlined. Predictions were made with the Chou and Fasman algorithm (Ashok Kumar, 2013) http://www.biogem.org/tool/chou-fasman/index.php. E, extended; T, turn; H, helix; C, coil; Struc, predicted structure.
Supplementary Figure 6. Time course data for the three replicate experiments used to calculate the data shown in Fig. 4 A and B for cMIP T661 and Mip1[S]. Data for experiments shown in the same color were carried out at the same time. Data obtained at 30°C are shown as squares with solid trendlines and those at 37°C by circles with dashed lines. Values are presented as a percentage of the signal obtained with WT cMip1 T661 at 30°C, as described in Figure 4. Each point represents the average of three technical replicates from a single experiment (see Supplementary Figure 3). A. cMip1 T661 at 30°C, B. cMip T661 at 37°C, C. Mip1[S] at 30°C, D. Mip1[S] at 37°C.
Supplementary Figure 7. Time course data for all three experiments used to calculate the data shown in Fig. 4 C and D for cMIP T661-Δ205 and Mip1[S]Δ205. Colors and symbols are as indicated in Supplementary Figure 6. A. cMip1 T661-Δ205 at 30°C, B. cMip T661-Δ205 at 37°C, C. Mip1[S]Δ205 at 30°C, D. Mip1[S]Δ205 at 37°C.
Take away:
DNA polymerase gamma (Mip1) activity is assayable with digoxigenin-dUMP
Over-expressed yeast Mip1 co-purifies with mitochondrial membrane fractions
The T661 variant has higher DNA polymerase activity than the A661 variant
Truncated Mip1 C-terminal extensions lead to decreased DNA polymerase activity
Product loss at 37°C suggests an altered polymerase:exonuclease activity ratio
Acknowledgements
We thank Enisa Zildzic (NSERC URSA), Georgia Lefas (NSERC URSA), Xi Wang (NSERC URSA), Margot Arntfield (NSERC URSA), Kristen Creek, Ryan Szajkowski, Stephen Szczerba, Remy-Martin Gratton, Sung Hoon Kim, Joanna Hessman, Anna Motnenko and Suhaila Selamat for their technical assistance. This work was supported by an NSERC Discovery Grant to DAC, and by a University of Manitoba Graduate Fellowship, U of M Faculty of Science Graduate Student Scholarship, a National Institute of Environmental Health Sciences Pathway to Independence Award, (5R00ES022638-04), and start-up funds from SIU School of Medicine to MJY.
Footnotes
Conflict of interest
The authors declare no conflicts of interest.
References:
- Ashok Kumar T (2013). CFSSP: Chou and Fasman secondary structure prediction server. Research Journal, 1(9), 15–19. [Google Scholar]
- Baruffini E, Lodi T, Dallabona C, & Foury F (2007). A single nucleotide polymorphism in the DNA polymerase gamma gene of Saccharomyces cerevisiae laboratory strains is responsible for increased mitochondrial DNA mutability. Genetics, 177(2), 1227–1231. [DOI] [PMC free article] [PubMed] [Google Scholar]
- Broach JR, Strathern JN, & Hicks JB (1979). Transformation in yeast: development of a hybrid cloning vector and isolation of the CAN1 gene. Gene, 8(1), 121–133. doi: 10.1016/0378-1119(79)90012-x [DOI] [PubMed] [Google Scholar]
- Budd ME, Sitney KC, & Campbell JL (1989). Purification of DNA polymerase II, a distinct DNA polymerase, from Saccharomyces cerevisiae. J Biol Chem, 264(11), 6557–6565. [PubMed] [Google Scholar]
- Choi Y, Sims GE, Murphy S, Miller JR, & Chan AP (2012). Predicting the functional effect of amino acid substitutions and indels. PLoS One, 7(10), e46688. doi: 10.1371/journal.pone.0046688 [DOI] [PMC free article] [PubMed] [Google Scholar]
- Claros MG, & Vincens P (1996). Computational method to predict mitochondrially imported proteins and their targeting sequences. Eur J Biochem, 241(3), 779–786. doi: 10.1111/j.1432-1033.1996.00779.x [DOI] [PubMed] [Google Scholar]
- Colot HV, Park G, Turner GE, Ringelberg C, Crew CM, Litvinkova L, … Dunlap JC (2006). A high-throughput gene knockout procedure for Neurospora reveals functions for multiple transcription factors. Proc Natl Acad Sci USA, 103(27), 10352–10357. doi: 10.1073/pnas.0601456103 [DOI] [PMC free article] [PubMed] [Google Scholar]
- Ferreira M, Evangelista T, Almeida LS, Martins J, Macario MC, Martins E, … Santorelli FM (2011). Relative frequency of known causes of multiple mtDNA deletions: two novel POLG mutations. Neuromuscul Disord, 21(7), 483–488. doi: 10.1016/j.nmd.2011.03.011 [DOI] [PubMed] [Google Scholar]
- Foury F (1989). Cloning and sequencing of the nuclear gene MIP1 encoding the catalytic subunit of the yeast mitochondrial DNA polymerase. J Biol Chem, 264(34), 20552–20560. [PubMed] [Google Scholar]
- Gelperin DM, White MA, Wilkinson ML, Kon Y, Kung LA, Wise KJ, … Grayhack EJ (2005). Biochemical and genetic analysis of the yeast proteome with a movable ORF collection. Genes Dev, 19(23), 2816–2826. [DOI] [PMC free article] [PubMed] [Google Scholar]
- Genga A, Bianchi L, & Foury F (1986). A nuclear mutant of Saccharomyces cerevisiae deficient in mitochondrial DNA replication and polymerase activity. J Biol Chem, 261(20), 9328–9332. [PubMed] [Google Scholar]
- Gietz RD, & Woods RA (2002). Transformation of yeast by lithium acetate/single-stranded carrier DNA/polyethylene glycol method. Methods Enzymol, 350, 87–96. [DOI] [PubMed] [Google Scholar]
- Goffeau A, Barrell BG, Bussey H, Davis RW, Dujon B, Feldmann H, … Oliver SG (1996). Life with 6000 genes. Science, 274(5287), 546, 563–547. [DOI] [PubMed] [Google Scholar]
- Heringa J (1999). Two strategies for sequence comparison: profile-preprocessed and secondary structure-induced multiple alignment. Comput Chem, 23(3–4), 341–364. [DOI] [PubMed] [Google Scholar]
- Hoppins SC (2005). Mitochondrial protein import in Neurospora crassa (PhD). University of Alberta, [Google Scholar]
- Hu JP, Vanderstraeten S, & Foury F (1995). Isolation and characterization of ten mutator alleles of the mitochondrial DNA polymerase-encoding MIP1 gene from Saccharomyces cerevisiae. Gene, 160(1), 105–110. [DOI] [PubMed] [Google Scholar]
- Ito J, & Braithwaite DK (1990). Yeast mitochondrial DNA polymerase is related to the family A DNA polymerases. Nucleic Acids Res, 18(22), 6716. [DOI] [PMC free article] [PubMed] [Google Scholar]
- Kaguni LS (2004). DNA polymerase gamma, the mitochondrial replicase. Annu Rev Biochem, 73, 293–320. [DOI] [PubMed] [Google Scholar]
- Kelley LA, Mezulis S, Yates CM, Wass MN, & Sternberg MJ (2015). The Phyre2 web portal for protein modeling, prediction and analysis. Nat Protoc, 10(6), 845–858. doi: 10.1038/nprot.2015.053 [DOI] [PMC free article] [PubMed] [Google Scholar]
- Lewandowska A, Gierszewska M, Marszalek J, & Liberek K (2006). Hsp78 chaperone functions in restoration of mitochondrial network following heat stress. Biochim Biophys Acta, 1763(2), 141–151. doi: 10.1016/j.bbamcr.2006.01.007 [DOI] [PubMed] [Google Scholar]
- Lodi T, Dallabona C, Nolli C, Goffrini P, Donnini C, & Baruffini E (2015). DNA polymerase gamma and disease: what we have learned from yeast. Front Genet, 6, 106. doi: 10.3389/fgene.2015.00106 [DOI] [PMC free article] [PubMed] [Google Scholar]
- Luo N, & Kaguni LS (2005). Mutations in the spacer region of Drosophila mitochondrial DNA polymerase affect DNA binding, processivity, and the balance between Pol and Exo function. J Biol Chem, 280(4), 2491–2497. [DOI] [PubMed] [Google Scholar]
- Meeusen S, & Nunnari J (2003). Evidence for a two membrane-spanning autonomous mitochondrial DNA replisome. J Cell Biol, 163(3), 503–510. [DOI] [PMC free article] [PubMed] [Google Scholar]
- Meeusen S, Tieu Q, Wong E, Weiss E, Schieltz D, Yates JR, & Nunnari J (1999). Mgm101p is a novel component of the mitochondrial nucleoid that binds DNA and is required for the repair of oxidatively damaged mitochondrial DNA. J Cell Biol, 145(2), 291–304. [DOI] [PMC free article] [PubMed] [Google Scholar]
- Mueller DM, Puri N, Kabaleeswaran V, Terry C, Leslie AG, & Walker JE (2004). Nichelate-affinity purification and crystallization of the yeast mitochondrial F1-ATPase. Protein Expr Purif, 37(2), 479–485. doi: 10.1016/j.pep.2004.06.035 [DOI] [PubMed] [Google Scholar]
- Nissanka N, Bacman SR, Plastini MJ, & Moraes CT (2018). The mitochondrial DNA polymerase gamma degrades linear DNA fragments precluding the formation of deletions. Nat Commun, 9(1), 2491. doi: 10.1038/s41467-018-04895-1 [DOI] [PMC free article] [PubMed] [Google Scholar]
- Peeva V, Blei D, Trombly G, Corsi S, Szukszto MJ, Rebelo-Guiomar P, … Kunz WS (2018). Linear mitochondrial DNA is rapidly degraded by components of the replication machinery. Nat Commun, 9(1), 1727. doi: 10.1038/s41467-018-04131-w [DOI] [PMC free article] [PubMed] [Google Scholar]
- Philippsen P, Stotz A, & Scherf C (1991). DNA of Saccharomyces cerevisiae. Methods Enzymol, 194, 169–182. [DOI] [PubMed] [Google Scholar]
- Sambrook J, & Russell D (2001). Molecular Cloning - A Laboratory Manual (Third ed.). Cold Spring Harbor, NY: Cold Spring Harbor Laboratory Press. [Google Scholar]
- Sheff MA, & Thorn KS (2004). Optimized cassettes for fluorescent protein tagging in Saccharomyces cerevisiae. Yeast, 21(8), 661–670. [DOI] [PubMed] [Google Scholar]
- Sherman F (1991). Getting started with yeast. Methods Enzymol, 194, 3–21. [DOI] [PubMed] [Google Scholar]
- Shimizu K, Kawasaki Y, Hiraga S, Tawaramoto M, Nakashima N, & Sugino A (2002). The fifth essential DNA polymerase phi in Saccharomyces cerevisiae is localized to the nucleolus and plays an important role in synthesis of rRNA. Proc Natl Acad Sci USA, 99(14), 9133–9138. doi: 10.1073/pnas.142277999 [DOI] [PMC free article] [PubMed] [Google Scholar]
- Simossis VA, & Heringa J (2003). The PRALINE online server: optimising progressive multiple alignment on the web. Comput Biol Chem, 27(4–5), 511–519. [DOI] [PubMed] [Google Scholar]
- Singh A, Pandey M, Nandakumar D, Raney KD, Yin YW, & Patel SS (2020). Excessive excision of correct nucleotides during DNA synthesis explained by replication hurdles. Embo J, 39(6), e103367. doi: 10.15252/embj.2019103367 [DOI] [PMC free article] [PubMed] [Google Scholar]
- Sohl CD, Szymanski MR, Mislak AC, Shumate CK, Amiralaei S, Schinazi RF, … Yin YW (2015). Probing the structural and molecular basis of nucleotide selectivity by human mitochondrial DNA polymerase gamma. Proc Natl Acad Sci USA, 112(28), 8596–8601. doi: 10.1073/pnas.1421733112 [DOI] [PMC free article] [PubMed] [Google Scholar]
- Sor F, & Fukuhara H (1982). Identification of two erythromycin resistance mutations in the mitochondrial gene coding for the large ribosomal RNA in yeast. Nucleic Acids Res, 10(21), 6571–6577. doi: 10.1093/nar/10.21.6571 [DOI] [PMC free article] [PubMed] [Google Scholar]
- Storici F, & Resnick MA (2006). The delitto perfetto approach to in vivo site-directed mutagenesis and chromosome rearrangements with synthetic oligonucleotides in yeast. Methods Enzymol, 409, 329–345. doi: 10.1016/S0076-6879(05)09019-1 [DOI] [PubMed] [Google Scholar]
- Szymanski MR, Kuznetsov VB, Shumate C, Meng Q, Lee YS, Patel G, … Yin YW (2015). Structural basis for processivity and antiviral drug toxicity in human mitochondrial DNA replicase. Embo J, 34(14), 1959–1970. doi: 10.15252/embj.201591520 [DOI] [PMC free article] [PubMed] [Google Scholar]
- Trasvina-Arenas CH, Hoyos-Gonzalez N, Castro-Lara AY, Rodriguez-Hernandez A, Sanchez-Sandoval ME, Jimenez-Sandoval P, … Brieba LG (2019). Amino and carboxy-terminal extensions of yeast mitochondrial DNA polymerase assemble both the polymerization and exonuclease active sites. Mitochondrion, 49, 166–177. doi: 10.1016/j.mito.2019.08.005 [DOI] [PubMed] [Google Scholar]
- Vanderstraeten S, Van den Brule S, Hu J, & Foury F (1998). The role of 3’–5’ exonucleolytic proofreading and mismatch repair in yeast mitochondrial DNA error avoidance. J Biol Chem, 273(37), 23690–23697. [DOI] [PubMed] [Google Scholar]
- Viikov K, Jasnovidova O, Tamm T, & Sedman J (2012). C-terminal extension of the yeast mitochondrial DNA polymerase determines the balance between synthesis and degradation. PLoS One, 7(3), e33482. doi: 10.1371/journal.pone.0033482 [DOI] [PMC free article] [PubMed] [Google Scholar]
- Young MJ (2008). Analysis of Saccharomyces cerevisiae genetic background and mitochondrial DNA polymerase variants on maintenance of the mitochondrial genome. (Ph.D.). University of Manitoba, [Google Scholar]
- Young MJ, & Court DA (2008). Effects of the S288c genetic background and common auxotrophic markers on mitochondrial DNA function in Saccharomyces cerevisiae. Yeast, 25(12), 903–912. doi: 10.1002/yea.1644 [DOI] [PubMed] [Google Scholar]
- Young MJ, Theriault SS, Li M, & Court DA (2006). The carboxyl-terminal extension on fungal mitochondrial DNA polymerases: identification of a critical region of the enzyme from Saccharomyces cerevisiae. Yeast, 23(2), 101–116. [DOI] [PubMed] [Google Scholar]
Associated Data
This section collects any data citations, data availability statements, or supplementary materials included in this article.
Supplementary Materials
Supplementary Table 1 – Primers and IROs for generating truncation variants, Mip1[S] and cMip1 T661 plasmids, and amino acid residue replacements.
Supplementary Table 2 – Plasmids used in the current study.
Supplementary Tables 3–6.
To estimate the proportion of mitochondrial DNA polymerases with threonine at position 661, BlastP searches were carried out using the Mip1 protein sequence from Saccharomyces cerevisiae 288c (P15801) and the NCBI non-redundant sequence database (November 20, 2019). Four searches were carried out: Supplementary Table 3 – no restrictions; Supplementary Table 4 – Saccharomyces cerevisiae sequences (Tax ID 4932) were excluded; Supplementary Table 5 – sequences from the Order Saccharomycetales (Tax ID 4892) were excluded; Supplementary Table 6 – fungi (Tax ID 4751) were excluded. Cobalt sequence alignments (https://www.ncbi.nlm.nih.gov/tools/cobalt/re_cobalt.cgi) were examined visually for the residue at the position in the alignment corresponding to 661 in P15801. 100 hits were examined for each category.
Supplementary Figure 1. CLUSTALW (http://align.genome.jp/) alignment of Mip1 sequences (1254 amino acid residues) obtained from in-house sequencing of the MIP1 genes from S150 (Mip1[Σ]) and YPH499 (Mip1[S]) laboratory strains. These sequences are identical to those from strains Sigma1278b (ACVY01000010.1) and S288C (P15801), respectively. Bold residues in the alignment represent polymorphisms identified by sequencing that have been previously defined by Baruffini et al. ((Baruffini et al., 2007)). Residues highlighted in yellow are present in cMip1 T661 and were introduced from the Mip1[Σ] allele (see Materials and methods). The strictly conserved threonine 661 residue is represented by a bold number. Exonuclease (Exo) and polymerase (Pol) motifs (white boxes) are as defined by Ito and Braithwaite (Ito & Braithwaite, 1990) and gamma specific sequences (γ1 – γ6, the black lines under both sequences) are as defined by Luo and Kaguni ((Luo & Kaguni, 2005) and personal communication from Laurie S. Kaguni). Within the carboxyl-terminal extension (CTE, carboxyl-terminal 279 amino acid residues) black bars between the two sequences are predicted alpha-helical regions defined by Young et al. ((Young et al., 2006)). Various truncations are represented as Mip1 and the number of carboxyl-terminal amino acid residues deleted from the CTE. The two unlabeled arrows above and below the sequences delimit the region encoded by the PCR product generated from S150 genomic DNA using the primers MIP4_F_PolyFix and RevPolyFix. This PCR fragment was used to replace the region between AvrII and PstI restriction endonuclease sites within the pMIP1[S] plasmid (see text for details).
Supplementary Figure 2. Praline alignment (Simossis & Heringa, 2003) of 17 Opisthokonta DNA polymerase gamma amino acid sequences from the NCBI HomoloGene database. The 10 amino acid substitutions found in yeast Mip1 mtDNA polymerases are highlighted by purple arrows. Saccharomyces cerevisiae S288C (S_cer_S288c_NP_014975.2), Ashbya gossypii (A_gos_NP_984453.1), Schizosaccharomyces pombe (S_pombe_NP_588025.2), Magnaporthe oryzae (M_ory_XP_003713942.1), Neurospora crassa (N_cras_XP_957747.2), Homo sapiens (H_sap_NP_001119603.1), Pan troglodytes (P_tro_XP_523149.2), Macaca mulatta (M_mul_XP_001092360.1), Canis lupus familiaris (C_lup_fam_XP_005618410.1), Bos taurus (B_taur_XP_002696610.2), Mus musculus (M_mus_NP_059490.2), Rattus norvegicus (R_nor_NP_445980.1), Gallus gallus (G_gal_XP_425079.4), Danio rerio (D_rerio_XP_001921130.3), Xenopus tropicalis (X_trop_XP_002932281.2), Drosophila melanogaster (D_mel_NP_476821.1), and Anopheles gambiae (A_gamb_XP_311006.5). In the 10-point consistency scale, 0 indicates the least conserved alignment position, while 10 indicates the most conserved positions. The consistency score is explained in the footnote for Table 1 and in (Simossis & Heringa, 2003).
Supplementary Figure 3. Dot blot of DIG-dUMP incorporated into DNA by mitochondrial membrane protein fractions. Cells expressing Mip1[S] and cMip1 T661 WT and truncation variants were examined for the ability of their mitochondrial membrane protein fractions to synthesize DNA. DNA polymerase activity was monitored over 30 minutes at 30 and 37°C for each fraction as indicated. At 5, 10, 15, and 30 minutes of the experiment, an aliquot was removed and the reaction was stopped. 1 μl of the reaction was spotted onto the nylon membrane in triplicate, and DIG-dUMP was detected as described in materials and methods. M, mitochondrial membrane protein fraction from untransformed S150. The DIG-labeled standards used ranged from 10–200 pg/μl in A., 2.5–200 pg/μl in B. and 5–200 pg/μl in C., and 0.01 units of Klenow were used in the reactions labeled Klenow.
Supplementary Figure 4. Western blot analysis of sucrose gradient-purified membrane protein fractions from yeast cells expressing Mip1[S] and cMip1 T661 truncation variants. Samples from the sucrose gradient purified mitochondrial membranes representing 14 μg of protein were loaded in each well. M, extracts from untransformed S150 mitochondrial membranes; 279, 222, 216, 205, 175, and Wt, extracts from cells expressing Mip1Δ279, Mip1Δ222, Mip1Δ216, Mip1Δ205, Mip1Δ175, and WT Mip1 respectively. Versions of recombinant enzymes harboring either the Mip1[S] or cMip1 T661 polymerase domain are indicated at the top of the figure. The blot was cut into three strips; the top strip was probed with an anti-HA antibody to detect the HA-tagged Mip1 variants. Predicted molecular weights of N-terminally-processed mature polymerases are 109.8, 116.6, 117.3, 118.7, 122.1, and 142.4 kDa for Mip1Δ279, Mip1Δ222, Mip1Δ216, Mip1Δ205, Mip1Δ175 variants, and WT, respectively. The middle strip was probed with anti-Put2 antibody and the lower strip with anti-Tim17 antibody; molecular weight markers on the left-hand side are indicated in kDa.
Supplementary Figure 5. Predicted secondary structures of the region of Mip1 including residues 1033–1037 (bold). The amino acid introduced as a replacement is underlined. Predictions were made with the Chou and Fasman algorithm (Ashok Kumar, 2013) http://www.biogem.org/tool/chou-fasman/index.php. E, extended; T, turn; H, helix; C, coil; Struc, predicted structure.
Supplementary Figure 6. Time course data for the three replicate experiments used to calculate the data shown in Fig. 4 A and B for cMIP T661 and Mip1[S]. Data for experiments shown in the same color were carried out at the same time. Data obtained at 30°C are shown as squares with solid trendlines and those at 37°C by circles with dashed lines. Values are presented as a percentage of the signal obtained with WT cMip1 T661 at 30°C, as described in Figure 4. Each point represents the average of three technical replicates from a single experiment (see Supplementary Figure 3). A. cMip1 T661 at 30°C, B. cMip T661 at 37°C, C. Mip1[S] at 30°C, D. Mip1[S] at 37°C.
Supplementary Figure 7. Time course data for all three experiments used to calculate the data shown in Fig. 4 C and D for cMIP T661-Δ205 and Mip1[S]Δ205. Colors and symbols are as indicated in Supplementary Figure 6. A. cMip1 T661-Δ205 at 30°C, B. cMip T661-Δ205 at 37°C, C. Mip1[S]Δ205 at 30°C, D. Mip1[S]Δ205 at 37°C.