

Abstract
Quantitative cardiac magnetic resonance has emerged in recent years as an approach for evaluating a range of cardiovascular conditions, with T1 and T2 mapping at the forefront of these developments. Cardiac Magnetic Resonance Fingerprinting (cMRF) provides a rapid and robust framework for simultaneous quantification of myocardial T1 and T2 in addition to other tissue properties. Since the advent of cMRF, a number of technical developments and clinical validation studies have been reported. This review provides an overview of cMRF, recent technical developments, healthy subject and patient studies, anticipated technical improvements, and potential clinical applications. Recent technical developments include slice profile and pulse efficiency corrections, improvements in image reconstruction, simultaneous multislice imaging, 3D whole-ventricle imaging, motion-resolved imaging, fat-water separation, and machine learning for rapid dictionary generation. Future technical developments in cMRF, such as B0 and B1 field mapping, acceleration of acquisition and reconstruction, imaging of patients with implanted devices, and quantification of additional tissue properties are also described. Potential clinical applications include characterization of infiltrative, inflammatory, and ischemic cardiomyopathies, tissue characterization in the left atrium and right ventricle, post-cardiac transplantation assessment, reduction of contrast material, pre-procedural planning for electrophysiology interventions, and imaging of patients with implanted devices.
Keywords: Cardiac MRI, Magnetic Resonance Fingerprinting, Quantitative MRI, Relaxometry, Multiparametric MRI
Graphical abstract
1. Introduction
Tissue characterization by myocardial T1 and T2 mapping has been widely reported for its potential to assess a range of cardiovascular diseases. In general, myocardial T1 and T2 relaxation times have been shown to be sensitive to abnormalities in tissue composition due to fibrosis, edema, inflammation, iron overload, and fat infiltration [1], [2]. “Native” T1 mapping, where “native” refers to the state of the myocardium without application of exogenous contrast material, can reveal myocardial abnormalities not evident on conventional late gadolinium enhanced images that are typically used to assess disease [3]. Aside from characterizing abnormalities in tissue composition, such as in the use of native myocardial T1 for detection of cardiac amyloidosis [4], [5], tissue characterization by T2 mapping can assist in characterizing disease subtypes [6]. T1 mapping has also been used to characterize myocardium with impaired perfusion in patients with coronary artery disease and [7] and microvascular disease [8] without the need for contrast material. Additionally, recent studies have demonstrated native myocardial T1 values change during vasodilation [9], providing insight into the status of the myocardial vasculature. The potential clinical applications of T1 and T2 mapping are numerous, driving the development of these techniques.
Significant hurdles to the widespread clinical adoption of T1 and T2 mapping include the limited reproducibility of conventional techniques and their time-consuming nature. Different mapping techniques are commonly reported to yield different myocardial T1 or T2 values [10]. However, with limited in vivo ground truth due to issues such as difficulty correlating parametric MRI mapping with tissue biopsy, different relaxometry techniques are often assessed by their reproducibility or clinical utility. On a particular MRI scanner, reproducibility of techniques is often on the order of 1.6–2.6% in healthy subjects [11]. However, there is significant inter-site or inter-scanner variability in measured T1 or T2 values, leading to recommendations to determine scanner-specific reference ranges in a cohort of normal individuals or healthy subjects before using measured values for patient assessment, particularly for applications requiring high-precision quantification [2]. Such a requirement for scanner-specific evaluation of normal, asymptomatic subjects thus limits adoption of mapping techniques and complicates analysis. Commonly used methods are known to be incorrect due to a number of factors. For example, T1 estimates from modified Look-Locker inversion recovery (MOLLI) are known to be affected by T2-dependence, magnetization transfer, and inversion efficiency [12]. Methods that rely on long recovery times fail when the heart rate is rapid, highlighting an undesirable dependence of the methods on heart rate. Furthermore, conventional myocardial T1 and T2 mapping techniques are performed separately, requiring a separate breath-held acquisition for each map and each imaging slice. A protocol that includes both T1 and T2 mapping therefore requires six breath-held acquisitions (considering basal, mid, and apex short-axis slices), which may be difficult for some patients and adds appreciable time to the cardiac MR protocol.
Cardiac Magnetic Resonance Fingerprinting (cMRF) has recently emerged as an approach to quantify rapidly and simultaneously multiple tissue properties including T1, T2, and proton density (M0). The cMRF technique requires fewer assumptions in the quantification of tissue properties than conventional techniques, for instance by directly incorporating radiofrequency pulse efficiency into the cMRF signal model, which can potentially improve scanner-to-scanner reproducibility. cMRF has the potential to simplify protocols as it can capture multiple tissue properties in a single scan, reducing the number of acquisitions and breath-holds required in a cardiac MRI exam, and therefore shorten and simplify protocols. With these properties, cMRF has received significant attention. Technical developments of cMRF have been reported in recent years aimed toward improving the quality of tissue property maps and providing additional information. As cMRF is translated into the clinic and its technical capabilities are expanded, anticipated applications include characterization of infiltrative, inflammatory, and ischemic cardiomyopathies, tissue characterization in the left atrium and right ventricle, post-cardiac transplantation assessment, reduction of contrast material, pre-procedural planning for electrophysiology interventions, and imaging of patients with implanted devices. This review will describe the cMRF technique, technical developments to date, potential future developments, and anticipated clinical applications.
2. Cardiac Magnetic Resonance Fingerprinting
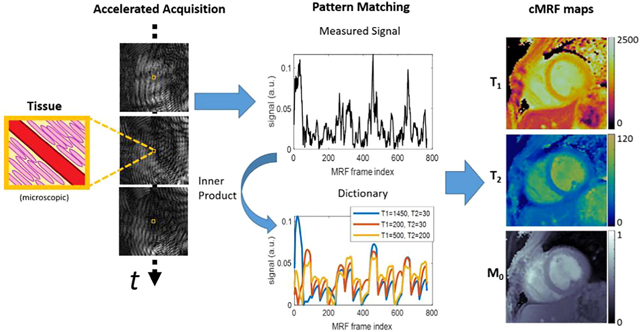
The cMRF technique [13] is an adaptation of the original MRF approach developed for neuroimaging [14]. At its core, MRF is comprised of the following: (1) a highly accelerated acquisition to rapidly acquire image frames, (2) contrast weighting that induces sensitivity to tissue properties of interest over time, (3) a magnetic signal evolution model (e.g., Bloch equation simulation) to generate an individualized dictionary of “fingerprints” that are unique to each combination of tissue property values, and (4) an algorithm to match image-derived signals to the dictionary. These components lend a great deal of flexibility to sequence design in MRF as different combinations of sampling trajectories, flip angles, repetition times, echo times, and magnetization preparations can be applied. Table 1 shows a comparison of cMRF to conventional cardiac magnetic resonance tissue property mapping.
Table 1.
Comparison of conventional cardiac magnetic resonance (CMR) tissue characterization and cardiac MR Fingerprinting (cMRF).
| Technique considerations | Conventional CMR Tissue Characterization | Cardiac MR Fingerprinting (cMRF) |
|---|---|---|
| Physiology | ECG-gated, breath-held | ECG-gated, breath-held |
| Gradient trajectory | Cartesian acquisition | Non-Cartesian (Spiral, Radial, Rosette) or Cartesian |
| Kspace sampling per image frame | Fully-sampled or mildly undersampled | Highly undersampled |
| Number of image frames | Up to 15 (e.g. 1 per heartbeat) | Hundreds (e.g. 48 per heartbeat) |
| Tissue properties mapped | One per acquisition (e.g. T1 or T2) | Multiple per acquisition (e.g. T1, T2, and M0) |
| Magnetization preparation | Inversion pulse or T2preparation pulse | Inversion pulse and T2−preparation pulse |
| Signal model | Exponential decay or recovery | Bloch equation magnetization vector |
| Quantification method | Curve fitting | Pattern matching to dictionary |
In cMRF, cardiac and respiratory motion introduce constraints to sequence design. Respiratory motion is typically mitigated by performing a breath-held acquisition at either full inspiration or full exhalation. Cardiac motion is addressed using electrocardiogram (ECG) triggered acquisition, where data are acquired at the same cardiac phase across different heartbeats. However, an issue with an ECG-triggered acquisition is magnetic relaxation between heartbeats, which may reduce the sensitivity of the signal to tissue properties of interest. To address this limitation, magnetization preparation is employed in the form of inversion pulses and T2-preparation pulses with varying inversion times and dephasing times (TEs) [13].
The initial cMRF publication by Hamilton et al. [13] describes the sequence and reconstruction that has served as a foundation for subsequent developments. This 2D sequence uses a variable density spiral trajectory and fast imaging with steady-state free-precession readout with refocused in-plane (kx-ky) spatial encoding gradients and a slice direction (kz) spoiler gradient to rapidly acquire highly undersampled (acceleration factor R=48) image frames. The angle of each spiral interleaf is incremented by the golden angle (111 degree) to produce incoherent undersampling artifacts over time. For each acquisition block, a variable flip angle radiofrequency excitation and fixed or variable repetition time is used. After the ECG trigger and delay, 48 acquisition blocks are acquired over a duration of 240–280 ms per heartbeat. In this original sequence, data are acquired across 16 heartbeats, and separated into four 4-heartbeat sets. Each 4-heartbeat set consists of magnetization preparation ordering of (1) inversion, (2) no preparation, and (3, 4) T2-preparation. Once the acquisition is complete, a dictionary of signal evolutions (fingerprints) is produced using a Bloch equation simulation, taking into account the sequence parameters described above with the unique cardiac timings for a given scan. Unlike MRF, each cMRF scan can have a different associated cardiac rhythm. Thus, dictionaries cannot be produced ahead of time and must instead be generated following data acquisition, as the subject will have a different cardiac rhythm each time cMRF are collected. After the dictionary of signal evolutions is calculated, voxelwise pattern matching of the complex-valued measured signal evolution with the complex-valued dictionary entries is performed by computing the inner product between the measured signal and each dictionary entry and then finding the entry which has the highest inner product value (best match). The best-matched entry for each voxel indicates the corresponding T1 and T2 value combination for that voxel, which are then recorded in the corresponding parameter maps. Scaling of the measured signal evolution relative to the best-match dictionary entry provides the associated M0. The final output is therefore a combination of T1, T2, and M0 maps resulting from the single scan. Figure 1 provides an overview of the cMRF technique.
Figure 1. Overview of the cardiac Magnetic Resonance Fingerprinting (cMRF) approach.

A previously reported 16-heartbeat sequence [13] is used as an example. (a) Components of the cMRF sequence are shown in a representative pulse diagram. Preparation modules include a magnetization preparation pulse (e.g. inversion, INV) followed by a spoiler gradient and delay time before an acquisition block. The acquisition block is composed of an excitation pulse (EXC), spiral gradient trajectory and readout, and gradient spoiler. (b) cMRF employs variable flip angles of the excitation pulses to impart sensitivity to T1 relaxation. Variable repetition time for the acquisition blocks can also be used, but typically short, constant TR is employed for efficient data collection. (c) The non-Cartesian gradient trajectory, e.g. variable density spiral, is used to impart “noise-like” incoherent undersampling artifact through time. (d) Accelerated images are reconstructed and coil-combined to produce a time series of image data. The cMRF signal for a voxel (yellow box) is measured and compared to a dictionary of signal evolutions for different tissue properties (e.g. T1, T2) to find the best match by maximizing the complex inner product. This procedure is repeated for each voxel to obtain T1, T2, and M0 maps (units: T1 and T2 (ms), M0 (arbitrary units)). (e) Stylized, hypothetical healthy and pathologic sub-voxel myocardial tissues are shown to demonstrate the physiological factors that contribute to cMRF signals and are of interest in myocardial tissue characterization. Shown are: intravascular space (red, e.g. capillary), extracellular space (yellow), intracellular space (pink, e.g. cardiomyocytes), and pathologic proteins (blue, e.g. amyloid fibrils). Alterations to intracellular, extracellular, intravascular, or protein deposition patterns can influence magnetic relaxation times and thus may be characterized by cMRF.
A key benefit anticipated by the cMRF technique is that tissue property estimates are expected to be consistent across scanners, heart rates, and sequence variations. Variations in the scanner, such as different gradient systems and radiofrequency pulse characteristics, can be included in the dictionary generation and therefore should not affect the underlying T1 and T2 relaxation properties. Similarly, variations in heart rate or the specific pulse sequence applied are not expected to affect the final measured T1 and T2 by cMRF, as heart rate related timings and sequence parameters are all incorporated into dictionary generation. In general, so long as the scanner used or sequence applied does not introduce sensitivity to other physical effects, and the relevant physical effects are modeled properly, then different embodiments of cMRF on different scanners should lead to similar results.
3. Recent technical developments
Numerous technical developments have been reported since the initial cMRF technique. These developments focus on simplifying scanning, shortening scan time, and improving image quality and tissue property quantitation. These technical developments are described below and are also listed in Table 2.
Table 2.
Technical developments in cardiac MR fingerprinting
| Development | Technique | Reference |
|---|---|---|
| Slice profile correction, pulse efficiency correction | Multi-spin state Bloch simulation, Relaxation during pulse | Hamilton et al.[15] |
| Improved image reconstruction | Low rank reconstruction, High-dimensionality undersampled patch-based reconstruction (HD-PROST) | Hamilton et al. [16] Jaubert et al. [17] |
| Simultaneous multi-slice | Radiofrequency pulse phase | Hamilton et al. [18] |
| 3D imaging | Free-breathing 3D imaging, translation motion correction | Cruz et al. [19] |
| Cardiac motion-resolved imaging | Cine-MRF, Free-running MRF | Hamilton et al. [20] Jaubert et al.[21] |
| Water-fat separation | 3-Echo Dixon, Spectrally selective rosette trajectory | Jaubert et al. [17] Liu et al. [22] |
| Rapid dictionary generation | Neural network | Hamilton and Seiberlich [23] |
Corrections for slice profile and magnetization preparation pulse efficiency have been described that improve T1 and T2 estimation in cMRF [15]. The radiofrequency pulses applied during a 2D cMRF scan are not ideal slabs but instead have a characteristic slice profile depending on the pulse shape. In effect, spins within a given voxel experience different B1 field excitation, which leads to different signal contribution compared with that assumed by the Bloch equation dictionary generation. Additionally, the assumption of instantaneous preparation pulses does not account for relaxation that occurs during these pulses, and that can introduce bias. In a simulation study that examined these effects, it was observed that assuming an ideal slice profile and instantaneous pulses led to underestimation of T1 and overestimation of T2. In phantom experiments using the International Society of Magnetic Resonance in Medicine / National Institutes of Standards and Technology (ISMRM/NIST) MRI system phantom, including these corrections improved the accuracy of T1 and T2 estimates for a variety of different cMRF pulse sequence structures. In healthy subjects, applying these corrections improved the consistency of myocardial T1 and T2 estimates in healthy subjects, reducing the standard deviation in T1 across subjects from 26 ms (uncorrected) to 14 ms (corrected) and in T2 from 2.8 ms (uncorrected) to 1.5 ms (corrected).
Improvements in the inner product pattern matching reconstruction have also been shown to improve the quality of cMRF-based tissue property maps. Compressed sensing reconstruction has been employed to reduce noise in cMRF-derived tissue property maps by taking advantage of the temporal redundancy in the cMRF dictionary to compress image data into a low rank representation [16]. A singular value decomposition is used to determine a temporal compression subspace, and then the gridded, undersampled images are projected onto this low rank subspace. The low rank image data are iteratively updated to optimize the objective function, which is comprised of data consistency and regularization terms. Finally, the low rank image data are matched to a corresponding low rank dictionary to determine the T1, T2, and M0 maps. This approach yields substantial improvements in T1 and T2 precision compared to direct inner product matching, with a reported 35% reduction in the standard deviation of the T1 values in the myocardial wall (from 106ms to 69ms) and 32% reduction in the standard deviation of T2 (6.3ms to 4.3ms). Redundancy in the data has been further exploited to improve image quality in MRF with a patch-based, locally low rank reconstruction that leverages spatial redundancy in addition to temporal redundancy [24]. This approach was deployed in cMRF using the high-dimensionality, undersampled patch-based reconstruction (HD-PROST), which further exploits non-local and spectral redundancies with evidence of reduced noise and artifact in T1 and T2 maps as compared to low rank or locally low rank reconstructions [17].
Machine learning has been employed to expedite cMRF reconstruction times. Since cMRF acquisition timings can vary for each scan, a dictionary must be generated as part of the image reconstruction process. Dictionary generation using Bloch simulation can be time-consuming, therefore limiting clinical translation. Recently, machine learning has been employed to rapidly generate cMRF dictionaries [23]. After training a neural network to output a cMRF signal given inputs of T1, T2, and times between ECG-gated data acquisition in the scan, the network could produce a dictionary in 0.8 seconds compared to 158 seconds with Bloch simulation. Myocardial T1 and T2 were comparable between the neural network technique and the Bloch simulation technique, with average myocardial T1 bias of 6.1 ms and T2 bias of 0.2 ms.
Simultaneous multislice cMRF (SMS-cMRF) can potentially shorten and simplify a CMR protocol by enabling maps at several slice locations to be collected at the same time. The SMS-cMRF technique uses a multiband radiofrequency excitation with phase cycling to simultaneously excite multiple slices. Due to this phase cycling, each slice has a unique signal evolution even for the same T1 and T2 values [18]. Sampled k-space data are demodulated according to the phase cycling pattern and gridded using the non-uniform fast Fourier Transform [25] to generate multiple sets of 2D undersampled images for each slice. Separate dictionaries are generated for each slice corresponding to the appropriate radiofrequency phase cycling. Low rank reconstruction, as described previously, is applied to reconstruct the SMS-cMRF T1, T2, and M0 maps for each slice. SMS-cMRF was demonstrated to provide T1, T2, and M0 maps in three cardiac short axis slices in a single breath-held, 16-heartbeat sequence.
Cardiac cine MRF (Cine-MRF) [20] and free-running cMRF [21] have been developed to provide tissue property maps throughout the cardiac cycle while simplifying data acquisition. Both techniques use retrospective gating to generate T1, T2, and M0 maps at a target phase in the cardiac cycle. In Cine-MRF, an ECG trace is recorded while the cMRF acquisition runs according to a fixed set of radiofrequency pulse and readout timings. MR data are then binned according to cardiac phase as determined by the ECG recording. For each cardiac phase, a preliminary reconstruction is then applied using the low rank reconstruction to obtain intermediate images. The intermediate images are used to estimate motion between each cardiac phase and the target phase using nonrigid registration. Once deformation fields are obtained for each time point in the acquired data, individual image frames can be co-registered to the target phase and used for generation of T1, T2, and M0 maps. This procedure is repeated for each target phase to generate motion-resolved tissue property maps. These cardiac motion-resolved maps can be analyzed to provide ejection fraction measurements with results similar to those obtained from standard cine images. Free-running cMRF is a similar approach. A key difference is that co-registration of data from different cardiac phases is not performed. Instead, data are similarly binned according to the recorded ECG and a soft-binning method, then the binned data are subsequently used in an HD-PROST reconstruction to generate T1, T2, and M0 maps. In addition to cine images, free-running MRF can provide synthetic black myocardium and black blood images at different cardiac phases (e.g., diastole and systole). Both Cine-MRF and free-running cMRF have been demonstrated to provide simultaneous T1, T2, M0, and cine images using a single breath-held acquisition in healthy subjects. While the advantages of simplifying cMRF acquisition, and thus the CMR protocol, are apparent, a shared limitation of these approaches is that through-plane motion not accounted for in the dictionary, which may lead to bias or inconsistency in parameter estimates.
Fat-water separation methods have been reported as part of the cMRF technique. These methods can provide additional information regarding myocardial and epicardial fat, and can also improve myocardial water T1 and T2 estimation. Two approaches have been reported for fat-water separation in cMRF: a rosette trajectory-based approach [22] and a three-point Dixon approach [17]. In the rosette trajectory approach, the cMRF technique operates in the same fashion as the originally reported spiral cMRF method, with the exception that the spiral readout trajectory is replaced with a rosette trajectory. As rosette trajectories are spectrally selective [26], on-resonant water images exhibit inherent fat suppression, which improves myocardial T1 and T2 quantification. Demodulation of the acquired k-space data by the fat frequency provides water-suppressed data, which can be reconstructed into a cMRF fat image data set, where the corresponding fat T1, T2, and M0 can be determined by inner product pattern matching reconstruction. In the Dixon-cMRF technique [17], three gradient echo readouts are acquired with a golden angle incremented radial trajectory and used to perform a three-echo Dixon fat-water separation as part of the cMRF reconstruction [17]. Dictionary-based temporal compression is employed by way of the singular value decomposition to reduce undersampling artifacts and subsequently estimate a B0 map from the first singular image. Based on the B0 map and an assumed fat peak model, water T1, T2, and M0 as well as fat T1, T2, and M0 are reconstructed using the HD-PROST approach and water-fat separation. The Dixon-cMRF technique had excellent agreement with the reference 6-echo Dixon proton density fat fraction method both in a fat-water phantom and in vivo (R2>0.98).
4. Evaluation of cMRF in healthy subjects and patients
Recent studies have examined the feasibility and performance of cMRF in vivo as compared to conventional T1 and T2 mapping techniques. In a two-site study [27], cMRF and conventional techniques were evaluated at 3T in subjects. cMRF exhibited good reproducibility at both sites for both T1 (1353.9±40.4 ms vs 1346.4±36.7) and T2 (29.7±2.8 ms vs 29.6±4.2 ms). Conventional mapping techniques, specifically MOLLI for T1 mapping and steady-state free-precession (SSFP) for T2 mapping, also exhibited good reproducibility for T1 (1220.8±39.1 ms vs 1207.7±26 ms), but showed a significant difference in measured T2 values (41.6±1.6 ms vs 38.0±2.1 ms). In a recent report, T1 and T2 values collected using cMRF in a cohort of healthy subjects scanned at a single site at 1.5T were compared to conventional mapping (MOLLI and SSFP) [28]. cMRF was found to be preferable in terms of image quality to conventional mapping, while both cMRF and conventional mapping techniques had similar test-retest performance (ICC between 0.84–0.87 for all). However, conventional mapping techniques had better precision of T1 and T2 across the myocardium than cMRF (though it is uncertain if this simply reflected the result of low-pass filtering of the conventional T1 and T2 maps by the commercial software). A limited number of patient cases have demonstrated the feasibility of cMRF, and good agreement with conventional mapping, in the assessment of: hypertrophic cardiomyopathy [29], dilated cardiomyopathy [30], nonischemic cardiomyopathy [31], and heart transplant recipients [32]. Importantly, these patient cases, while limited in number, demonstrated the successful application of cMRF at multiple sites and in multiple pathologies.
5. Potential technical improvements, validation, and alternatives
As cMRF matures, additional technical improvements are foreseen, enabling its use in a variety of clinical applications. Potential technical developments and likely clinical applications are described in this section and the following section, respectively, and they are summarized in Table 3.
Table 3.
Selected examples of potential applications of cardiac MR fingerprinting and needed technical developments (in increasing order according to anticipated level of technical development)
| Application | Pathophysiology | CMRF added information | Needed developments |
|---|---|---|---|
| Infiltrative Cardiomyopathy | Myocardial deposition of misfolded protein (amyloidosis), lipids (Fabry), and iron (hemochromatosis) | Tissue characterization of associated protein deposition, lipid content, and iron | Validation of current cMRF metrics (T1, T2, fat proton density) in clinical populations, (Long-term: quantification of additional relaxometry parameters, e.g. T1ρ, MT, T2*) |
| Inflammatory Cardiomyopathy (myocarditis, pericarditis, sarcoidosis) | Inflammatory cell infiltration into the myocardium or pericardium | Tissue characterization including edema, inflammatory cell infiltration, longitudinal assessment of convalescent phase or response to therapy | Clinical validation by endomyocardial biopsy, improved resolution for imaging of pericardium |
| Heart transplant assessment | Graft rejection and coronary vasculopathy due to progressive immune /inflammatory processes; arrhythmia and graft failure due to progressive myocardial scarring and myocyte dysfunction | Tissue characterization of inflammation (edema with/without inflammatory cells), fibrosis, extracellular volume, microvascular dysfunction | Clinical validation in post-transplant patients with comparison to reference MR, endomyocardial biopsy, or serum biomarkers |
| Ischemic Cardiomyopathy | Coronary artery disease with hemodynamically significant stenosis; progressive myocardial scarring in ischemic/infarcted areas | Rest-stress cMRF for T1 reactivity | Stress cMRF imaging protocol, clinical validation in coronary artery disease patients |
| Right ventricular assessment (pulmonary hypertension, HFpEF, ARVD) | Diffuse fibrosis or fibrofatty replacement of tissue | Tissue characterization in right ventricle of fibrosis and fat content | Improved spatial resolution, fat fraction in right ventricle |
| Left atrial assessment (atrial fibrillation, HFpEF, diastolic dysfunction) | Fibrosis, inflammation, edema | Tissue characterization of the atria | Improved spatial resolution and arrhythmia insensitive imaging |
| Reducing contrast administration | Impaired kidney function, contrast sensitivity | Native cMRF to replace late gadolinium enhancement assessment | Clinical validation with established methods, e.g. late gadolinium enhancement |
| Electrophysiology (VT and AF ablation) | Fibrosis, electrical conduction abnormalities | Tissue characterization including fibrosis, fat infiltration, edema | Correlation with electrical conductivity mapping, ablation outcomes, arrhythmia insensitive imaging |
| Imaging of patients with implanted devices (ICD, pacemaker) | Devices to regulate cardiac electrical function | Tissue characterization, longitudinal monitoring | Compatibility with devices, imaging in heterogeneous magnetic fields |
5.1. Technical improvements
Validation of cMRF across MRI scanners, including across vendors, software platforms, and scanner generations, could enable wider application of cMRF including provision of information which is currently not possible with the standard cardiac mapping approaches in individual patients. As noted in the previous section, multi-site reproducibility of myocardial T1 and T2 values by cMRF has been promising [27]. Additionally, cMRF implementations exist for multiple vendors (e.g. [17] and [22]). However, cross-vendor reproducibility has yet to be assessed. Cross-scanner and cross-vendor reproducibility assessments are challenging in practice due to differences in vendors’ software architecture, different implementations of cMRF sequence components (e.g. preparation pulses and gradient trajectories), differences in data formatting prior to cMRF reconstruction, and practical considerations such as logistics. However, because implementation details for any given scanner can be incorporated into the cMRF dictionary generation, cMRF is anticipated to provide reproducible tissue property estimates across scanner platforms. If cMRF can be demonstrated to be reproducible across different MRI scanner platforms, it could become a valuable tool to assess myocardial tissue properties for a given patient longitudinally. Encouragingly, albeit with only anecdotal evidence, reproducible measurements may be possible using MRF even across scanner generations, with a scanner circa 2002 yielding comparable T1 and T2 values in white matter as compared to a scanner circa 2015 [33]. Assessing the reproducibility of cMRF myocardial T1 and T2 measurements across scanner generations would be important for longitudinal monitoring of disease progression and treatment response, particularly as institutions invest in newer hardware over time.
Further improvements in the extraction of tissue properties from cMRF data are possible, as evidenced by developments in MRF in other applications. Maximum-Likelihood reconstruction incorporates a data model and noise statistical model to determine the tissue property maps that provide the best fit to measured k-space data, resulting in improved tissue property estimation accuracy and precision as well as reduced acquisition time [34]. The MR fingerprinting deep reconstruction network (DRONE) technique uses a trained neural network to directly determine T1, T2, and proton density from the time course of a voxel with improved robustness to noise and undersampling artifacts relative to inner product pattern matching [35]. The combination of sliding window and parallel imaging within the MRF reconstruction process has been demonstrated to enable rapid, 3D, high-resolution tissue property mapping [36]. Kalman filter MRF reconstruction enables tissue property estimation on a continuous scale rather than restricted to a discrete, pre-defined dictionary [37]. Such reconstruction techniques can potentially also be extended to cMRF.
Rapid cMRF reconstruction will be necessary for clinical translation. A challenge for rapid generation of tissue property maps after data acquisition is that a unique dictionary must be generated for each scan. To address this limitation, deep learning approaches have been developed both for dictionary generation (as previously described) and for tissue property quantification [38]. Parallelization using graphical processing units can also expedite reconstruction, as demonstrated in real-time 3D cardiac MRI reconstruction via the “Gadgetron” framework [39], MRF dictionary generation [40], and MRF signal matching [41]. These techniques can reduce MRF reconstruction time to seconds, which otherwise may take up to hours, a critical consideration for clinical use.
Mapping of additional magnetic field properties and tissue properties could potentially improve cMRF-based estimation and expand its clinical utility. Integrated B0 mapping in MRF may reduce bias in water T1 and T2 estimates [42]. Incorporating B1 mapping into MRF via a Bloch-Siegert method and using this map in the MRF reconstruction can improve T1 and T2 estimates in the presence of B1 inhomogeneities [43], [44]. The “Plug-and-Play” MRF technique enables imaging in heterogeneous B1 fields, as when imaging near metallic implants [45]. Quantification of additional tissue properties could improve tissue characterization in cMRF. Apparent diffusion coefficient (ADC) mapping has been incorporated into MRF and shown to reduce T2 underestimation induced by spoiler gradients in SSFP-based MRF acquisitions [46]. Magnetization transfer (MT) can probe the macromolecular content of tissue and has been estimated by MRF, providing additional insight and also improving T1 and T2 estimation [47]. Quantitative chemical exchange saturation transfer with MRF (CEST-MRF) has been reported in an animal study [48]. Macromolecular content can also be probed by the addition of T1ρ relaxation as part of MRF [49]. Addition of T2* has been reported in a 14 second breath-held MRF protocol for liver tissue characterization [50] and could assist in the identification of iron deposition [51]. Furthermore, characterization of vascular properties has been demonstrated by MRF [52] including perfusion with arterial spin labeling MRF [53] and flow mapping by velocity encoding in MRF [54]. Lastly, MRF has the potential to provide multi-compartment relaxometry with corresponding volume fractions [55], and multi-compartment cMRF could potentially provide non-contrast extracellular volume fraction maps [56].
Given the flexibility of cMRF sequence design, an important and under-explored topic is sequence optimization for estimation of desired tissue properties. A quality factor framework has been developed to assess the expected errors in tissue property estimates when considering noise and undersampling artifacts of a sequence [57]. Optimal experiment design strategies can use quality metrics to optimize sequence parameters such as repetition times and flip angles under specified constraints [58]. While such approaches are promising, the vast range of potential variables which could be altered in cMRF sequences (including TR, TE, flip angle, preparation pulse use and timing), physiologic considerations such as motion, and complexities in MRF reconstruction approaches all present substantial challenges to optimizing cMRF sequences.
Beyond improvements in cMRF acquisition and reconstruction are post-processing considerations. In-line analysis tools will be important to readily provide physicians with pertinent information. Co-registration of cMRF maps with other CMR images could enhance the value of a CMR exam. Automated processing tools, similar in implementation and utility to those for left and right ventricular contouring and segmentation, could provide rapid visualization of tissue property values for clinical interpretation, and would provide substantial real-world clinical value from cMRF data.
5.2. Validation against histopathology
Correlation of myocardial tissue characterization by cMRF with histopathology will be necessary to confirm the association of cMRF-derived parameters with tissue alterations due to disease. While there are presently no reports of such validation with cMRF maps, there have been reports of conventional CMR tissue characterization validated against endomyocardial biopsy. In a cohort of patients receiving CMR and endomyocardial biopsy, the measured native T1 value was inversely correlated with diffuse myocardial fibrosis [59]. Further, extracellular volume as determined by pre- and post-contrast T1 mapping was closely correlated with diffuse interstitial fibrosis [60]. In dilated cardiomyopathy, elevated native myocardial T2 values were associated with the presence of inflammatory cells [61]. Similar studies correlating cMRF-based tissue property maps with endomyocardial biopsy could validate the use of this technique for myocardial tissue characterization.
5.3. Alternative multi-parametric cardiac imaging techniques
Alternative multiparametric tissue characterization methods have been developed for the heart that could be incorporated into the cMRF framework or serve a complementary role. An adaptation of the MOLLI approach using the Bloch Equation Simulation with Slice Profile Correction (BLESSPC) has been shown to precisely and reproducibly quantify myocardial T1 and T2 [62]. As compared to cMRF, this technique also uses inversion and T2-prepared, ECG-gated acquisitions to obtain T1 and T2 maps in a single breath-hold. Similar to cMRF, the use of Bloch simulations in BLESSPC overcomes known T1 inaccuracies in conventional MOLLI due to imperfect inversion efficiency and slice profile excitation. Images are also similarly acquired in an undersampled fashion, reconstructed with a compressed sensing image reconstruction algorithm, and used for pixelwise T1 and T2 estimation. In contrast to cMRF, the contrast weighting follows a more conventional inversion recovery and T2-prepared sequence design rather than the use of variable flip angle or other sequence parameters in cMRF, and tissue properties are estimated via nonlinear least square fitting rather than matching to a dictionary. Another technique is CMR Multitasking, which uses a multidynamic tensor model that can incorporate multiple dynamic processes including T1/T2 relaxation, cardiac motion, and respiratory motion. Unlike cMRF, which assumes a signal model a priori, the CMR multitasking technique incorporates a learning stage in the data acquisition and reconstruction process in a more data-driven fashion. As part of the learning stage, frequently sampled kspace data (e.g. kspace sample points near the origin) are used to determine contrast weighting and motion state dynamics, which are then used in reconstructing images for each temporal dynamic type. This technique can enable simultaneous mapping of T1 and T2, as well as motion-resolved T1 mapping without ECG information or under free-breathing conditions [63]. CMR Multitasking has also been extended to simultaneously quantify apparent diffusion coefficient (ADC) in the brain, an approach which could potentially be applied in the heart [64]. cMRF could potentially be modified to incorporate the data-driven flexibility of CMR Multitasking, striking a balance between model-based dictionary generation of MRF and data-driven learning in CMR Multitasking.
6. Potential clinical applications
6.1. Infiltrative cardiomyopathy
Infiltrative cardiomyopathies alter the composition of the myocardium, making tissue characterization by cMRF an attractive tool for identifying and monitoring disease. One example of an infiltrative disease that could potentially be better characterized by cMRF is cardiac amyloidosis, a severe condition with poor prognosis in which misfolded proteins accumulate in the extracellular matrix thus impairing cardiac function [65]. Presently, there is no single modality for comprehensive cardiac amyloidosis assessment, and so multiple separate imaging tests are required. Late gadolinium enhancement (LGE) MRI is often used to determine the presence and extent of cardiac amyloid deposition; however it is only sensitive late in the disease course, whereas diagnosis and treatment are potentially more beneficial at an earlier stage [66], [67]. Tissue characterization by CMR has shown elevated T1 values in cardiac amyloidosis validated against histology [68], and T2 has been reported to differentiate light-chain and transthyretin subtypes [6]. Quantification of T1 and T2 by cMRF could similarly detect cardiac amyloidosis, as exemplified in Figure 2, and cMRF could potentially classify the subtype, thus directing patients to appropriate therapy earlier in the disease course. Additional biomarkers such as magnetization transfer and T1ρ relaxation could potentially be used to indicate changes due to amyloid protein deposition through macromolecular effects on the magnetization properties, as in other applications [69], [70]; both contrast mechanisms have been explored in CMR [71], [72]. Similarly, cMRF tissue characterization could be used to detect elevated T1 in hypertrophic cardiomyopathy due to fibrosis, reduced T1 in Fabry disease due to lipid infiltration, or reduced T1 in hemochromatosis due to iron deposition [1]. Additional tissue properties, such as T2* mapping as described previously, can also be used to detect disease. Given the ability of cMRF to quantify multiple tissue properties simultaneously, various infiltrative cardiomyopathies could be characterized by unique clustering of T1, T2, MT, T2*, T1ρ, or other parameters. Such comprehensive tissue characterization would provide important discrimination of the etiology of underlying disease in morphologically similar myocardial appearances (phenocopies).
Figure 2.

Representative comparison of cMRF-derived T1 and T2 maps in a healthy subject and patient with diagnosed light-chain cardiac amyloidosis (AL). Myocardial T1 and T2 values were elevated in the AL patient (average T1: 1592 ms vs 1261 ms, average T2: 46.3 ms vs 31.7 ms). Additionally, thickening of the left ventricular myocardium is evident in the AL patient as compared to the healthy subject.
6.2. Inflammatory cardiomyopathy
Tissue characterization by cMRF can aid in identifying and managing inflammatory cardiomyopathies. In a recent meta-analysis of extracellular volume (ECV) and native T1 and T2 mapping, these tissue characterization measures were found to provide comparable or better detection for acute myocarditis compared to the Lake Louise Criteria [73]. Furthermore, T1 mapping has been shown to detect acute myocarditis and also to stage patients in their convalescent phase [74]. Therefore, the Lake Louise Criteria were recently updated to include both T1 and T2 mapping [75]. Native T1 and T2 can also reflect the response to anti-inflammatory treatment as in lupus myocarditis [76]. Patients with cardiac sarcoidosis, a condition where early diagnosis and intervention is key to mitigating poor prognosis, have been reported to have elevated T1, T2, and ECV compared to healthy controls [77]. Tissue characterization can potentially identify early cardiac involvement, as native T1 has been shown to be elevated in patients with sarcoidosis but no cardiac symptoms [78]. Monitoring of response to steroid therapy in sarcoidosis may be made more robust through the addition of tissue characterization of fibrosis and inflammation compared with current methods that rely only on gross overall measures such as ejection fraction.
The ability of cMRF to detect edematous tissue could aid in the diagnosis of pericarditis. Typically, fat suppressed T2 imaging in the acute setting (T2-weighted short-tau inversion recovery (STIR) images) and LGE imaging are used to detect inflammation. However, these images enable only a qualitative assessment of pericardial inflammation. T1 mapping of pericarditis has shown that native T1 values are elevated in inflammatory constrictive pericarditis [79]. Although many constrictive pericarditis patients will require pericardiectomy, anti-inflammatory treatment can be effective in sub-acute cases [80] and LGE imaging has been used to monitor treatment response [81]. Thus, cMRF with sufficiently improved spatial resolution could serve a similar role in identifying pericarditis, guiding therapy, and monitoring therapeutic response.
6.3. Heart transplant assessment
Tissue characterization by cMRF could be used to monitor the status of heart transplant recipients. For patients suspected of heart transplant rejection, tissue characterization by cMRF could potentially obviate the need for biopsy. Compared to patients without rejection, myocardial T1, T2, and ECV have recently been shown to be elevated in subtypes of transplant rejection including acute cellular rejection, antibody-mediated rejection, and biopsy-negative rejection [82], [83], with T2 providing prognostic value [82]. Myocardial T1 and ECV have been correlated with degree of fibrosis on endomyocardial biopsy from pediatric heart transplant recipients [84]. T2 and ECV from CMR have been reported to indicate potential inflammation and fibrosis, respectively, in patients with cardiac allograft vasculopathy [85]. Thus, serial monitoring of T1, T2, and ECV via cMRF could support clinical management for patients suspected of rejection or vasculopathy, or cMRF could be part of a standard assessment after heart transplantation and potentially obviate the need for other diagnostic imaging modalities.
6.4. Ischemic cardiomyopathy
As evidenced by conventional T1 mapping techniques, cMRF could be used to detect myocardial ischemia without the need for contrast material. In recent years, reports have demonstrated the potential of stress myocardial T1 mapping for detection of ischemia in coronary artery disease [7] and of microvascular dysfunction in patients without obstructive coronary artery disease [8]. The contribution of perfusion properties to alterations in stress myocardial T1 has been elucidated by Nickander et al. who demonstrated that native myocardial T1, T2, perfusion, myocardial blood volume, and ECV all increase in response to adenosine stress [9]. Due to the ability of cMRF to rapidly and simultaneously map T1 and T2, rest and stress evaluation of T1 and T2 could be performed in a shorter time with fewer breath holds than conventional techniques. Treadmill exercise [86] and in-scanner supine bicycle exercise CMR have been reported [87], and could be used to obviate the need for a pharmacologic stress agent to assess native T1 and T2 while also providing correlation with physical exertion as may be needed to reproduce symptoms such as exercise-related angina [88]. However, heart rates at peak exercise are high (potentially >160bpm), which requires tissue characterization to be rapid and reproducible across heart rate. cMRF may be useful as it is anticipated to provide stable T1 and T2 measurements independent of heart rate. Improvements to cMRF to enable a robust, free-breathing acquisition will be advantageous for this application.
6.5. Right ventricular assessment
Right ventricular assessment by cMRF could inform the diagnosis and management of pulmonary hypertension and heart failure with preserved ejection fraction (HFpEF). Right ventricular function is known to have a strong association with HFpEF, [89] and CMR has been shown to have high diagnostic accuracy for pulmonary hypertension [90]. Additionally, tissue characterization may potentially assist in the identification of arrhythmogenic right ventricle dysplasia (ARVD) by identifying diffuse fibrosis or fibrofatty replacement of normal tissue [91]; however, resolution and signal-to-noise demands make this a challenging application. High-resolution right ventricle T1 mapping has been demonstrated [92], although tissue characterization of the right ventricle remains a clinical challenge.
6.6. Left atrial assessment
Tissue characterization using cMRF could be used to detect abnormalities in the left atrial wall associated with atrial fibrillation, HFpEF, and diastolic dysfunction. In patients with atrial fibrillation, myocardial T1 has been reported to be shorter than in healthy subjects, and lower T1 was associated with lower intracardiac bipolar left atrium voltage [93]. In HFpEF and patients exhibiting diastolic dysfunction, an enlarged left atrium and impaired function have been observed by CMR with larger volumes and worse function having poorer prognosis [94].
6.7. Reducing contrast administration
Reducing or eliminating the use of gadolinium contrast material in CMR would benefit a range of patients, mitigating concerns related to gadolinium deposition as well as kidney function. Gadolinium deposits have been confirmed in the brain and other organs [95], with linear agents being associated with greater deposition than macrocyclic agents [96]. Although there are no known harms, gadolinium agents are recommended to be avoided when possible to minimize risk as well as to avoid signal changes which could confound future MRI exams. Kidney function is another concern with respect to gadolinium administration. About 40–50% of patients with heart failure have coexisting chronic renal dysfunction (glomerular filtration rate <60 mL/min/1.73m2) [97]. Additionally, while such incidents are rare, non-contrast CMR enabled by cMRF would reduce the potential for a gadolinium contrast hypersensitivity incident [98] or development of nephrogenic systemic fibrosis [99]. Presently, many patients receive repeated contrast-enhanced exams, compounding these concerns. For example, patients with recurrent pericarditis often require several follow-up CMR studies. Tissue characterization via cMRF in a non-contrast protocol may obviate the need for gadolinium contrast administration, thus minimizing potential risks.
6.8. Electrophysiology
Pre-procedural electrophysiological planning may be aided by improved tissue characterization, potentially identifying arrhythmogenic substrate such as fibrosis. Left ventricular LGE lesions have been associated with ventricular tachycardia, systolic dysfunction, and cardiac death [100]. Scar morphology and distribution have been associated with electrocardiogram features [101] and reduced conduction velocity [102], suggesting a role in guiding procedure planning with CMR. Tissue characterization using native T1 and ECV has been validated against histology for detection of diffuse fibrosis [103], and both T1 and ECV are elevated in ventricular arrhythmias even in the absence of LGE [104]. Atrial scar identified by CMR has been associated with recurrent arrhythmia, [105] and LGE scar characterization has been used to identify ventricular tachycardia channels for guidance of cardiac resynchronization therapy [106]. Thus, cMRF could potentially enable the detection of diffuse fibrosis or fibrotic lesions through T1 and ECV mapping and thus help identify conduction pathways to support planning of ablation and other interventions. Furthermore, cMRF is anticipated to be robust to arrhythmias as the exact timing of the acquisition is accounted for in dictionary generation. Thus, unlike MOLLI or other conventional mapping techniques, arrhythmia may be a more surmountable challenge than in conventional imaging, although this remains to be tested.
6.9. Imaging of patients with implanted devices
A significant proportion of patients with cardiomyopathy and arrhythmias have implanted devices, making imaging with standard MRI protocols challenging due to the presence of leads and pacing wires. These patients could significantly benefit from a device-compatible cMRF technique. Implantable cardioverter defibrillators (ICDs) comprise a large proportion of these devices, with about 150,000 implanted per year in the United States [107], and an estimated 50–75% of these patients will require an MRI examination during the lifetime of their device [108]. For patients with ICDs, T1 mapping using a wideband radiofrequency pulse has been reported [109]. Although cMRF has not yet been developed for device compatibility, “Plug-and-Play MRF” has been developed for imaging near metallic prosthetics by using heterogeneous radiofrequency fields in the MRF acquisition and obtaining simultaneous T1, T2, proton density, and B1 field maps [45]. While quantitative tissue property maps may be clinically useful themselves, this also suggests a possibility to use cMRF as an approach to reduce artifacts in conventional imaging. These successes suggest that cMRF could be developed for use in patients with implanted devices who may require CMR evaluation for monitoring of disease and clinical management.
7. Conclusions
The cMRF technique has rapidly evolved in recent years and has a range of potential applications. Developments in cMRF include slice profile and pulse efficiency corrections, simultaneous multislice imaging, advances in image reconstruction to improve mapping speed and accuracy, cine or free-running imaging, fat-water separation/quantification, and machine learning for rapid dictionary generation. Reports of cMRF at multiple sites and in multiple pathologies highlight the potential clinical translatability of this technique. Continued developments are anticipated, including further refinements to image reconstruction, acceleration of image reconstruction times to move toward online reconstruction, quantification of additional magnetic and tissue properties, simplified acquisitions, and multi-vendor, multi-scanner validation. Such technical developments should propel the cMRF technique toward a range of clinical applications that include assessment of cardiomyopathies, perfusion abnormalities, evaluation of heart transplant recipients, procedural planning for electrophysiology, high-resolution imaging of the left atrium and right ventricle, tissue characterization in patients with implanted devices, and reduced use of gadolinium contrast material. Given the continued interest in myocardial tissue characterization and the increased number of sites implementing and investigating cMRF, it is anticipated that this technique will continue to transition into clinical application.
Highlights.
Cardiac Magnetic Resonance Fingerprinting enables rapid, multiparametric imaging.
Parametric maps from accelerated acquisition and dictionary-based reconstruction.
In vivo studies suggest reproducibility of T1 and T2, and good image quality.
Technical developments: improved image quality, additional tissue property mapping.
Potential applications: characterization of cardiomyopathies, procedure planning.
Acknowledgements
This work was supported by the National Institutes of Health grant number 2R01HL094557.
Glossary of abbreviated terms
- ADC
Apparent Diffusion Coefficient
- AF
Atrial Fibrillation
- AL
Light-Chain Amyloid
- ARVD
Arrhythmogenic Right Ventricle Dysplasia
- BLESSPC
Bloch Equation Simulation with Slice Profile Correction
- CEST-MRF
Chemical Exchange Saturation Transfer Magnetic Resonance Fingerprinting
- Cine-MRF
Cine Cardiac Magnetic Resonance Fingerprinting
- CMR
Cardiovascular Magnetic Resonance
- cMRF
Cardiac Magnetic Resonance Fingerprinting
- DRONE
Deep-Learning Reconstruction Network
- ECG
Electrocardiogram
- ECV
Extracellular Volume
- HD-PROST
High-Dimensionality Undersampled Patch-Based Reconstruction
- HFpEF
Heart Failure with Preserved Ejection Fraction
- ICC
Intraclass Correlation Coefficient
- ICD
Implanted Cardiac Device
- ISMRM
International Society for Magnetic Resonance in Medicine
- LGE
Late Gadolinium Enhanced
- MOLLI
Modified Look-Locker Inversion
- MRF
Magnetic Resonance Fingerprinting
- MRI
Magnetic Resonance Imaging
- MT
Magnetization Transfer
- NIST
National Institute of Standards and Technology
- SMS-cMRF
Simultaneous Multislice Cardiac Magnetic Resonance Fingerprinting
- SSFP
Steady-State Free Precession
- STIR
Short-Tau Inversion Recovery
- TE
Echo Time (or T2 dephasing time)
- VT
Ventricular Tachycardia
- 2D
Two-Dimensional
- 3D
Three-Dimensional
Footnotes
Declaration of Competing Interest
The authors declare the following institutional agreements that could appear to influence the work reported in this paper. Eck, Flamm, Kwon, and Tang declare that the Cleveland Clinic has research agreements with Siemens Healthineers and Philips Healthcare. Prieto declares that King’s College London has research agreements with Siemens Healthineers and Philips Healthcare. Seiberlich declares that the University of Michigan has a research agreement with Siemens Healthineers.
Publisher's Disclaimer: This is a PDF file of an unedited manuscript that has been accepted for publication. As a service to our customers we are providing this early version of the manuscript. The manuscript will undergo copyediting, typesetting, and review of the resulting proof before it is published in its final form. Please note that during the production process errors may be discovered which could affect the content, and all legal disclaimers that apply to the journal pertain.
Contributor Information
Brendan L. Eck, Imaging Institute, Cleveland Clinic, 9500 Euclid Avenue, Cleveland, OH, USA 44195
Scott D. Flamm, Heart and Vascular Institute and Imaging Institute, Cleveland Clinic, 9500 Euclid Avenue, Cleveland, OH, USA 44195
Deborah H. Kwon, Heart and Vascular Institute and Imaging Institute, Cleveland Clinic, 9500 Euclid Avenue, Cleveland, OH, USA 44195
W. H. Wilson Tang, Heart and Vascular Institute, Cleveland Clinic, 9500 Euclid Avenue, Cleveland, OH, USA 44195.
Claudia Prieto Vasquez, School of Biomedical Engineering and Imaging Sciences, King’s College London, Westminster Bridge Road, London, UK.
Nicole Seiberlich, Department of Radiology, University of Michigan, 1150 West Medical Center Drive, Ann Arbor, MI 48109, USA.
References
- [1].Bulluck H. et al. , “Myocardial T1 Mapping,” Circ. J, vol. 79, no. 3, pp. 487–494, 2015, doi: 10.1253/circj.CJ-15-0054. [DOI] [PubMed] [Google Scholar]
- [2].Messroghli DR et al. , “Clinical recommendations for cardiovascular magnetic resonance mapping of T1, T2, T2* and extracellular volume: A consensus statement by the Society for Cardiovascular Magnetic Resonance (SCMR) endorsed by the European Association for Cardiovascular Imaging (EACVI),” J. Cardiovasc. Magn. Reson, vol. 19, no. 1, p. 75, October. 2017, doi: 10.1186/s12968-017-0389-8. [DOI] [PMC free article] [PubMed] [Google Scholar]
- [3].Radunski UK et al. , “T1 and T2 mapping cardiovascular magnetic resonance imaging techniques reveal unapparent myocardial injury in patients with myocarditis,” Clin. Res. Cardiol, vol. 106, no. 1, pp. 10–17, January. 2017, doi: 10.1007/s00392-016-1018-5. [DOI] [PubMed] [Google Scholar]
- [4].Karamitsos TD et al. , “Noncontrast T1 Mapping for the Diagnosis of Cardiac Amyloidosis,” JACC Cardiovasc. Imaging, vol. 6, no. 4, pp. 488–497, April. 2013, doi: 10.1016/j.jcmg.2012.11.013. [DOI] [PubMed] [Google Scholar]
- [5].Fontana M. et al. , “Native T1 Mapping in Transthyretin Amyloidosis,” JACC Cardiovasc. Imaging, vol. 7, no. 2, pp. 157–165, February. 2014, doi: 10.1016/j.jcmg.2013.10.008. [DOI] [PubMed] [Google Scholar]
- [6].Ridouani F. et al. , “Myocardial native T2 measurement to differentiate light-chain and transthyretin cardiac amyloidosis and assess prognosis,” J. Cardiovasc. Magn. Reson, vol. 20, no. 1, p. 58, August. 2018, doi: 10.1186/s12968-018-0478-3. [DOI] [PMC free article] [PubMed] [Google Scholar]
- [7].Bohnen S. et al. , “Stress T1-mapping cardiovascular magnetic resonance imaging and inducible myocardial ischemia,” Clin. Res. Cardiol, vol. 108, no. 8, pp. 909–920, August. 2019, doi: 10.1007/s00392-019-01421-1. [DOI] [PubMed] [Google Scholar]
- [8].Levelt E. et al. , “Adenosine stress CMR T1-mapping detects early microvascular dysfunction in patients with type 2 diabetes mellitus without obstructive coronary artery disease,” J. Cardiovasc. Magn. Reson, vol. 19, no. 1, p. 81, October. 2017, doi: 10.1186/s12968-017-0397-8. [DOI] [PMC free article] [PubMed] [Google Scholar]
- [9].Nickander J. et al. , “The relative contributions of myocardial perfusion, blood volume and extracellular volume to native T1 and native T2 at rest and during adenosine stress in normal physiology,” J. Cardiovasc. Magn. Reson, vol. 21, no. 1, p. 73, November. 2019, doi: 10.1186/s12968-019-0585-9. [DOI] [PMC free article] [PubMed] [Google Scholar]
- [10].Teixeira T, Hafyane T, Stikov N, Akdeniz C, Greiser A, and Friedrich MG, “Comparison of different cardiovascular magnetic resonance sequences for native myocardial T1 mapping at 3T,” J. Cardiovasc. Magn. Reson, vol. 18, no. 1, p. 65, October. 2016, doi: 10.1186/s12968-016-0286-6. [DOI] [PMC free article] [PubMed] [Google Scholar]
- [11].Shao J, Liu D, Sung K, Nguyen K-L, and Hu P, “Accuracy, precision, and reproducibility of myocardial T1 mapping: A comparison of four T1 estimation algorithms for modified look-locker inversion recovery (MOLLI),” Magn. Reson. Med, vol. 78, no. 5, pp. 1746–1756, 2017, doi: 10.1002/mrm.26565. [DOI] [PMC free article] [PubMed] [Google Scholar]
- [12].Roujol S. et al. , “Accuracy, Precision, and Reproducibility of Four T1 Mapping Sequences: A Head-to-Head Comparison of MOLLI, ShMOLLI, SASHA, and SAPPHIRE,” Radiology, vol. 272, no. 3, pp. 683–689, April. 2014, doi: 10.1148/radiol.14140296. [DOI] [PMC free article] [PubMed] [Google Scholar]
- [13].Hamilton JI et al. , “MR fingerprinting for rapid quantification of myocardial T1, T2, and proton spin density,” Magn. Reson. Med, vol. 77, no. 4, pp. 1446–1458, 2017. [DOI] [PMC free article] [PubMed] [Google Scholar]
- [14].Ma D. et al. , “Magnetic resonance fingerprinting,” Nature, vol. 495, no. 7440, p. 187, 2013. [DOI] [PMC free article] [PubMed] [Google Scholar]
- [15].Hamilton JI et al. , “Investigating and reducing the effects of confounding factors for robust T1 and T2 mapping with cardiac MR fingerprinting,” Magn. Reson. Imaging, vol. 53, pp. 40–51, 2018. [DOI] [PMC free article] [PubMed] [Google Scholar]
- [16].Hamilton JI et al. , “Low Rank Compressed Sensing Reconstruction for More Precise Cardiac MRF Measurements,” presented at the International Society for Magnetic Resonance in Medicine, Honolulu, HI, USA, April. 2017. [Google Scholar]
- [17].Jaubert O. et al. , “Water–fat Dixon cardiac magnetic resonance fingerprinting,” Magn. Reson. Med, vol. 83, no. 6, pp. 2107–2123, 2020, doi: 10.1002/mrm.28070. [DOI] [PMC free article] [PubMed] [Google Scholar]
- [18].Hamilton JI et al. , “Simultaneous multislice cardiac magnetic resonance fingerprinting using low rank reconstruction,” NMR Biomed., p. e4041, 2018. [DOI] [PMC free article] [PubMed] [Google Scholar]
- [19].Cruz G. et al. , “3D free-breathing cardiac magnetic resonance fingerprinting,” NMR Biomed., vol. n/a, no. n/a, p. e4370, doi: 10.1002/nbm.4370. [DOI] [PubMed] [Google Scholar]
- [20].Hamilton JI, Jiang Y, Eck B, Griswold M, and Seiberlich N, “Cardiac cine magnetic resonance fingerprinting for combined ejection fraction, T1 and T2 quantification,” NMR Biomed., p. e4323, 2020. [DOI] [PMC free article] [PubMed] [Google Scholar]
- [21].Jaubert O. et al. , “Free-running cardiac magnetic resonance fingerprinting: Joint T1/T2 map and Cine imaging,” Magn. Reson. Imaging, vol. 68, pp. 173–182, May 2020, doi: 10.1016/j.mri.2020.02.005. [DOI] [PMC free article] [PubMed] [Google Scholar]
- [22].Liu Y, Hamilton J, Eck B, Griswold M, and Seiberlich N, “Myocardial T1 and T2 quantification and water–fat separation using cardiac MR fingerprinting with rosette trajectories at 3T and 1.5 T,” Magn. Reson. Med. [DOI] [PMC free article] [PubMed] [Google Scholar]
- [23].Hamilton JI and Seiberlich N, “Machine Learning for Rapid Magnetic Resonance Fingerprinting Tissue Property Quantification,” Proc. IEEE, vol. 108, no. 1, pp. 69–85, January. 2020, doi: 10.1109/JPROC.2019.2936998. [DOI] [PMC free article] [PubMed] [Google Scholar]
- [24].Bustin A, da Cruz GL, Jaubert O, Lopez K, Botnar RM, and Prieto C, “High-dimensionality undersampled patch-based reconstruction (HD-PROST) for accelerated multi-contrast MRI,” Magn. Reson. Med, vol. 81, no. 6, pp. 3705–3719, 2019, doi: 10.1002/mrm.27694. [DOI] [PMC free article] [PubMed] [Google Scholar]
- [25].Fessler JA and Sutton BP, “Nonuniform fast Fourier transforms using min-max interpolation,” 2003. [Google Scholar]
- [26].Noll DC, “Multishot rosette trajectories for spectrally selective MR imaging,” IEEE Trans. Med. Imaging, vol. 16, no. 4, pp. 372–377, August. 1997, doi: 10.1109/42.611345. [DOI] [PubMed] [Google Scholar]
- [27].Liu Y, Hopman LHGA, Hamilton J, Hillier E, Friedrich M, and Seiberlich N, “Inter-site Reproducibility of Cardiac Magnetic Resonance Fingerprinting T1 and T2 Quantification in the ISMRM/NIST MRI System Phantom and Human Heart,” presented at the 27th ISMRM Annual Meeting, Montreal, Canada, May 2019. [Google Scholar]
- [28].Hamilton JI et al. , “Simultaneous Mapping of T1 and T2 Using Cardiac Magnetic Resonance Fingerprinting in a Cohort of Healthy Subjects at 1.5T,” J. Magn. Reson. Imaging, vol. n/a, no. n/a, doi: 10.1002/jmri.27155. [DOI] [PMC free article] [PubMed] [Google Scholar]
- [29].Wintersperger BJ et al. , “Quantitative Multiparametric Myocardial Evaluation in Hypertrophic Cardiomyopathy using Cardiac Magnetic Resonance Fingerprinting: Comparison to Conventional Cardiac Relaxometry,” presented at the International Society of Magnetic Resonance in Medicine, Montreal, Canada, 2019. [Google Scholar]
- [30].Liu Y, Hamilton J, Rajagopalan S, and Seiberlich N, “Cardiac Magnetic Resonance Fingerprinting: Technical Overview and Initial Results,” JACC Cardiovasc. Imaging, vol. 11, no. 12, pp. 1837–1853, December. 2018, doi: 10.1016/j.jcmg.2018.08.028. [DOI] [PMC free article] [PubMed] [Google Scholar]
- [31].Cavallo AU et al. , “CMR Fingerprinting for Myocardial T1, T2, and ECV Quantification in Patients With Nonischemic Cardiomyopathy,” JACC Cardiovasc. Imaging, vol. 12, no. 8 Part 1, pp. 1584–1585, 2019. [DOI] [PubMed] [Google Scholar]
- [32].Coristine AJ, Hamilton J, van Heeswijk RB, Hullin R, and Seiberlich N, “Cardiac Magnetic Resonance Fingerprinting in Heart Transplant Recipients,” presented at the International Society of Magnetic Resonance in Medicine, Montreal, Canada, 2019. [Google Scholar]
- [33].Eck BL, Lo W-C, Jiang Y, Liu K, Gulani V, and Seiberlich N, “Increasing the Value of Legacy MRI Scanners with Magnetic Resonance Fingerprinting,” presented at the International Society of Magnetic Resonance in Medicine, Montreal, Canada, 2019. [Google Scholar]
- [34].Zhao B, Setsompop K, Ye H, Cauley SF, and Wald LL, “Maximum likelihood reconstruction for magnetic resonance fingerprinting,” IEEE Trans. Med. Imaging, vol. 35, no. 8, pp. 1812–1823, 2016. [DOI] [PMC free article] [PubMed] [Google Scholar]
- [35].Cohen O, Zhu B, and Rosen MS, “MR fingerprinting Deep RecOnstruction NEtwork (DRONE),” Magn. Reson. Med, vol. 80, no. 3, pp. 885–894, 2018, doi: 10.1002/mrm.27198. [DOI] [PMC free article] [PubMed] [Google Scholar]
- [36].Liao C. et al. , “3D MR fingerprinting with accelerated stack-of-spirals and hybrid sliding-window and GRAPPA reconstruction,” NeuroImage, vol. 162, pp. 13–22, November. 2017, doi: 10.1016/j.neuroimage.2017.08.030. [DOI] [PMC free article] [PubMed] [Google Scholar]
- [37].Zhang X, Zhou Z, Chen S, Chen S, Li R, and Hu X, “MR fingerprinting reconstruction with Kalman filter,” Magn. Reson. Imaging, vol. 41, pp. 53–62, September. 2017, doi: 10.1016/j.mri.2017.04.004. [DOI] [PubMed] [Google Scholar]
- [38].Yang M, Jiang Y, Ma D, Mehta BB, and Griswold MA, “Game of learning Bloch equation simulations for MR fingerprinting,” ArXiv Prepr. ArXiv200402270, 2020. [Google Scholar]
- [39].Franson D. et al. , “Real-time 3D cardiac MRI using through-time radial GRAPPA and GPU-enabled reconstruction pipelines in the Gadgetron framework,” presented at the 27th ISMRM Annual Meeting, Montreal, Canada, May 2019. [Google Scholar]
- [40].Dupuis A, Ma D, and Griswold MA, “MRF Dictionary Calculation and Visualization using GPU Compute Shaders,” presented at the 27th ISMRM Annual Meeting, Montreal, Canada, May 2019. [Google Scholar]
- [41].Wang D, Ostenson J, and Smith DS, “snapMRF: GPU-accelerated magnetic resonance fingerprinting dictionary generation and matching using extended phase graphs,” Magn. Reson. Imaging, vol. 66, pp. 248–256, February. 2020, doi: 10.1016/j.mri.2019.11.015. [DOI] [PMC free article] [PubMed] [Google Scholar]
- [42].Ostenson J, Damon BM, and Welch EB, “MR fingerprinting with simultaneous T1, T2, and fat signal fraction estimation with integrated B0 correction reduces bias in water T1 and T2 estimates,” Magn. Reson. Imaging, vol. 60, pp. 7–19, July. 2019, doi: 10.1016/j.mri.2019.03.017. [DOI] [PMC free article] [PubMed] [Google Scholar]
- [43].Chen Y. et al. , “MR Fingerprinting for Rapid Quantitative Abdominal Imaging,” Radiology, vol. 279, no. 1, pp. 278–286, January. 2016, doi: 10.1148/radiol.2016152037. [DOI] [PMC free article] [PubMed] [Google Scholar]
- [44].Buonincontri G. and Sawiak SJ, “MR fingerprinting with simultaneous B1 estimation,” Magn. Reson. Med, vol. 76, no. 4, pp. 1127–1135, 2016, doi: 10.1002/mrm.26009. [DOI] [PMC free article] [PubMed] [Google Scholar]
- [45].Cloos MA et al. , “Multiparametric imaging with heterogeneous radiofrequency fields,” Nat. Commun., vol. 7, no. 1, Art. no. 1, August. 2016, doi: 10.1038/ncomms12445. [DOI] [PMC free article] [PubMed] [Google Scholar]
- [46].Kobayashi Y. and Terada Y, “Diffusion-weighting Caused by Spoiler Gradients in the Fast Imaging with Steady-state Precession Sequence May Lead to Inaccurate T2 Measurements in MR Fingerprinting,” Magn. Reson. Med. Sci. MRMS Off. J. Jpn. Soc. Magn. Reson. Med, vol. 18, no. 1, pp. 96–104, January. 2019, doi: 10.2463/mrms.tn.2018-0027. [DOI] [PMC free article] [PubMed] [Google Scholar]
- [47].Hilbert T. et al. , “Mitigating the Effect of Magnetization Transfer in Magnetic Resonance Fingerprinting,” presented at the International Society of Magnetic Resonance in Medicine, Montreal, Canada, 2019. [DOI] [PMC free article] [PubMed] [Google Scholar]
- [48].Cohen O, Huang S, McMahon MT, Rosen MS, and Farrar CT, “Rapid and quantitative chemical exchange saturation transfer (CEST) imaging with magnetic resonance fingerprinting (MRF),” Magn. Reson. Med, vol. 80, no. 6, pp. 2449–2463, 2018, doi: 10.1002/mrm.27221. [DOI] [PMC free article] [PubMed] [Google Scholar]
- [49].Wyatt CR, Barbara TM, and Guimaraes AR, “T1ρ magnetic resonance fingerprinting,” NMR Biomed., vol. n/a, no. n/a, p. e4284, doi: 10.1002/nbm.4284. [DOI] [PMC free article] [PubMed] [Google Scholar]
- [50].Jaubert O. et al. , “Multi-parametric liver tissue characterization using MR fingerprinting: Simultaneous T1, T2, T2*, and fat fraction mapping,” Magn. Reson. Med, vol. 84, no. 5, pp. 2625–2635, 2020, doi: 10.1002/mrm.28311. [DOI] [PubMed] [Google Scholar]
- [51].He T, “Cardiovascular magnetic resonance T2* for tissue iron assessment in the heart,” Quant. Imaging Med. Surg, vol. 4, no. 5, pp. 407–412, October. 2014, doi: 10.3978/j.issn.22234292.2014.10.05. [DOI] [PMC free article] [PubMed] [Google Scholar]
- [52].Christen T. et al. , “MR vascular fingerprinting: A new approach to compute cerebral blood volume, mean vessel radius, and oxygenation maps in the human brain,” NeuroImage, vol. 89, pp. 262–270, April. 2014, doi: 10.1016/j.neuroimage.2013.11.052. [DOI] [PMC free article] [PubMed] [Google Scholar]
- [53].Wright KL et al. , “Estimation of perfusion properties with MR Fingerprinting Arterial Spin Labeling,” Magn. Reson. Imaging, vol. 50, pp. 68–77, July. 2018, doi: 10.1016/j.mri.2018.03.011. [DOI] [PMC free article] [PubMed] [Google Scholar]
- [54].Flassbeck S, Schmidt S, Bachert P, Ladd ME, and Schmitter S, “Flow MR fingerprinting,” Magn. Reson. Med, vol. 81, no. 4, pp. 2536–2550, 2019. [DOI] [PubMed] [Google Scholar]
- [55].McGivney D. et al. , “Bayesian estimation of multicomponent relaxation parameters in magnetic resonance fingerprinting,” Magn. Reson. Med, vol. 80, no. 1, pp. 159–170, 2018, doi: 10.1002/mrm.27017. [DOI] [PMC free article] [PubMed] [Google Scholar]
- [56].Hamilton JI, Griswold MA, and Seiberlich N, “MR Fingerprinting with chemical exchange (MRF-X) to quantify subvoxel T1 and extracellular volume fraction,” J. Cardiovasc. Magn. Reson, vol. 17, no. Suppl 1, p. W35, February. 2015, doi: 10.1186/1532-429X-17-S1-W35. [DOI] [Google Scholar]
- [57].Kara D, Fan M, Hamilton J, Griswold M, Seiberlich N, and Brown R, “Parameter map error due to normal noise and aliasing artifacts in MR fingerprinting,” Magn. Reson. Med, vol. 81, no. 5, pp. 3108–3123, 2019, doi: 10.1002/mrm.27638. [DOI] [PMC free article] [PubMed] [Google Scholar]
- [58].Zhao B. et al. , “Optimal Experiment Design for Magnetic Resonance Fingerprinting: Cramér-Rao Bound Meets Spin Dynamics,” IEEE Trans. Med. Imaging, vol. 38, no. 3, pp. 844–861, March. 2019, doi: 10.1109/TMI.2018.2873704. [DOI] [PMC free article] [PubMed] [Google Scholar]
- [59].Sibley CT et al. , “T1 Mapping in Cardiomyopathy at Cardiac MR: Comparison with Endomyocardial Biopsy,” Radiology, vol. 265, no. 3, pp. 724–732, December. 2012, doi: 10.1148/radiol.12112721. [DOI] [PMC free article] [PubMed] [Google Scholar]
- [60].de C. de Ravenstein Meester et al. , “Histological Validation of measurement of diffuse interstitial myocardial fibrosis by myocardial extravascular volume fraction from Modified Look-Locker imaging (MOLLI) T1 mapping at 3 T,” J. Cardiovasc. Magn. Reson, vol. 17, no. 1, p. 48, June. 2015, doi: 10.1186/s12968-015-0150-0. [DOI] [PMC free article] [PubMed] [Google Scholar]
- [61].Spieker M. et al. , “T2 mapping cardiovascular magnetic resonance identifies the presence of myocardial inflammation in patients with dilated cardiomyopathy as compared to endomyocardial biopsy,” Eur. Heart J. - Cardiovasc. Imaging, vol. 19, no. 5, pp. 574–582, May 2018, doi: 10.1093/ehjci/jex230. [DOI] [PubMed] [Google Scholar]
- [62].Shao J, Zhou Z, Nguyen K-L, Finn JP, and Hu P, “Accurate, precise, simultaneous myocardial T1 and T2 mapping using a radial sequence with inversion recovery and T2 preparation,” NMR Biomed., vol. 32, no. 11, p. e4165, 2019, doi: 10.1002/nbm.4165. [DOI] [PMC free article] [PubMed] [Google Scholar]
- [63].Christodoulou AG et al. , “Magnetic resonance multitasking for motion-resolved quantitative cardiovascular imaging,” Nat. Biomed. Eng, vol. 2, no. 4, pp. 215–226, April. 2018, doi: 10.1038/s41551-018-0217-y. [DOI] [PMC free article] [PubMed] [Google Scholar]
- [64].Ma S. et al. , “Three-dimensional simultaneous brain T1, T2, and ADC mapping with MR Multitasking,” Magn. Reson. Med, vol. 84, no. 1, pp. 72–88, 2020, doi: 10.1002/mrm.28092. [DOI] [PMC free article] [PubMed] [Google Scholar]
- [65].Banypersad Sanjay M, Moon James C, Whelan Carol, Hawkins Philip N., and Wechalekar Ashutosh D., “Updates in Cardiac Amyloidosis: A Review,” J. Am. Heart Assoc, vol. 1, no. 2, p. e000364, doi: 10.1161/JAHA.111.000364. [DOI] [PMC free article] [PubMed] [Google Scholar]
- [66].Marianna Fontana et al. , “Prognostic Value of Late Gadolinium Enhancement Cardiovascular Magnetic Resonance in Cardiac Amyloidosis,” Circulation, vol. 132, no. 16, pp. 1570–1579, October. 2015, doi: 10.1161/CIRCULATIONAHA.115.016567. [DOI] [PMC free article] [PubMed] [Google Scholar]
- [67].Martinez-Naharro A. et al. , “Magnetic Resonance in Transthyretin Cardiac Amyloidosis,” J. Am. Coll. Cardiol, vol. 70, no. 4, pp. 466–477, July. 2017, doi: 10.1016/j.jacc.2017.05.053. [DOI] [PubMed] [Google Scholar]
- [68].Duca F. et al. , “Cardiac Magnetic Resonance T1 Mapping in Cardiac Amyloidosis,” JACC Cardiovasc. Imaging, August. 2018, doi: 10.1016/j.jcmg.2018.06.010. [DOI] [PubMed] [Google Scholar]
- [69].Haris M. et al. , “T1rho MRI and CSF biomarkers in diagnosis of Alzheimer’s disease,” NeuroImage Clin., vol. 7, pp. 598–604, January. 2015, doi: 10.1016/j.nicl.2015.02.016. [DOI] [PMC free article] [PubMed] [Google Scholar]
- [70].Kollmer J. et al. , “Magnetization transfer ratio quantifies polyneuropathy in hereditary transthyretin amyloidosis,” Ann. Clin. Transl. Neurol, vol. n/a, no. n/a, doi: 10.1002/acn3.51049. [DOI] [PMC free article] [PubMed] [Google Scholar]
- [71].Duan C. et al. , “Non-contrast myocardial infarct scar assessment using a hybrid native T1 and magnetization transfer imaging sequence at 1.5T,” Magn. Reson. Med, vol. 81, no. 5, pp. 3192–3201, 2019, doi: 10.1002/mrm.27636. [DOI] [PMC free article] [PubMed] [Google Scholar]
- [72].Qi H. et al. , “Free-running 3D whole heart myocardial T1 mapping with isotropic spatial resolution,” Magn. Reson. Med, vol. 82, no. 4, pp. 1331–1342, 2019, doi: 10.1002/mrm.27811. [DOI] [PMC free article] [PubMed] [Google Scholar]
- [73].Pan Jonathan A, Lee Yoo Jin, and Salerno Michael, “Diagnostic Performance of Extracellular Volume, Native T1, and T2 Mapping Versus Lake Louise Criteria by Cardiac Magnetic Resonance for Detection of Acute Myocarditis,” Circ. Cardiovasc. Imaging, vol. 11, no. 7, p. e007598, July. 2018, doi: 10.1161/CIRCIMAGING.118.007598. [DOI] [PMC free article] [PubMed] [Google Scholar]
- [74].Hinojar R. et al. , “Native T1 in Discrimination of Acute and Convalescent Stages in Patients With Clinical Diagnosis of Myocarditis: A Proposed Diagnostic Algorithm Using CMR,” JACC Cardiovasc. Imaging, vol. 8, no. 1, pp. 37–46, January. 2015, doi: 10.1016/j.jcmg.2014.07.016. [DOI] [PubMed] [Google Scholar]
- [75].Ferreira VM et al. , “Cardiovascular Magnetic Resonance in Nonischemic Myocardial Inflammation: Expert Recommendations,” J. Am. Coll. Cardiol, vol. 72, no. 24, pp. 3158–3176, 18 2018, doi: 10.1016/j.jacc.2018.09.072. [DOI] [PubMed] [Google Scholar]
- [76].Hinojar R. et al. , “Native T1 and T2 mapping by CMR in lupus myocarditis: Disease recognition and response to treatment,” Int. J. Cardiol, vol. 222, pp. 717–726, November. 2016, doi: 10.1016/j.ijcard.2016.07.182. [DOI] [PubMed] [Google Scholar]
- [77].Greulich S. et al. , “Comprehensive Cardiovascular Magnetic Resonance Assessment in Patients With Sarcoidosis and Preserved Left Ventricular Ejection Fraction,” Circ. Cardiovasc. Imaging, vol. 9, no. 11, November. 2016, doi: 10.1161/CIRCIMAGING.116.005022. [DOI] [PubMed] [Google Scholar]
- [78].Puntmann VO, Isted A, Hinojar R, Foote L, Carr-White G, and Nagel E, “T1 and T2 Mapping in Recognition of Early Cardiac Involvement in Systemic Sarcoidosis,” Radiology, vol. 285, no. 1, pp. 63–72, April. 2017, doi: 10.1148/radiol.2017162732. [DOI] [PubMed] [Google Scholar]
- [79].Michael Chetrit et al. , “Abstract 13990: Will Native T1-Mapping of the Pericardium Replace Late Gadolinium Enhancement?,” Circulation, vol. 140, no. Suppl_1, pp. A13990–A13990, November. 2019, doi: 10.1161/circ.140.suppl_1.13990. [DOI] [Google Scholar]
- [80].Miranda WR and Oh JK, “Constrictive Pericarditis: A Practical Clinical Approach,” Prog. Cardiovasc. Dis, vol. 59, no. 4, pp. 369–379, January. 2017, doi: 10.1016/j.pcad.2016.12.008. [DOI] [PubMed] [Google Scholar]
- [81].Feng DaLi et al. , “Cardiac Magnetic Resonance Imaging Pericardial Late Gadolinium Enhancement and Elevated Inflammatory Markers Can Predict the Reversibility of Constrictive Pericarditis After Anti-inflammatory Medical Therapy,” Circulation, vol. 124, no. 17, pp. 1830–1837, October. 2011, doi: 10.1161/CIRCULATIONAHA.111.026070. [DOI] [PubMed] [Google Scholar]
- [82].Miller RJH et al. , “Quantitative myocardial tissue characterization by cardiac magnetic resonance in heart transplant patients with suspected cardiac rejection,” Clin. Transplant, vol. 33, no. 10, p. e13704, October. 2019, doi: 10.1111/ctr.13704. [DOI] [PMC free article] [PubMed] [Google Scholar]
- [83].Dolan RS et al. , “Multiparametric Cardiac Magnetic Resonance Imaging Can Detect Acute Cardiac Allograft Rejection After Heart Transplantation,” JACC Cardiovasc. Imaging, vol. 12, no. 8, Part 2, pp. 1632–1641, August. 2019, doi: 10.1016/j.jcmg.2019.01.026. [DOI] [PMC free article] [PubMed] [Google Scholar]
- [84].Ide S. et al. , “Histological validation of cardiovascular magnetic resonance T1 mapping markers of myocardial fibrosis in paediatric heart transplant recipients,” J. Cardiovasc. Magn. Reson, vol. 19, no. 1, p. 10, February. 2017, doi: 10.1186/s12968-017-0326-x. [DOI] [PMC free article] [PubMed] [Google Scholar]
- [85].Abbasi MA et al. , “Cardiac Allograft Vasculopathy Post Heart Transplantation: MRI Structural Parameters in Patients Trending towards Restrictive Physiology,” J. Card. Fail, vol. 25, no. 8, p. S37, August. 2019, doi: 10.1016/j.cardfail.2019.07.102. [DOI] [Google Scholar]
- [86].Raman Subha V. et al. , “Diagnostic Performance of Treadmill Exercise Cardiac Magnetic Resonance: The Prospective, Multicenter Exercise CMR’s Accuracy for Cardiovascular Stress Testing (EXACT) Trial,” J. Am. Heart Assoc, vol. 5, no. 8, p. e003811, doi: 10.1161/JAHA.116.003811. [DOI] [PMC free article] [PubMed] [Google Scholar]
- [87].Le T-T et al. , “Assessing exercise cardiac reserve using real-time cardiovascular magnetic resonance,” J. Cardiovasc. Magn. Reson, vol. 19, no. 1, p. 7, January. 2017, doi: 10.1186/s12968-0170322-1. [DOI] [PMC free article] [PubMed] [Google Scholar]
- [88].Nakamori S. et al. , “Changes in Myocardial Native T1 and T2 After Exercise Stress: A Noncontrast CMR Pilot Study,” JACC Cardiovasc. Imaging, vol. 13, no. 3, pp. 667–680, March. 2020, doi: 10.1016/j.jcmg.2019.05.019. [DOI] [PubMed] [Google Scholar]
- [89].Ghio S, Raineri C, Scelsi L, Ašanin M, Polovina M, and Seferovic P, “Pulmonary hypertension and right ventricular remodeling in HFpEF and HFrEF,” Heart Fail. Rev, vol. 25, no. 1, pp. 85–91, January. 2020, doi: 10.1007/s10741-019-09810-4. [DOI] [PubMed] [Google Scholar]
- [90].Johns CS et al. , “Diagnosis of Pulmonary Hypertension with Cardiac MRI: Derivation and Validation of Regression Models,” Radiology, vol. 290, no. 1, pp. 61–68, October. 2018, doi: 10.1148/radiol.2018180603. [DOI] [PMC free article] [PubMed] [Google Scholar]
- [91].“Diagnosis of Arrhythmogenic Right Ventricular Cardiomyopathy: Progress and Pitfalls,” Heart Lung Circ., vol. 27, no. 11, pp. 1310–1317, November. 2018, doi: 10.1016/j.hlc.2018.03.023. [DOI] [PubMed] [Google Scholar]
- [92].Mehta BB, Chen X, Bilchick KC, Salerno M, and Epstein FH, “Accelerated and navigator-gated look-locker imaging for cardiac t1 estimation (ANGIE): Development and application to T1 mapping of the right ventricle,” Magn. Reson. Med, vol. 73, no. 1, pp. 150–160, 2015, doi: 10.1002/mrm.25100. [DOI] [PMC free article] [PubMed] [Google Scholar]
- [93].Beinart R. et al. , “Cardiac magnetic resonance T1 mapping of left atrial myocardium,” Heart Rhythm, vol. 10, no. 9, pp. 1325–1331, September. 2013, doi: 10.1016/j.hrthm.2013.05.003. [DOI] [PMC free article] [PubMed] [Google Scholar]
- [94].Cameli M, Mandoli GE, and Mondillo S, “Left atrium: the last bulwark before overt heart failure,” Heart Fail. Rev, vol. 22, no. 1, pp. 123–131, January. 2017, doi: 10.1007/s10741-016-9589-9. [DOI] [PubMed] [Google Scholar]
- [95].Tedeschi E, Caranci F, Giordano F, Angelini V, Cocozza S, and Brunetti A, “Gadolinium retention in the body: what we know and what we can do,” Radiol. Med. (Torino), vol. 122, no. 8, pp. 589–600, August. 2017, doi: 10.1007/s11547-017-0757-3. [DOI] [PubMed] [Google Scholar]
- [96].Gulani V, Calamante F, Shellock FG, Kanal E, and Reeder SB, “Gadolinium deposition in the brain: summary of evidence and recommendations,” Lancet Neurol., vol. 16, no. 7, pp. 564–570, July. 2017, doi: 10.1016/S1474-4422(17)30158-8. [DOI] [PubMed] [Google Scholar]
- [97].Schefold JC, Filippatos G, Hasenfuss G, Anker SD, and von Haehling S, “Heart failure and kidney dysfunction: epidemiology, mechanisms and management,” Nat. Rev. Nephrol, vol. 12, no. 10, Art. no. 10, October. 2016, doi: 10.1038/nrneph.2016.113. [DOI] [PubMed] [Google Scholar]
- [98].Jung J-W et al. , “Immediate Hypersensitivity Reaction to Gadolinium-based MR Contrast Media,” Radiology, vol. 264, no. 2, pp. 414–422, August. 2012, doi: 10.1148/radiol.12112025. [DOI] [PubMed] [Google Scholar]
- [99].Hazelton JM, Chiu MK, and Abujudeh HH, “Nephrogenic Systemic Fibrosis: A Review of History, Pathophysiology, and Current Guidelines,” Curr. Radiol. Rep, vol. 7, no. 2, p. 5, February. 2019, doi: 10.1007/s40134-019-0312-1. [DOI] [Google Scholar]
- [100].Halliday Brian P. et al. , “Association Between Midwall Late Gadolinium Enhancement and Sudden Cardiac Death in Patients With Dilated Cardiomyopathy and Mild and Moderate Left Ventricular Systolic Dysfunction,” Circulation, vol. 135, no. 22, pp. 2106–2115, May 2017, doi: 10.1161/CIRCULATIONAHA.116.026910. [DOI] [PMC free article] [PubMed] [Google Scholar]
- [101].Takeshi Sasaki et al. , “Impact of Nonischemic Scar Features on Local Ventricular Electrograms and Scar-Related Ventricular Tachycardia Circuits in Patients With Nonischemic Cardiomyopathy,” Circ. Arrhythm. Electrophysiol, vol. 6, no. 6, pp. 1139–1147, December. 2013, doi: 10.1161/CIRCEP.113.000159. [DOI] [PMC free article] [PubMed] [Google Scholar]
- [102].Jihye Jang et al. , “Local Conduction Velocity in the Presence of Late Gadolinium Enhancement and Myocardial Wall Thinning,” Circ. Arrhythm. Electrophysiol, vol. 12, no. 5, p. e007175, May 2019, doi: 10.1161/CIRCEP.119.007175. [DOI] [PMC free article] [PubMed] [Google Scholar]
- [103].Nakamori S. et al. , “Native T1 Mapping and Extracellular Volume Mapping for the Assessment of Diffuse Myocardial Fibrosis in Dilated Cardiomyopathy,” JACC Cardiovasc. Imaging, vol. 11, no. 1, pp. 48–59, January. 2018, doi: 10.1016/j.jcmg.2017.04.006. [DOI] [PubMed] [Google Scholar]
- [104].Nakamori S. et al. , “Increased myocardial native T1 relaxation time in patients with nonischemic dilated cardiomyopathy with complex ventricular arrhythmia,” J. Magn. Reson. Imaging, vol. 47, no. 3, pp. 779–786, 2018, doi: 10.1002/jmri.25811. [DOI] [PMC free article] [PubMed] [Google Scholar]
- [105].Marrouche NF et al. , “Association of atrial tissue fibrosis identified by delayed enhancement MRI and atrial fibrillation catheter ablation: the DECAAF study,” JAMA, vol. 311, no. 5, pp. 498–506, February. 2014, doi: 10.1001/jama.2014.3. [DOI] [PubMed] [Google Scholar]
- [106].Acosta J. et al. , “Scar Characterization to Predict Life-Threatening Arrhythmic Events and Sudden Cardiac Death in Patients With Cardiac Resynchronization Therapy: The GAUDI-CRT Study,” JACC Cardiovasc. Imaging, vol. 11, no. 4, pp. 561–572, April. 2018, doi: 10.1016/j.jcmg.2017.04.021. [DOI] [PubMed] [Google Scholar]
- [107].Friedman DJ et al. , “Trends and In-Hospital Outcomes Associated With Adoption of the Subcutaneous Implantable Cardioverter Defibrillator in the United States,” JAMA Cardiol., vol. 1, no. 8, pp. 900–911, November. 2016, doi: 10.1001/jamacardio.2016.2782. [DOI] [PMC free article] [PubMed] [Google Scholar]
- [108].Kalin R. and Stanton MS, “Current Clinical Issues for MRI Scanning of Pacemaker and Defibrillator Patients,” Pacing Clin. Electrophysiol, vol. 28, no. 4, pp. 326–328, 2005, doi: 10.1111/j.15408159.2005.50024.x. [DOI] [PubMed] [Google Scholar]
- [109].Shao J, Rashid S, Renella P, Nguyen K-L, and Hu P, “Myocardial T1 mapping for patients with implanted cardiac devices using wideband inversion recovery spoiled gradient echo readout,” Magn. Reson. Med, vol. 77, no. 4, pp. 1495–1504, 2017, doi: 10.1002/mrm.26223. [DOI] [PubMed] [Google Scholar]