Abstract
Objective
To explore the changes in gray matter volume (GMV) and white matter volume (WMV) in proliferative diabetic retinopathy (PDR) patients using voxel-based morphometry (VBM).
Participants and Methods
In total, 15 patients (10 males, 5 females) with PDR were enrolled to the patient group and 15 healthy controls (10 males, 5 females) to the control group, matched for age, sex, handedness, and education status. All individuals underwent voxel-based morphometry scans. GMV and WMV were compared between the two groups.
Results
GMV in bilateral superior temporal gyrus, sixth area of left cerebellum, left middle temporal gyrus, left orbital inferior frontal gyrus and left middle cingulum gyrus and WMV in left thalamus and left precuneus were significantly lower in patients than controls (P<0.01). Conversely, WMV was significantly higher in bilateral lenticular putamen of patients than controls (P<0.01).
Conclusion
Abnormal GMV and WMV in many specific areas of the cerebrum provide new insights for exploration of the occurrence and development of DR and its pathophysiology.
Keywords: voxel-based morphometric, white matter, gray matter, proliferative diabetic retinopathy
Introduction
As the prevalence of diabetes mellitus (DM) continues to increase, the International Diabetes Federation has predicted a rise to 642 million globally by 20401 along with an increase in related complications such as diabetic retinopathy (DR). DR remains the leading vascular-associated cause of blindness in both developing and developed countries. Clinically, DR is diagnosed based on vascular abnormalities on examination by retinal fundus photography, and is categorized as non-proliferative DR (NPDR) and proliferative DR (PDR). The pathology of DR includes retinal microvasculopathy, inflammation and retinal neurodegeneration.2 The occurrence of atypical DR fundus lesions before the development of diabetes may indicate a four to approximately seven-year delay in disease diagnosis.3
This prompted us to adopt a fully automated, standardized, sensitive, whole-brain technique known as voxel-based morphometry (VBM)4 to study the pathological mechanism, clinical diagnosis and treatment of DR. Based on the common anatomical, embryological and physiological characteristics of retinal vessels and cerebral microcirculation,5,6 the possibility that retinopathy can provide indirect clues to intracerebral lesions has attracted much attention.7–10 Some evidence indicates that diabetic retinopathy is associated with stroke and white matter lesions, and large epidemiological studies have found a significant association with cognitive impairment or dementia.11–14 Furthermore, the abnormalities of retinal arterioles (such as arteriolar stenosis and microaneurysms) may be bioindicators of concomitant cerebral small vessel diseases.15 Ryan et al16 reported that diabetic retinopathy was associated with cognitive impairment in diabetic patients. However, it is still unknown whether diabetic retinopathy is an independent risk factor or is associated with predicted brain injury.
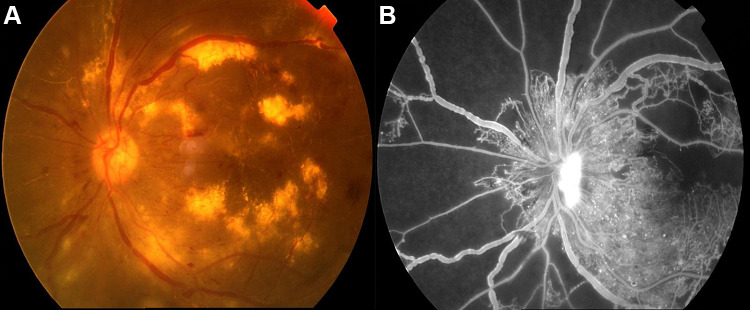
Magnetic resonance imaging (MRI) may be applied to basic and clinical research on DM and may guide clinical treatment, while voxel-based morphometry (VBM) quantifies changes in the volume and density of gray matter and white matter in the brain and can provide an accurate indication of morphologic changes caused by neuropathy that cannot be detected by conventional imaging. The VBM technique has been used in research on ophthalmic diseases such as amblyopia,17,18 comitant strabismus,19 primary open angle glaucoma,20 and optic neuritis.21 The frontal, temporal and thalamus regions are part of the default mode network, which is involved in cognitive, emotional and memory functions.22,23 Therefore, we speculated that the application of VBM to observe and study the structural changes of cerebral gray matter (GM) and white matter (WM) as well as the spontaneous neuronal changes in the resting state in PDR patients may identify biological indicators for the evaluation of brain injury in patients with PDR, and connectivity changes in visual areas or relevant cognition-related areas may lead to anxiety and depression. In this study, VBM was used to explore the pattern of spontaneous neuronal activity and changes in GM and WM volume caused by PDR (Figure 1), and to provide a basis to explore the cerebral manifestations of visual impairment.
Figure 1.
Example of PDR was examined on fundus camera (A) and fluorescence fundus angiography (B).
Participants and Methods
Participants
PDR patients (patient group, PG) and healthy controls (control group, CG) were included. A total of 15 PDR patients with type 2 diabetes were enrolled in PG, including 10 male and five female PDR patients. Intraocular pressure and best corrected visual acuity were assessed in all patients. The inclusion criteria for PDR patients were based on the 2018 American Academy of Ophthalmology clinical guidelines for the diagnosis and treatment of DR as follows: (1) at least one PDR characteristic in imaging examinations and/or fundus fluorescein angiography: (a) neovascularization, (b) vitreous/retinal hemorrhage; (2) no other ocular diseases in either eye (such as eye pain, dry eye syndrome, cataracts or optic neuritis); (3) no addiction to drugs or alcohol abuse; (4) no neurological or psychiatric diseases; (5) no MRI contraindications.
Fifteen healthy controls (10 male and five female subjects) without diabetes mellitus matched for age, gender, handedness, educational level and total intracranial volume were enrolled in the CG. The inclusion criteria for CG were as follows: (1) no ocular disease history; (2) no MRI contraindications; (3) no drug or alcohol abuse history; (4) no neurological or psychiatric diseases.
This study was approved by the Medical Ethics Committee of the First Affiliated Hospital of Nanchang University. The research is compliant with the Declaration of Helsinki. All participants voluntarily participated in the study and signed informed consent forms.
Magnetic Resonance Image Parameters
A 3-Tesla magnetic resonance scanner (Siemens, Munich, Germany) with a 12-channel head coil was used to scan participants, while the fast gradient echo sequence (magnetization prepared rapid acquisition gradient echo, MP RAGE) was used to acquire high resolution images covering the whole cerebrum. The T1-weighted cross-sectional images were prepared as follows: 176 slices with a thickness of 1.0 mm; echo time of 2.26 ms; repetition time of 1900 ms; and field of view about 215×230 mm. All individuals were scanned by the same radiologist, and had no abnormalities in the parenchyma of the cerebrum.
Image Processing
Functional data were classified using MRIcro software (www.MRIcro.com) to eliminate incomplete data. Structural images were processed using VBM8 implemented in statistical parametric mapping (SPM8) (Wellcome Department of Imaging Neuroscience, London, UK) running on MATLAB 7.9.0 (R2009b; The MathWorks, Inc., Natick, MA, USA). Individual cerebrums were divisible into GM, WM, and cerebrospinal fluid using VBM8 with default estimation options (very light bias regularization, 60 mm cut-off for the assessment of Gaussian smoothness in image intensity; European template for the original affine transformation of ICBM (International Consortium for Brain Mapping)). Spatial normalization to the Montreal Neurological Institute (MNI) standard space was conducted using the implementation in VBM8 of high-dimensional DARTEL (diffeomorphic anatomical registration through exponentiated lie algebra). DARTEL was applied to generate gray and white matter templates, while the generated template was used to acquire standardized GM and WM in data from all individuals. The modulated volumes were then smoothed by a 6-mm full-width-at-half-maximum Gaussian kernel. Normalized, modulated and smoothed images were subjected to group-level analyses.
Processing of Data and Statistical Analysis
We used the SPM8 toolkit to perform general linear model analysis. GM volume (GMV) and WM volume (WMV) were compared between PG and CG after controlling for age and sex. Significant voxels were superimposed on the normalization of 3DT1WI (three-dimensional magnetization, fast acquisition gradient echo sequence) to produce a kromogram. Regional analysis was performed on adjacent voxels after selecting the voxel threshold.
SPSS version 19.0 software (IBM Corporation, Armonk, NY, USA) was applied to analyze the cumulative data. Double sample t test and false discovery rate were used to process multiple comparison correction. The parameters of correction were set as voxel-level threshold of 0.005, cluster-level threshold of 0.05, two-sided test. P<0.05 was regarded as statistically significant. In addition, receiver operating characteristic (ROC) curves were used to compare specific cerebral regions between the two groups.
Correlation Analysis
PG participants were required to accurately complete the Hospital Anxiety and Depression Scale (HADS), and the scores of anxiety and depression were considered indicators of clinical behavior. The GraphPad Prism 8 software (GraphPad Inc., San Diego, CA, USA) was used to find Pearson’s correlation, and to evaluate and plot the linear correlation between HADS scores and GMV in the left thalamus.
Results
Basic Information of Participants
No significant differences were found in age (P=0.881), weight (P=0.896), or intraocular pressure of either eye (P>0.05) between PG and CG. However, binocular best corrected visual acuity was significantly different (P<0.05) between the two groups. Details are presented in Table 1.
Table 1.
Basic Information of Participants in the Study
| Condition | PDR | HCs | t | P-value |
|---|---|---|---|---|
| Male/female | 10/5 | 10/5 | N/A | >0.99 |
| Age (years) | 55.26±5.65 | 56.96±5.14 | 0.087 | 0.881 |
| Weight (kg) | 61.39±7.54 | 62.96±7.59 | 0.096 | 0.896 |
| Handedness | 15R | 15R | N/A | >0.99 |
| Duration of PDR (days) | 235.69±74.26 | N/A | N/A | N/A |
| Best-corrected VA-left eye | 0.14±0.06 | 1.01±0.16 | −0.875 | 0.007 |
| Best-corrected VA-right eye | 0.21±0.14 | 1.04±0.18 | −0.964 | 0.012 |
| IOP left (mm Hg) | 15.16±1.59 | 18.68±2.17 | 0.064 | 0.787 |
| IOP right (mm Hg) | 16.22±1.48 | 17.21±2.24 | 0.073 | 0.899 |
Note: Independent t tests comparing two groups (P<0.05).
Abbreviations: HCs, healthy controls; N/A, not applicable; PDR, proliferative diabetic retinopathy; VA, visual acuity; IOP, intraocular pressure; R, right.
Gray and White Matter Differences
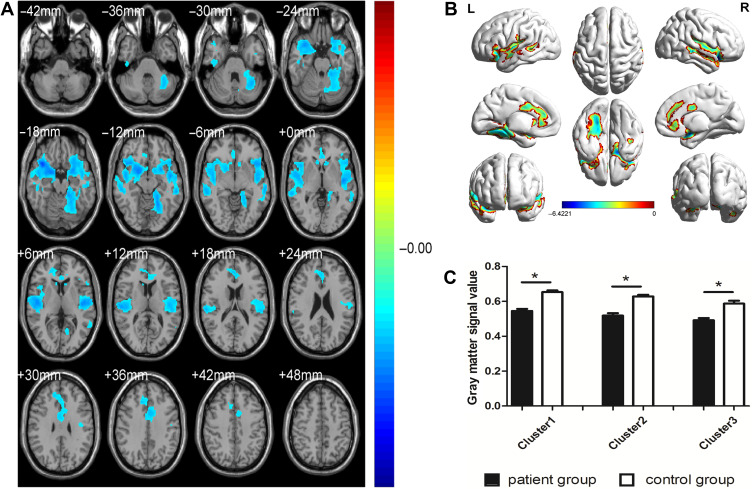
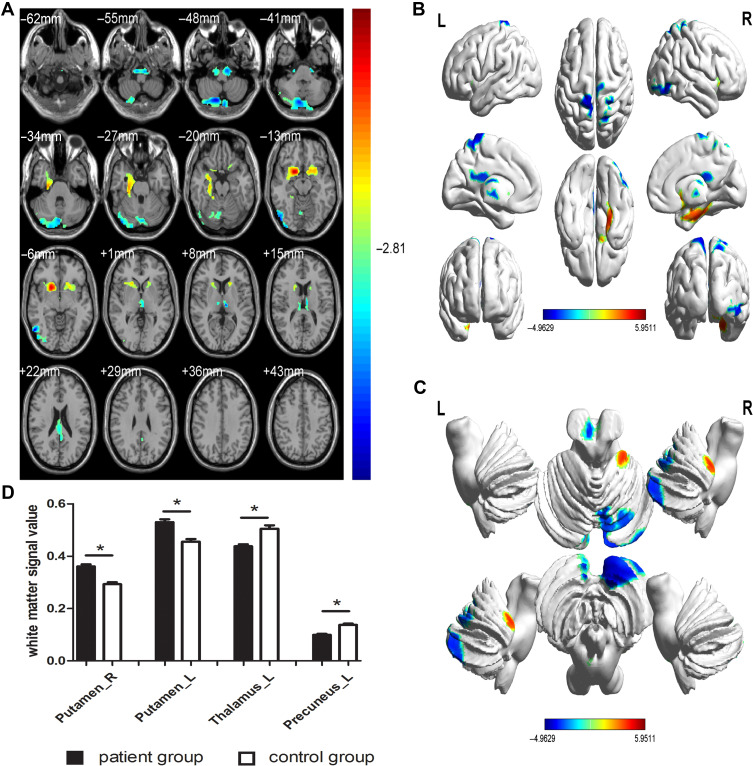
GMV was significantly decreased in PG (P<0.01) compared with CG in the bilateral superior temporal gyrus, sixth area of left cerebellum, left middle temporal gyrus, left orbital inferior frontal gyrus and left middle cingulum gyrus (Figure 2 and Table 2). The gray matter and white matter signal values in the two groups are shown in Figures 2C and 3D. We also found that the WMV was significantly higher in the bilateral lenticular putamen of PG than CG (P<0.01), while it was significantly lower in the left thalamus and left precuneus of PG than CG (P<0.01) (Figure 3 and Table 3).
Figure 2.
Spontaneous brain activity in the PG versus CG (A andB), and the gray matter signal value between the PG and CG (C). Compared with the CG, the gray matter volume was obviously decreased of PG (*P<0.01) in left superior temporal gyrus, sixth area of left cerebellum, left middle temporal gyrus, left orbital inferior frontal gyrus, right superior temporal gyrus, and left middle cingulum gyrus.
Abbreviations: L, left; PG, patient group; CG, control group; R, right.
Table 2.
GMV Differences Between PG and CG
| Clusters | Brain Areas | MNI Coordinates | BA | Number of Voxels | Number of Cluster Voxels | T value | ||
|---|---|---|---|---|---|---|---|---|
| X | Y | Z | ||||||
| PG <CG | ||||||||
| Cluster 1 | LSTG | −24 | 10.5 | −15 | 5 | 2417 | 19911 | −5.2256 |
| 6-ALC | 2239 | |||||||
| LMTG | 1919 | |||||||
| LOIFG | 1643 | |||||||
| Cluster 2 | RSTG | 39 | 18 | −18 | – | 2340 | 14717 | −6.4221 |
| Cluster 3 | LMCG | −4.5 | 7.5 | 37.5 | 33 | 877 | 4425 | −4.0399 |
Abbreviations: GMV, gray matter volume; PG, patient group; CG, control group; MNI, Montreal Neurological Institute; BA, Brodmann area; LSTG, left superior temporal gyrus; 6-ALC, sixth area of left cerebellum; LMTG, left middle temporal gyrus; LOIFG, left orbital inferior frontal gyrus; RSTG, right superior temporal gyrus; LMCG, left middle cingulum gyrus.
Figure 3.
Spontaneous brain activity in the PG versus CG (A–C), and the white matter signal value between the PG and CG (D). Compared with the CG, the white matter volume was significantly higher in bilateral lenticular putamen of PG, while it was significantly reduced in left thalamus and left precuneus of PG (*P<0.01).
Abbreviations: L, left; PG, patient group; CG, control group; R, right.
Table 3.
WMV Differences Between PG and CG
| Brain Areas | MNI Coordinates | BA | Number of Voxels | T value | ||
|---|---|---|---|---|---|---|
| X | Y | Z | ||||
| PG >CG | ||||||
| RLP | 19.5 | 10.5 | −10.5 | – | 5268 | 5.9511 |
| LLP | −19.5 | 12 | −10.5 | – | 1778 | 4.4854 |
| PG <CG | ||||||
| LT | −7.5 | −21 | 6 | 77 | 1782 | −4.2273 |
| LP | 0 | −49.5 | 66 | 68 | 4047 | −4.7884 |
Abbreviations: WMV, white matter volume; PG, patient group; CG, control group; MNI, Montreal Neurological Institute; BA, Brodmann area; L, left; R, right; RLP, right lenticular putamen; LLP, left lenticular putamen; LT, left thalamus; LP, left precuneus.
ROC Curve
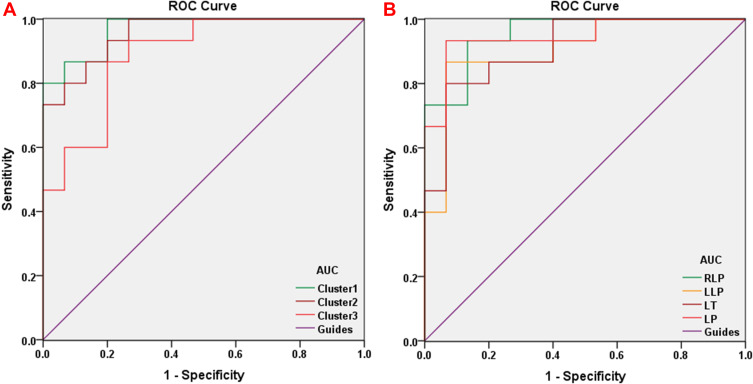
To verify whether differences in GMV and WMV values could be used as diagnostic biomarkers to differentiate the patient group from the control group, a ROC curve analysis was performed to analyze the mean GMV and WMV values for specific brain regions. The individual areas under the curve (AUCs) of GMV values were as follows: The LSTG/6-ALC/LMTG/LOIFG (0.969, P<0.001), RSTG (0.956, P<0.001) and LMCG (0.889, P<0.001) (Figure 4A), while the AUCs of WMV values were as follows: RLP (0.956, P<0.001), LLP (0.907, P<0.001), LT (0.911, P<0.001) and LP (0.947, P<0.001) (Figure 4B).
Figure 4.
ROC curve analysis of the mean GMV and WMV values for the altered brain regions. (A) The area under the ROC curve for the GMV was 0.969 for cluster 1 (LSTG/6-ALC/LMTG/LOIFG) (P<0.001; 95%CI: 0.918–1.000), 0.956 for the cluster 2 (RSTG) (P<0.001; 95%CI: 0.892–1.000) and 0.889 for cluster 3 (LMCG) (P<0.001; 95%CI: 0.774–1.000). (B) The area under the ROC curve for the WMV was 0.956 for RLP (P<0.001; 95%CI: 0.891–1.000), 0.907 for LLP (P<0.001; 95%CI: 0.796–1.000), 0.911 for LT (P<0.001; 95%CI: 0.809–1.000) and 0.947 for (P<0.001; 95%CI: 0.866–1.000).
Abbreviations: LSTG, left superior temporal gyrus; 6-ALC, sixth area of left cerebellum; LMTG, left middle temporal gyrus; LOIFG, left orbital inferior frontal gyrus; RSTG, right superior temporal gyrus; LMCG, left middle cingulum gyrus; RLP, right lenticular putamen; LLP, left lenticular putamen; LT, left thalamus; LP, left precuneus.
Correlation Analysis
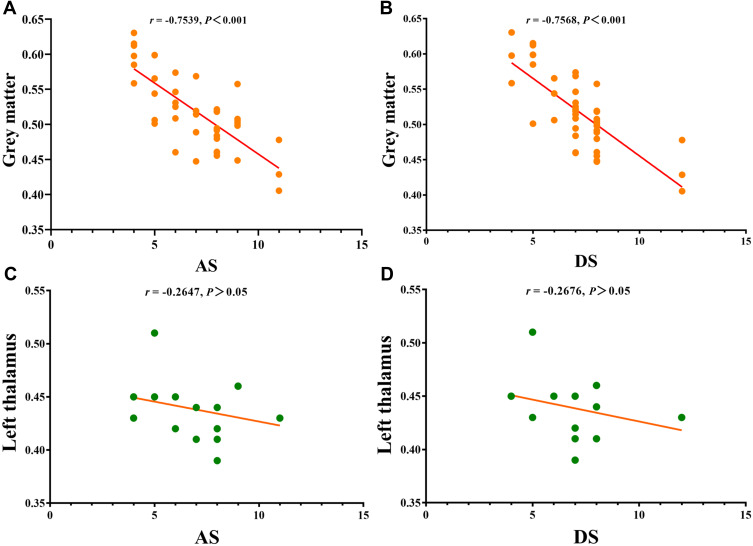
We found significant negative correlations between HADS scores and overall GMV values in PG (r=−0.7539, P<0.0001 for anxiety and r = −0.7568, P<0.0001 for depression; Figure 5), but this correlation was not found in the left thalamus (r = −0.2647, P>0.05 and r = −0.2676, P>0.05; Figure 5).
Figure 5.
Correlations between the clinical behaviors and GMV values and left thalamus. (A) The anxiety scores showed a negative correlation with GMV values (r = −0.7539, P<0.001); (B) the depression scores showed a negative correlation with GMV values ((r = −0.7568, P<0.001); (C) there is no correlation between anxiety scores and left thalamus (r = −0.2647, P>0.05); (D) there is no correlation between depression scores and left thalamus (r = −0.2676, P>0.05).
Abbreviations: GMV, gray matter volume; AS, anxiety scores; DS, depression scores.
Discussion
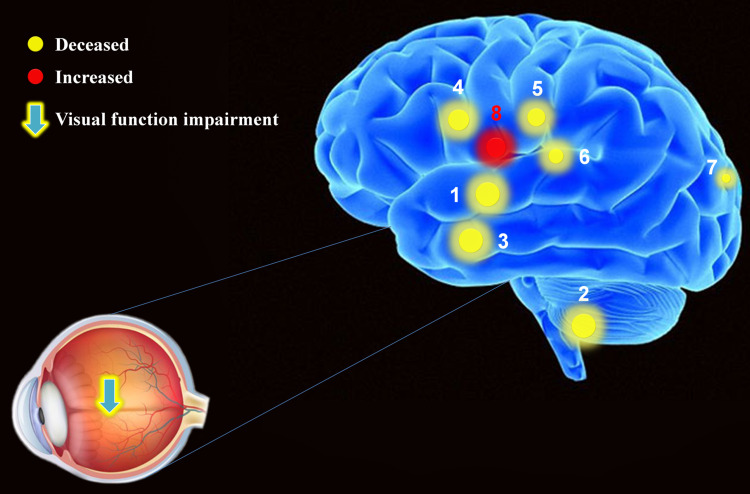
In this study, we found significantly different GMV and WMV in patients than in controls. The GMV in bilateral superior temporal gyrus, sixth area of left cerebellum, left middle temporal gyrus, left orbital inferior frontal gyrus and left middle cingulum gyrus and WMV in the left thalamus and left precuneus were significantly decreased in PG compared with CG, while the WMV was significantly higher in bilateral lenticular putamen of PG than CG (Figure 6). VBM provides a powerful basis for the clinical diagnosis and treatment of diseases, and becomes a powerful tool to clarify the pathological mechanism and monitor progression of diseases.24 In contrast to the region of interest method, VBM is not limited to predetermined regions, but evaluates the differences in brain histomorphology by calculating the density or volume of gray matter and white matter throughout the brain. The method has high repeatability and the results are objective.
Figure 6.
The mean GMV and WMV values of cerebrum in PDR patients. Compared with CG, the PG presented abnormal signals in specific regions of cerebrum as followed: 1. bilateral superior temporal gyrus (Left, t = −5.2256; Right, t = −6.4221); 2. sixth area of left cerebellum (t = −5.2256); 3. left middle temporal gyrus (t = −5.2256); 4. left orbital inferior frontal gyrus (t = −5.2256); 5. left middle cingulum gyrus (t = −4.0399); 6. left thalamus (t = −4.2273); 7. left precuneus (t = −4.7884); 8. bilateral lenticular putamen (left, t=4.4854; right, t=5.9511).
Note: The areas of the spots represent the degree of quantitative changes.
Many scholars have studied brain structure in diabetes. Current VBM research on the impact of DR in cerebellar regions is shown in Table 4. Previous reports indicated that patients with type 2 DM have reduced GMV throughout the brain, including right inferior frontal gyrus, occipital lobe, frontal lobe, and temporal cortex, medial temporal, anterior cingulate, and medial frontal lobes.25–28 Furthermore, a large sample study suggested that patients with type 2 DM have atrophy in brain regions including the hippocampus,29,30 but mainly in the temporal lobe.31 Wang et al32 indicated that the amplitude of low frequency fluctuation values of the bilateral medial frontal gyri, right superior temporal gyrus, right middle frontal gyrus, left middle/inferior frontal gyrus, bilateral precuneus, and left inferior parietal lobule were reduced in DR patients. One study pointed out that impaired visual function will lead to abnormal structure of the visual cortex,33 suggesting that decreased visual cortex stimulation in DR patients leads to changes in its structure. Another study found that intrinsic functional connectivity was altered in distinct cerebrum regions of PDR patients, including primary visual cortex.34 The above studies indicate that many cerebral areas in diabetic patients have shown abnormalities and loss of GMV.
Table 4.
Current Research Status of VBM and DR in Alternation of Cerebellum Regions
| Authors(Y) | Average Age(Y) | Population (P/HC,M/F) | Type | Duration (Y) | Classification | Method | GM | WM | Cerebrum Regions |
|---|---|---|---|---|---|---|---|---|---|
| Wessels et al26 (2006) | PDR: 41.7±5.5 | 52 (31/21, 19/33) | DM1 | PDR: (29.9±7.1) | PDR/NPDR /HC (13/18/21) | VBM | Yes | NA | Decreased: left Middle FG, right inferior FG, right OL and left cerebellum. |
| NPDR: 39.8±6.3 HC: 36.3±7.9 |
NPDR: (23.7±9.4) | ||||||||
| Musen et al25 (2006) | DM1: 32.6 ±3.2 | 118 (82/36, 49/69) | DM1 | DM1: (20.3 ± 3.6) | DM1/HC (82/36) | VBM | Yes | NA | Decreased: Bilateral superior TG, left AG, left middle TG, left middle FG, left thalamus. |
| HC: 31.3± 5.1 | |||||||||
| Kamiyama et al29 (2010) | DM2: 70.7 | 56 (28/28, 28/28) | DM2 | DM2: mean 13.8 (1~25) | DM2/HC (28/28) | VBM | Yes | NA | Decreased: Whole-brain atrophy, including hippocampal. |
| HC: 70.7±1 | |||||||||
| Moran et al39 (2013) | DM2: 67.8±6.9 | 713 (350/363, 405/308) |
DM2 | DM2: mean 7 (4~12) | DM2/HC (350/363) | VBM | Yes | Yes | GM decreased: TG, PHP, cingulate, insula, precuneus, and medial FG, CN and putamen. WM decreased: FG and TG. |
| HC: 72.1±7.2 | |||||||||
| Wang et al46 (2014) | DM2: 53.1±9.6 | 46 (23/23, 30/16) | DM2 | DM2: mean 7 (0.5~26) | DM2/HC (23/23) | VBM | Yes | Yes | GM decreased: Right superior TG, leftinferior OG, right inferior TG. |
| HC: 53.9±9.2 | |||||||||
|
WM decreased: Right superior and middle TG, the right posterior lobe of cerebellum. |
Abbreviations: Y, year; P, patient; HC, healthy control; M, male; F, female; GM, gray matter; WM, white matter; PDR, proliferative diabetic retinopathy; NPDR, on-proliferative diabetic retinopathy; DM1, type 1 diabetes; DM2, type 2 diabetes; VBM, voxel-based morphometry; NA, not applicable; FG, frontal gyrus; OL, occipital lobe; TG, temporal gyri; AG, angular gyrus; PHP, parahippocampal; CN, caudate nucleus; OG, occipital gyrus.
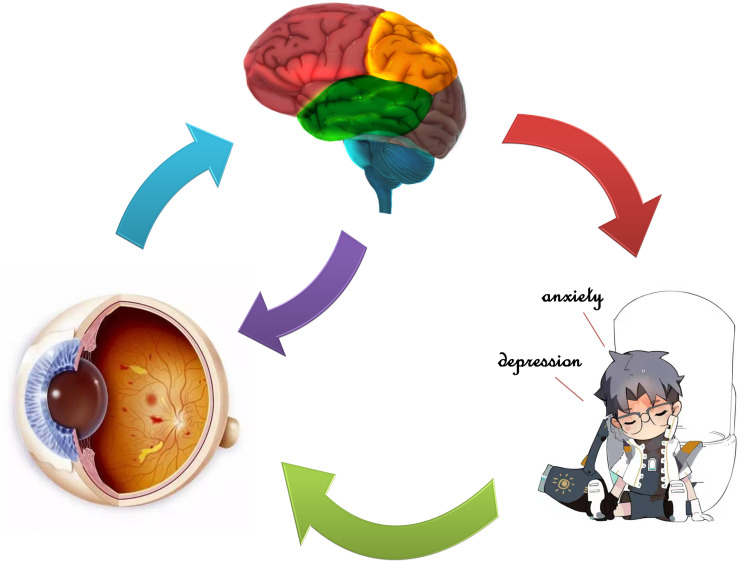
Some of our results are consistent with and supplement previous findings. Decreased GMV indicates neuronal loss and atrophy in some cerebral regions in DR patients.24 Although the mechanism of association between retinopathy and decreased GMV is not clear, hyperglycemia may play an important role in causing both lesions.35 An impaired blood–brain barrier leads to reduced neuronutrient delivery, decreased neural metabolism, and ultimately neuronal death.36 Neuronal loss caused by microinfarction of gray matter may also be an important mechanism leading to decreased GMV in patients with DR. However, microinfarction cannot be observed on conventional MRI images and pathological evidence is still needed to support it. To our knowledge, PDR not only leads to visual impairment, but also can affect emotions, such as anxiety and depression. A study showed that the adjacent anterior cingulate gyrus and prefrontal cortex played an important role in emotion regulation.37 In addition, the patients with medial frontal lobe lesions were related to activations in emotional and social behavior, which are prone to perform anxiety and depression.38 The PG group had significantly decreased of GMV values in many regions of cerebral and correlation analysis with HADS, which performed that anxiety and depression scores were negatively correlated with GMV values, and abnormal neural electrical activity may also occur in cerebral regions related to emotional processing (Figure 7). Therefore, our study demonstrated that the decrease of GMV values in many regions of the cerebrum may be related to the anxiety and depression of PDR patients.
Figure 7.
Relationship between GMV values and emotional state. The GMV values were decreased in many specific regions of cerebrum in PDR patients compared with healthy controls, and PDR patients seem more likely to produce anxiety and depression.
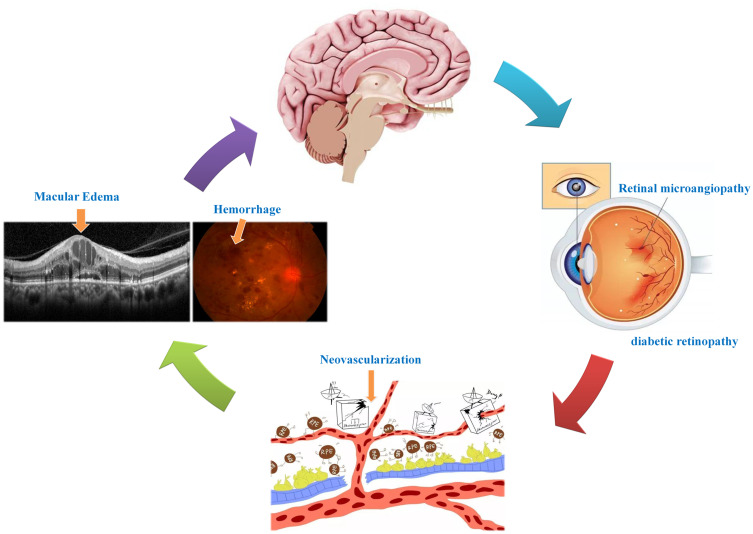
Significant correlations have been found between diabetes and WM lesions.28 Two studies have shown that WM loss is distributed in the frontal and temporal regions of the cerebrum.31,39 Although GM loss may result in downstream atrophy of WM, the cerebral regions associated with WM loss were unchanged in type 2 DM, suggesting a primary effect of WM in type 2 DM patients. However, white matter hyperintensities (WMH) were detected in the regions of bilateral frontal, bilateral occipital, superior and middle frontal gyri, and bilateral semicovoid center in elderly or older people with hypertensive retinopathy,40,41 while higher retinopathy grades were significantly associated with WMH.42 One study indicated a relationship between background diabetic retinopathy and small focal WMH in periventricular, lateral ventricles, basal ganglia and enlarged perivascular spaces,43 and a strong association has been found between WMH and retinal arteriolar signs in the subcortical frontal lobe, parietal caps and periventricular frontal.44 WMH lesions represent specific regions of increased water content, demyelination, and gliosis within WM,45 which are thought to signify foci of microvascular ischemia. The lenticular putamen is an important location of the main nerve conduction tract in and out of the cerebral cortex. Due to the microvascular ischemia of cerebrum specific areas in DM, elderly, and serve PDR, WMH was reasonable, occurred and distributed in many specific regions of cerebrum, including the bilateral lenticular putamen. Based on the above research results, we speculated that diabetic retinopathy is significantly associated with dysfunction of the cerebellum (Table 5 and Figure 8). Although we have explored the specific cerebrum regions and pattern of PDR cerebrum injury, there are still some limitations to the study. Therefore, more in-depth, longitudinal and horizontal studies are still needed in future.
Table 5.
Alternation of Cerebellum Regions and Its Potential Impact
| Cerebellum Regions | Experimental Results | Cerebellum Functions | Anticipate Effects |
|---|---|---|---|
| Superior temporal gyrus | PG <CG | Information processing, language comprehension and perception, and associated with ocular diseases | Auditory aphasia, reflect intraocular inflammation and visual impairment |
| Sixth area of cerebellum | PG <CG | Motor learning and memory, cardiovascular activities, emotional processing | Social and emotional problems |
| Middle temporal gyrus | PG <CG | Auditory information processing and language function, affective information processing | Aphasia and mental disorders, including depression and anxiety |
| Orbital inferior frontal gyrus | PG <CG | Processing of pitch and duration information | Alzheimer's disease |
| Middle cingulum gyrus | PG <CG | Manage emotion, cognition, and movement, and integrate visual information | Affective and cognitive dysfunction, visual function abnormals |
| Lenticular putamen | PG >CG | Relay points in the extrapyramidal pathway | Motor and sensory dysfunction, such as Parkinson’s disease |
| Thalamus | PG <CG | Sensory processing, memory function, emotion associated with visual function | Emotional problems, endocrine disease and visual dysfunction |
| Precuneus | PG <CG | Associated with many high levels of cognitive function | Movement and sensory impairment. |
Abbreviations: PG, patient group; CG, control group.
Figure 8.
Relationship between VBM and clinical manifestation of PDR. Retinal under the condition of ischemia and hypoxia promoted neovascularization and hemorrhage, further result in alterations of retinal thickness and cerebellum activity.
Conclusion
In our study, we found abnormalities in GMV and WMV in patients with DR. These findings promote understanding of the impact of DR on the whole visual pathway in terms of substantial morphological alterations, and provide new insight for exploration of the occurrence and development of DR and its pathophysiology.
Funding Statement
The Central Government Guides Local Science and Technology Development Foundation (No: 20211ZDG02003); Key Research Foundation of Jiangxi Province (No: 20181BBG70004, 20203BBG73059); Excellent Talents Development Project of Jiangxi Province (No: 20192BCBL23020); Natural Science Foundation of Jiangxi Province (No: 20181BAB205034); Grassroots Health Appropriate Technology “Spark Promotion Plan” Project of Jiangxi Province (No: 20188003); Health Development Planning Commission Science Foundation of Jiangxi Province (No: 20201032, 202130210); Health Development Planning Commission Science TCM Foundation of Jiangxi Province (No: 2018A060, 2020A0087); Education Department Foundation of Jiangxi Province(No: GJJ200157, GJJ200159, GJJ200169); and Key Research Foundation of Jiangxi Province (grant no. 20203BBG73058).
Data Sharing Statement
The datasets used and/or analyzed during the current study are available from the corresponding author on reasonable request.
Ethical Statement
All research methods were approved by the Committee of the Medical ethics of the First Affiliated Hospital of Nanchang University and were in accordance with the 1964 Declaration of Helsinki and its later amendments or comparable ethical standards. All subjects were informed of the purpose, method, potential risks and signed an informed consent form.
Disclosure
This was not an industry supported study. The authors report no conflicts of interest in this work.
References
- 1.Ogurtsova K, da Rocha Fernandes JD, Huang Y, et al. IDF diabetes atlas: global estimates for the prevalence of diabetes for 2015 and 2040. Diabetes Res Clin Pract. 2017;128:40–50. [DOI] [PubMed] [Google Scholar]
- 2.Wang W, Lo ACY. Diabetic retinopathy: pathophysiology and treatments. Int J Mol Sci. 2018;19:6. [DOI] [PMC free article] [PubMed] [Google Scholar]
- 3.Olafsdottir E, Andersson DK, Dedorsson I, Stefánsson E. The prevalence of retinopathy in subjects with and without type 2 diabetes mellitus. Acta Ophthalmol. 2014;92(2):133–137. [DOI] [PubMed] [Google Scholar]
- 4.Ashburner J, Friston KJ. Friston, Voxel-based morphometry–the methods. Neuroimage. 2000;11:805–821. [DOI] [PubMed] [Google Scholar]
- 5.Wong TY, Klein R, Klein BE, Tielsch JM, Hubbard L, Nieto FJ. Retinal microvascular abnormalities and their relationship with hypertension, cardiovascular disease, and mortality. Surv Ophthalmol. 2001;46(1):59–80. [DOI] [PubMed] [Google Scholar]
- 6.Patton N, Aslam T, Macgillivray T, Pattie A, Deary IJ, Dhillon B. Retinal vascular image analysis as a potential screening tool for cerebrovascular disease: a rationale based on homology between cerebral and retinal microvasculatures. J Anat. 2005;206(4):319–348. [DOI] [PMC free article] [PubMed] [Google Scholar]
- 7.Yatsuya H, Folsom AR, Wong TY, Klein R, Klein BE, Sharrett AR. Retinal microvascular abnormalities and risk of lacunar stroke: atherosclerosis risk in communities study. Stroke. 2010;41(7):1349–1355. [DOI] [PMC free article] [PubMed] [Google Scholar]
- 8.Wong TY, Klein R, Couper DJ, et al. Retinal microvascular abnormalities and incident stroke: the atherosclerosis risk in communities study. Lancet. 2001;358(9288):1134–1140. [DOI] [PubMed] [Google Scholar]
- 9.Wong TY, Klein R, Sharrett AR, et al. Cerebral white matter lesions, retinopathy, and incident clinical stroke. JAMA. 2002;288(1):67–74. [DOI] [PubMed] [Google Scholar]
- 10.Fuller JH, Stevens LK, Wang SL. Risk factors for cardiovascular mortality and morbidity: the WHO mutinational study of vascular disease in diabetes. Diabetologia. 2001;44(Suppl 2):S54. [DOI] [PubMed] [Google Scholar]
- 11.Baker ML, Marino LE, Kuller LH, et al. Retinal microvascular signs, cognitive function, and dementia in older persons: the cardiovascular health study. Stroke. 2007;38(7):2041–2047. [DOI] [PubMed] [Google Scholar]
- 12.Wong TY, Klein R, Sharrett AR, et al. Retinal microvascular abnormalities and cognitive impairment in middle-aged persons: the atherosclerosis risk in communities study. Stroke. 2002;33(6):1487–1492. [DOI] [PubMed] [Google Scholar]
- 13.Cheung N, Rogers S, Couper D, Klein R, Sharrett A, Wong T. Is diabetic retinopathy an independent risk factor for ischemic stroke? Stroke. 2007;38(2):398–401. [DOI] [PubMed] [Google Scholar]
- 14.Tekin O, Cukur S, Uraldi C, et al. Relationship between retinopathy and cognitive impairment among hypertensive subjects. A case-control study in the ankara-pursaklar region. Eur Neurol. 2004;52(3):156–161. [DOI] [PubMed] [Google Scholar]
- 15.Kwa VI, van der Sande JJ, Stam J, Tijmes N, Vrooland JL. Retinal arterial changes correlate with cerebral small-vessel disease. Neurology. 2002;59(10):1536–1540. [DOI] [PubMed] [Google Scholar]
- 16.Ryan CM, Geckle MO, Orchard TJ. Orchard, cognitive efficiency declines over time in adults with Type 1 diabetes: effects of micro- and macrovascular complications. Diabetologia. 2003;46(7):940–948. [DOI] [PubMed] [Google Scholar]
- 17.Barnes GR, Li X, Thompson B, Singh KD, Dumoulin SO, Hess RF. Decreased gray matter concentration in the lateral geniculate nuclei in human amblyopes. Invest Ophthalmol Vis Sci. 2010;51(3):1432–1438. [DOI] [PubMed] [Google Scholar]
- 18.Liang M, Xie B, Yang H, et al. Distinct patterns of spontaneous brain activity between children and adults with anisometropic amblyopia: a resting-state fMRI study. Graefe’s Arch Clin Exp Ophthalmol. 2016;254(3):569–576. [DOI] [PubMed] [Google Scholar]
- 19.Ouyang J, Yang L, Huang X, et al. The atrophy of white and gray matter volume in patients with comitant strabismus: evidence from a voxel-based morphometry study. Mol Med Rep. 2017;16(3):3276–3282. [DOI] [PMC free article] [PubMed] [Google Scholar]
- 20.Li C, Cai P, Shi L, et al. Voxel-based morphometry of the visual-related cortex in primary open angle glaucoma. Curr Eye Res. 2012;37(9):794–802. [DOI] [PubMed] [Google Scholar]
- 21.Huang X, Zhang Q, Hu PH, et al. White and gray matter volume changes and correlation with visual evoked potential in patients with optic neuritis: a voxel-based morphometry study. Med Sci Monitor. 2016;22:1115–1123. [DOI] [PMC free article] [PubMed] [Google Scholar]
- 22.Zhang D, Raichle ME. Disease and the brain’s dark energy. Nat Rev Neurol. 2010;6(1):15–28. [DOI] [PubMed] [Google Scholar]
- 23.Raichle ME. The brain’s dark energy. Sci Am. 2010;302(3):44–49. [DOI] [PubMed] [Google Scholar]
- 24.Li YM, Zhou HM, Xu XY, Shi HS. Research progress in MRI of the visual pathway in diabetic retinopathy. Curr Med Sci. 2018;38(6):968–975. [DOI] [PubMed] [Google Scholar]
- 25.Musen G, Lyoo IK, Sparks CR, et al. Effects of type 1 diabetes on gray matter density as measured by voxel-based morphometry. Diabetes. 2006;55(2):326–333. [DOI] [PubMed] [Google Scholar]
- 26.Wessels AM, Simsek S, Remijnse PL, et al. Voxel-based morphometry demonstrates reduced grey matter density on brain MRI in patients with diabetic retinopathy. Diabetologia. 2006;49(10):2474–2480. [DOI] [PubMed] [Google Scholar]
- 27.Kumar A, Haroon E, Darwin C, et al. Gray matter prefrontal changes in type 2 diabetes detected using MRI. J Magn Resonance Imaging. 2008;27(1):14–19. [DOI] [PubMed] [Google Scholar]
- 28.Lazarus R, Prettyman R, Cherryman G. White matter lesions on magnetic resonance imaging and their relationship with vascular risk factors in memory clinic attenders. Int J Geriatr Psychiatry. 2005;20(3):274–279. [DOI] [PubMed] [Google Scholar]
- 29.Kamiyama K, Wada A, Sugihara M, et al. Potential hippocampal region atrophy in diabetes mellitus type 2: a voxel-based morphometry VSRAD study. Jpn J Radiol. 2010;28(4):266–272. [DOI] [PubMed] [Google Scholar]
- 30.den Heijer T, Vermeer SE, van Dijk EJ, et al. Type 2 diabetes and atrophy of medial temporal lobe structures on brain MRI. Diabetologia. 2003;46(12):1604–1610. [DOI] [PubMed] [Google Scholar]
- 31.Chen Z, Li L, Sun J, Ma L. Mapping the brain in type II diabetes: voxel-based morphometry using DARTEL. Eur J Radiol. 2012;81(8):1870–1876. [DOI] [PubMed] [Google Scholar]
- 32.Wang Y, Shao Y, Shi WQ, et al. The predictive potential of altered spontaneous brain activity patterns in diabetic retinopathy and nephropathy. EPMA J. 2019;10(3):249–259. [DOI] [PMC free article] [PubMed] [Google Scholar]
- 33.Mendola JD, Conner IP, Roy A, et al. Voxel-based analysis of MRI detects abnormal visual cortex in children and adults with amblyopia. Hum Brain Mapp. 2005;25(2):222–236. [DOI] [PMC free article] [PubMed] [Google Scholar]
- 34.Yu Y, Lan DY, Tang LY, et al. Intrinsic functional connectivity alterations of the primary visual cortex in patients with proliferative diabetic retinopathy: a seed-based resting-state fMRI study. Ther Adv Endocrinol Metab. 2020;11:2042018820960296. [DOI] [PMC free article] [PubMed] [Google Scholar]
- 35.Brownlee M. The pathobiology of diabetic complications: a unifying mechanism. Diabetes. 2005;54(6):1615–1625. [DOI] [PubMed] [Google Scholar]
- 36.Browatzki M, Schmidt J, Kübler W, Kranzhöfer R. Endothelin-1 induces interleukin-6 release via activation of the transcription factor NF-kappaB in human vascular smooth muscle cells. Basic Res Cardiol. 2000;95(2):98–105. [DOI] [PubMed] [Google Scholar]
- 37.Critchley HD, Wiens S, Rotshtein P, Ohman A, Dolan RJ. Neural systems supporting interoceptive awareness. Nat Neurosci. 2004;7(2):189–195. [DOI] [PubMed] [Google Scholar]
- 38.Seitz RJ, Nickel J, Azari NP. Functional modularity of the medial prefrontal cortex: involvement in human empathy. Neuropsychology. 2006;20(6):743–751. [DOI] [PubMed] [Google Scholar]
- 39.Moran C, Phan TG, Chen J, et al. Brain atrophy in type 2 diabetes: regional distribution and influence on cognition. Diabetes Care. 2013;36(12):4036–4042. [DOI] [PMC free article] [PubMed] [Google Scholar]
- 40.Beare R, Srikanth V, Chen J, et al. Development and validation of morphological segmentation of age-related cerebral white matter hyperintensities. Neuroimage. 2009;47(1):199–203. [DOI] [PubMed] [Google Scholar]
- 41.Del Brutto OH, Mera RM, Viteri EM, et al. Hypertensive retinopathy and cerebral small vessel disease in Amerindians living in rural Ecuador: the Atahualpa project. Int J Cardiol. 2016;218:65–68. [DOI] [PubMed] [Google Scholar]
- 42.Hughes AD, Falaschetti E, Witt N, et al. Association of retinopathy and retinal microvascular abnormalities with stroke and cerebrovascular disease. Stroke. 2016;47(11):2862–2864. [DOI] [PMC free article] [PubMed] [Google Scholar]
- 43.Ferguson SC, Blane A, Perros P, et al. Cognitive ability and brain structure in type 1 diabetes: relation to microangiopathy and preceding severe hypoglycemia. Diabetes. 2003;52(1):149–156. [DOI] [PubMed] [Google Scholar]
- 44.Qiu C, Cotch MF, Sigurdsson S, et al. Microvascular lesions in the brain and retina: the age, gene/environment susceptibility-Reykjavik study. Ann Neurol. 2009;65(5):569–576. [DOI] [PMC free article] [PubMed] [Google Scholar]
- 45.Pantoni L, Garcia JH. The significance of cerebral white matter abnormalities 100 years after Binswanger’s report. A review. Stroke. 1995;26(7):1293–1301. [DOI] [PubMed] [Google Scholar]
- 46.Wang C, Fu K, Liu H, Xing F, Zhang S. Brain structural changes and their correlation with vascular disease in type 2 diabetes mellitus patients: a voxel-based morphometric study. Neural Regen Res. 2014;9(16):1548–1556. [DOI] [PMC free article] [PubMed] [Google Scholar]


