

Abstract
Förster resonance energy transfer (FRET) biosensors are popular and useful for directly observing cellular signaling pathways in living cells. Until recently, multiplex imaging of genetically encoded FRET biosensors to simultaneously monitor several protein activities in one cell was limited due to a lack of spectrally compatible FRET pair of fluorescent proteins. With the recent development of miRFP series of near-infrared (NIR) fluorescent proteins, we are now able to extend the spectrum of FRET biosensors beyond blue-green-yellow into NIR. These new NIR FRET biosensors enable direct multiplex imaging together with commonly used cyan-yellow FRET biosensors. We describe herein a method to produce cell lines harboring two compatible FRET biosensors. We will then discuss how to directly multiplex-image these FRET biosensors in living cells. The approaches described herein are generally applicable to any combinations of genetically encoded, ratiometric FRET biosensors utilizing the cyan-yellow and NIR fluorescence.
Keywords: Near-infrared fluorescent protein, FRET biosensor, Rho GTPases, Multiplex imaging
1. Introduction
Through advances in fluorescent biosensor technologies, we are now able to directly observe cellular posttranslational modifications and protein–protein interactions within their native subcellular microenvironments in living cells. The current state of the art in fluorescent biosensor imaging techniques is simultaneous interrogation and/or perturbations of multiple protein activity status in single living cells. These multiplex approaches are enabled by new FRET-based probes that are spanning increasingly wider range of fluorescence spectrum, into far-red and NIR.
We have recently developed the first fully NIR FRET biosensor for a member of the p21 Rho-family of small GTPase, Rac1 [1]. The NIR FRET biosensor uses a FRET pair of genetically encoded fluorescent proteins that fluoresce at NIR wavelengths, including the miRFP670 [2] (donor) and the miRFP720 (acceptor) [1]. The fully NIR spectral characteristics of this biosensor system enabled us to simultaneously utilize it with a traditional cyan-yellow fluorescent protein-based FRET biosensor. This approach enabled the first, direct visualization of RhoA GTPase and Rac1 GTPase activities in single living cells at the same time, allowing to observe their antagonism at the cell edge [1].
In this work, we will detail the methods employed to prepare appropriate cell lines for multiplex imaging of a cyan-yellow and a NIR FRET biosensors. We will then detail technical aspects and considerations important during the multiplex FRET biosensor imaging experiments and the subsequent data processing and analysis procedures. We will use RhoA-Rac1 FRET biosensor pair as an example system; however, any ratiometric, single-chain cyan-yellow and NIR FRET biosensor systems may be multiplexed by the methodology described herein.
2. Materials
2.1. Cell Culture
Mouse embryonic fibroblast (MEF) with stable tet-OFF (Clontech) (see Notes 1 and 2).
tet-OFF MEF stably harboring a CFP-YFP RhoA FRET biosensor [3].
tet-OFF MEF stably harboring a CFP-YFP Rac1-GDI FRET biosensor [4].
GP2–293 cells (see Note 3) (Clontech).
DMEM supplemented with 10% certified tetracycline-free fetal bovine serum (FBS; Atlanta Biological), 2 mM GlutaMax (Invitrogen), and 100 μg/mL penicillin (100 IU)/streptomycin.
DPBS, calcium, and magnesium free: 0.2 g/L KCl, 0.2 g/L KH2PO4, 8 g/L NaCl, 1.15 g/L Na2HPO4 (anhydrous).
Trypsin (0.05%)—EDTA.
Poly-L-lysine (molecular weight: 70,000–150,000 Da) 0.001% solution in sterile DPBS.
G418/neomycin (100 mg/mL stock solution).
Puromycin (Puro) (10 mg/mL stock solution).
Hygromycin (Hygro) (50 mg/mL stock solution).
Doxycyclin (Dox) (10 mg/mL stock solution).
Soybean trypsin inhibitor 0.05% in DPBS.
35 mm, 6 cm, and 10 cm cell culture dishes and 6-well tissue culture plates.
1.5 (conical) and 2.0 (round bottom) mL tubes.
15- and 50-mL polypropylene tubes.
2.2. Transfection, Retrovirus Production, and Transduction
Opti-MEM (Invitrogen).
DMEM supplemented with 10% certified tetracycline-free FBS (Atlanta Biological) and 2 mM GlutaMax (Invitrogen).
Polyethylenimine (PEI) 25kD linear, 1 μg/mL in sterile water (Polysciences) [5].
Plasmids: pRetro-X-hygro-DEST-NIR-Rac1 (wildtype) biosensor [1], pGag-Pol, and pVSVg (Clontech). pQCXIN-tet-OFF-advanced (see Note 4).
Retro-X concentrator solution (Clontech).
Hexadimethrine bromide (Polybrene) (8 mg/mL stock solution).
0.45 μm surfactant-free cellulose acetate, PVDF, or polyethersulfone syringe filter (see Note 5).
Biliverdin hydrochloride (25 mM stock solution in Dimethylsulfoxide).
2.3. Imaging Experiments
25 mm round coverslips #1.5 thickness.
1 N HCl.
200-proof ethanol.
Ultrasonicator bath.
Coverslip carrier rack.
Glass jar.
Fibronectin from bovine plasma.
Ham’s F12K medium without phenol red (Crystalgen) for live cell experiments [6], supplemented with 2 mM GlutaMax (Invitrogen) and 3% certified tet-free FBS.
Live cell imaging chamber [7–9], Attofluor chamber system (Invitrogen) or other compatible live-cell chamber system that can accommodate 25 mm coverslips, or CellView glass bottom culture dishes (Greiner-Bio-one), or Mattek dishes (Mattek.com).
Mineral oil.
Silicone vacuum grease.
Argon gas.
Oxyfluor reagent (Oxyrase.com).
Sodium DL-lactate 60% solution.
40× 1.3 numerical aperture (NA), differential interference contrast (DIC)—Oil immersion objective lens.
60× 1.45 NA, DIC—Oil immersion objective lens.
A multi-channel fluorescence inverted microscope system capable of timelapse imaging of Förster resonance energy transfer (FRET) biosensors [9] (Fig. 1). Appropriate light source and camera considerations are also important (see Note 6).
Microscope calibration slides: Mounted multispectral beads (Invitrogen) and a rectilinear grid patterned slide (Photometrics).
Matlab software ver. 2011a (Mathworks).
Metamorph software ver. 7.8.13.0 (Molecular Devices).
Fig. 1.
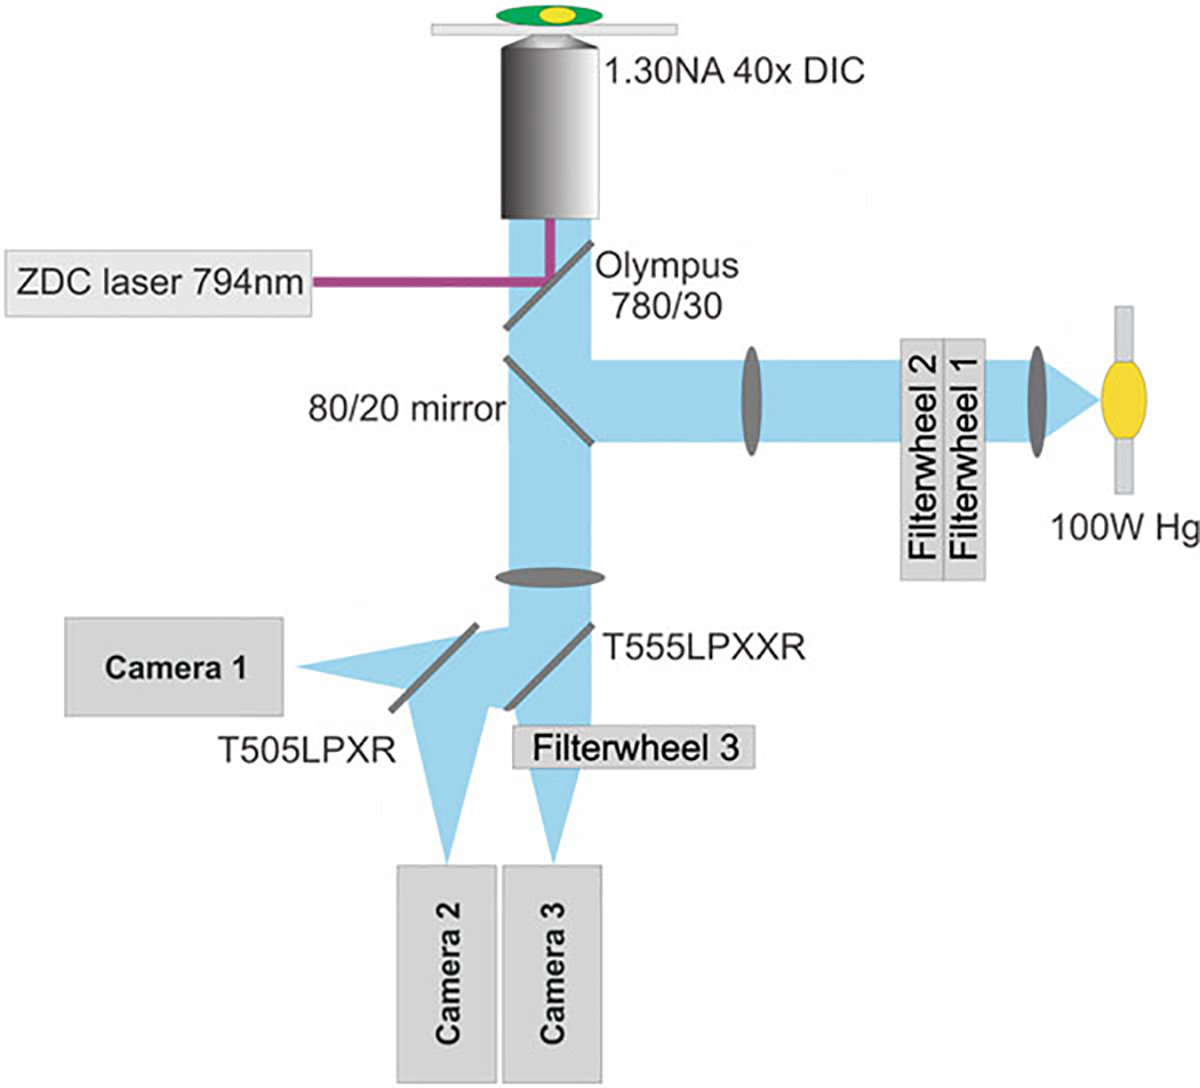
Schematic drawing of the inverted microscope used for live cell, multiplex imaging of Rho GTPase activities. The microscope as depicted is configured for simultaneous CFP-YFP FRET biosensor imaging and DIC/NIR imaging setup. Filterwheel 1: switches the neutral density filters; Filterwheel 2: switches the excitation band-pass filters; Filterwheel 3: switches the emission band-pass filters. Microscope is equipped with Olympus Zero Drift Compensation (ZDC) autofocus mechanism using a 794 nm laser source. The main fluorescence turret of the microscope is equipped with an 80/20 (transmittance/reflection) mirror (Chroma). Details of the construction and specification of this microscope can be found elsewhere [9]
3. Methods
3.1. Production of Double-Stable and Inducible NIR-Rac1 FRET Biosensor Cell Lines
NIR FRET biosensors can be transduced into cells that already harbor a CFP-YFP-FRET biosensor under the tet-inducible system, such as our Rho family GTPase biosensors [3, 10–14], or any other FRET biosensors that utilize the cyan-yellow fluorescent proteins (see Note 7). The following procedure requires the stable tet-OFF cell line (see Notes 2 and 4).
3.1.1. Production of Retrovirus
(Day 1) Treat 5 × 10 cm cell culture dishes (see Note 8) with 5 mL of poly-L-lysine solution (0.001% in DPBS) at room temperature for 15 min (see Note 9). Aspirate this solution; do not rinse dishes with DPBS but immediately proceed to plating cells. Plate GP2–293 cells on these treated 10 cm cell culture dishes at 6.5 × 10⁶ cells/dish (see Note 10).
(Day 2) Prepare PEI transfection mix. In 5 mL of OptiMEM in a 15 mL polypropylene tube, add 12 μg of pVSVg DNA, 12 μg of pGag-Pol DNA, and 48 μg of pRetro-X-hygro-DEST-NIR-Rac1 FRET biosensor DNA (see Note 11), vortex for 10 s; add 288 μL PEI solution and vortex for 10 s followed by 1 min centrifugation at room temperature at 300 × g. Incubate at room temperature for 15 min.
While the transfection mix incubates, rinse cells once with DPBS and add 4 mL/dish of DMEM with 10% FBS but without any antibiotic supplementation.
Following incubation, add 1 mL of the transfection mix dropwise to each plate. Swirl gently to mix.
Incubate the plates for 24 h at 37 °C and 5% CO2.
(Day 3) After the overnight transfection, gently add 3 mL/dish of serum-free DMEM without antibiotics, and transfer the cell plates to an incubator set at 32 °C and 5% CO2, and incubate for an additional 48 h (see Note 12).
(Day 5) Collect the medium from the dishes and centrifuge at room temperature at 300 × g for 5 min to pellet any cell debris. Filter the supernatant through a 0.45 μm syringe filter and collect into a 50 mL tube (see Note 13). Mix this together with the Retro-X concentrator solution, following the manufacturer’s protocols (see Note 14). Store this mixture at 4 °C overnight (see Note 15).
(Day 6) Centrifuge the viral supernatant-concentrator mixture at 1500 × g for 45 min at 4 °C. Aspirate the supernatant, leaving a white pellet at the bottom of the tube. Resuspend the pellet into 300 μL, in serum- and antibiotic-free DMEM (see Note 16). This solution can be used directly to infect cells at this time, frozen at −80 °C, or stored for a short time (1 week) at 4 °C (see Note 17).
3.1.2. Infection and Selection of Cells
(Day 1: this step should coincide with the step 7 of Subheading 3.1.1) Plate MEF at 2.4 × 10⁴ cells/dish onto a 6 cm tissue culture dish (see Notes 18 and 19), and incubate overnight prior to infection.
(Day 2: first cycle of infection) In the morning, aspirate cell medium and dropwise add 150 μL of the concentrated virus solution. If using a 6 cm tissue culture dish, add complete culture medium to make the total volume to 2 mL. If using a 35 mm tissue culture dish, make to 1 mL total volume. Supplement the medium with polybrene at 8 μg/mL, and incubate 6 h at 37 °C and 5% CO2.
(Day 2: second cycle of infection) In the evening, aspirate the medium, and add dropwise 150 μL of the concentrated virus solution, followed by addition of complete medium, supplement with 8 μg/mL polybrene, and incubate overnight at 37 °C and 5% CO2.
(Day 3) If any more concentrated virus solution is available and if cells appear unstressed at this point, it is possible to perform one additional cycle of infection. Alternatively, check infected cells for fluorescence using an epifluorescence microscope (see Note 20). Aspirate medium, and replace with normal culture medium. If fluorescence is visible, then supplement the medium with Dox at 1 μg/mL. If fluorescence is not visible, then continue incubation in normal culture medium and conditions for an additional 24 h and check again for fluorescence.
(Day 5) Start antibiotic selection at 48 h following the media change in step 4. Always maintain Dox at 1 μg/mL. For Hygro-resistance, start the selection at 125 μg/mL. Increase the concentration by doubling the antibiotic concentration until the final concentration of 500 μg/mL is reached (see Note 21). For Puro-resistance, start the selection at 1 μg/mL. Increase the concentration by doubling the antibiotic concentration until the final concentration of 10 μg/mL is reached.
After completion of the antibiotic selection, the new biosensor cell line should be expanded and then frozen down for storage (see Notes 22 and 23).
3.2. Multiplex Imaging of GTPase Activities Using Cyan-Yellow and NIR FRET Biosensors
MEF cells stably harboring two biosensors will be used to image two FRET biosensor activities in single living cells. Here we describe imaging of cyan-yellow RhoA biosensor [3] and NIR Rac1 biosensor [1]. We also demonstrated simultaneous imaging of cyan-yellow Rac1-GDI interaction biosensor [4] and NIR Rac1 biosensor [1]. Other combinations are possible in which NIR-FRET biosensors are combined with any other cyan-yellow FRET biosensors. This is made possible due to clean spectral separation achieved between the cyan-yellow versus NIR fluorescent proteins (Fig. 2). Here, we will focus on using a pair of single-chain biosensors in which equimolar distribution of the FRET donor and acceptor is guaranteed everywhere within a cell. This assumption is critical for making the simplification in the subsequent ratiometric data processing (see Notes 24 and 25).
Fig. 2.

Multiplexing of NIR FRET Rac1 and CFP-YFP FRET RhoA biosensors, reproduced from Shcherbakova et al. 2018 Nature Chemical Biology [1]. (a) Cartoon of the two biosensors multiplexed in single living cells. The NIR Rac1 biosensor uses miRFP670 [2] and miRFP720 [1] as the FRET pair, modulated by activity of C-terminally attached full length wildtype Rac1 GTPase interacting with a p21-binding domain (PBD) derived from p21 activated kinase 1. Affinity of the PBD toward Rac1 interaction is tuned appropriately by incorporating a dimerization-based autoinhibitory motif through a 2nd PBD containing GTPase-binding deficient mutations [12]. The NIR Rac1 biosensor can be imaged together with any cyan-yellow FRET-based biosensors including that for RhoA also depicted here [3]. (b) The excitation spectra of miRFP670 (FRET donor) and miRFP720 (FRET acceptor) are shown together with the bandpass filter used to excite the cyan-yellow FRET biosensor (magenta shaded region, ET436/20× Chroma Technology). The spectra are normalized to the peaks at ~400 nm at the “Soret” band. (c) Bleedthrough characterization between different channels of the microscope used for multiplex imaging. Top-Left: Purified Venus FP fluorescence. Top-Right: Purified Cerulean FP fluorescence. Bottom-Left: Purified miRFP670 fluorescence. Bottom-Right: Purified miRFP720 fluorescence. In all panels, the first data point (yellow square) is the vehicle control (water) where no FP was included. Intensity range useful for live-cell imaging is shown as a diagonally shaded box
3.2.1. Coverslip Preparation for Imaging
(Day 1) Ultrasonicate for 1 h in 1 N HCl, 25 mm #1.5 round coverslips, placed onto coverslip holders in a glass jar. Following ultrasonication, leave the coverslips in 1 N HCl solution overnight.
(Day 2) Drain the HCl solution, rinse the coverslips with water, and place them back into the glass jar filled with 50:50 ethanol-water mixture. Ultrasonicate for 1 h.
Replace the solution with 70:30 ethanol-water mixture. Ultrasonicate for 1 h.
Replace the solution with 200-proof ethanol. Ultrasonicate for1 h.
Transfer the cleaned coverslips to holding jars containing200-proof ethanol.
(Day of the experiment) Place cleaned coverslips into 6-well plates, containing 4 mL DPBS per well (see Note 26). Aspirate and replace with 10 μg/mL fibronectin in 1 mL DPBS, and incubate at room temperature for 1 h prior to plating cells.
3.2.2. Induction of Biosensor Expression
(Day 1) MEFs harboring two biosensors, propagated in 10 cm tissue culture dishes, will be used. Wash cells 2 × in DPBS and trypsinize to detach cells (see Note 27). Collect detached cells in a 15 mL tube by resuspending in 10 mL normal complete growth medium; centrifuge at room temperature at 300 × g for 3 min. Aspirate carefully to remove as much medium as possible. Resuspend into 10 mL of normal growth medium without any selection antibiotics and without Dox, and plate 5 × 10 cm tissue culture dishes at 1:20 dilution (see Note 28).
(Day 2) Wash plated cells from Day 1, 2 × in DPBS and trypsinize to detach cells. Resuspend the cells in 10 mL of fresh complete growth medium (without Dox or any of the selection antibiotics), and immediately put them back down onto the same tissue culture dish. The second trypsinization significantly improves the extent of biosensor expression; thus, it may be optional depending on the expression levels desired (Fig. 3).
Add biliverdin to media at 25 μM to improve miRFP maturation (see Note 29).
(Day 3) Wash cells 2 × in DPBS and trypsinize to detach cells. Resuspend cells in 10 mL of soybean trypsin inhibitor in DPBS, and centrifuge at room temperature at 300 × g for 3 min. Resuspend cells in complete culture medium, and plate cells at 4 × 10⁴ cells/well on prepared 25 mm coverslips placed into 6-well dishes. Allow 2–4 h for cells to attach and spread before imaging. At this point, withhold biliverdin from media.
Fig. 3.

Western blot showing the inducible expression of RhoA biosensor in MDA-MB231 tet-OFF cell line, detected using anti-RhoA GTPase antibody. Lane 1: Cell lysate from cell culture maintained with 2 μg/mL Dox; Lane 2: Cell lysate from biosensor induced cells that underwent single cycle of trypsinization; Lane 3: Cell lysate from biosensor induced cells that underwent two cycles of trypsinization. Endogenous RhoA expression levels are similar in all cases
3.2.3. Imaging of Biosensors in Living Cells
(3 h prior to imaging) Prepare imaging medium. Ham’s F-12K without phenol red supplemented with glutamine is used for imaging as it has low background fluorescence in all fluorescence channels used. 2 mL of imaging medium is prepared per coverslip of cells to be imaged. Take appropriate volume plus 1 mL excess of the medium into a 15 mL tube. Gently bubble argon gas through the medium for approximately 1 min (see Note 30) to displace dissolved oxygen from media. In 2 mL round bottom Eppendorf tubes, add 20 μL of Oxyfluor reagent, 4 μL of sodium-DL-lactate solution, 60 μL of FBS, and 2 mL of argon gas-treated Ham’s F-12K medium (see Note 31). Incubate the imaging medium at 37 °C until ready to mount the coverslips (see Note 32). Do not supplement imaging media with biliverdin.
Mount the coverslips containing cells onto live-cell imaging chamber (the sealed chamber system [9], or Attofluor chamber). Alternatively, CellView or Mattek dishes can be used as well (see Note 33).
Using a 40× magnification objective lens (40× DIC N/A 1.30), set up for Köhler illumination and differential interference contrast (DIC) imaging (see Note 34).
Check and adjust the hardware autofocus settings (see Note 35).
Set up for illumination of miRFP670 (Table 1), set short camera exposure times such as 200 ms, and visualize the NIR FRET biosensor expression in cells using the live-view capability of the data acquisition software (see Note 36). Move the stage, identify, and locate a cell of interest in the middle of the field of view (see Note 37). Immediately close the shutter and stop live view observation. Check in each imaging channels of the multidimensional data acquisition scheme, by quickly snapping single-frame images in DIC, CFP, FRET (CFP-YFP), miRFP670, and FRET (miRFP670-miRFP720), and confirm that the exposure times and the relative illumination intensities are within the optimal camera digitization range (see Notes 38–40).
Start timelapse experiments (see Note 41). We typically acquire in the following order: (1) CFP-YFP FRET simultaneously, (2) miRFP670, (3) miRFP670-miRFP720 FRET, and (4) DIC (see Note 42).
Acquire control images, consisting of field shading, camera noise, and alignment calibration images [7]. Field shading image for each channel is acquired by taking 10 different cell-free fields of view at the appropriate focal plane, exposure, and light intensity conditions for each color (including DIC) (see Note 43). The acquired 10-frame image stacks are then median-filtered to produce single-frame images, free from random fluorescent noise and debris. Camera noise images are acquired in complete absence of illumination (see Note 44). For camera noise images, 10-frame averaging is performed to smooth out the stochastic fluctuation in noise. Field alignment calibration images are taken using mounted multispectral beads for the two side camera channels in CFP and FRET. To match the side port images to the bottom port images, we use rectilinear grid pattern for calibration (see Note 45). The calibration image data are immediately tested for computational convergence (Fig. 4) prior to concluding the imaging experiments for the day in order to ascertain that the nonlinear coordination transformation calculations work appropriately [7].
Table 1.
Bandpass filter specifications used for multiplex imaging of NIR FRET and CFP-YFP FRET biosensors in single living cells. “ET” designation indicates the filters were from Chroma Technology, Inc. “FF” designation indicates the filters were from Semrock, Inc.
| Channel ID | Excitation | Emission |
|---|---|---|
|
| ||
| CFP (donor) | ET436/20× | ET480/40M |
| FRET (CFP-YFP) | ET436/20× | ET535/30M |
| miRFP670 (donor) | FF01–628/32 | FF02–684/24 |
| FRET (670–720) | FF01–628/32 | FF01–794/160 |
Fig. 4.

Alignment of multiple imaging channels based on a priori calibration. Top panels: A field of multispectral beads, taken using the two cameras for CFP and cyan-yellow FRET channels (Cameras 1 and 2, as depicted in Fig. 1). The red arrows indicate the point used for the manual alignment of two fields of view. White bar = 20 μm. Middle left: Centroid locations of the calibration beads from the top panels as shown were extracted (Matlab routines incorporating particle-tracking methods by J.C. Crocker and D.G. Grier [24] were used) and overlaid, indicating a significant misalignment as a function of the location within the field. Middle right: The morphed alignment indicates correction applied to the FRET channel field of view to bring the two channels into register. The red arrows show the corresponding positions indicated in the top panels. Bottom panels: Zoomed in views of the data overlay showing the original and the morphed bead images. The zoomed region is indicated in the middle panels. White bar = 20 μm
3.2.4. Processing of Multiplex Image Data to Determine GTPase Activity
Details of ratiometric calculations and data processing procedures can be found in a number of other sources [6–8, 15]. However, we will describe herein specific details associated with processing of multiplex imaging data of two single-chain biosensors in a single living cell (see Note 46).
Establish the reference fluorescence channel in the data set. We normally set the CFP channel (side-port camera 2; Fig. 1) as the reference channel, and align all other channels to it during data processing. First, process CFP-YFP FRET ratiometric data set, followed by NIR FRET data set, then the DIC channel, and finally correct for stage drift in all channels using the DIC image set. The following will be described in terms of “donor” and “FRET” channels to be applicable to both CFP-YFP and NIR-FRET systems.
Flat-field correct the donor and FRETchannels by dividing the foreground images by the field shading images acquired in Subheading 3.2.3, step 7. Here, appropriate camera noise images should be subtracted from all images (both foreground and the shading images) prior to division by shading images (see Note 47). In addition, we also process the shade-corrected images by a 3 × 3 median filter to remove any hot pixel spots [7] (see Note 48).
For background subtraction, identify a region within the timelapse stack that is free from any foreground features as a function of time and measure average intensity values per unit area within such a region. Subtract this intensity value from every pixel of the corresponding image plane. Then, this process should be repeated at every timepoint in the timelapse stack [7]. Once the processing of the donor channel is complete, transfer the region of interest used to calculate the background fluorescence to the FRET channel data stack, and repeat the measurement and the calculation processes.
Coordinate transformation (“morphing”) (see Note 49) [7]. Using the calibration data obtained from multispectral beads at the two side cameras, perform the morphing operation using affine transformation in Matlab (see Note 50).
Image masking [7]. Manually determine the cell edge using the intensity-thresholding method based on the histogram distribution of pixel-intensities. Produce binary masks in 16-bit at every time point, and multiply into the cell images to produce segmented timelapse data stacks. Some previously described considerations include selection of dimmer structures versus brighter cell body regions, proper identification of the cell edge at thinner lamellipodia regions, and the out-of-focus light stemming from the shape and the height of a cell in three dimensions [6, 7, 15].
X-Y translational alignment. Using a cross-correlation-based approach, perform X-Y linear translational alignment optimization [7, 16] (see Note 51).
Calculate ratio of FRET/donor, taking into consideration floating point issues [6, 7, 15].
Perform photobleach correction calculations [17] (see Note 52).
Produce the channel alignment parameters between the side port (grid image obtained at Camera 2; Fig. 1) and the bottom port (grid image obtained at Camera 3; Fig. 1), using the rectilinear grid-based calibration data obtained in Subheading 3.2.3, step 7 (see Note 45). Using the determined parameters, perform the morphing calculations (affine transformation in Matlab) on the same calibration grid image set, by morphing the bottom port grid image into the reference channel grid image (the side port CFP channel). Then determine the number of X-Y linear pixel shifts in the morphed bottom port grid image that are necessary to bring the two grid images into correct alignment with each other (Fig. 5) (see Note 53).
Using the morphing parameters and X-Y linear pixel shift parameters determined in step 9, process the NIR FRET ratio images so that they are in alignment with the CFP-YFP FRET ratio images.
Process DIC channel images. Flat-field correct the DIC images (see Note 47). Perform morphing and X-Y linear shift operations using the parameters determined in step 9.
Stage-drift compensation (see Note 54). Identify a small feature within the corrected and aligned DIC channel that describes the motion of the field of view by positional drift of the stage and/or live-cell chamber system (see Note 55), i.e., a speck of debris, imperfections in the coverslip, etc. Using such a feature, produce a stack of binary masks that describe the motion of such a feature. Determine the centroid location of the binary mask at every time point, and calculate the pixel displacement in X-Y required to compensate for such a motion; then apply this correction to all FRET/donor ratio channels and the DIC channel. Examples of timelapse panels of two biosensor activities showing RhoA and Rac1 GTPase activities in a single living cell are shown in Fig. 6.
In order to more accurately align the two FRET/donor ratio channels (following the manual X-Y registration that was performed in step 10), perform a cross-correlational X-Y alignment optimization between the two FRET images at every time point [7, 16].
Fig. 5.

Grid-based alignment of side port channel (CFP) to the bottom port views. Comparison of the original unmodified bottom port view (Top left, Camera 3 in Fig. 1) shows significant deviation from the reference image obtained from the CFP channel (Top right) at the side camera (Camera 2 in Fig. 1). Coordinate transformation based on manual determination of control points within the grid image brings the bottom port view partially into register (Bottom left). Additional X-Y linear translation shift (−51 pixels in X and + 3 pixels in Y) (Bottom right) was required to fully register the bottom port view against the reference CFP channel image (Top right). Red bar = 20 μm
Fig. 6.
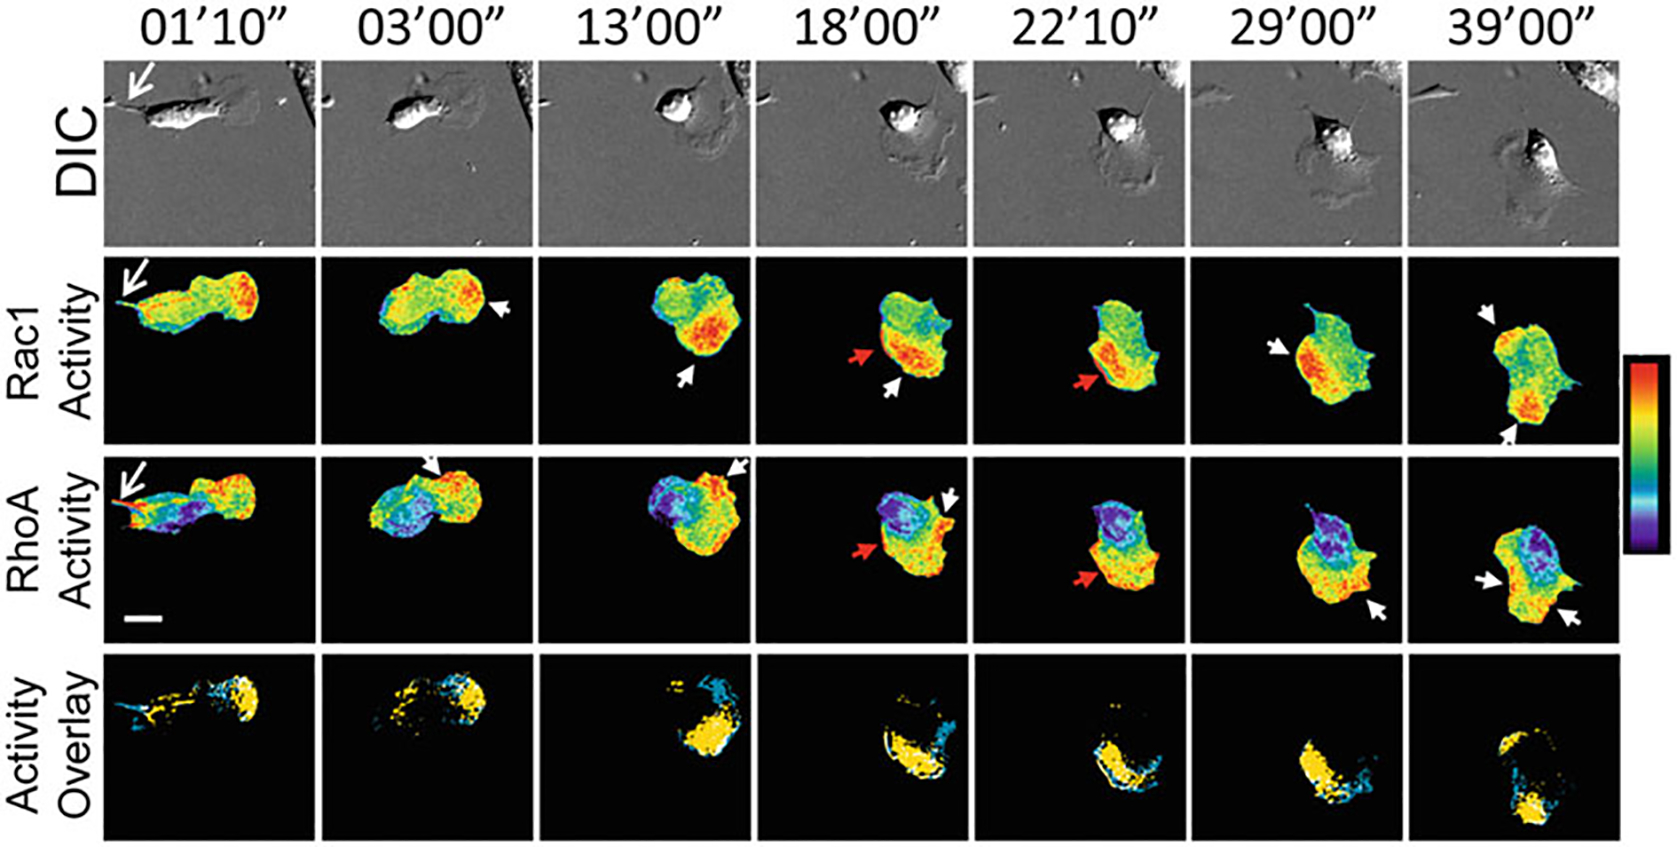
Representative, timelapse panels of RhoA and Rac1 activities imaged in a single living MEF, reproduced from Shcherbakova et al. 2018 Nature Chemical Biology [1]. Top panels: Differential interference contrast. Middle two panels: Rac1 activity (NIR FRET Rac1 biosensor; Upper panels) and RhoA activity (CFP-YFP FRET RhoA biosensor; Lower panels). Bottom panels: Localizations of high Rac1 (yellow) and high RhoA (blue) activities are overlaid, where regions of colocalization are shown in white. Regions of high Rac1 and RhoA activities were defined by intensity thresholding the top 2.5% of pixel ratio values within the image intensity histogram. Regions and features of interest are shown using matching colored arrowheads. White bar = 20 μm. Pseudocolor bar corresponds to ratio limits of 1.0 to 1.55 for Rac1 and 1.0 to 1.32 for RhoA activities (black to red)
Acknowledgments
This work was supported by National Institutes of Health grant GM136226 to LH. LH is an Irma T. Hirschl Career Scientist. RMB was supported by the Mamaroneck High School Original Science Research Program. MGW was supported by the Einstein-Montefiore Summer High School Research Program of the Albert Einstein College of Medicine, Graduate Division of Biomedical Sciences. NIR-Rac1 FRET biosensor was originally engineered, in part, by contributions from Tsipora M. Huisman, MD, and Natasha Cox Cammer [1]. Biosensor cDNA constructs and Matlab codes to enable processing of FRET data are available upon request.
Footnotes
We use tet-OFF system as opposed to tet-ON. We find that tetracycline/doxycycline has strong autofluorescence in the blue-green spectrum. The problem arises from differential levels of autofluorescence that occurs from Dox into the CFP-donor versus CFP-YFP FRET channels upon donor excitation. We found that this results in unpredictable artefacts when ratiometric calculations are performed in presence of the internalized Dox in cells. Due to spectral compatibility, NIR FRET biosensor systems do not suffer from this problem and are able to take advantage of the tet-ON system. However, when producing double-stable and inducible cell lines with cyan-yellow and NIR FRET biosensors, tet-OFF system is useful.
In addition to commercially available tet-OFF MEF cells, we have produced several tet-OFF cell lines in house, using the second-generation tet-OFF transactivator (tTA) system. To do this, we first prepare and infect cells using retrovirus harboring the tet-OFF tTA and select for stable integration by culturing cells in G418/neomycin (1 mg/mL) selection. Upon establishing the stable line, we then proceed to the second round of infection using retrovirus harboring the biosensor gene cassette under the tet-inducible promoter and containing a different selection marker than G418/neomycin (Puro, Hygro, etc.)
We have also successfully used HEK293T cells available from ATCC. However, we find that the freshness of cells used here matters greatly; thus, we maintain 293 cells in culture for the viral production purposes only for about 3–4 weeks (10–12 passages).
pQCXIN-tet-OFF-advanced is used for producing tet-OFF cell lines prior to infection with virus harboring the biosensor expression cassette (see Note 2).
The syringe filter is used to filter cellular membrane and other debris away from the viral supernatant. As such, the filter membrane material must not adsorb protein/virus or otherwise damage the virus as they are being filtered through. Nitrocellulose filter has been known to impact viral yield due to higher adsorption of viral surface proteins [18, 19].
A microscope system used for imaging of NIR fluorescent proteins and biosensors should be equipped with appropriate light source and camera. The light source should produce sufficient light power in NIR. Xenon lamp produces greater light output in red and NIR wavelengths, while producing significantly less light in blue-green-yellow wavelengths compared to a mercury arc lamp. Metal-halide lamp is also suitable for imaging; however, its power is usually lower than arc lamps, resulting in significantly longer exposure times being required. Also make sure that the infrared-blocking filter usually installed in the light housing does not block the longer wavelengths light. If such a filter is installed, it can be removed or replaced with a filter with wavelength cut-off at 780 nm. Because a blue-shifted excitation wavelength (628/32 nm) for miRFP670 (FRET donor) was required to minimize cross-excitation of miRFP720 (FRET acceptor), we used a mercury arc lamp for our imaging without significant issues. Lastly, the camera sensitivity should be considered for imaging of NIR fluorescence. We used Photometrics Coolsnap HQ2 operating in alternate-normal sensitivity mode of the sensor to boost the red and NIR wavelength sensitivity while sacrificing slightly the quantum efficiency in the blue-green wavelength range.
If a cell line only carrying the NIR-biosensor is required, then the parental tet-OFF MEF can be transduced with the retrovirus harboring the inducible, NIR FRET biosensor cassette. Similarly, tet-inducible cell lines can be produced for any other cell lines as required (see Note 2).
We have found that between 4 and 6 × 10 cm tissue culture dishes per a type of biosensor construct yield optimal virus concentration for infection. This can be scaled up or down depending on the efficiency of the viral transduction observed.
Be sure to let the poly-L-lysine/DPBS solution fully cover and wet the entire surface of the culture vessel. This is critical for obtaining good cellular adhesion and viral yield. The poly-L-lysine/DPBS solution can be reused 2–3 times, so collect the used fraction into an empty sterile bottle and reuse as required.
It is important that the cells be monodispersed when plated for transfection to achieve maximum transfection efficiency. GP2–293 cells do not attach to the culture vessels strongly; thus they have the tendency to slough off in multicellular clusters even when trypsinized. Ensure that trypsinization is complete and that cells are fully resuspended and monodispersed prior to plating.
If producing virus for tet-OFF cell line production, replace pRetro-X-hygro-DEST-NIR-Rac1 with pQCXIN-tet-OFF-advanced and proceed as written.
We normally process murine leukemia virus-based retroviral production at 32 °C and at 5% serum concentration. While there are considerations of the half-life and viral titer/yield based on different temperatures [20], we have found the conditions given here to produce excellent retroviral infectivity in our hands. As an aside, we process human immunodeficiency virus-based lentivirus production at 37 °C and at 5% serum concentration with excellent results.
When using a syringe filter, it is important to not be forceful or rapid when pressing on the syringe plunger. The virus in suspension is fragile and can be damaged by shear forces acting on them in solution from too much force and speed being exerted onto the syringe plunger. A good rate of speed is when the liquid being filtered comes out dropwise. If the filter feels clogged at any time during filtration, it should be replaced.
Retro-X concentrator is a 4× solution, divide the total volume of the viral supernatant by 3, and add this amount of the concentrator solution. The concentrator is a highly viscous solution: Slower pipetting is required to dispense the full volume in the pipette. Mix thoroughly by shaking.
To achieve the highest infectivity, one should proceed immediately to cell infection following the viral concentration. To do this, the target cells to be infected are plated at the same day as the start of the overnight incubation of the viral concentrator solution. This allows the first round of infections to take place on the following morning when the viral precipitation is completed. Cells to be plated and infected may be directly propagated from those already in culture; alternatively, we have had success by directly defrosting cells the evening before at relatively sparse cell density and then proceed to infect those cells the following morning. The cell density is critical to achieve the best results: It should be sparse; 10–20% confluence is ideal at the time of the first infection.
The viral resuspension must be performed very gently. Shear stress by pipetting too vigorously may damage the virus and impact infectivity.
Freshly prepared virus is the most infective virus. While we have stored viral supernatant at 4 °C for up to 1 week, we have observed significant reduction in infectivity as a function of time stored. The freeze-thaw cycle is to be avoided if at all possible. Each freeze-thaw cycle may impact the infectivity by as much as a factor of 50–70% in our hands.
In some cell lines, relative passage numbers are used as an important measure of the consistency of cell assay results. In these cases, the passage numbers of cells to be infected and made stable must be conserved as much as possible. To do this, we defrost the early passage-number cells the evening before infection at a very sparse cell density (see Note 15), so that multiple rounds of infections and at least the first few days of the antibiotic selection may be performed without having to pass these cells unnecessarily. This will take some trial and error to determine the optimal cell seeding density to allow proceeding to initial stages of selection without having to split the culture.
We have found that using smaller cell culture vessels (i.e., 35 mm round dishes) conserves the viral supernatant and achieves good results. One drawback, however, is that it may require additional cell passages to expand to larger culture vessels prior to cell freezing, adding to the passage numbers.
For NIR biosensors, it may be difficult to observe the fluorescence on a microscope at this point unless the media is supplemented with Biliverdin at 25 μM for 6 h to overnight. Addition of Biliverdin improves the fluorescence brightness of NIR fluorescent proteins by up to two orders of magnitude. At this point, if the fluorescence levels are low without addition of exogenous biliverdin, proceed to antibiotic selection and evaluate at a later stage after the completion of the selection process.
For all antibiotics, we add gradually greater amounts to reach the final selection concentrations. For MEFs treated with G418, the starting concentration is 125 μg/mL. This concentration is increased by doubling when cells appear to be no longer under stress and are growing normally. The final concentration is 2 mg/mL (the normal maintenance concentration is 1 mg/mL). G418 is antagonized by Pen/Strep in culture; however, we have routinely produced stable cells with G418 resistance even in the presence of Pen/Strep in culture. For Puro, the starting concentration is 1 μg/mL. The concentration is doubled until reaching the final concentration (10 μg/mL).
When defrosting stable biosensor cell lines, be sure to defrost into medium containing the full strengths of antibiotic selection (G418, Puro, Hygro, plus Dox for biosensor repression). This ensures that only those cells stably incorporating the gene expression cassettes are propagated. Depending on how quickly the clonal selection process may outcompete in a particular cell line, it is possible to withhold the selection antibiotics after a while (Dox is always required). The duration of time for which this is possible should be determined empirically for individual cell lines as necessary.
Stable biosensor cell line may be FACS sorted to obtain population of cells that express similar amounts of biosensor. This is particularly useful when producing double-stable cell lines. We normally produce the stable cyan-yellow biosensor cells first, followed by FACS sorting to obtain tighter population distributions of the expression levels. This is then followed by a second infection and production of a double-stable cell line containing also the NIR biosensor and a second round of FACS sorting. Additionally, it is important also to determine how much exogenous biosensor is expressed compared to the endogenous protein levels.
Check the biosensor expression profile using Western blot and FACS. These analyses should point to possible issues that may be present if any single-color populations (FACS) or truncated fragments (Western blot) are visible. In these situations, ensure that the single-chain biosensor uses the synonymous modified codons [21] which prevent these spurious expression issues.
For single-chain biosensor systems, the relative concentrations of the FRET donor and acceptor moieties are everywhere equal to each other in cells because the FRET moieties are physically linked to one another in a single molecule. In dual-chain biosensor systems, this is more complex because the two FRET moieties are not linked; thus, differential concentrations and accessibilities exist within subcellular compartments. Due to differential localization and accessibility, the sensitivity of the biosensor will change as a function of the concentrations of the FRET donor/acceptor moieties within a given subcellular compartment: Fluctuations in concentrations of either the donor or the acceptor act to change the forward or the reverse rate of the binding reaction (i.e., Le Chatelier’s principle), dynamically altering the biosensor sensitivity. Furthermore, we induce biosensor expression for 48 h, which ensures steady-state levels of biosensors are attained in cells to minimize any potential effects from differential maturation times of different fluorescent proteins.
Coverslips tend to float on top of DPBS. Use sterile pipette tips to push them down under the surface of DPBS in wells.
Trypsinization is important for biosensor induction. In cases where only EDTA or Accutase (both non-tryptic cell-detachment agents) was used, biosensor expression was not fully achieved. We think that trypsinization and associated tryptic damage to the cellular receptors may result in translational activation, driving biosensor expression also from the bystander effects of such activation.
Relatively high dilution factor of plating during biosensor induction is important. We think that this (1) helps to dilute out Dox from cells into excess media and (2) drives stress-related gene programs from sparse plating, resulting in co-activation of biosensor translation due to bystander effects.
miRFP requires biliverdin as the chromophore. This is a natural heme oxidation product and should be available in FBS; however, the amount available in cell culture medium is at limiting levels. We supplement the medium with exogenous biliverdin during induction for at least 6 h up to overnight at 25 μM to achieve up to two orders of magnitude improvement in brightness of the miRFP-based constructs.
We attach a clean glass Pasteur pipette at the end of the hose from the Argon gas tank which is set at very low pressures. The Pasteur pipette is then used to bubble the gas into the media.
To remove any sources of air (oxygen), we also back fill the underside of the caps of Eppendorf tubes with argon gas purged medium to expel as much air as possible from the imaging medium preparations.
There are situations in which reactive oxygen species are required for cellular signaling pathways, including cell motility. To determine the requirement, it is important to perform control experiments in which non-deoxygenated imaging medium is used and the readouts be directly compared against one another.
In the case of open chamber systems, mineral oil can be layered onto the imaging medium to protect it from evaporation and gas exchange. The sealed chamber system does not require the oil because it uses a clean coverslip to seal the upper side of the chamber [9].
Higher magnifications are also possible. Calculate the Nyquist sampling limit of the magnification based on the particular dimensions of the camera pixels. Increased magnification above the Nyquist limit does not gain further spatial resolution but simply results in loss of brightness.
Hardware autofocus system detects the interface position between the glass and the water, using the difference in the refractive index of water vs. glass. As such, the best focus positions for cells are usually found to be further away from this glass-water interface by a specific offset distance, which depends also on the specific cellular features of interest and the wavelength of the probes being used. Therefore, it is important to determine the focus offsets for each of the wavelength to be used in the acquisition sequence so that the autofocus system may be pre-programed with such offsets for each channel during timelapse imaging. In the absence of the hardware autofocus capabilities, software-based autofocus using DIC can be employed [16, 22, 23].
NIR biosensor is not readily visible by naked eye through the objective lens due to their far-red wavelengths characteristics. Instead, live-view function through the camera is used to find cells in the field of view that expresses the biosensor.
The speed at which one scans through the specimen and determines the ideal field of view, adjusts the exposure conditions, and initiates the timelapse imaging is very important to minimize photobleaching. If/when a good cell is found, do not keep looking at it, and immediately turn off the live-view illumination. If further stage adjustments are necessary, perform these operations in DIC to minimize photobleaching of fluorescence.
The fluorescence intensity of the acquisition should be adjusted so that pixel intensity histogram in each image frame should fill approximately 80% of the total digitization range of the scientific camera. This should be adjusted by changing the neutral density filter and the camera exposure times accordingly.
When acquiring a pair of FRET and donor images using a single camera, it is preferable to keep the same neutral density filter for both and only adjust the camera exposure times to make the acquired intensity ranges approximately the same in both channels. Once this “ratio” of exposure times is determined for each biosensor, always maintain this ratio of exposure times between the donor and the FRET channels. When using a dual camera approach to acquire simultaneously both the donor and the FRET emissions, the camera exposure times may or may not be independently adjustable depending on the software controller platform specifications. If camera exposure times are not independently adjustable (i.e., Metamorph), we insert a neutral density filter in the emission light pathway of the brighter channel to adjust the total light flux to be approximately the same in both donor and FRET channels.
To minimize photo-damage to cells during live cell imaging, the brightness of the excitation light and the duration of camera exposure should be carefully adjusted. Cells tolerate better dimmer illumination for a longer duration of acquisition as opposed to shorter acquisition times under brighter illumination. We attenuate the intensity of excitation light using neutral density filters so that each fluorescence channel takes approximately 600–1200 ms to reach 80% histogram fill level of the digitization range of the camera.
Timelapse experiments for MEFs usually span 40 min at 10 s intervals of acquisitions, for a total of 240 consecutive frames. Sometimes, an even longer imaging is possible depending on the photobleach mitigation and with appropriate cell health monitoring.
It is important to consistently maintain the order of image acquisition the same. However, it is also important to reverse the order of acquisition as control experiments to determine if specific biosensor features visible in cells are due to some sort of artefacts from the specific order of image acquisition used. The switching of the order of acquisition can also be used to effectively determine the extent of motion artefact present within the data acquisition time series.
When acquiring flat-field/shading control image sets, it is important to maintain the acquisition conditions as identical to the actual timelapse experiments as possible. This includes the amount of immersion oil used, amount of media used in a live-cell chamber, the order of data acquisition, and the appropriate focal plane for each channel (i.e., predetermined offsets from the glass-water interface at each wavelengths).
To achieve complete isolation from any stray light, close the hardware shutters on the microscope manually.
If multispectral beads do not extend far into NIR wavelengths, calibration beads may be custom produced to cover those wavelengths. We also find that the large relative shifts and differences in magnifications between the side port and the bottom port often make automated tracking-based calibration approaches more cumbersome. Thus, we find the use of grid-based calibration to be more straightforward by manually setting the control points for morphing (Fig. 5).
Dual-chain-based FRET biosensor data processing will require additional controls and processing routines that are beyond the scope of the current work. Additional details can be found elsewhere [7, 15].
| (1) |
The components necessary for this correction are as follows: (1) data image stack for the donor and FRET ([IMAGE]), (2) corresponding shading images in donor and FRET channels ([SHADE]), (3) noise image set for the exposure times used in donor and FRET acquisitions ([DC]; denotes average pixel intensity value of the [DC] image), and (4) a scaling factor ([SF]) to account for floating point calculation issues.
Whenever two images are divided by one another, take into consideration floating point calculation issues. Floating point issues arise from how computers operate—binary operations, calculating in integers. The problem here is that when two images of similar intensities are divided, the pixel values in the resulting image scale to numbers close to 1.0. These numbers are then either rounded up or down due to the integer operation requirement of computing. Thus, a scaling factor is required to move the decimal point during the calculation so that the pixel intensity range in the resulting image will resemble that of the original image set. In some image processing platforms, scaling factors are automatically set to the maximum pixel value found in the original input image. This would be problematic because the scaling factors will be different every time images of different intensities are processed. We circumvent this problem by specifying a scaling factor of 1000 when performing any image-to-image division in 16-bit depth.
Morphing is critical for dual-camera setup (Fig. 1; Cameras 1 and 2). This stems from imperfect mounting of two cameras, dichromatic mirrors, and bandpass filters in the optical beam splitter pathway. If only a single camera is used, this is usually not necessary; however, it may still be useful to test for the extent of lateral chromatic aberration and correct if required. Mounted multispectral beads are used to obtain calibration fields of views. Matlab routine based on a particle tracking algorithm package by J. C. Crocker and D.G. Grier [24] is used to extract the positional parameters, followed by affine transformation to perform the alignment.
We maintain the CFP channel as the global reference channel and align all other channels to it during image processing.
X-Y translational alignment is needed even after performing the morph operations. Morphing is a field-based operation that uses calibration patterns to determine the transform matrix for the coordinate transformation. We use affine transformation, which is a linear functional transformation followed by a translation. Depending on the morphing parameters, the resulting morphed image channel may be rotated at some angle compared to the reference image channel, which is then fitted into a rectangular matrix. Thus, the affine transformation we use does not preserve the location of the origin, as well as the morphed image may also become larger or smaller compared to the original. We account for this motion of the X-Y origin location by performing an additional X-Y translocation alignment procedure [16].
The photobleach correction algorithm that we use [17] is based on an important biological assumption regarding the Rho family GTPases. The assumption is that the great majority (>95%) of cellular Rho GTPases are in complex with the guanine nucleotide dissociation inhibitor (GDI) and inactive at any given time [25]. This makes it possible to model the photobleach kinetic as a double-exponential decay function of inactive, non-responsive biosensor fluorescence in solution. This assumption will not necessarily hold for other molecules and biosensor probes that do not behave similarly to the Rho family GTPases in living cells.
X-Y pixel shift values can be approximate at this point. Whole pixel values are usually determined and applied. Additional fine-resolution alignment may be performed later using a cross-correlation-based approach [16].
We have observed that, depending on the live-cell chamber system used, there will be a significant and continual shift in the X-Y position as a function of time in the field of view. The problem is also exacerbated when multistage position acquisitions are performed. The source of this shift for our system has been determined as the autofocus system that is installed on our Olympus microscope (the first-generation Zero Drift Compensation system [ZDC]). This system continuously moves the objective lens during the focus search routine, which transfers the motion onto the live-cell chamber causing small fluctuations in X-Y position.
Make sure that the motion of the speck of dirt/debris is independent from the motion of a cell from protrusions and general motility. It is easy to determine this by running the movies back and forth and see if the motion scales to that of the background coverslip or to the cell.
References
- 1.Shcherbakova DM, Cox Cammer N, Huisman TM, Verkhusha VV, Hodgson L (2018) Direct multiplex imaging and optogenetics of Rho GTPases enabled by near-infrared FRET. Nat Chem Biol 14(6):591–600. 10.1038/s41589-018-0044-1 [DOI] [PMC free article] [PubMed] [Google Scholar]
- 2.Shcherbakova DM, Baloban M, Emelyanov AV, Brenowitz M, Guo P, Verkhusha VV (2016) Bright monomeric near-infrared fluorescent proteins as tags and biosensors for multiscale imaging. Nat Commun 7:12405. 10.1038/ncomms12405 [DOI] [PMC free article] [PubMed] [Google Scholar]
- 3.Pertz O, Hodgson L, Klemke RL, Hahn KM (2006) Spatiotemporal dynamics of RhoA activity in migrating cells. Nature 440 (7087):1069–1072 [DOI] [PubMed] [Google Scholar]
- 4.Hodgson L, Spiering D, Sabouri-Ghomi M, Dagliyan O, DerMardirossian C, Danuser G, Hahn KM (2016) FRET binding antenna reports spatiotemporal dynamics of GDI-Cdc42 GTPase interactions. Nat Chem Biol 12(10):802–809. 10.1038/nchembio.2145 [DOI] [PMC free article] [PubMed] [Google Scholar]
- 5.Longo PA, Kavran JM, Kim MS, Leahy DJ (2013) Transient mammalian cell transfection with polyethylenimine (PEI). Methods Enzymol 529:227–240. 10.1016/B978-0-12-418687-3.00018-5 [DOI] [PMC free article] [PubMed] [Google Scholar]
- 6.Hodgson L, Pertz O, Hahn KM (2008) Design and optimization of genetically encoded fluorescent biosensors: GTPase biosensors. Methods Cell Biol 85:63–81 [DOI] [PubMed] [Google Scholar]
- 7.Spiering D, Bravo-Cordero JJ, Moshfegh Y, Miskolci V, Hodgson L (2013) Quantitative ratiometric imaging of FRET-biosensors in living cells. Methods Cell Biol 114:593–609. 10.1016/B978-0-12-407761-4.00025-7 [DOI] [PMC free article] [PubMed] [Google Scholar]
- 8.Bravo-Cordero JJ, Moshfegh Y, Condeelis J, Hodgson L (2013) Live cell imaging of RhoGTPase biosensors in tumor cells. Methods Mol Biol 1046:359–370. 10.1007/978-1-62703-538-5_22 [DOI] [PMC free article] [PubMed] [Google Scholar]
- 9.Spiering D, Hodgson L (2012) Multiplex imaging of rho family GTPase activities in living cells. Methods Mol Biol 827:215–234. 10.1007/978-1-61779-442-1_15 [DOI] [PMC free article] [PubMed] [Google Scholar]
- 10.Donnelly SK, Cabrera R, Mao SPH, Christin JR, Wu B, Guo W, Bravo-Cordero JJ, Condeelis JS, Segall JE, Hodgson L (2017) Rac3 regulates breast cancer invasion and metastasis by controlling adhesion and matrix degradation. J Cell Biol 216(12):4331–4349. 10.1083/jcb.201704048 [DOI] [PMC free article] [PubMed] [Google Scholar]
- 11.Miskolci V, Wu B, Moshfegh Y, Cox D, Hodgson L (2016) Optical tools to study the isoform-specific roles of small GTPases in immune cells. J Immunol 196(8):3479–3493. 10.4049/jimmunol.1501655 [DOI] [PMC free article] [PubMed] [Google Scholar]
- 12.Moshfegh Y, Bravo-Cordero JJ, Miskolci V, Condeelis J, Hodgson L (2014) A trio-Rac1-Pak1 signalling axis drives invadopodia disassembly. Nat Cell Biol 16(6):574–586. 10.1038/ncb2972 [DOI] [PMC free article] [PubMed] [Google Scholar]
- 13.Hanna S, Miskolci V, Cox D, Hodgson L (2014) A new genetically encoded single-chain biosensor for Cdc42 based on FRET, useful for live-cell imaging. PLoS One 9(5): e96469. 10.1371/journal.pone.0096469 [DOI] [PMC free article] [PubMed] [Google Scholar]
- 14.Zawistowski J, Sabouri-Ghomi M, Danuser G, Hahn K, Hodgson L (2013) A RhoC biosensor reveals differences in the activation kinetics of RhoA and RhoC in migrating cells. Plos One 8 (11):e79877. [DOI] [PMC free article] [PubMed] [Google Scholar]
- 15.Hodgson L, Shen F, Hahn K (2010) Biosensors for characterizing the dynamics of rho family GTPases in living cells. Curr Protoc Cell Biol Chapter 14:Unit 14.11.1–Unit 14.1126 [DOI] [PMC free article] [PubMed] [Google Scholar]
- 16.Shen F, Hodgson L, Rabinovich A, Pertz O, Hahn K, Price JH (2006) Functional proteometrics for cell migration. Cytometry A 69(7):563–572. 10.1002/cyto.a.20283 [DOI] [PubMed] [Google Scholar]
- 17.Hodgson L, Nalbant P, Shen F, Hahn K (2006) Imaging and photobleach correction of Mero-CBD, sensor of endogenous Cdc42 activation. Methods Enzymol 406:140–156 [DOI] [PubMed] [Google Scholar]
- 18.Kostenbader KD Jr, Cliver DO (1983) Membrane filter evaluations using poliovirus. J Virol Methods 7(5–6):253–257 [DOI] [PubMed] [Google Scholar]
- 19.Wallis C, Henderson M, Melnick JL (1972) Enterovirus concentration on cellulose membranes. Appl Microbiol 23(3):476–480 [DOI] [PMC free article] [PubMed] [Google Scholar]
- 20.Beer C, Meyer A, Muller K, Wirth M (2003) The temperature stability of mouse retroviruses depends on the cholesterol levels of viral lipid shell and cellular plasma membrane. Virology 308(1):137–146 [DOI] [PubMed] [Google Scholar]
- 21.Wu B, Miskolci V, Sato H, Tutucci E, Ken-worthy CA, Donnelly SK, Yoon YJ, Cox D, Singer RH, Hodgson L (2015) Synonymous modification results in high-fidelity gene expression of repetitive protein and nucleotide sequences. Genes Dev 29(8):876–886. 10.1101/gad.259358.115 [DOI] [PMC free article] [PubMed] [Google Scholar]
- 22.Shen F, Hodgson L, Hahn K (2006) Digital autofocus methods for automated microscopy. Methods Enzymol 414:620–632 [DOI] [PubMed] [Google Scholar]
- 23.Shen F, Hodgson L, Price JH, Hahn KM (2008) Digital differential interference contrast autofocus for high-resolution oil-immersion microscopy. Cytometry A 73(7):658–666 [DOI] [PubMed] [Google Scholar]
- 24.Crocker JC, Grier DG (1996) Methods of digital video microscopy for colloidal studies. J Colloid Interface Sci 179:298–310 [Google Scholar]
- 25.Del Pozo MA, Kiosses WB, Alderson NB, Meller N, Hahn KM, Schwartz MA (2002) Integrins regulate GTP-Rac localized effector interactions through dissociation of Rho-GDI. Nat Cell Biol 4(3):232–239 [DOI] [PubMed] [Google Scholar]