Abstract
In this work we propose an open-top like common-path intrinsically achromatic optical diffraction tomography system. It operates as a total-shear interferometer and employs Ronchi-type amplitude diffraction grating, positioned in between the camera and the tube lens without an additional 4f system, generating three-beam interferograms with achromatic second harmonic. Such configuration makes the proposed system low cost, compact and immune to vibrations. We present the results of the measurements of 3D-printed cell phantom using laser diode (coherent) and superluminescent diode (partially coherent) light sources. Broadband light sources can be naturally employed without the need for any cumbersome compensation because of the intrinsic achromaticity of the interferometric recording (holograms generated by –1st and +1st conjugated diffraction orders are not affected by the illumination wavelength). The results show that the decreased coherence offers much reduced coherent noise and higher fidelity tomographic reconstruction especially when applied nonnegativity constraint regularization procedure.
1. Introduction
Quantitative phase microscopy (QPM) [1–4] is gaining a lot of interest, as it provides measurable information about phase distribution of the tested semi-transparent object, without the need of staining the sample. It showed its powerful imaging capabilities in plethora of applications, e.g., biomedicine [5], neuroscience [6], blood and flow cytometry [7,8] or cell pathophysiology [9]. The label-free imaging is achieved thanks to the intrinsic contrast of transparent (phase) samples – each component of the sample introduces different optical delay to the light. However, QPM imaging only delivers an averaged phase delay (along the Z axis), losing the information about internal structure of the imaged object. Additionally, phase delay (optical thickness) can change due to the local variation of both refractive index and physical thickness of the sample. Therefore, using the integrated QPM technique, we are not able to differentiate between these two pivotal sample features.
A technique that solves this ambiguity and adds the dimension of optical sectioning to the QPM is optical diffraction tomography (ODT) [10–16]. It enables recovery of the 3D distribution of the samples refractive index (RI). It can be applied to various technical and biological transparent objects. The standard, most popular ODT techniques rely on first order Born or Rytov approximations [17,18], which limits their application to weakly-scattering samples. However, this constraint was recently overcome with new reconstruction algorithm architectures that consider multiple scattering [19–24].
Usually, ODT is realized in classical interferometric systems (commonly, but not exclusively, based on Mach-Zehnder interferometer) with sample illumination scanning [2,12,25–27], sample rotation [28–31] or combination of both for increased axial resolution [32–35]. Recent works also showed possibility of ODT with reduced coherence, though they require dispersion compensation in form of digital micromirror device (DMD) [36] or spatial light modulator [37]. Other approaches for obtaining 3D RI distribution take advantage of axial scanning [38–41], structured illumination [42–44] or using the Wolf equations for propagating correlations of partially coherent light [45,46]. Another set of methods allowing for 3D phase imaging relies on phase retrieval techniques. They use programmable LED array illumination and advanced numerical reconstruction engines, e.g., 3D quantitative differential phase contrast [47], Fourier ptychography [19,20,48–51] and transport of intensity equation [52–55].
QPM and ODT can also be realized using common-path interferometric configurations. They possess a number of advantages over the classical Mach-Zehnder type setups, such as high immunity to vibrations, aberrations and other environmental disturbances. They often have a concise build, offer possibility of operation with reduced coherence illumination, yet the phase demodulation is still achievable with the classical interferometric approach (no iterative phase retrieval algorithms are required). In common-path configurations two-types of interferometric systems can be distinguished – shearing and total-shear systems. The former measure the derivative of the phase and require processing in two perpendicular shearing directions [56–59]. Although they offer very easy implementation and compactness, shearing systems are limited to slowly varying phase distribution, require precisely manufactured phase diffraction gratings (such as Modified Hartmann Mask, MHM) and the resolution is decreased due to the used MHM. The total shear common-path systems are based on the classical object-reference-beam interference. The most commonly used configurations deploy point diffraction interferometry (diffraction phase microscopy, DPM) [60–63], but due to the addition of the 4f system they become bulky and need special, customized double pinhole with variable sizes, which makes such systems hardly accessible and cumbersome in alignment. An easy modification of the classical microscope system into QPM was showed in the form of spatially-multiplexed interferometric microscope (SMIM), which utilizes diffraction grating and specially prepared sample regions [64–68]. Common-path ODT has been shown for both coherent and incoherent sample illumination mostly utilizing the point diffraction interferometry approach, meaning those systems require the additional 4f processor [69–71], and in order to use low-coherence light source they require a compensation plate to be introduced in the 1st diffraction order [72].
In this contribution we propose a simple, compact, common-path grating-based ODT system with partially coherent illumination, based on our previous interferometric microscope system [73]. It can be used for measurements of small objects such as sparsely distributed single cells. We employ a simple Ronchi-type amplitude diffraction grating and rotating illumination arm as only additional elements in the optical path of the conventional microscope system.
In the proposed architecture, the interference pattern (hologram) in the camera plane is obtained by placement of the diffraction grating at an appropriate distance from the microscope image plane. As a result, the system operates as a common-path object-reference type interferometer. Notably, the three-beam interferogram is of interest, as it contains an achromatic second harmonic generated by the +1st and −1st grating diffraction orders (as their optical path difference is equal to zero) [73]. This feature enables the use of an illumination source with reduced coherence to diminish coherent noise, remove unwanted parasitic interference patterns, increase the compactness of the setup (no need for additional 4f processor) and augment available bandwidth by eliminating the first harmonic peaks. The lack of the 4f system also significantly simplifies the common path tomographic projection registration, as there is no need for compensation of the beam angle (which shifts in the Fourier plane of the 4f system where the pinhole is placed) or utilization of the specially designed dual-size pinhole (which optical alignment might be cumbersome). Additionally, the single-shot off-axis operation promotes the setup in terms of fast 2D phase projections calculation. Actually, proposed method works in “double off-axis” regime, as the angle between interfering beams (−1st and +1st orders) is doubled with respect to the regular off-axis DPM setups (where 0th and ±1st orders are generating the holograms).
The proposed setup was successfully applied for tomographic evaluation of a phantom [74] of a biological cell that was designed specifically to test 3D imaging capability of ODT systems. To verify the key advantage of our system, that is its intrinsic achromaticity, we captured two tomographic data series, one using fully coherent and second partially coherent illumination. The 3D tomograms were obtained using automatic interferogram processing with background correction, followed by tomographic reconstruction under first order Rytov approximation and nonnegativity regularization. Analysis of the obtained results fully corroborated the analytical and theoretical description of the proposed novel system.
2. Methods and results
2.1. Experimental system
Experimental setup is based on the grating deployed total-shear three-beam interference microscope presented in [73]. The principle of the optical field coding in the system is discussed in the next Section (2.2). To realize tomographic imaging a set of various sample projections is required. In our system this is achieved with the azimuthal rotation arm that is mounted above the sample space, similarly to [72,75,76]. Here we would like to highlight great advantages of this solution over the conventional dual objective method. Firstly, such open-top like configuration provides significantly more space for the sample handling, allowing to work with multi-well plates, Petri dishes and live cell chambers, which is often impossible with the dual objective scanning configuration. Moreover, it also enables reducing the cost of the illumination module.
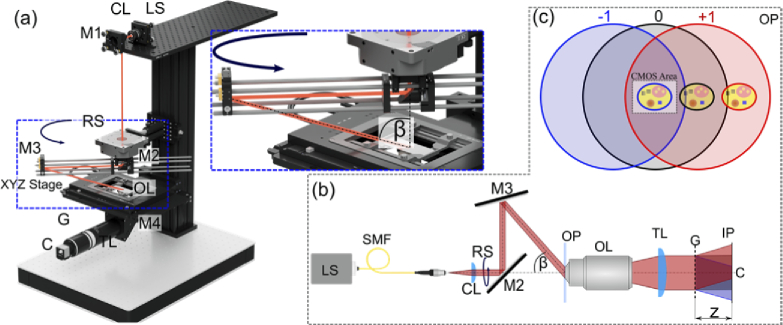
The system schematic is shown in Fig. 1. A beam from light source LS (superluminescent diode, SLD, Exalos EXS210033-03, λ = 650 nm, Δλ = 6 nm, or laser diode, LD, Thorlabs LPS-635-FC, λ = 635 nm, Δλ = 1 nm) is collimated and directed with mirror M1 onto mirror M2 placed on the rotation stage RS. Then the beam is reflected to the sample using mirror M3. The incidence angle β between the illumination direction and the optical axis is 64° in the air.
Fig. 1.
Total shear tomographic system. (a-b) schematic of the optical setup: LS – light source, SMF – single mode fiber, CL – collimating lens, M – mirror, RS – rotation stage, OP – object plane, OL – objective lens, TL – tube lens, G – diffraction grating, C – CMOS sensor, IP – image plane (c) illustration of the image capture configuration. −1st, 0th and +1st diffraction orders are represented with blue, black and red colors, respectively. The CMOS area contains the object image carried by −1st diffraction order (indicated with the blue stroke) and flat area of the 0th and +1st orders.
The light beam, after passing through the sample, is collected by objective lens OL (100× 1.45 Nikon Plan Apo). Then, the object wave is reflected with the mirror M4 and imaged with tube lens TL onto the CMOS camera (C, Flir Backfly S BFS-U3-120S4M-CS, 3000 × 4000 pixels, pixel pitch 1.85 µm). Ronchi type amplitude diffraction grating G (grating period d = 10 µm), placed between TL and detector, generates odd diffraction orders, out of which the lowest three (0th, +1st and −1st) are producing an interference pattern that is registered by the camera. Higher diffraction orders are out of field of view of the camera sensor, hence do not participate in the interference pattern.
2.2. Total-shear interferometer working principle
The optical field coding in the proposed system is realized with a diffraction grating placed in front of the camera. The Fresnel-regime complex amplitude after the grating can be expressed using the following equation:
| (1) |
where a0 and a−1 = a+1 are the amplitudes of the orders 0th, −1st and +1st, respectively, d is the grating period, λ is the wavelength, k = 2π/λ, g(x,y) is the optical path introduced by the specimen and λ2z/2d2 is the optical path difference (OPD) between the zeroth and the side diffraction orders, Δ represents a lateral displacement of the specimen image from the optical axis [68,73,77]. The three diffraction orders interfere in the camera plane, forming the three-beam interferogram with the following intensity distribution:
| (2) |
From Eq. (2) one can distinguish terms describing the constant background a02 + 2a12, the first harmonic (middle term, expressed by the product of two cosines - off-axis recording) and the second harmonic (last term - double off-axis recording). The carrier fringes of the first harmonic are being deformed proportionally to the object phase (k/2)g(x+Δ,y), and at the same time, they are amplitude modulated by the first cosine. The amplitude of the first harmonic is dependent of the distance z between the diffraction grating and the camera sensor. It gets its maximum at the self-image planes, for z equal to the integer multiples of d2/λ [68,73,77–79]. Note that maxima and minima of the first harmonic are wavelength dependent, resulting in the reduced contrast for low-coherence light sources. The amplitude demodulation of the first harmonic is cumbersome and non-trivial due to the cosine amplitude modulation. However, phase demodulation becomes straightforward when processing the second harmonic, as was shown in our previous works [73,79,80]. It offers doubled interference angle compared to the first harmonic demodulation, is achromatic (wavelength independent) and allows flexibility of placing diffraction grating in the setup (it is self-imaging free, i.e., amplitude of the second harmonic does not rely on the distance z, which only changes the separation between diffraction orders [63,81]).
The graphical interpretation of the image captured by the camera is shown in Fig. 1(c). The specimen is aligned in such a way that its image is located at the edge of the object beam. This way, by placing the camera at the center of the zeroth order, the detector captures the three-beam interference pattern between −1st order with object replica, and 0th and +1st orders which are object free. The phase information is encoded in the second harmonic of this hologram intensity distribution formed by the interference of −1st and +1st orders, without the spurious effects of the 0th order. It does not need to be filtered-out with the additional 4f system, neither the phase-amplitude grating based elimination is required (like in quadriwave lateral shearing interferometry [56]). This feature promotes compactness and cost-effectiveness of our approach. Additionally, first harmonic fringes are to be physically filtered out upon lowering the temporal coherence of the illumination, leaving the achromatic second harmonic fringes ready for phase demodulation. Thus, extra bandwidth in Fourier space is generated as spatial frequencies related to the first harmonic no longer contribute to the hologram spectrum.
The proposed common-path total shear tomographic system has multiple advantages when compared to the typical two-beam interferometer configurations, i.e., high stability, insensitivity to vibrations and environmental conditions, it is extremely easy to align (it only requires angular, partially coherent illumination and addition of the diffraction grating in between the tube lens and camera). When compared to the point-diffraction based tomographic systems, which require the additional 4f imaging system (significantly extending the physical size of the optical setup), our system does not need secondary scanning mirrors for pinhole alignment as in [69–71]. The downside of the proposed configuration is the limitation to sparsely distributed samples (object should be surrounded, in the direction perpendicular to the grating lines, by object-free areas of comparable size to the object itself) [73]. However, tomographic measurements very often focus on single isolated cells, hence our system does not differ significantly from the classical ODT systems giving the advantages of simplicity, achromaticity (that enables the usage of low-coherence light sources, decreasing coherent noise) and open-top like configuration (possibility to measure living specimen in multi-well plates and Petri dishes).
2.3. Data acquisition and processing
In order to carry out the tomographic reconstruction, a set of 360 holograms is collected for 360 various illumination directions. Here, we applied a cone illumination scenario (Fig. 1(a)) with the incidence angle of β = 64° with respect to the optical axis and the azimuthal angle step of 1°. It is important to note that the angle β corresponds to direction of the illumination beam in the air, thus the actual incidence angle of the sample is decreased according to Snell law βn0 = sin−1(sinβ/n0) = 36.3°, where n0 is the refractive index of the medium surrounding the sample.
For validation of the system we used a 3D printed biological cell phantom with the known size and refractive index distribution. Such phantom faithfully reproduces the real biological cell and thus properly confirms the bio-imaging capabilities of the tomographic system. Details about the fabrication and verification process can be found in [74]. The 3D view of this test object is shown in Fig. 2. The phantom is placed between two #1.5H coverslips and separated with the 0.12 mm imaging spacer. The space between the coverslips is filled with the immersion oil (Zeiss Immersol 518F) with refractive index n0 = 1.518 (n0 = 1.511 at λ = 650 nm and 25°C), which ensures similar measurement conditions as in the case of biological cells in the culture medium, as well as fulfills the weakly-scattering requirement of the ODT reconstruction algorithms. The same immersion oil was used for the imaging objective. The phantom has been slightly modified since the previous work and has the total height of 13.90 µm and the designed RI of its compartments (at λ = 650 nm and 25°C) is as follows: cell body and nucleoli 1.5383 ± 0.0006; nucleus 1.5260 ± 0.0006; USAF resolution test 1.5148 ± 0.0006. See Visualization 1 (833.4KB, mpeg) and Visualization 2 (1,002.4KB, mpeg) for the raw phantom structure.
Fig. 2.
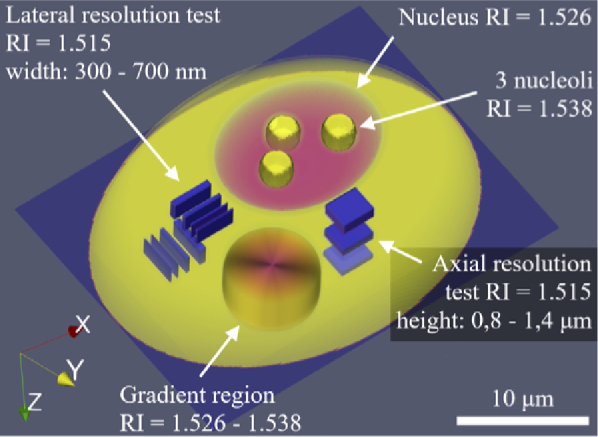
3D model of the cell phantom internal features, their sizes and refractive index values.
In order to test the achromatic character of the system two tomographic data series of the cell phantom were registered using light sources of various coherence degrees: coherent laser diode and partially coherent superluminescent diode. Note that the central wavelengths of these two sources is slightly different (635 nm vs 650 nm), which results in minor dispersion related difference in the refractive index values of the cell phantom (ΔRI∼0.001).
Hologram series for both sources were processed in exactly the same way. First, the individual holograms were reconstructed using Fourier transform method. During this process, the interference term corresponding to the coherent superposition of −1st and +1st diffraction orders (object and reference beam) was used. Thanks to this conjugated beam interference configuration, the illumination-related phase tilts of the beams cancel out thus the interference peak location is independent of the illumination direction. Therefore, the sampling conditions for all incidence angles are the same and the Fourier reconstruction method can be easily automated.
The radius fr of the applied circular filtering mask was selected in such a way to pass through the entire numerical aperture of all object beams, i.e., fr = NA/λ + n0 sin(βn0)/λ, which gives 3.7 µm−1 and 3.6 µm−1 for the LD and SLD cases, respectively. During the reconstruction we did not restore the phase carrier of the beams since the tomographic reconstruction algorithm requires low frequency shifted field representation.
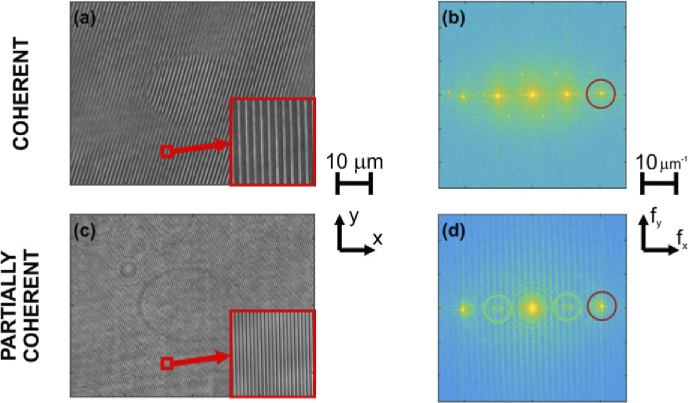
One of the holograms from each data series is presented in Figs. 3(a) and 3(c), for LD and SLD sources, respectively. Figures 3(b) and 3(d) show the Fourier transform amplitude (in logarithmic scale) of the corresponding holograms and the applied filtering masks (red circles).
Fig. 3.
Holograms acquired for laser (coherent) (a) and its Fourier spectra (b); corresponding hologram acquired for SLD (partially coherent) illumination (c) and its Fourier spectra (d). Spectral filtering window margins are marked by red circle.
Here, we would like to emphasize the effect of the coherence of the light source. The OPD between ±1st and 0th diffraction orders is equal to λ2z/2d2. In our experimental setup we are using a diffraction grating with the period of d=10 µm, which is placed at the distance of 100 mm from the CMOS camera. This gives the OPD ≈ 201 µm and 211 µm, while the coherence length lc ≈ λ02/Δλ is equal to 403 and 70 µm for the LD and SLD, respectively. This means that the 0th and ±1st diffraction orders will interfere for the LD illumination and we will observe the three-beam interference pattern on the camera while for the case of SLD illumination we will only observe two-beam interference between +1st and −1st orders as their OPD = 0. This effect is clearly observed in the spectra of the holograms in Fig. 3, as the first harmonic (interference between ±1st and 0th orders) is visible in the case of LD illumination and for the SLD illumination the first harmonic disappears and only the second harmonic remains present (interference between +1st and −1st orders, with double frequency compared to the first harmonic – double off-axis regime). Such effect enables much larger filtering window to be available when demodulating the phase using Fourier transform. Moreover, application of partially coherent illumination facilitated eliminating spurious interference patterns, which are visible in the spectrum of the LD hologram as smaller side peaks (Fig. 3(b)). These peaks are not present in Fig. 3(d) that corresponds to the partially coherent case.
An additional effect that can be spotted in Fig. 3(d) is a vertical fringe pattern. In fact, the same fringes are also present in Fig. 3(b) but with the reduced contrast. The fringes are probably related to the cover glass of the camera that introduces three, displaced aberration distributions (one for each diffraction order). The copies, after Fourier transformation, result in the fringes that are orthogonal to the shear direction.
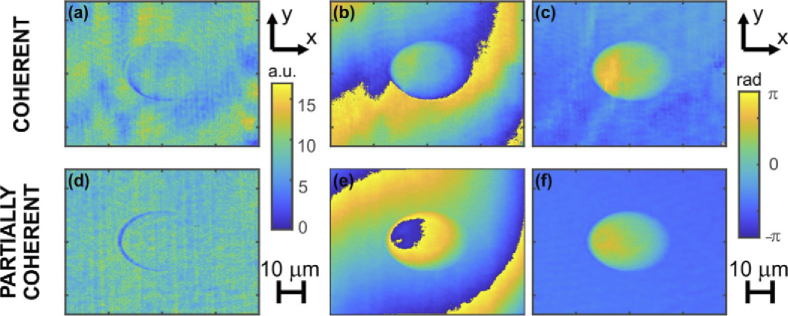
The reconstructed object waves suffered from the phase aberration, which can be observed in Fig. 4 showing the amplitude (Figs. 4(a), 4(d)) and phase distributions (Figs. 4(b), 4(d)) of the fields corresponding to holograms in Figs. 3(a) and 3(b), respectively. The phase aberration was removed using a set of matched sample-free compensation holograms. The result of this operation can be seen in Fig. 4(c), 4(f). Note that we can observe much less noise and smaller background component for the case of partially coherent illumination.
Fig. 4.
Amplitude (a,d), wrapped phase (b,c) and the phase with subtracted background (c,f) of the holograms shown in Fig. 3(a) (LD illumination) and Fig. 3(c) (SLD illumination), respectively.
Afterwards, the phase unwrapping algorithm was applied to remove any potential 2π phase discontinuities. To minimize the computational burden, the field’s size was reduced to the region of interest containing the cell phantom image. The fields were also downsampled taking into account the maximum optical frequency in the signal fr. The final tomographic series consisted of 360 amplitude and unwrapped phase distributions of size 360 × 548 pixels and sampling of 0.125 µm.
For tomographic evaluation we applied direct inversion algorithm (DI) [82] utilizing first order Rytov approximation [18]. The algorithm is a straightforward implementation of the generalized projection theorem [83]. It applies direct interpolation of the object beam information in the three-dimensional spectrum of the sample. We chose this reconstruction method because of its popularity, robustness and fast computation; however, it is important to note that DI suffers from out-of-focus errors [25], that is, it provides decreased accuracy for peripheral, out-of-focus areas of the reconstruction.
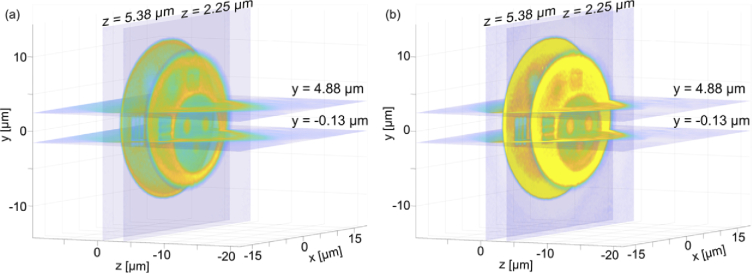
The missing frequency problem, that is related to the limited range of the applied illumination directions, was addressed with 10 iterations of nonnegativity constraint (NNC) procedure. The computations took approx. 44 s and 162 s for DI and DI + NNC, respectively (MATLAB R2020a, Intel Core i7-7700HQ 2.80 GHz, RAM 32 GB). The results of the 3D tomographic evaluation are presented in Fig. 5(a) DI and Fig. 5(b) DI + NNC. For the sake of brevity, only the results for partially coherent illumination were presented. Nonetheless they allow to locate three selected cross-sections in the volume of interest.
Fig. 5.
3D visualization of tomographic reconstructions obtained for partially coherent illumination with (a) DI and (b) DI + NNC; The presented cross-sections are further analyzed in Figs. 6–11.
3. Discussion
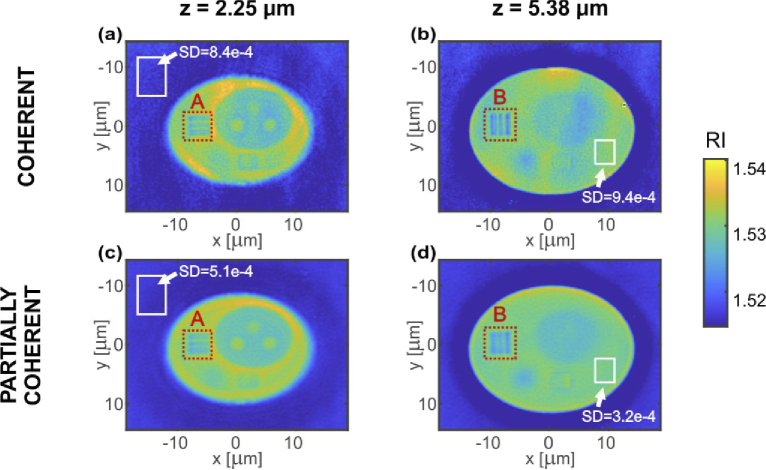
First, we will focus on the DI tomographic reconstruction obtained without the additional regularization procedure. Three selected transverse (XY) cross-sections of the reconstructed 3D refractive index distributions are presented in Fig. 6. The distributions correspond to the following axial depths: z = 2.25 µm (a,c) and z = 5.38 µm (b,d). The applied coordinate system is centered at the middle of the 3D region of interest. In this system the in-focus plane is at z = 5.13 µm and z = 6.13 µm for LD and SLD reconstruction, respectively. The minor change in the in-focus plane location for two measurements comes from the object properties – it is a pure phase object and finding the proper in-focus plane is not trivial, especially in the case of inclined illumination. The results at the top row of Fig. 6 were obtained with coherent illumination and in the bottom row with partially coherent system. The red rectangular region of interest (ROI) areas (A and B) indicate the transverse resolution test structure of the cell phantom. The white rectangles specify the regions that were used for local calculations of standard deviation (SD) that enabled determining the reconstruction noise content and quantitatively compare LD and SLD illumination cases.
Fig. 6.
DI tomographic reconstructions. Two transverse (XY) cross-sections of the reconstructed 3D refractive index distributions were selected for axial depths of: (a,c) z = 2.25 µm and (b,d) z = 5.38 µm. Cross-sections (a,b) were obtained for coherent LD illumination and (c,d) for partially coherent SLD illumination. White rectangles show the regions used for the estimation of SD, red dotted rectangles specify the ROIs (A and B) that are further analyzed in Fig. 8.
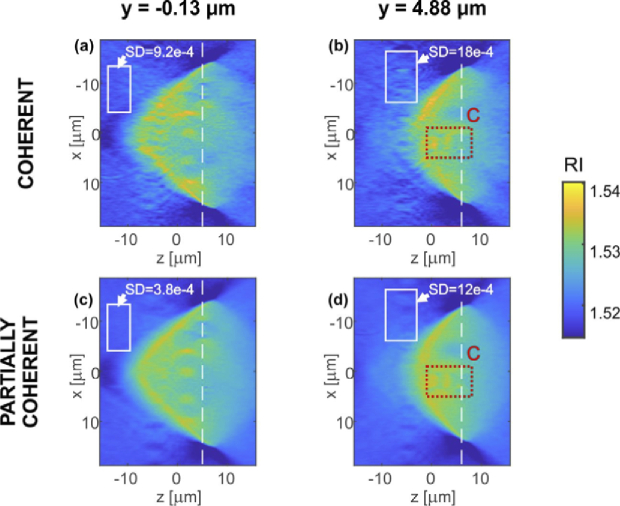
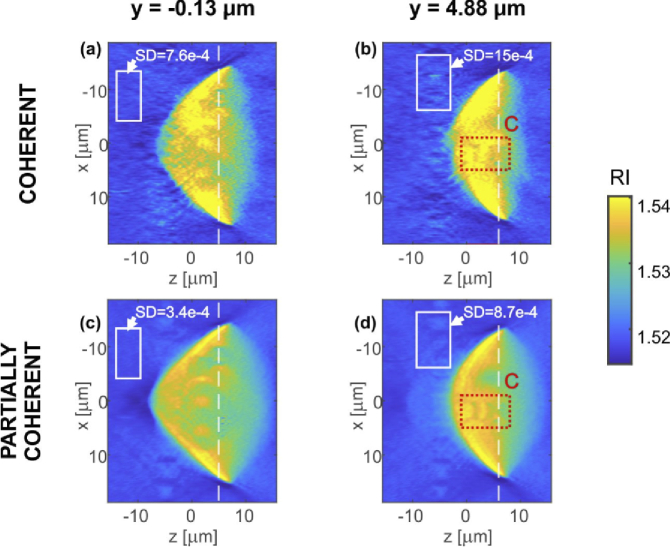
In Fig. 7 the analogical axial (ZX) sections of the phantom reconstruction are presented for y = −0.13 µm and y = 4.88 µm. Red rectangles C indicate the axial resolution test structure of the investigated phantom. The white rectangles show ROIs for the SD evaluation. The dashed white lines mark locations of the in-focus planes. For comparison of all XY and ZX slices of the DI reconstructions see Visualization 3 (1,001.2KB, mp4) and Visualization 4 (2.4MB, mp4) , respectively.
Fig. 7.
DI tomographic reconstructions. Two axial (ZX) cross-sections of the reconstructed 3D refractive index distributions were selected for y positions of: (a,c) y = −0.13 µm and(b,d) y = 4.88 µm. Cross-sections (a,b) were obtained for coherent LD illumination and (c,d) for partially coherent SLD illumination. White rectangles show the regions used for the estimation of SD; red dotted rectangles specify ROI C that is further analyzed in Fig. 8.
In Visualization 3 (1,001.2KB, mp4) one can notice a line pattern located around z = −4 µm. This artefact is probably a residue of the diffraction grating that is used in the tomograph. For samples with larger axial depth, it is recommended to shift the pattern away from the central reconstruction space, which can be achieved by enlarging a distance between the grating and the detector.
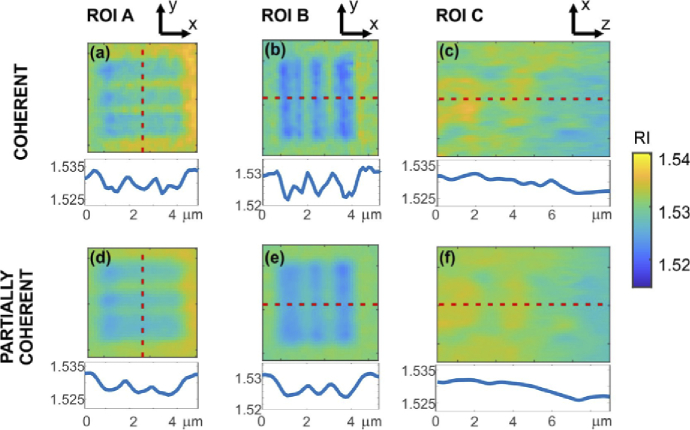
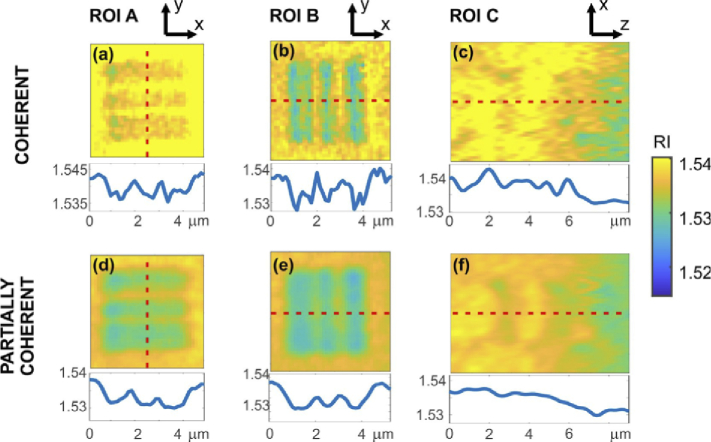
Figure 8 presents the magnified ROIs with the resolution targets from Fig. 6 and Fig. 7. Below each image, 1D cross-section obtained along red, dashed line is included. All the cross-sections are displayed using the same dynamic range, i.e., the same span of the RI values.
Fig. 8.
Magnified ROIs with the resolution targets from Fig. 6 and Fig. 7 for coherent (a-c) LD and partially coherent (d-f) SLD illumination. Below each image, 1D cross-section obtained along red, dashed line is included.
The results obtained for both LD and SLD illumination show that the proposed system offers convenient configuration and high-quality tomographic reconstruction. All characteristic regions of the phantom were properly reconstructed. We can distinguish the three nucleoli, each visible at different depth. Lateral resolution test lines are clearly visible (ROI A and ROI B, although the thinnest lines were not fully resolved, coherent illumination showed slightly higher spatial resolution, as the thinnest 300 nm lines can be resolved), and axial resolution test lines can also be spotted (ROI C, they can be seen vaguely in the partially coherent illumination, in the case of coherent illumination the axial resolution target gets buried in noise).
Notably, the tomographic reconstruction of partially coherent illumination offers significantly decreased coherent noise when compared with coherent illumination. The SD in the case of LD reconstruction is higher for each of the XY and ZX slices. The SD levels for mark areas (Figs. 6–7) are listed in Tab. 1. We conclude that the noise is on average 50% lower for partially coherent illumination than for the coherent one. This quality augmentation observable in the SLD case can be directly linked to the lower phase noise level and reduced amount of coherence related artefacts (e.g. spurious fringes) in comparison with the LD data.
Table 1. Summarized values of the SD for all applied tomographic reconstructions.
| z=2.25 µm | z=5.38 µm | y=−0.13 µm | y=4.88 µm | ||
|---|---|---|---|---|---|
| DI | LD illumination | 8.4 ·10−4 | 9.4 ·10−4 | 9.2 ·10−4 | 18 ·10−4 |
| SLD illumination | 5.1 ·10−4 | 3.2 ·10−4 | 3.8 ·10−4 | 12 ·10−4 | |
| Noise reduction gain | 39% | 66% | 59% | 33% | |
| DI + NNC | LD illumination | 5.7 ·10−4 | 21 ·10−4 | 7.6 ·10−4 | 15 ·10−4 |
| SLD illumination | 2.8 ·10−4 | 11 ·10−4 | 3.4 ·10−4 | 8.7 ·10−4 | |
| Noise reduction gain | 51% | 48% | 55% | 42% |
Figure 8 shows enlarged areas of the resolution target. The small contrast of the lines is caused by limited resolution (especially for the axial direction, Fig. 8(c,f)) as well as probably inaccuracies of the illumination angle estimation. It is important to note that in our experiment, the tomogram obtained with coherent illumination shows slightly higher resolution. This effect may come from the limitation of the DI tomographic reconstruction algorithm, which assumes that the illumination beam consists of a single optical frequency. This problem may be overcome with novel reconstruction approaches that account for partially coherent illumination [84]. Even though the coherent illumination surpasses the partially coherent one in terms of resolution, very often this advantage may be useless due to the high level of noise and mixing of object high spatial frequencies with the noise. This results in generally lower effective resolution of such reconstruction. Especially worth mentioning is that the axial resolution and reconstruction quality are significantly better for the case of partially coherent illumination – both the nuclei and resolution target gets buried in noise for laser illumination, while SLD illumination resolves them correctly.
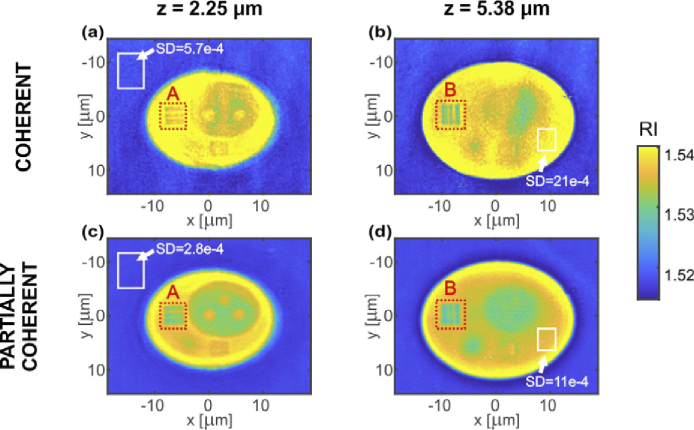
The presented tomographic reconstructions suffer from the missing frequency problem that results in poor axial resolution and underestimated refractive index values. To address this issue, we applied a very popular approach that involves NNC regularization, in which a priori knowledge of the minimum (or maximum) refractive index value of the investigated sample is used in the process to fill in the missing information. The results of the evaluation are presented in Figs. 9–11 that are structured in the analogical way to Figs. 7–8. Similarly to the previous case the videos with XY and ZX slices are included (Visualization 5 (1.2MB, mp4) and Visualization 6 (3.1MB, mp4) , respectively). For comparison refer to Visualization 1 (833.4KB, mpeg) and Visualization 2 (1,002.4KB, mpeg) with true phantom structure and Ref. [85], which presents tomograms of the analogical cell phantom obtained with commercial ODT systems [76,86]. It can be summarized that our simple solution provided comparable reconstruction quality to the mature ODT systems applying separate reference beam.
Fig. 9.
DI + NNC tomographic reconstruction. Two transverse (XY) cross-sections of the reconstructed 3D refractive index distributions were selected for axial depths of: (a,c) z = 2.25 µm and (b,d) z = 5.38 µm. Cross-sections (a,b) were obtained for coherent LD illumination and (c,d) for partially coherent SLD illumination. White rectangles show the regions used for the estimation of SD, red dotted rectangles specify the ROIs (A and B) further analyzed in Fig. 11.
Fig. 10.
DI + NNC tomographic reconstruction. Two axial (ZX) cross-sections of the reconstructed 3D refractive index distributions were selected for y positions of: (a,c) y = −0.13 µm and (b,d) y = 4.88 µm. Cross-sections (a,b) were obtained for coherent LD illumination and (c,d) for partially coherent SLD illumination. White rectangles show the regions used for the estimation of SD; red dotted rectangles specify ROI C further analyzed in Fig. 11.
Fig. 11.
Magnified ROIs with the resolution targets from Fig. 9 and Fig. 10 for coherent (a-c) LD illumination and partially coherent (d-f) SLD illumination. Below each image, 1D cross-section obtained along red, dashed line is included.
Another important effect of NNC is that it enabled increasing the refractive index values, which are now close to the reference values (mean value of RI for cell body area equal to 1.5396 and 1.5356 for LD and SLD reconstructions, respectively; the reference value 1.5383). It can be spotted that the SLD result still has slightly underestimated RI value which may be attributed to single optical frequency assumption of the NNC procedure (Fig. 9).
Moreover, the local SD analysis shows that the superiority of partially coherent illumination in terms of the noise level is still valid for the DI + NNC reconstructions. SD is higher for LD than for SLD reconstruction on average by 50% (see Table 1).
Table 1 summarizes local SD values for regions showed in Fig. 6–7 and Fig. 9–10
4. Conclusions
In this paper, we proposed the open-top like, common-path, intrinsically achromatic ODT system that applies the total-shear, grating-based interferometric configuration. The system enables simple, compact architecture without the need of designated reference beam. The phase coding is achieved only through the introduction of the standard binary amplitude diffraction grating, placed between the tube lens and the camera, that provides double off-axis hologram acquisition mode. Thanks to the common-path configuration the system shows great stability and immunity to vibrations, aberrations and other disturbances, which is especially important for tomographic measurements The system works as an inverted microscope, which generally is preferable by life scientists, as it enables more flexibility in the sample preparation and choice of coverslips, multi-well plates, Petri dishes and incubator chambers. Due to the addition of the azimuthal illumination module above the sample, a set of projections can be acquired which enables tomographic evaluation.
The key advantage of the system is its intrinsic achromaticity (detailed analytical derivation in Patorski et al. [73]). The feature enables application of a partially coherent light source, here SLD, that provides relatively inexpensive manner for high-quality tomographic reconstruction thanks to limiting coherence artifacts and increasing the phase signal to noise ratio. This intrinsic achromaticity allows not only for low temporal coherence of the illumination source but also promotes the setup for future potential applications in extremely fast impulse illumination regime.
It is important to stress that all these advantageous features of the proposed system come with no requirement for any additional complex systems, such as the 4f system in DPM [60–63,69–71] or the compensation element such as in [36,37,72,87]. The lack of the pinhole and 4f processor significantly simplifies the acquisition of various sample projections as there is no need for the beam tilt compensation.
To demonstrate the utility of our system we performed the experimental tomographic measurement of the 3D-printed cell phantom using two types of illumination sources: coherent LD source and partially coherent SLD source and two reconstruction approaches: DI and DI + NNC. The experimental results fully corroborated the analytical description of the proposed system. For both illumination types, our setup provided high-quality tomographic results that are comparable to the results of the commercial, often more complicated, ODT systems. Moreover, the study emphasized an importance of the achromaticity of our setup. The local SD analysis showed that the reconstruction obtained with partially coherent illumination outperforms the coherent one in terms of reduced noise level. It was also shown that in the case of LD illumination, the NNC procedure induced the RI distribution errors, which are is probably caused by coherence-related artefacts in the data that deceive the regularizer.
Funding
Warsaw Institute of Technology10.13039/501100004421 under the Program Excellence Initiative: Research University (ID-UB) (ID-UB: BIOTECHMED-1, ID-UB: FOTECH-1); National Science Centre Poland10.13039/501100004281 OPUS 13 and OPUS 19 (UMO- 2017/25/B/ST7/02049, UMO- 2020/37/B/ST7/03629); Foundation for Polish Science FNP10.13039/501100001870 (START 2020).
Disclosures
The authors declare no conflicts of interest.
Data availability
Data underlying the results presented in this paper are not publicly available at this time but may be obtained from the authors upon reasonable request.
References
- 1.Kemper B., Von Bally G., “Digital holographic microscopy for live cell applications and technical inspection,” Appl. Opt. 47(4), A52 (2008). 10.1364/AO.47.000A52 [DOI] [PubMed] [Google Scholar]
- 2.Cotte Y., Toy F., Jourdain P., Pavillon N., Boss D., Magistretti P., Marquet P., Depeursinge C., “Marker-free phase nanoscopy,” Nat. Photonics 7(2), 113–117 (2013). 10.1038/nphoton.2012.329 [DOI] [Google Scholar]
- 3.Popescu G., Quantitative Phase Imaging of Cells and Tissues (McGraw-Hill Education, 2011). [Google Scholar]
- 4.Shaked N. T., Zalevsky Z., Satterwhite L. L., Biomedical Optical Phase Microscopy and Nanoscopy (Elsevier, 2013). [Google Scholar]
- 5.Park Y., Depeursinge C., Popescu G., “Quantitative phase imaging in biomedicine,” Nat. Photonics 12(10), 578–589 (2018). 10.1038/s41566-018-0253-x [DOI] [Google Scholar]
- 6.Hu C., Popescu G., “Quantitative Phase Imaging (QPI) in Neuroscience,” IEEE J. Sel. Top. Quantum Electron. 25(1), 1–9 (2019). 10.1109/JSTQE.2018.2869613 [DOI] [Google Scholar]
- 7.Holden E., Tarnok A., Popescu G., “Quantitative phase imaging for blood cytometry,” Cytom. Part A 91A, 407–411 (2010). [DOI] [PubMed] [Google Scholar]
- 8.Phillips K. G., Velasco C. R., Li J., Kolatkar A., Luttgen M., Bethel K., Duggan B., Kuhn P., McCarty O. J. T., “Optical quantification of cellular mass, volume, and density of circulating tumor cells identified in an ovarian cancer patient,” Front. Oncol. 2, 1 (2012). 10.3389/fonc.2012.00072 [DOI] [PMC free article] [PubMed] [Google Scholar]
- 9.Lee K., Kim K., Jung J., Heo J., Cho S., Lee S., Chang G., Jo Y., Park H., Park Y., “Quantitative phase imaging techniques for the study of cell pathophysiology: from principles to applications,” Sensors 13(4), 4170–4191 (2013). 10.3390/s130404170 [DOI] [PMC free article] [PubMed] [Google Scholar]
- 10.Sung Y., Choi W., Fang-Yen C., Badizadegan K., Dasari R. R., Feld M. S., “Optical diffraction tomography for high resolution live cell imaging,” Opt. Express 17(1), 266 (2009). 10.1364/OE.17.000266 [DOI] [PMC free article] [PubMed] [Google Scholar]
- 11.Kuś A., Krauze W., Makowski P. L., Kujawińska M., “Holographic tomography: hardware and software solutions for 3D quantitative biomedical imaging (Invited paper),” ETRI J. 41(1), 61–72 (2019). 10.4218/etrij.2018-0505 [DOI] [Google Scholar]
- 12.Choi W., Fang-Yen C., Badizadegan K., Oh S., Lue N., Dasari R. R., Feld M. S., “Tomographic phase microscopy,” Nat. Methods 4(9), 717–719 (2007). 10.1038/nmeth1078 [DOI] [PubMed] [Google Scholar]
- 13.Streibl N., “Three-dimensional imaging by a microscope,” J. Opt. Soc. Am. A 2(2), 121 (1985). 10.1364/JOSAA.2.000121 [DOI] [Google Scholar]
- 14.Balasubramani V., Kuś A., Tu H.-Y., Cheng C.-J., Baczewska M., Krauze W., Kujawińska M., “Holographic tomography: techniques and biomedical applications [Invited],” Appl. Opt. 60(10), B65 (2021). 10.1364/AO.416902 [DOI] [PubMed] [Google Scholar]
- 15.Choi W., “Tomographic phase microscopy and its biological applications,” 3D Res. 3(4), 5 (2012). 10.1007/3DRes.04(2012)5 [DOI] [Google Scholar]
- 16.Jin D., Zhou R., Yaqoob Z., So P. T. C., “Tomographic phase microscopy: principles and applications in bioimaging [Invited],” J. Opt. Soc. Am. B 34(5), B64 (2017). 10.1364/JOSAB.34.000B64 [DOI] [PMC free article] [PubMed] [Google Scholar]
- 17.Kozacki T., Kujawińska M., Kniażewski P., “Investigation of limitations of optical diffraction tomography,” Opto-Electron. Rev. 15(2), 102–109 (2007). 10.2478/s11772-007-0006-8 [DOI] [Google Scholar]
- 18.Devaney A. J., “Inverse-scattering theory within the Rytov approximation,” Opt. Lett. 6(8), 374 (1981). 10.1364/OL.6.000374 [DOI] [PubMed] [Google Scholar]
- 19.Chowdhury S., Chen M., Eckert R., Ren D., Wu F., Repina N., Waller L., “High-resolution 3D refractive index microscopy of multiple-scattering samples from intensity images,” Optica 6(9), 1211 (2019). 10.1364/OPTICA.6.001211 [DOI] [PMC free article] [PubMed] [Google Scholar]
- 20.Chen M., Ren D., Liu H.-Y., Chowdhury S., Waller L., “Multi-layer Born multiple-scattering model for 3D phase microscopy,” Optica 7(5), 394 (2020). 10.1364/OPTICA.383030 [DOI] [Google Scholar]
- 21.Kamilov U. S., Papadopoulos I. N., Shoreh M. H., Goy A., Vonesch C., Unser M., Psaltis D., “Learning approach to optical tomography,” Optica 2(6), 517 (2015). 10.1364/OPTICA.2.000517 [DOI] [Google Scholar]
- 22.Ma X., Xiao W., Pan F., “Optical tomographic reconstruction based on multi-slice wave propagation method,” Opt. Express 25(19), 22595 (2017). 10.1364/OE.25.022595 [DOI] [PubMed] [Google Scholar]
- 23.Tahir W., Kamilov U. S., Tian L., “Holographic particle localization under multiple scattering,” Adv. Photonics 1(3), 036003 (2019). 10.1117/1.AP.1.3.036003 [DOI] [Google Scholar]
- 24.Ledwig P., Robles F. E., “Quantitative 3D refractive index tomography of opaque samples in epi-mode,” Optica 8(1), 6 (2021). 10.1364/OPTICA.410135 [DOI] [PMC free article] [PubMed] [Google Scholar]
- 25.Kostencka J., Kozacki T., Kuś A., Kemper B., Kujawińska M., “Holographic tomography with scanning of illumination: space-domain reconstruction for spatially invariant accuracy,” Biomed. Opt. Express 7(10), 4086 (2016). 10.1364/BOE.7.004086 [DOI] [PMC free article] [PubMed] [Google Scholar]
- 26.Krauze W., Makowski P., Kujawińska M., Kuś A., “Generalized total variation iterative constraint strategy in limited angle optical diffraction tomography,” Opt. Express 24(5), 4924 (2016). 10.1364/OE.24.004924 [DOI] [PubMed] [Google Scholar]
- 27.Kim K., Yaqoob Z., Lee K., Kang J. W., Choi Y., Hosseini P., So P. T. C., Park Y., “Diffraction optical tomography using a quantitative phase imaging unit,” Opt. Lett. 39(24), 6935 (2014). 10.1364/OL.39.006935 [DOI] [PMC free article] [PubMed] [Google Scholar]
- 28.Gorski W., Osten W., “Tomographic imaging of photonic crystal fibers,” Opt. Lett. 32(14), 1977 (2007). 10.1364/OL.32.001977 [DOI] [PubMed] [Google Scholar]
- 29.Charrière F., Marian A., Montfort F., Kuehn J., Colomb T., Cuche E., Marquet P., Depeursinge C., “Cell refractive index tomography by digital holographic microscopy,” Opt. Lett. 31(2), 178 (2006). 10.1364/OL.31.000178 [DOI] [PubMed] [Google Scholar]
- 30.Kostencka J., Kozacki T., Dudek M., Kujawińska M., “Noise suppressed optical diffraction tomography with autofocus correction,” Opt. Express 22(5), 5731 (2014). 10.1364/OE.22.005731 [DOI] [PubMed] [Google Scholar]
- 31.Habaza M., Gilboa B., Roichman Y., Shaked N. T., “Tomographic phase microscopy with 180° rotation of live cells in suspension by holographic optical tweezers,” Opt. Lett. 40(8), 1881 (2015). 10.1364/OL.40.001881 [DOI] [PubMed] [Google Scholar]
- 32.Vertu S., Flügge J., Delaunay J.-J., Haeberlé O., “Improved and isotropic resolution in tomographic diffractive microscopy combining sample and illumination rotation,” Open Phys. 9(4), 969–974 (2011). 10.2478/s11534-011-0018-3 [DOI] [Google Scholar]
- 33.Simon B., Debailleul M., Houkal M., Ecoffet C., Bailleul J., Lambert J., Spangenberg A., Liu H., Soppera O., Haeberlé O., “Tomographic diffractive microscopy with isotropic resolution,” Optica 4(4), 460 (2017). 10.1364/OPTICA.4.000460 [DOI] [Google Scholar]
- 34.Kostencka J., Kozacki T., Józwik M., “Holographic tomography with object rotation and two-directional off-axis illumination,” Opt. Express 25(20), 23920 (2017). 10.1364/OE.25.023920 [DOI] [PubMed] [Google Scholar]
- 35.Vinoth B., Lai X.-J., Lin Y.-C., Tu H.-Y., Cheng C.-J., “Integrated dual-tomography for refractive index analysis of free-floating single living cell with isotropic superresolution,” Sci. Rep. 8(1), 5943 (2018). 10.1038/s41598-018-24408-w [DOI] [PMC free article] [PubMed] [Google Scholar]
- 36.Lee K., Shin S., Yaqoob Z., So P. T. C., Park Y., “Low-coherent optical diffraction tomography by angle-scanning illumination,” J. Biophotonics 12(5), e201800289 (2019). 10.1002/jbio.201800289 [DOI] [PMC free article] [PubMed] [Google Scholar]
- 37.Park C., Lee K., Baek Y., Park Y., “Low-coherence optical diffraction tomography using a ferroelectric liquid crystal spatial light modulator,” Opt. Express 28(26), 39649 (2020). 10.1364/OE.405418 [DOI] [PubMed] [Google Scholar]
- 38.Wang Z., Marks D. L., Carney P. S., Millet L. J., Gillette M. U., Mihi A., Braun P. V., Shen Z., Prasanth S. G., Popescu G., “Spatial light interference tomography (SLIT),” Opt. Express 19(21), 19907 (2011). 10.1364/OE.19.019907 [DOI] [PMC free article] [PubMed] [Google Scholar]
- 39.Kim T., Zhou R., Mir M., Babacan S. D., Carney P. S., Goddard L. L., Popescu G., “White-light diffraction tomography of unlabelled live cells,” Nat. Photonics 8(3), 256–263 (2014). 10.1038/nphoton.2013.350 [DOI] [Google Scholar]
- 40.Nguyen T. H., Kandel M. E., Rubessa M., Wheeler M. B., Popescu G., “Gradient light interference microscopy for 3D imaging of unlabeled specimens,” Nat. Commun. 8(1), 210 (2017). 10.1038/s41467-017-00190-7 [DOI] [PMC free article] [PubMed] [Google Scholar]
- 41.Soto J. M., Rodrigo J. A., Alieva T., “Label-free quantitative 3D tomographic imaging for partially coherent light microscopy,” Opt. Express 25(14), 15699 (2017). 10.1364/OE.25.015699 [DOI] [PubMed] [Google Scholar]
- 42.Chowdhury S., Eldridge W. J., Wax A., Izatt J., “Refractive index tomography with structured illumination,” Optica 4(5), 537 (2017). 10.1364/OPTICA.4.000537 [DOI] [Google Scholar]
- 43.Chowdhury S., Eldridge W. J., Wax A., Izatt J. A., “Structured illumination multimodal 3D-resolved quantitative phase and fluorescence sub-diffraction microscopy,” Biomed. Opt. Express 8(5), 2496 (2017). 10.1364/BOE.8.002496 [DOI] [PMC free article] [PubMed] [Google Scholar]
- 44.Lee K., Kim K., Kim G., Shin S., Park Y., “Time-multiplexed structured illumination using a DMD for optical diffraction tomography,” Opt. Lett. 42(5), 999 (2017). 10.1364/OL.42.000999 [DOI] [PubMed] [Google Scholar]
- 45.Chen X., Korotkova O., “Phase structuring of 2D complex coherence states,” Opt. Lett. 44(10), 2470 (2019). 10.1364/OL.44.002470 [DOI] [PubMed] [Google Scholar]
- 46.Chen X., Kandel M. E., Hu C., Lee Y. J., Popescu G., “Wolf phase tomography (WPT) of transparent structures using partially coherent illumination,” Light: Sci. Appl. 9(1), 142 (2020). 10.1038/s41377-020-00379-4 [DOI] [PMC free article] [PubMed] [Google Scholar]
- 47.Chen M., Tian L., Waller L., “3D differential phase contrast microscopy,” Biomed. Opt. Express 7(10), 3940 (2016). 10.1364/BOE.7.003940 [DOI] [PMC free article] [PubMed] [Google Scholar]
- 48.Tian L., Waller L., “3D intensity and phase imaging from light field measurements in an LED array microscope,” Optica 2(2), 104 (2015). 10.1364/OPTICA.2.000104 [DOI] [Google Scholar]
- 49.Horstmeyer R., Chung J., Ou X., Zheng G., Yang C., “Diffraction tomography with Fourier ptychography,” Optica 3(8), 827 (2016). 10.1364/OPTICA.3.000827 [DOI] [PMC free article] [PubMed] [Google Scholar]
- 50.Zuo C., Sun J., Li J., Asundi A., Chen Q., “Wide-field high-resolution 3D microscopy with Fourier ptychographic diffraction tomography,” Opt. Lasers Eng. 128, 106003 (2020). 10.1016/j.optlaseng.2020.106003 [DOI] [Google Scholar]
- 51.Li J., Matlock A., Li Y., Chen Q., Zuo C., Tian L., “High-speed in vitro intensity diffraction tomography,” Adv. Photonics 1(06), 1 (2019). 10.1117/1.AP.1.6.066004 [DOI] [Google Scholar]
- 52.Barty A., Nugent K. A., Roberts A., Paganin D., “Quantitative phase tomography,” Opt. Commun. 175(4-6), 329–336 (2000). 10.1016/S0030-4018(99)00726-9 [DOI] [Google Scholar]
- 53.Zuo C., Li J., Sun J., Fan Y., Zhang J., Lu L., Zhang R., Wang B., Huang L., Chen Q., “Transport of intensity equation: a tutorial,” Opt. Lasers Eng. 135, 106187 (2020). 10.1016/j.optlaseng.2020.106187 [DOI] [Google Scholar]
- 54.Li J., Chen Q., Sun J., Zhang J., Ding J., Zuo C., “Three-dimensional tomographic microscopy technique with multi-frequency combination with partially coherent illuminations,” Biomed. Opt. Express 9(6), 2526 (2018). 10.1364/BOE.9.002526 [DOI] [PMC free article] [PubMed] [Google Scholar]
- 55.Jenkins M. H., Gaylord T. K., “Three-dimensional quantitative phase imaging via tomographic deconvolution phase microscopy,” Appl. Opt. 54(31), 9213 (2015). 10.1364/AO.54.009213 [DOI] [PubMed] [Google Scholar]
- 56.Bon P., Maucort G., Wattellier B., Monneret S., “Quadriwave lateral shearing interferometry for quantitative phase microscopy of living cells,” Opt. Express 17(15), 13080 (2009). 10.1364/OE.17.013080 [DOI] [PubMed] [Google Scholar]
- 57.Primot J., “Three-wave lateral shearing interferometer,” Appl. Opt. 32(31), 6242 (1993). 10.1364/AO.32.006242 [DOI] [PubMed] [Google Scholar]
- 58.Aknoun S., Bon P., Savatier J., Wattellier B., Monneret S., “Quantitative retardance imaging of biological samples using quadriwave lateral shearing interferometry,” Opt. Express 23(12), 16383 (2015). 10.1364/OE.23.016383 [DOI] [PubMed] [Google Scholar]
- 59.Ling T., Jiang J., Zhang R., Yang Y., “Quadriwave lateral shearing interferometric microscopy with wideband sensitivity enhancement for quantitative phase imaging in real time,” Sci. Rep. 7(1), 9 (2017). 10.1038/s41598-017-00053-7 [DOI] [PMC free article] [PubMed] [Google Scholar]
- 60.Smartt R. N., Steel W. H., “Theory and application of point-diffraction Interferometers,” Jpn. J. Appl. Phys. 14(S1), 351 (1975). 10.7567/JJAPS.14S1.351 [DOI] [Google Scholar]
- 61.Park Y., Popescu G., Badizadegan K., Dasari R. R., Feld M. S., “Diffraction phase and fluorescence microscopy,” Opt. Express 14(18), 8263 (2006). 10.1364/OE.14.008263 [DOI] [PubMed] [Google Scholar]
- 62.Bhaduri B., Edwards C., Pham H., Zhou R., Nguyen T. H., Goddard L. L., Popescu G., “Diffraction phase microscopy: principles and applications in materials and life sciences,” Adv. Opt. Photonics 6(1), 57 (2014). 10.1364/AOP.6.000057 [DOI] [Google Scholar]
- 63.Guo R., Mirsky S. K., Barnea I., Dudaie M., Shaked N. T., “Quantitative phase imaging by wide-field interferometry with variable shearing distance uncoupled from the off-axis angle,” Opt. Express 28(4), 5617 (2020). 10.1364/OE.385437 [DOI] [PubMed] [Google Scholar]
- 64.Mico V., Ferreira C., Zalevsky Z., García J., “Spatially-multiplexed interferometric microscopy (SMIM): converting a standard microscope into a holographic one,” Opt. Express 22(12), 14929 (2014). 10.1364/OE.22.014929 [DOI] [PubMed] [Google Scholar]
- 65.Picazo-Bueno J. A., Zalevsky Z., García J., Ferreira C., Micó V., “Spatially multiplexed interferometric microscopy with partially coherent illumination,” J. Biomed. Opt. 21(10), 106007 (2016). 10.1117/1.JBO.21.10.106007 [DOI] [PubMed] [Google Scholar]
- 66.Picazo-Bueno JÁ, Trusiak M., García J., Patorski K., Micó V., “Hilbert–Huang single-shot spatially multiplexed interferometric microscopy,” Opt. Lett. 43(5), 1007 (2018). 10.1364/OL.43.001007 [DOI] [PubMed] [Google Scholar]
- 67.Trusiak M., Picazo-Bueno J.-A., Patorski K., Zdankowski P., Mico V., “Single-shot two-frame π-shifted spatially multiplexed interference phase microscopy,” J. Biomed. Opt. 24(09), 1 (2019). 10.1117/1.JBO.24.9.096004 [DOI] [PMC free article] [PubMed] [Google Scholar]
- 68.Trusiak M., Zdańkowski P., Patorski K., Picazo-Bueno J. Á., Micó V., “Multi-beam spatially multiplexed interference microscopy for phase objects examination,” in Interferometry XIX, North Morris M. B., Creath K., Burke J., Davies A. D., eds. (SPIE, 2018), 10749(August), p. 19. [Google Scholar]
- 69.Kim Y., Shim H., Kim K., Park H., Jang S., Park Y., “Profiling individual human red blood cells using common-path diffraction optical tomography,” Sci. Rep. 4(1), 6659 (2015). 10.1038/srep06659 [DOI] [PMC free article] [PubMed] [Google Scholar]
- 70.Hsu W.-C., Su J.-W., Tseng T.-Y., Sung K.-B., “Tomographic diffractive microscopy of living cells based on a common-path configuration,” Opt. Lett. 39(7), 2210 (2014). 10.1364/OL.39.002210 [DOI] [PubMed] [Google Scholar]
- 71.Kim Y., Shim H., Kim K., Park H., Heo J. H., Yoon J., Choi C., Jang S., Park Y., “Common-path diffraction optical tomography for investigation of three-dimensional structures and dynamics of biological cells,” Opt. Express 22(9), 10398 (2014). 10.1364/OE.22.010398 [DOI] [PubMed] [Google Scholar]
- 72.Guo R., Barnea I., Shaked N. T., “Limited-angle tomographic phase microscopy utilizing confocal scanning fluorescence microscopy,” Biomed. Opt. Express 12(4), 1869 (2021). 10.1364/BOE.419598 [DOI] [PMC free article] [PubMed] [Google Scholar]
- 73.Patorski K., Zdańkowski P., Trusiak M., “Grating deployed total-shear 3-beam interference microscopy with reduced temporal coherence,” Opt. Express 28(5), 6893 (2020). 10.1364/OE.383201 [DOI] [PubMed] [Google Scholar]
- 74.Ziemczonok M., Kuś A., Wasylczyk P., Kujawińska M., “3D-printed biological cell phantom for testing 3D quantitative phase imaging systems,” Sci. Rep. 9(1), 18872 (2019). 10.1038/s41598-019-55330-4 [DOI] [PMC free article] [PubMed] [Google Scholar]
- 75.Dudaie M., Barnea I., Shaked N. T., “Label-free 3D refractive index interferometric tomography of live cells with full angular coverage,” in Label-Free Biomedical Imaging and Sensing (LBIS) 2021, Shaked N. T., Hayden O., eds. (SPIE, 2021), 11655, p. 32. [Google Scholar]
- 76.“Nanolive 3D Cell Explorer,” https://www.nanolive.ch/products/3d-microscopes/cx/.
- 77.Patorski K., “The Self-Imaging Phenomenon and its Applications,” Prog. Opt. 27, 1–108 (1989). 10.1016/S0079-6638(08)70084-2 [DOI] [Google Scholar]
- 78.Patorski K., Sluzewski L., Trusiak M., Pokorski K., “Generation of phase edge singularities by coplanar three-beam interference and their detection,” Opt. Express 25(3), 2432 (2017). 10.1364/OE.25.002432 [DOI] [PubMed] [Google Scholar]
- 79.Patorski K., Trusiak M., Pokorski K., “Diffraction grating three-beam interferometry without self-imaging regime contrast modulations,” Opt. Lett. 40(6), 1089 (2015). 10.1364/OL.40.001089 [DOI] [PubMed] [Google Scholar]
- 80.Patorski K., Służewski Ł, Trusiak M., “Single-shot 3×3 beam grating interferometry for self-imaging free extended range wave front sensing,” Opt. Lett. 41(18), 4417 (2016). 10.1364/OL.41.004417 [DOI] [PubMed] [Google Scholar]
- 81.Guo R., Barnea I., Shaked N. T., “Low-coherence shearing interferometry with constant off-axis angle,” Front. Phys. 8, 1–7 (2021). [Google Scholar]
- 82.Pan S., Kak A., “A computational study of reconstruction algorithms for diffraction tomography: Interpolation versus filtered-backpropagation,” IEEE Trans. Acoust., Speech, Signal Process. 31(5), 1262–1275 (1983). 10.1109/TASSP.1983.1164196 [DOI] [Google Scholar]
- 83.Wolf E., “Three-dimensional structure determination of semi-transparent objects from holographic data,” Opt. Commun. 1(4), 153–156 (1969). 10.1016/0030-4018(69)90052-2 [DOI] [Google Scholar]
- 84.Ledwig P. B., Robles F. E., “Non-linear 3D tomographic object reconstruction of partially-coherent broadband transmission illumination microscopy systems,” Proc. SPIE 11653, 116530V (2021). 10.1117/12.2579332 [DOI] [Google Scholar]
- 85.Ziemczonok M., Kuś A. T., Kujawinska M., “Quantifying the performance of holographic tomography systems using the 3D-printed biological cell phantom,” in Quantitative Phase Imaging VI, Liu Y., Popescu G., Park Y., eds. (SPIE, 2020), 11249(February), p. 60. [Google Scholar]
- 86.“Tomocube HT-2H,” http://www.tomocube.com/product/ht-microscope/.
- 87.Baek Y., Lee K., Yoon J., Kim K., Park Y., “White-light quantitative phase imaging unit,” Opt. Express 24(9), 9308 (2016). 10.1364/OE.24.009308 [DOI] [PubMed] [Google Scholar]
Associated Data
This section collects any data citations, data availability statements, or supplementary materials included in this article.
Data Availability Statement
Data underlying the results presented in this paper are not publicly available at this time but may be obtained from the authors upon reasonable request.


