Abstract
The main indicator for endarterectomy is the grade of stenosis, which results in severe overtreatment. Photoacoustic imaging (PAI) can provide patient-specific assessment of plaque morphology, and thereby vulnerability. A pilot study of PAI on carotid plaques in patients (n=16) was performed intraoperatively with a hand-held PAI system. By compensating for motion, the photoacoustic (PA) signal-to-noise ratio (SNR) could be increased by 5 dB in vivo. PA signals from hemorrhagic plaques had different characteristics compared to the signals from the carotid blood pool. This study is a key step towards a non-invasive application of PAI to detect vulnerable plaques.
1. Introduction
Cerebrovascular accidents (stroke) are the second cause of death, and the third cause of disability worldwide [1]. Stroke occurs due to interruption or severe reduction of blood supply to the brain. A common cause of stroke is the rupture of a vulnerable plaque in one of the carotid arteries, which may lead to migration of thrombi or plaque material that obstruct distal arteries in the brain [2]. Currently, the grade of carotid stenosis is widely used to assess the risk of (recurrent) stroke, which is routinely estimated by duplex US. According to the clinical guidelines, surgical treatment should be considered for patients with a stenosis grade over 70%. However, it is reported that 9 symptomatic or even 19 asymptomatic patients need to be operated to prevent one stroke in a 5 year time span [3,4], indicating a severe overtreatment with the current diagnosis. Therefore, a more effective patient-specific risk assessment is a strong, unmet, clinical need.
Several studies have demonstrated that the structure and composition of a plaque are significant determinants of its vulnerability, and thus, the risk of (recurrent) stroke [5–7]. The most prominent features of a vulnerable plaque include: 1) increased plaque inflammation, 2) a thin fibrous cap, covering 3) a large lipid-rich necrotic core, and 4) the presence of neovascularization and intraplaque hemorrhages [6,8].
Although ultrasound (US) imaging can be used to determine the structure of the plaque, its performance to differentiate between various soft tissue components within the plaque is poor, due to a low acoustic contrast between the constituents. Magnetic resonance angiography and computed tomography techniques have somewhat better image contrast for soft plaques, but are relatively expensive and cause more burden to the patient due to the use of contrast agents and/or ionizing radiation [9,10].
PAI is a promising non-invasive alternative for imaging and detection of (vulnerable) plaques. In PAI, short laser pulses are used to illuminate the tissue, and US signals are generated due to the absorption of light by the tissue. The US signals can be sensed by a conventional US probe and be reconstructed subsequently to create a PA image [11]. As a hybrid imaging modality, PAI takes advantage of the high optical absorption contrast between tissue types and the high resolution of US. Furthermore, PAI has a reasonably large imaging depth, as compared to other optical techniques, owing to the relatively low acoustic attenuation in soft tissues. Previous studies have demonstrated the great potential of PAI to assess the vulnerability of plaques by determining the presence of several components such as a lipid- rich necrotic core and intraplaque hemorrhages, either ex vivo or in animal models [12–21].
To achieve PA detection of vulnerable carotid plaques in vivo, it is practical to perform PAI at the spectral range between 700 nm and 950 nm, due to the deep optical penetration depth [22–26]. Furthermore, plaque components such as neovascularization and intraplaque hemorrhages, which are key indicators for vulnerable plaque, have a strong PA response at these wavelengths [18,27]. However, the oxygenated blood in the carotid lumen can also generate a strong PA signal at the wavelengths between 700 and 950 nm and can thus significantly interfere with the detection of the vulnerable plaques in vivo. Although the lumen area can be segmented using co-registered US images, it relies on the accuracy of the lumen segmentation. Alternatively, multi-spectral PAI can differentiate between plaque hemorrhage and oxygenated luminal blood [15,16,28–31], however, it requires good spectral unmixing and a PA system with a tunable laser source which is usually bulky, expensive, and relatively slow. Moreover, the in vivo pulsatile motion of the carotid artery reduces the overall imaging quality and makes the detection of plaques more difficult. All these factors together make in vivo PA detection of vulnerable plaques challenging.
In this study, with a fast, fully integrated hand-held laser-diode based PA/US probe, we aim to demonstrate the capability of PAI to image plaques with intraplaque hemorrhages in human, by performing the first pilot clinical study of PAI in patients during carotid endarterectomy (CEA). To improve in vivo PA image quality, a motion corrected averaging (MCA) method based on speckle tracking is proposed and evaluated with the acquired in vivo clinical data. Furthermore, to explore the properties of the in vivo PA signals generated from plaques with hemorrhages, the PA signals were segmented based on the corresponding histological staining and were then analyzed statistically. The in vivo results were validated by ex vivo scanning of the excised plaques.
2. Materials and methods
2.1. Imaging setup and data acquisition
The PA/US imaging system was developed in an EU funded project (H2020/Photonics21, the CVENT project). The system consists of a scanner, a laptop, and a hand-held PA/US probe, see Fig. 1. Two laser diodes operating at 808 and 940 nm were integrated in the probe that also contained a linear US array with 64 elements, a center frequency of 7 MHz, and a pitch of 245 µm. Both lasers have a 1 kHz pulse repetition frequency (PRF) and the wavelengths used were chosen to image intraplaque hemorrhages [18,25,26]. The laser light illuminates the tissue, exiting the probe at an angle of 50 degrees with respect to the US array, and intersects with the US beam at a depth of about 5 mm from the transducer. The output power from the probe is 2 mJ per pulse for both wavelengths and the illumination area at the probe is approximately 2 cm2, resulting in a delivered energy of approximately 1 mJ/cm2 per pulse. This resulting energy is below the maximal permitted exposure of 3.2 mJ/cm2 for skin at the wavelengths used, according to the guidelines given in the International Standard PD IEC TR 60825-14 [32]. The US array is coated with a white silicon lens to reduce PA artifacts generated by optical absorption of the laser light by the US transducer. The whole system is compact and portable. The data acquisition was designed to receive co-registered plane wave US data and PA data in interleaved sequences. The received PA/US signals were digitized at a sample rate of 29 MHz. The final PAI frame rate varies between 10 and 30 frames per second. A real-time image reconstruction and display is available. All further details of the imaging system were reported previously [33].
Fig. 1.
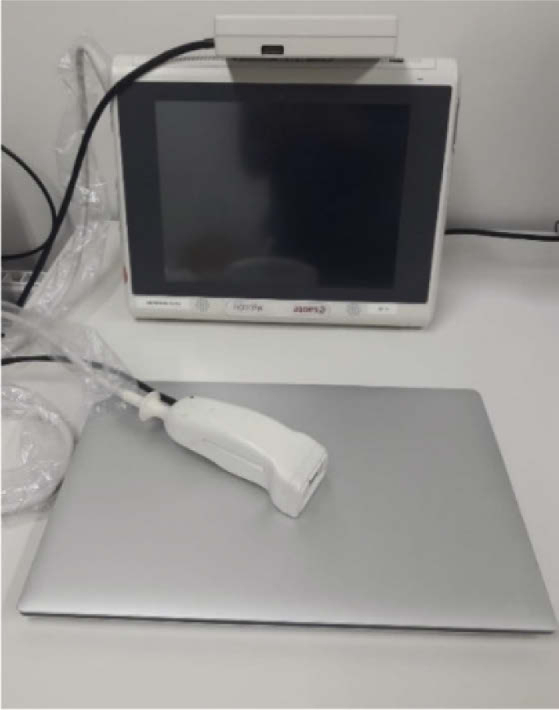
The portable PA/US imaging system, consisting of a PA/US scanner, a laptop and the hand-held PA/US probe, is shown.
2.2. In vivo intraoperative PAI
To explore the capability of PAI to image plaques in vivo, and to achieve a comprehensive understanding of the PA images acquired in vivo, a first clinical pilot study of intraoperative PAI of carotid plaques in patients was performed in collaboration with the Catharina hospital in Eindhoven. In this study, PAI was performed during CEA surgery. The intraoperative PAI enables investigation of the PA signals originating from the plaques without interfering superficial tissue, such as the skin and muscle layers, while keeping in vivo pulsatile motion of the carotid artery under realistic conditions. The study was approved by the local Ethical Committee (MEC-U, Nieuwegein, The Netherlands). Since February 2019, 16 patients were successfully included in the clinical study. All patients were duly informed and gave their consent to participance in this study.
The patients underwent a normal CEA procedure, as clinically indicated. Before clamping of the carotid bifurcation, the surgical field was filled with room temperature saline and PAI was performed without contact between the carotid bifurcation and the probe. Due to the limited space in the incision, it was impossible to scan the entire carotid plaque. Typically, 3 to 5 positions were scanned per patient, as indicated by the surgeon. The extra-time necessary for PAI was approximately 5 minutes. During the imaging, photographs were taken of the carotid artery and annotations of the imaging locations were made using the bifurcation apex as a landmark. This procedure provided additional information to allow registration of the images with the data obtained with ex vivo imaging and histology. All carotid plaques that were removed during the CEA procedures, were transported to the lab, snap frozen in liquid nitrogen, and stored in a freezer at -80° C for future ex vivo imaging and histology. An overview of the in vivo scanning procedure and the ex vivo analyses is shown in Fig. 2.
Fig. 2.
A schematic overview of the in vivo scanning procedures and ex vivo analyses.
2.3. Data processing
To improve the PA SNR for in vivo imaging, we propose an MCA method based on speckle tracking. For a perfect motion correction and white noise, the expected increase in SNR is given by:
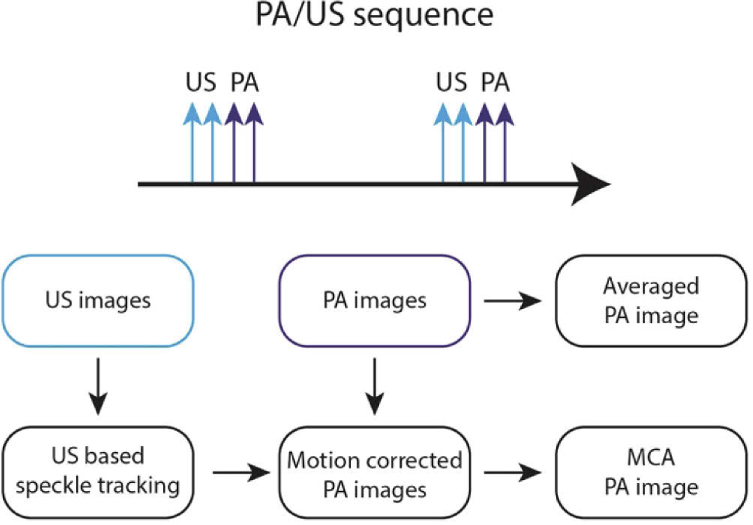
where is the number of frames averaged. The design of the MCA algorithm is shown schematically in Fig. 3. First, the motion was estimated using a 2D US speckle tracking method [34]. Then the estimated displacement fields were interpolated and used to translate the PA data based on the data acquisition sequences. Due to the limited lateral tracking quality of the single plane wave images, we only corrected the motion in the axial direction. Afterwards, the data were (delay-and-sum) beamformed and coherently averaged pixel-wise before envelope detection.
Fig. 3.
The US images were processed to estimate tissue displacement in each image. The PA images were corrected based on this displacement before averaging.
The dynamic range of each image was adjusted based on the data. The lower threshold was set at the noise level of the data, to ensure all PA signals were included, while the higher threshold was equal to the maximum amplitude present in the image. Subsequently, the PA images were log-compressed and overlayed on top of the log-compressed US images. The PA images’ transparency in the overlays ranged between 0 and 1 and was linearly dependent on the log-compressed PA data. For all overlayed images in this study, the same color mapping was applied.
2.4. Ex vivo PAI validation and histological analysis
Before ex vivo imaging, the stored plaque samples were thawed. The carotid plaque specimens were mounted in a rotatable setup described in a previous study by our group [18]. Each carotid plaque was imaged at the locations that were noted during the surgery. The plaque specimens that were cut open during surgery could not be used for ex vivo imaging and were therefore excluded. A total number of 6 specimens was examined.
To improve PAI quality and field of view, multiple acquisitions were made by rotating the plaque over 360 degrees in steps of approximately 40 degrees. The acquired data were aligned manually, after which incoherent compounding was applied to obtain high contrast PA and US images. The ex vivo results were also used to perform the registration of the in vivo data to select the corresponding slice location for further histological analysis. After imaging, the carotid samples were fixated with formalin and decalcified with a 10% EDTA solution. Subsequently, the samples were embedded in paraffin and sectioned into slices with a thickness of 5 µm for H&E and Masson’s trichrome staining. All 16 plaque samples were analyzed by experts and annotated for intraplaque hemorrhages.
2.5. PA features extraction from plaque signals
To analyze the signals originating from the plaques with hemorrhages and lumina, images were segmented manually and categorized accordingly. Based on histological examination, we excluded plaques samples without intraplaque hemorrhages. A total of 13 regions of interest (ROIs) consisting of 5 ROIs of plaques with hemorrhages and 8 lumen regions were included for further processing. The following four parameters were analyzed: mean and coefficient of variation of the ratio of the PA amplitude acquired at 808/940 nm (rmean and rCV respectively), mean PA SNR at 808 nm (Smean), and the magnitude of the complex Pearson correlation coefficient of the PA response between 808 and 940 nm (C808/940) in the ROIs. For relatively weak signals, the ratio of two amplitudes is highly influenced by noise. Therefore, a weighted mean and standard deviation were used to analyze rmean and rCV. The weight W for every pixel in the ROI was defined as follows:
, where .
denotes the (absolute) pressure amplitude and represents the 99th percentile of the noise amplitude distribution at wavelength .
3. Results
3.1. In vivo PA SNR improvement using MCA
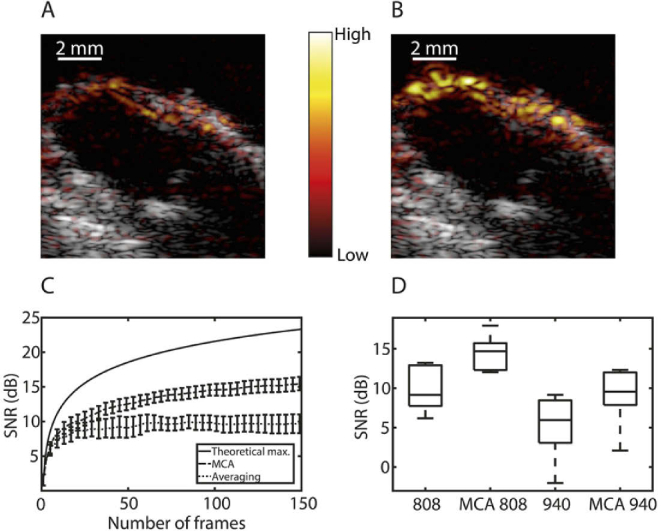
The MCA algorithm was applied to all in vivo datasets. An example of a PA image with and without the MCA algorithm is shown in Fig. 4(a) and (b). The comparison shows that MCA can significantly enhance the visibility of the plaque lesion at the top part of the artery. The change of PA SNR (at 808 nm) in 6 plaque (both hemorrhagic and non-hemorrhagic) ROIs was analyzed for an increasing number of averaged frames (up to 150 frames, i.e. 5 seconds of acquisition in total), see Fig. 4(c). Note that only datasets with a sufficient acquisition length (150 frames) were included.
Fig. 4.
Overall results of MCA method: (a) averaged PA/US image of a carotid plaque (808 nm, dynamic range 31 dB); (b) MCA results of the same PA/US data; (c) averaged PA SNR at 808 nm as function of the number of frames averaged. The solid line shows the maximal theoretical PA SNR increase; (d) the boxplot of the PA SNR results of the in vivo clinical study after averaging of 100 frames.
The results demonstrated that the PA SNR increased by approximately 13 dB with the MCA (100x averaged) approach, which is significant, albeit 7 dB less than the maximal theoretical increase of 20 dB that would be expected with perfect motion correction. The SNR has improved by 5 dB for both wavelengths used (based on 100 frames) compared to conventional averaging without motion correction, see Fig. 4(d). Although the SNR can be further improved by averaging more than 100 frames, the increment is relatively small. Therefore, the maximum number of averaged frames was set to 100 for all our in vivo datasets.
3.2. In vivo intraoperative PAI
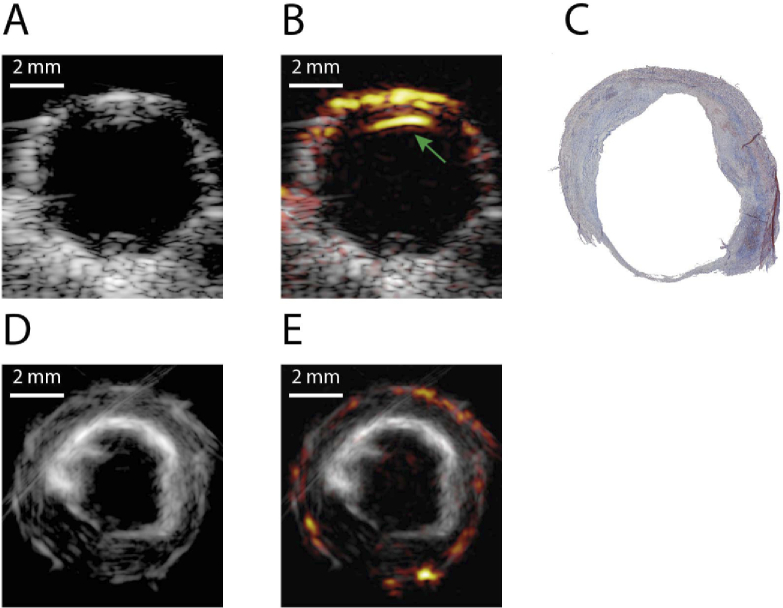
Figure 5 shows a typical in vivo PA image from the common carotid artery, which was not at the lesion site of a hemorrhagic plaque. In the PA image (Fig. 5(b)), only two strong PA signals are present, located at the interfaces at the outer and inner arterial wall. Note that the PA signal from the outer arterial wall is generated by the artificial interface between saline and arterial wall (Fig. 5(b) and (e)), which would not be present in a non-invasive measurement, and thus, we excluded these signals from further analysis. The other strong PA signal, which is from the inner arterial wall and marked with the green arrow, originates from the interface between lumen and wall. No other PA signals were observed in this case, indicating the absence of intraplaque hemorrhages, which was confirmed by the ex vivo PA results and histological staining.
Fig. 5.
In vivo and ex vivo PA and US image of a human carotid artery without vulnerable plaque: (a) in vivo US image; (b) in vivo overlaid US and PA image (808 nm, dynamic range 34 dB); (c) Masson’s trichrome staining of the artery sample; (d) ex vivo US image; (e) ex vivo overlaid PA/US image (808 nm, dynamic range 19 dB).
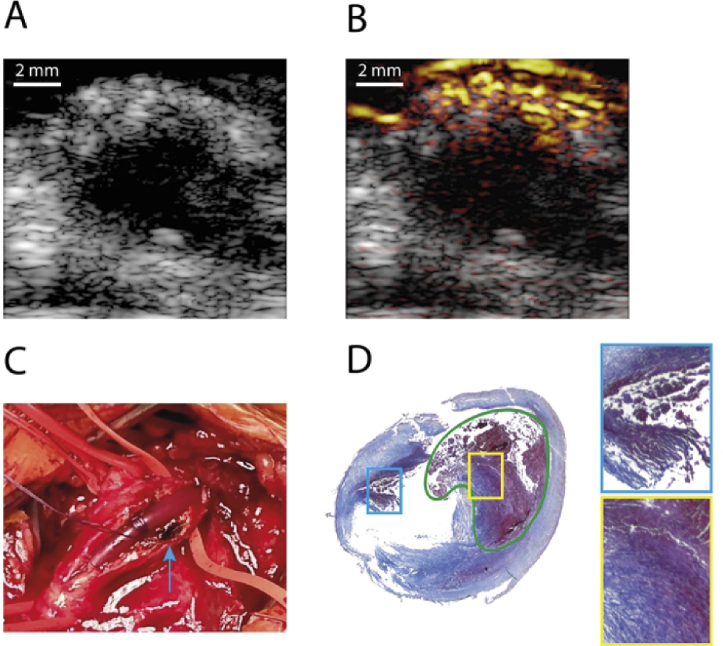
Figure 6 shows an in vivo PA image of a carotid plaque with an intraplaque hemorrhage. In this case, the patient required shunting of the circulation after clamping. After opening of the carotid bifurcation and implantation of the shunt, we observed an intraplaque hemorrhage at the entrance of the internal carotid artery, which is indicated by a blue arrow in Fig. 6(c). It can be easily seen that the hemorrhage was at the top before the artery was cut open. The in vivo US and PA images shown in Fig. 6(a) and (b) show a strong PA signal with a diffuse (scattered) pattern, clearly visible at the top part the artery wall. This corresponds exactly to the hemorrhage site as shown in Fig. 6(c). The corresponding histology staining also verified the presence of this intraplaque hemorrhage.
Fig. 6.
In vivo PA and US image of a human carotid artery with intraplaque hemorrhage; (a) US image; (b) overlaid PA/US image (808 nm, dynamic range 23 dB); (c) photo of the carotid plaque during the CEA surgery; (d) Masson’s trichrome staining of the artery. The area indicated in green is a lipid core filled with a large hemorrhage. The highlighted boxes show two regions of hemorrhages found in the plaque.
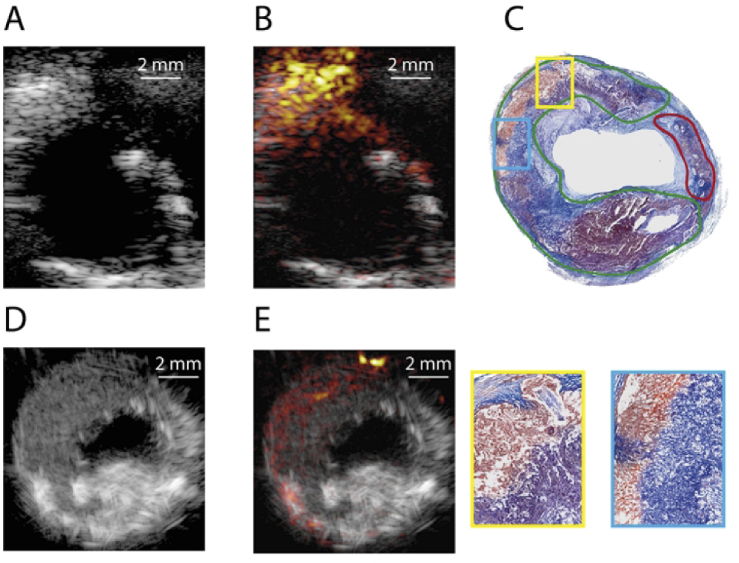
A second example of a plaque with intraplaque hemorrhage is shown in Fig. 7. A strong in vivo PA signal was observed at the top part of the artery. These diffuse signals were also observed in a large area of the plaque in the ex vivo image. The presence of intraplaque hemorrhages was verified by histological staining.
Fig. 7.
In vivo and ex vivo PA and US image of a human carotid artery with plaque: (a) in vivo US image; (b) in vivo overlaid PA/US image (808 nm, dynamic range 32 dB); (c) Masson’s trichrome staining of the artery sample. The area indicated in green is a lipid core containing multiple hemorrhages. The highlighted boxes show two regions of hemorrhages found in the plaque. The red area contains multiple calcified regions; (d) ex vivo US image; (e) ex vivo overlaid PA/US image of the carotid plaque (808 nm, dynamic range 19 dB).
3.3. In vivo PA characteristics of the plaque lesion
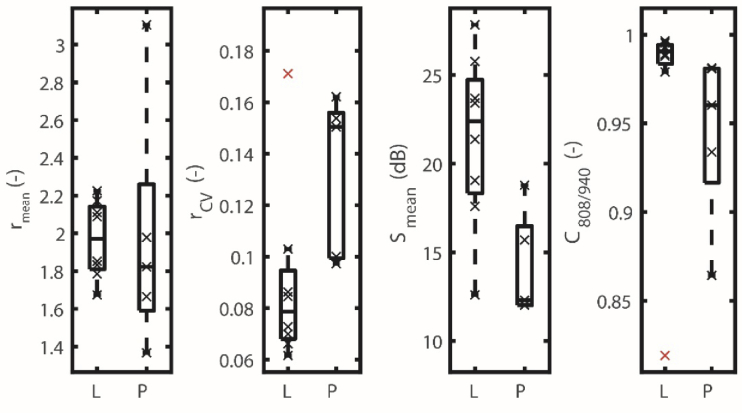
The comparison of the properties of the PA signals generated within plaques with hemorrhages and the lumen in terms of rmean, rCV, Smean, and C808/940 is shown in Fig. 8. Based on all the results of this in vivo study, we report three main observations:
-
1.
Although rmean is similar in the signals originating from plaque and lumen, rCV can appropriately differentiate between these two structures. This may be caused by the fact that the carotid luminal blood is mainly oxygenated blood, while the composition of plaques is usually more heterogenous, where different types of hemoglobin (deoxygenated hemoglobin and methemoglobin in intraplaque hemorrhages) as well as various lipids may be present.
-
2.
Smean in the carotid lumen is generally higher than in the plaque lesion, probably due to the higher optical absorption by the blood pool in the carotid lumen.
-
3.
The PA response at 808 nm is highly correlated with the one at 940 nm in the carotid lumen (C808/940 is almost 1), which is less pronounced in the signals originating from the plaque lesions.
Fig. 8.
Comparison of the properties of the PA signals generated from regions from plaques with hemorrhages (P) and signals from the carotid lumen (L). For the Smean boxplot, the results at 808 nm are shown.
4. Conclusion and discussion
In this work, we explored the capability of PAI to detect plaques with hemorrhages in vivo by conducting a unique clinical pilot study of intraoperative PAI on patients using a handheld PA system. This intraoperative PAI in combination with the exploration of the characteristics of in vivo PA signals (both in the hemorrhaged plaque lesions and carotid lumen regions) are, to the best of our knowledge, the first reported so far. Although the intraoperative PAI overcomes the problem of overlying tissues such as the skin and the muscle layer, it is still an important intermediate step, allowing for in vivo PAI in a more controlled setting. As such, it is very insightful for a better understanding of in vivo PA plaque imaging and can bridge the gap to non-invasive PAI in the near future.
We developed an MCA method to improve PA SNR for in vivo applications. The application of the proposed MCA method can gain 5 dB in PA SNR (when using 100 frames of data) compared to averaging without motion correction. In this study, we fixed the maximum number of averaged frames to 100, to minimize the possible tracking drift, and the presence of out-of-plane motion introduced by manual handling of the probe during the in vivo measurements. Further optimization of the MCA algorithm may be possible, by using a patient-specific adaptive algorithm to calculate the optimal number of averaged frames for the obtained data, and beamsteering to allow for lateral motion compensation. Moreover, other quality measures may be used to determine the optimal number of frames, such as the contrast and resolution of the resulting images.
Our in vivo PAI results demonstrate the capability of PAI to detect the presence of hemorrhage (a marker for plaque vulnerability), for which strong diffuse signals could be observed in vivo. However, all PA signals detected in vivo were at the top part of the artery. As the top part of the artery was exposed during the intraoperative measurements, corrections for the wavelength dependent fluence attenuation were not considered in this research. It was not possible to detect plaque signals from the bottom part of the artery through the carotid lumen due to the high absorption coefficient of the blood and subsequent insufficient penetration depth of the preclinical PA system used. To achieve detection of plaque at the bottom part of the artery, further exploration of using a more powerful imaging system and/or a different choice of wavelengths is required.
Based on the analysis of these in vivo PA images, some features/characteristics of the lesion and lumen could be extracted. We observed that the PA signal from the carotid lumen is only present as the interface signal between the lumen and artery wall as demonstrated before [25], which it is due to the bandwidth limitation of the probe. PA signals from the carotid blood pool contain mainly low frequency components compared to the center frequency of the probe, so only the edge signals from the lumen are preserved. In contrast, the plaque lesion usually exhibits a more heterogenous composition, thus, the PA signals from those plaques show scattered/diffused patterns. This effect could also explain why the PA signals from the plaques have a higher rCV and a smaller correlation between the two wavelengths. The results suggest that compared to all the parameters examined in the study, rCV may be useful for further detection of plaques with hemorrhages in vivo, independent of image segmentation. The subtle difference in C808/940 may be a potential alternative, although the correlation in both plaque and lumen area is generally quite high. Furthermore, the Smean parameter showed a significant difference between the plaque and lumen as well. The SNR, however, strongly depends on the individual PA system and the tissue anatomy and is therefore not suitable for general detection of plaque signals. Please note that, although our analysis is based on PA data with a relatively good SNR (>5 dB), signals with a small SNR will lead to a bias towards a high rCV and a low C808/940. Degradation of the SNR will therefore lead to a smaller difference between plaque and interface signals.
The data shown in this study are preliminary due to the number of available datasets included and more comprehensive statistic results could be achieved by including more patient data. Moreover, a limited number of wavelengths is used in this study, due to the use of the presented hand-held probe, aimed at clinical operation. The detection of intraplaque hemorrhages would be improved by the availability of more wavelengths, which would however result in a more complex, bulky, and more costly PA/US system. Furthermore, preclinical multi-wavelength research systems often use a tunable optical parametric oscillator (OPO) laser system, which have a limited PRF (typically < 50 Hz) [35]. In contrast, laser diodes, as used in this study, are more stable and generally have a much higher PRF in the order of several kHz, which has the potential to significantly improve temporal resolution.
As demonstrated in previous studies [18,25,26], the two wavelengths used in this study are useful for imaging intraplaque hemorrhages and potentially lipids, which are the most important indicators for vulnerable plaques. Specifically, the 808 nm wavelength responds equally to both oxygenated and deoxygenated blood, being a good option to detect intraplaque hemorrhages and the 940 nm wavelength corresponds roughly with the local peak absorption of lipids (∼925 nm). However, we focused on the characterization of intraplaque hemorrhages in this study.
Another limitation of the study is the imperfect registration of the in vivo and ex vivo imaging locations due to practical limitations, as well as the difficulties in registering the exact orientation between the probe and the artery during transverse carotid measurements. A more accurate registration can be achieved by integrating a gyroscope in the probe for instance, or other means of probe tracking. This was not available in the current study but could be explored in future research.
In summary, we verified the capability of PAI to detect plaques with intraplaque hemorrhages in vivo, based on a first pilot clinical study of intraoperative PAI in patients. We obtained PA images with sufficient SNR in vivo, and observed diffuse PA signals in the upper part of plaques, which may be related to the heterogeneity of the plaque composition. Our results are a step further toward non-invasive in vivo PAI to detect vulnerable carotid plaques and can accelerate the clinical translation of PAI for plaque vulnerability assessment.
Acknowledgments
We thank Catarina Matos from the Biomedical Engineering Department, Eindhoven University of Technology for her help with histology, and Michael Jaeger from Bern University in Switzerland for the real-time data processing and display tool in the preclinical PA system.
Funding
Horizon 2020 Framework Programme10.13039/100010661 (731771); Stichting Lijf en Leven10.13039/501100010328 (37).
Disclosures
The authors declare no conflicts of interest.
Data availability
Data underlying the results presented in this paper are not publicly available at this time but may be obtained from the authors upon reasonable request.
References
- 1.Johnson W., Onuma O., Owolabi M., Sachdev S., “Stroke: a global response is needed,” Bull. World Health Organ. 94(9), 634–634A (2016). 10.2471/BLT.16.181636 [DOI] [PMC free article] [PubMed] [Google Scholar]
- 2.Skagen K., Skjelland M., Zamani M., Russell D., “Unstable carotid artery plaque: new insights and controversies in diagnostics and treatment,” Croat. Med. J. 57(4), 311–320 (2016). 10.3325/cmj.2016.57.311 [DOI] [PMC free article] [PubMed] [Google Scholar]
- 3.Rothwell P. M., Eliasziw M., Gutnikov S. A., Fox A. J., Taylor D. W., Mayberg M. R., Warlow C. P., Barnett H. J. M., “Analysis of pooled data from the randomised controlled trials of endarterectomy for symptomatic carotid stenosis,” Lancet 361(9352), 107–116 (2003). 10.1016/S0140-6736(03)12228-3 [DOI] [PubMed] [Google Scholar]
- 4.Enry H., Arnett J. M. B., Ayne D. W., Aylor T., Ichael M., Liasziw E., Llan A., Ox J. F., Erguson A. G. F., Rian R. B., Aynes H., Ankin I. N. R., Atrick G. P., Lagett C., Ladimir V., Achinski C. H., Ackett A. L. S., Horpe E. E. T., Ath M. M., Eather H., Eldrum E. M., “Benefit of carotid endarterectomy in patients with symptomatic moderate or severe stenosis,” N. Engl. J. Med. 33, 1415–1425 (1998). 10.1056/NEJM199811123392002 [DOI] [PubMed] [Google Scholar]
- 5.Nighoghossian N., Derex L., Douek P., “The vulnerable carotid artery plaque: current imaging methods and new perspectives,” Stroke 36(12), 2764–2772 (2005). 10.1161/01.STR.0000190895.51934.43 [DOI] [PubMed] [Google Scholar]
- 6.Naghavi M., Libby P., Falk E., Casscells S. W., Litovsky S., Rumberger J., Badimon J. J., Stefanadis C., Moreno P., Pasterkamp G., Fayad Z., Stone P. H., Waxman S., Raggi P., Madjid M., Zarrabi A., Burke A., Yuan C., Fitzgerald P. J., Siscovick D. S., De Korte C. L., Aikawa M., Airaksinen K. E. J., Assmann G., Becker C. R., Chesebro J. H., Farb A., Galis Z. S., Jackson C., Jang I. K., Koenig W., Lodder R. A., March K., Demirovic J., Navab M., Priori S. G., Rekhter M. D., Bahr R., Grundy S. M., Mehran R., Colombo A., Boerwinkle E., Ballantyne C., Insull W., Schwartz R. S., Vogel R., Serruys P. W., Hansson G. K., Faxon D. P., Kaul S., Drexler H., Greenland P., Muller J. E., Virmani R., Ridker P. M., Zipes D. P., Shah P. K., Willerson J. T., “From vulnerable plaque to vulnerable patient: a call for new definitions and risk assessment strategies: part II,” Circulation 108(15), 1772–1778 (2003). 10.1161/01.CIR.0000087481.55887.C9 [DOI] [PubMed] [Google Scholar]
- 7.Saba L., Anzidei M., Sanfilippo R., Montisci R., Lucatelli P., Catalano C., Passariello R., Mallarini G., “Imaging of the carotid artery,” Atherosclerosis 220(2), 294–309 (2012). 10.1016/j.atherosclerosis.2011.08.048 [DOI] [PubMed] [Google Scholar]
- 8.Gao P., Chen Z. Q., Bao Y. H., Jiao L. Q., Ling F., “Correlation between carotid intraplaque hemorrhage and clinical symptoms: systematic review of observational studies,” Stroke 38(8), 2382–2390 (2007). 10.1161/STROKEAHA.107.482760 [DOI] [PubMed] [Google Scholar]
- 9.Porcu M., Anzidei M., Suri J. S., Wasserman B. A, Anzalone N., Lucatelli P., Loi F., Montisci R., Sanfilippo R., Rafailidis V., Saba L., “Carotid artery imaging: the study of intra-plaque vascularization and hemorrhage in the era of the “vulnerable” plaque,” Journal of Neuroradiology 47(6), 464–472 (2020). 10.1016/j.neurad.2019.03.009 [DOI] [PubMed] [Google Scholar]
- 10.Adla T., Adlova R., “Multimodality imaging of carotid stenosis,” Int J Angiol 24(03), 179–184 (2015). 10.1055/s-0035-1556056 [DOI] [PMC free article] [PubMed] [Google Scholar]
- 11.Wang L. V., Wu H.-I., Biomedical Optics: Principles and Imaging (Wiley, 2009).
- 12.Allen T. J., Hall A., Dhillon A. P., Owen J. S., Beard P. C., “Spectroscopic photoacoustic imaging of lipid-rich plaques in the human aorta in the 740 to 1400 nm wavelength range,” J. Biomed. Opt. 17(6), 061209 (2012). 10.1117/1.JBO.17.6.061209 [DOI] [PubMed] [Google Scholar]
- 13.Wu M., Jansen K., van der Steen A. F. W., van Soest G., “Specific imaging of atherosclerotic plaque lipids with two-wavelength intravascular photoacoustics,” Biomed. Opt. Express 6(9), 3276 (2015). 10.1364/BOE.6.003276 [DOI] [PMC free article] [PubMed] [Google Scholar]
- 14.Vogt W. C., Jia C., Wear K. A., Garra B. S., Joshua Pfefer T., “Biologically relevant photoacoustic imaging phantoms with tunable optical and acoustic properties,” J. Biomed. Opt. 21(10), 101405 (2016). 10.1117/1.JBO.21.10.101405 [DOI] [PMC free article] [PubMed] [Google Scholar]
- 15.Kruizinga P., van der Steen A. F. W., de Jong N., Springeling G., Robertus J. L., van der Lugt A., van Soest G., “Photoacoustic imaging of carotid artery atherosclerosis,” J. Biomed. Opt. 19(11), 110504 (2014). 10.1117/1.JBO.19.11.110504 [DOI] [PubMed] [Google Scholar]
- 16.Allen T. J., Beard P. C., “Photoacoustic characterisation of vascular tissue at NIR wavelengths,” Photons Plus Ultrasound Imaging Sens. 7177, 71770A (2009). 10.1117/12.808777 [DOI] [Google Scholar]
- 17.Wu M., Springeling G., Lovrak M., Mastik F., Rizk S. I., Wang T., Van Beusekom H. M. M., Van Der Steen A. F. W., Van Soest G., “Real-time volumetric lipid imaging in vivo by intravascular photoacoustics at 20 frames per second,” Biomed. Opt. Express 8, 156–159 (2017). 10.1364/BOE.8.000943 [DOI] [PMC free article] [PubMed] [Google Scholar]
- 18.Arabul M. U., Heres M., Rutten M. C. M., van Sambeek M. R., van de Vosse F. N., Lopata R. G. P., “Toward the detection of intraplaque hemorrhage in carotid artery lesions using photoacoustic imaging,” J. Biomed. Opt. 22(4), 041010 (2017). 10.1117/1.JBO.22.4.041010 [DOI] [PubMed] [Google Scholar]
- 19.Wang B., Su J. L., Amirian J., Litovsky S. H., Smalling R., Emelianov S., “Detection of lipid in atherosclerotic vessels using ultrasound-guided spectroscopic intravascular photoacoustic imaging,” Opt. Express 18(5), 4889 (2010). 10.1364/OE.18.004889 [DOI] [PMC free article] [PubMed] [Google Scholar]
- 20.Sethuraman S., Amirian J. H., Litovsky S. H., Smalling R. W., Emelianov S. Y., “Spectroscopic intravascular photoacoustic imaging to differentiate atherosclerotic plaques,” Opt. Express 16(5), 3362 (2008). 10.1364/OE.16.003362 [DOI] [PubMed] [Google Scholar]
- 21.Sethuraman S., Mallidi S., Aglyamov S. R., Amirian J. H., Litovsky S., Smalling R. W., Emelianov S. Y., “Intravascular photoacoustic imaging of atherosclerotic plaques: ex-vivo study using a rabbit model of atherosclerosis,” Proc. SPIE 6437, 643729 (2007). 10.1117/12.701111 [DOI] [Google Scholar]
- 22.Beard P., “Biomedical photoacoustic imaging,” Interface Focus 1(4), 602–631 (2011). 10.1098/rsfs.2011.0028 [DOI] [PMC free article] [PubMed] [Google Scholar]
- 23.Deán-Ben X. L., Razansky D., “Functional optoacoustic human angiography with handheld video rate three dimensional scanner,” Photoacoustics 1(3-4), 68–73 (2013). 10.1016/j.pacs.2013.10.002 [DOI] [PMC free article] [PubMed] [Google Scholar]
- 24.Barun V. V., Ivanov A. P., Volotovskaya A. V., Ulashchik V. S., “Absorption spectra and light penetration depth of normal and pathologically altered human skin,” J. Appl. Spectrosc. 74(3), 430–439 (2007). 10.1007/s10812-007-0071-2 [DOI] [Google Scholar]
- 25.Merčep E., Deán-Ben X. L., Razansky D., “Imaging of blood flow and oxygen state with a multi-segment optoacoustic ultrasound array,” Photoacoustics 10, 48–53 (2018). 10.1016/j.pacs.2018.04.002 [DOI] [PMC free article] [PubMed] [Google Scholar]
- 26.Ivankovic I., Merčep E., Schmedt C. G., Deán-Ben X. L., Razansky D., “Real-time volumetric assessment of the human carotid artery: handheld multispectral optoacoustic tomography,” Radiology 291(1), 45–50 (2019). 10.1148/radiol.2019181325 [DOI] [PubMed] [Google Scholar]
- 27.Arabul M. U., Rutten M. C. M., Bruneval P., van Sambeek M. R. H. M., van de Vosse F. N., Lopata R. G. P., “Unmixing multi-spectral photoacoustic sources in human carotid plaques using non-negative independent component analysis,” Photoacoustics 15, 100140 (2019). 10.1016/j.pacs.2019.100140 [DOI] [PMC free article] [PubMed] [Google Scholar]
- 28.Li M., Tang Y., Yao J., “Photoacoustic tomography of blood oxygenation: a mini review,” Photoacoustics 10, 65–73 (2018). 10.1016/j.pacs.2018.05.001 [DOI] [PMC free article] [PubMed] [Google Scholar]
- 29.Laufer J., Elwell C., Delpy D., Beard P., “In vitro measurements of absolute blood oxygen saturation using pulsed near-infrared photoacoustic spectroscopy: accuracy and resolution,” Phys. Med. Biol. 50(18), 4409–4428 (2005). 10.1088/0031-9155/50/18/011 [DOI] [PubMed] [Google Scholar]
- 30.Chen Zhongjiang, Yang S., Xing D., “"In vivo detection of hemoglobin oxygen saturation and carboxyhemoglobin saturation with multiwavelength photoacoustic microscopy,” Opt. Lett. 37(16), 3414–3416 (2012). 10.1364/OL.37.003414 [DOI] [PubMed] [Google Scholar]
- 31.Deán-Ben X. L., Gottschalk S., Mc Larney B., Shoham S., Razansky D., “Advanced optoacoustic methods for multiscale imaging of: In vivo dynamics,” Chem. Soc. Rev. 46(8), 2158–2198 (2017). 10.1039/C6CS00765A [DOI] [PMC free article] [PubMed] [Google Scholar]
- 32.I. E. C. TR60825 , “Safety of Laser Products–Part 14: A User’s Guide,” Int. Electrotech. Comm. (2004).
- 33.Daoudi K., van den Berg P. J., Rabot O., Kohl A., Tisserand S., Brands P., Steenbergen W., “Handheld probe integrating laser diode and ultrasound transducer array for ultrasound/photoacoustic dual modality imaging,” Opt. Express 22(21), 26365 (2014). 10.1364/OE.22.026365 [DOI] [PubMed] [Google Scholar]
- 34.Lopata R. G. P., Nillesen M. M., Hansen H. H. G., Gerrits I. H., Thijssen J. M., de Korte C. L., “Performance evaluation of methods for two-dimensional displacement and strain estimation using ultrasound radio frequency data,” Ultrasound in Medicine & Biology 35(5), 796–812 (2009). 10.1016/j.ultrasmedbio.2008.11.002 [DOI] [PubMed] [Google Scholar]
- 35.Schellenberg M. W., Hunt H. K., “Hand-held optoacoustic imaging: a review,” Photoacoustics 11, 14–27 (2018). 10.1016/j.pacs.2018.07.001 [DOI] [PMC free article] [PubMed] [Google Scholar]
Associated Data
This section collects any data citations, data availability statements, or supplementary materials included in this article.
Data Availability Statement
Data underlying the results presented in this paper are not publicly available at this time but may be obtained from the authors upon reasonable request.


