

Abstract
The development of new antibiotics is particularly problematic in Gram-negative bacteria due to the presence of the outer membrane (OM), which serves as a permeability barrier. Recently, the β-barrel assembly machine (BAM), located in the OM and responsible for β-barrel type OM protein (OMP) assembly, has been validated as a novel target for antibiotics. Here, we identified potential BAM complex inhibitors using a screening approach that reports on cell envelope σE and Rcs stress in Escherichia coli. Screening a library consisting of 316 953 compounds yielded five compounds that induced σE and Rcs stress responses, while not inducing the intracellular heat-shock response. Two of the five compounds (compounds 2 and 14) showed the characteristics of known BAM complex inhibitors: synergy with OMP biogenesis mutants, decrease in the abundance of various OMPs, and loss of OM integrity. Importantly, compound 2 also inhibited BAM-dependent OMP folding in an in vitro refolding assay using purified BAM complex reconstituted in proteoliposomes.
Keywords: Escherichia coli, type 5 secretion, antibiotics, high-throughput screening, Rcs, sigmaE
Gram-negative bacteria are difficult to treat with antibiotics due to the presence of the protective outer membrane (OM), an asymmetric lipid bilayer composed of phospholipids in the inner leaflet and lipopolysaccharides (LPS) in the outer leaflet.1 Especially, due to the anionic phosphate groups of the LPS-core, hydrophobic molecules can only selectively cross the cell envelope. Even when antibiotics are able to cross the OM, they may be expelled by efflux pumps.2 Combined, these defense mechanisms are to a large part responsible for the current antimicrobial resistance problem.3
The intricate biogenesis of the asymmetric OM of Gram-negative bacteria can be seen as a target for novel antibiotics that kill bacteria or inhibit growth. Alternatively, compounds that permeabilize the OM could be used to allow the entry of large-scaffold antibiotics (molecular mass >600 Da) otherwise prevented from reaching their target. Importantly, the OM comprises (parts of) translocation systems that are critical for the secretion of virulence factors. Targeting generic or specific elements that contribute to the functional assembly of these systems will likely impact virulence and enhance eradication of the pathogen by the immune system.4
Gram-negative bacteria possess two essential, partly surface-exposed integral β-barrel OM proteins (OMPs) that play key roles in the biogenesis of the OM: LptD and BamA.5 LptD is part of a trans-envelope system for LPS biogenesis that also comprises the accessory lipoprotein LptE and mediates the final transport step of LPS subunits to the outer leaflet of the OM.6 BamA forms the core subunit of the β-barrel assembly machine (BAM), a complex that also includes four associated lipoproteins: BamB, BamC, BamD, and BamE, of which BamD is essential for growth.7 The BAM complex catalyzes the folding and insertion of β-barrel OMPs into the OM. Recently, several studies have identified BamA as a target for small molecule inhibitors.8−10 In addition, antibodies and peptides have been developed that target BamA or assembly of the BAM complex and show antibacterial effects.11−13 Together, these studies underline the potential of BamA as an accessible target for a new class of antibiotics. Of note, LptD inhibitors were also identified recently.14
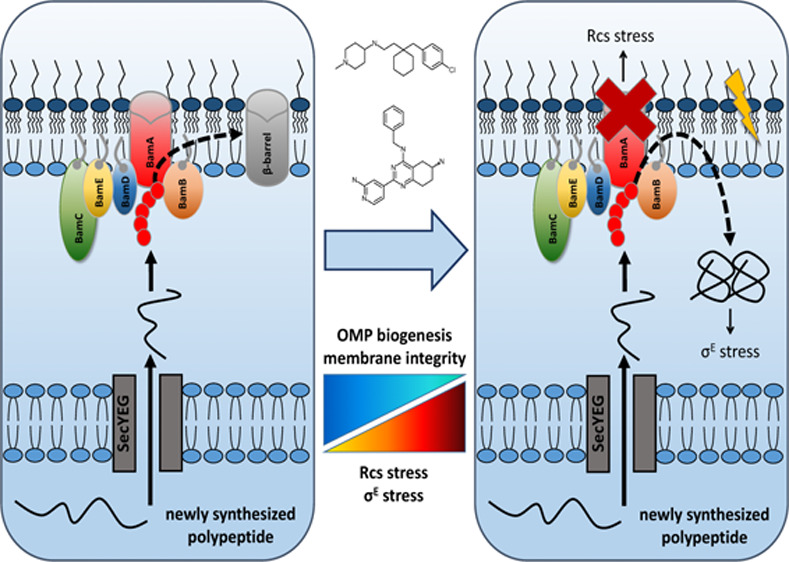
Malfunctioning of the BAM complex compromises the folding and membrane insertion of β-barrel type OMPs, which triggers activation of the σE cell envelope stress response.8,9,15,16 We recently developed a phenotypic fluorescence-based assay in Escherichia coli that reports on stimulation of the σE cell envelope stress response when BAM-dependent secretion of the autotransporter (AT) hemoglobin protease (Hbp) across the OM is impaired.16 Screening a small library of 1600 fragment-based compounds resulted in the identification of VUF15259, a compound that activates σE stress, impairs Hbp secretion and decreases the abundance of OMPs, consistent with impaired BAM function, suggesting this screening approach can be used for the selection of BAM complex inhibitors.16
The Rcs (regulation of capsular polysaccharide synthesis) system is a second cell envelope stress system that responds to impaired OMP biogenesis. The Rcs system also reacts to changes in the LPS charge distribution, perturbations of peptidoglycan biosynthesis, phospholipid biosynthesis, and defects in lipoprotein trafficking.17,18 The surface-exposed lipoprotein RcsF plays a key role in this response, by functioning as the stress sensor that is capable of activating a two-component phosphorelay system in the inner membrane. In normal conditions RcsF is transported to the OM where it is threaded through the β-barrels of the abundant porins OmpF and OmpC during BAM-mediated β-barrel folding.17,19,20 Under stress conditions, sequestration of RcsF at the OM is impaired, allowing RcsF to interact with IgaA at the cytoplasmic membrane to relieve its inhibitory effect on the Rcs system in the inner membrane, which eventually leads to transcriptional regulation of the Rcs regulon.18,21
Recently, the crystal structure of BamA in complex with RcsF was solved, providing insight into the mechanism of surface exposure of RcsF.22 Considering that this mechanism is BAM-dependent, any perturbation of the BAM complex is expected to induce Rcs stress. Consistently, the Rcs system is induced in a bamA knockdown strain19,23 or by addition of the BAM inhibitor darobactin.8 Recently, we reported on the development of a fluorescence-based reporter assay to monitor Rcs stress induction in E. coli cells similar to the σE stress assay described above.27
Considering that defective BAM functioning elicits both σE and Rcs stress, we reasoned that combining our reporter assays in a high-throughput screening (HTS) effort may result in selection of novel BAM complex inhibitors. Therefore, we adapted the σE and Rcs assays to a 384-well format and screened a library of 316 953 compounds. This approach yielded five compounds that elicited both σE and Rcs stress responses, but not the intracellular heat-shock stress response. More detailed analysis showed that two compounds, 2 and 14, impair the biogenesis of various OMPs, affect membrane integrity, and interfere with BAM complex functioning in an in vitro protein refolding assay, consistent with targeting of the BAM complex as mode of action.
Results
Screening Outline and HTS Assay Optimization
To screen for inhibitors of the BAM complex we used our recently reported fluorescence-based assay that reports on σE stress induced when secretion of the AT Hbp across the OM is inhibited.16 By placing the gene encoding the fluorescent reporter protein mNeonGreen (mNG)24 under control of the promoter of the rpoE gene, the key regulator of the σE cell envelope stress response, E. coli cells can be detected that are impaired in BAM-dependent Hbp secretion in a 96-well microtiter format.16 To screen larger compound libraries we adapted this reporter assay to a 384-well format and monitored its Z′ factor that defines the difference between the measured signal of the positive and negative controls and the data variation of that signal.25 A Z′ factor between 0.5 and 1.0 indicates that the HTS assay is robust and reproducible. To test this, E. coli cells harboring the Hbp expression plasmid pEH3-Hbp and the reporter PrpoE-mNG construct were grown in the 384-well plates and expression of Hbp was induced with IPTG. Compound VUF15259, an inhibitor of Hbp secretion that we recently identified, was used as positive control.16 By comparing the OD600 corrected fluorescent intensity of VUF15259 treated cells to DMSO treated cells, we reached a Z′ factor of 0.79 after 3 h of nonshaken incubation at 37 °C (Table 1), showing that the assay is sufficiently robust for HTS in 384-well plates.
Table 1. Signal to Background Ratios and Z′ Factors of the Reporter Assays.
| reporter | monitoring stress response | S/Ba | Z′ |
|---|---|---|---|
| PrpoE-mNG | SigmaE (σE) | 2.28 | 0.79 |
| PrprA-mNG | Rcs | 3.18 | 0.65 |
| PgroES-mNG | Heat-shock | 1.71 | 0.69 |
S/B represents the signal (S) to background (B) ratio where the OD600 corrected mNG fluorescent intensity of E. coli TOP10F′ cells treated with a positive control (signal) was compared to DMSO treated cells (negative control, background). For the reporters PrpoE-mNG and PrprA-mNG 100 μM and 200 μM VUF15259 was used as positive control, respectively. For the reporter PgroES-mNG expression of ssTorA-Hbp was used as positive control.
To further select for BAM complex inhibitors, hit compounds from the primary σE screen were screened in a secondary assay for their ability to induce Rcs and heat-shock stress. The cell envelope Rcs stress response is also activated by perturbations of the BAM complex, whereas the heat-shock response is activated by stressors that cause the accumulation of misfolded proteins in the cytosol.17,26 Hence, it is expected that potential BAM complex inhibitors will elicit Rcs stress but not heat-shock stress. Reporter assays to monitor Rcs and heat-shock stress using the reporter constructs PrprA-mNG27 and PgroES-mNG,16 respectively, have been developed following the same strategy as for PrpoE. To optimize the Rcs assay for HTS, E. coli cells harboring both pEH3-Hbp and the PrprA-mNG reporter construct were grown in 384-well plates. Compound VUF15259 was used as positive control for Rcs stress induction.27 To verify induction of PgroES-mNG an Hbp mutant was expressed from pEH3 in which the Hbp signal sequence (ss) has been replaced by that of TMAO-reductase (TorA). We have shown earlier that cytosolic aggregation of ssTorA-Hbp causes heat-shock stress that can be monitored using the PgroES-mNG reporter.16,28 By using a similar growth regime as for the PrpoE-mNG reporter assay we obtained Z′ factors of 0.65 and 0.69 for the PrprA-mNG and PgroES-mNG reporter assay, respectively (Table 1), indicating that they are also reliable for HTS in 384-well plates.
High-Throughput Compound Screen
Having established that the reporter assays are reliable for HTS in 384-well plates, compounds from the chemical libraries of HDC and CD3, containing 316 953 small molecules in total, were tested for their ability to induce the σE stress response in E. coli cells harboring both pEH3-Hbp and the PrpoE-mNG reporter construct. Cells were grown in regular culture flasks, induced for Hbp expression and transferred to a 384-well plate already containing compounds. After 3 h of nonshaken incubation the OD600 and mNG fluorescence signal were determined to monitor growth and stress, respectively. DMSO- and VUF15259-treated cells were used as negative and positive controls, respectively, resulting in an average signal to background ratio of 2.37 and an average Z′ factor of 0.81 considering all screening plates, confirming the robustness of the assay (Figure S1). Compounds that provoked ≥11% σE stress induction, corresponding to the mean of the negative control plus 4 standard deviations, were selected as hits with the positive control set at 100%, resulting in 413 primary hit compounds (Figure 1A and 1B).
Figure 1.

Summary of HTS. (A) In total 316 953 compounds were screened for σE stress induction using the PrpoE-mNG reporter construct in E. coli TOP10F′ cells expressing Hbp from pEH3. 413 compounds induced σE stress in the primary screen whereas secondary screening verified 33 singleton compounds as hit. Counter-screening showed that 5 hits also activated the Rcs stress response, but not the intracellular heat-shock response. Further analysis indicated that 2 hits most likely compromise the BAM complex. (B) Plot of σE stress induction of each hit compound in the primary screen compared to cells expressing Hbp incubated with 100 μM VUF15259 (positive control, set at 100%) and cells expressing Hbp incubated with 1% DMSO (negative control, set at 0%). Nonhit compounds are not displayed to improve readability.
After the primary screen each hit compound was checked for autofluorescence by measuring the fluorescence of the compound on its own in M9 growth medium, eliminating 139 compounds (Figure S2). The remaining compounds were then retested in dose–response using the PrpoE-mNG reporter and induction of Hbp production from pEH3-Hbp. Compounds were selected when ≥50% σE stress induction was reached up to the highest concentration tested, 60 μM. This selection regime resulted in the verification of 69 compounds as hits and 165 nonactive compounds. Furthermore, 40 marketed drugs and other bioactive molecules were identified as hit. The latter compounds are part of a small subset of the HTS compound library that serve as references. Although interesting in light of repurposing of existing drugs, they were not further analyzed in this study.
Orthogonal Assays Identify 5 Potential BAM Inhibitors
The 69 verified hit compounds were clustered based on their chemical structure, resulting in 33 compound classes with unique features, that were further tested in the orthogonal Rcs cell envelope and cytosolic heat-shock stress assays. E. coli cells containing either the PrprA-mNG or PgroES-mNG reporter construct, were grown in 384-well plates and used in a dose–response analysis of the hit compounds. After 3 h of nonshaken incubation the OD600 and mNG fluorescence were measured and used to establish the half maximal effective concentration (EC50) of each compound (Table 2). Adding 200 μM VUF15259 or expression of ssTorA-Hbp was used as positive controls for the Rcs and heat-shock response, respectively. Compounds were selected for further analysis only when the σE as well as the Rcs response, but not the heat-shock stress response were induced ≥50% in a dose response analysis up to 60 μM. This resulted in the selection of 5 compounds that appear to act specifically on the cell envelope, based on this specific stress-response profile. The selected compounds also affected growth of E. coli cells with a MIC ranging from 25 to 200 μM (Table 2). In addition, compounds 2, 3, and 7 showed cytotoxicity toward HEK293 cells with an LD50 of 20 μM, while compounds 8 and 14 only showed mild cytotoxicity with an LD50 of 60 μM. The effects on growth and toxicity were not used as selection criteria at this stage.
Table 2. Activation of Stress Responses, MIC, and LD50 of the Selected 33 Singleton Compounds.
| stress
reporter EC50 (μM)a |
toxicity (μM) |
||||
|---|---|---|---|---|---|
| compound | PrpoE-mNG | PrprA-mNG | PgroES-mNG | E. coli MICb | HEK293 LD50a |
| 1 | 1 | 38 | >60 | >200 | – |
| 2 | 6 | >60 | – | 50 | 20 |
| 3 | 7 | 16 | – | 25 | 20 |
| 4 | 10 | 5 | 7 | >200 | – |
| 5 | 14 | 45 | >60 | 6 | – |
| 6 | 20 | >60 | >60 | >200 | – |
| 7 | 25 | >60 | – | 200 | 20 |
| 8 | 33 | >60 | – | 100 | 60 |
| 9 | 35 | – | – | 100 | 60 |
| 10 | 46 | – | – | >200 | 20 |
| 11 | >60 | >60 | >60 | >200 | >60 |
| 12 | >60 | – | – | 200 | 60 |
| 13 | >60 | >60 | >60 | >200 | – |
| 14 | >60 | 12 | – | 100 | 60 |
| 15 | >60 | – | – | >200 | 60 |
| 16 | >60 | 42 | >60 | >200 | 60 |
| 17 | >60 | >60 | >60 | >200 | 20 |
| 18 | >60 | – | – | >200 | 60 |
| 19 | >60 | >60 | >60 | >200 | 60 |
| 20 | >60 | >60 | >60 | 50 | 60 |
| 21 | >60 | 20 | 8 | 50 | >60 |
| 22 | >60 | – | – | 50 | 60 |
| 23 | >60 | 40 | >60 | 200 | >60 |
| 24 | >60 | – | – | 100 | 60 |
| 25 | >60 | – | – | >200 | 20 |
| 26 | >60 | – | – | >200 | 60 |
| 27 | >60 | – | >60 | >200 | 60 |
| 28 | >60 | – | – | 100 | >60 |
| 29 | >60 | 2 | 1 | >200 | 60 |
| 30 | >60 | >60 | >60 | >200 | – |
| 31 | >60 | >60 | 58 | >200 | – |
| 32 | >60 | 6 | 7 | 12 | – |
| 33 | >60 | 4 | 8 | >200 | – |
EC50: half maximal effective concentration; LD50: median lethal dose. A dash indicates that the compound did not activate the indicated reporter assay in E. coli or displayed no toxicity toward HEK293 cells. Compounds were ranked based on the EC50 of PrpoE-mNG and compounds marked in bold were selected for further analysis. See the Supporting Information for the dose–response curves of each stress response per compound (Figure S3).
The minimal inhibitory concentration (MIC) was determined in E. coli TOP10F′ cells after 10 h of growth.
Compounds 2 and 14 Synergize with OMP Biogenesis Mutants
Next, we investigated the possibility that the 5 compounds act by targeting the BAM complex. Given the importance of the BAM complex for cell growth, it is expected that a decrease in cellular concentration of the BAM complex makes cells hypersensitive to BAM-complex inhibitors. Following this reasoning, we determined whether lowering the level of BamA affects the MIC of the compounds. For this we used the E. colibamA101 knockdown strain that has a ∼90%-reduced BamA level compared to wild-type cells, which is sufficient to support growth in vitro, despite the levels of OMP biogenesis being affected.29 The BamA knockdown cells were exposed to a 2-fold increasing concentration of the 5 selected compounds and the effect on growth was determined after 10 h of incubation. As shown in Figure 2A compounds 2 and 14 showed an enhanced antimicrobial effect in the bamA101 mutant, while the MIC for the other compounds did not change.
Figure 2.
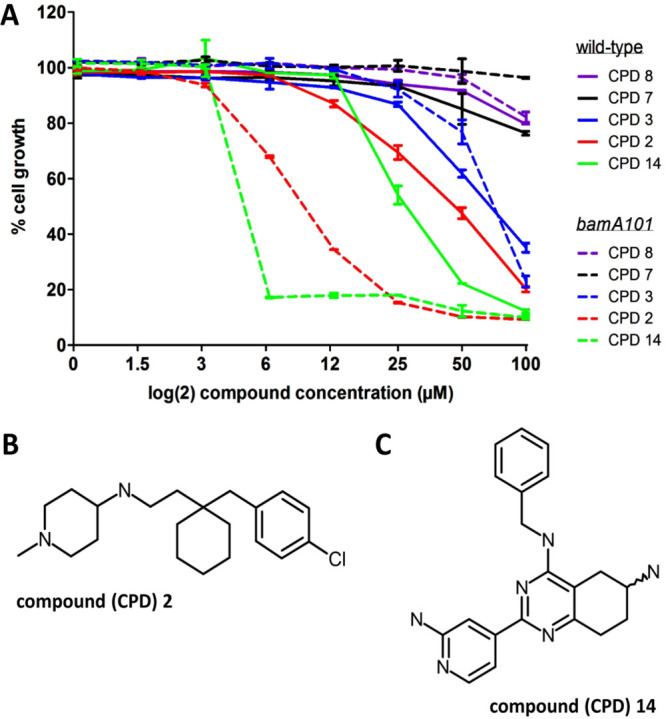
E. colibamA101 cells are more sensitive to compounds 2 and 14. (A) E. coli MC4100 wild-type (solid line) and E. coli MC4100 bamA101 (dashed line) cells were grown in MHB-II in a 96-well plate and exposed to a 2-fold increasing concentration of the indicated compounds (CPD). After 10 h of incubation the OD600 was measured and plotted as percentage cell growth compared to DMSO treated cells (set at 100%). Data are shown as the average of duplicate samples ± SD. Data are representative of 3 independent experiments. (B) Structural formula of compound 2 and (C) 14.
These data suggest that compound 2 (Figure 2B) and 14 (Figure 2C) may interfere with BamA-related processes and affect folding and insertion of OMPs. Consequently, other mutant strains compromised in OMP biogenesis might also be particularly sensitive to these compounds. To test this, the effect of compounds 2 and 14 on the growth of strains in which either surA, bamB, or degP has been inactivated was examined. BamB is an accessory lipoprotein in the BAM complex, SurA is a periplasmic chaperone that targets nascent OMPs to the BAM complex and DegP is a periplasmic chaperone and protease that plays an important role in the quality control of proteins that reside in or travel through the periplasm.30 Though not essential for in vitro growth, inactivation of surA, bamB, or degP affected OMP biogenesis while the combination of mutations with each other or other BAM mutations often resulted in synthetic lethality.31,32 As shown in Figure 3, a substantial decrease in MIC was observed for both compounds in the surA, bamB, and degP knockout strains. To rule out that the decrease in MIC in the mutant strains is a secondary effect of increased membrane permeability in these strains, we tried to raise the permeability of the E. coli OM by expressing an open channel variant of the OMP FhuA.33 Native FhuA is a siderophore transporter that forms a 22-stranded β-barrel, which is plugged by the N-terminal domain. Krishnamoorthy and co-workers34 showed that deletion of the plug domain and four large external loops creates a large pore that is permeable to compounds up to approximately 2 kDa. As shown in Figure S4, constitutive expression of this engineered FhuA ΔC/Δ4L in E. coli MC4100 did not affect the MIC of compounds 2 and 14 (S4A), whereas the permeability for the large antibiotic vancomycin (1.4 kDa) was clearly increased (S4B). Combined, the data are consistent with the suggestion that BAM-mediated OMP biogenesis is specifically affected by these compounds.
Figure 3.

Compounds 2 and 14 synergize with OMP biogenesis mutants. E. coli MC4100 wild-type and E. coli MC4100 ΔdegP, ΔbamB, and ΔsurA cells were grown in LB in a 96-well plate and exposed to a 2-fold increasing concentration of (A,B) compound 14 or (C,D) compound 2. Growth was observed for 10 h and the OD600 was measured and plotted as percentage cell growth compared to DMSO treated cells (set at 100%). Data are shown as the average of duplicate samples ± SD. Data are representative of 2 independent experiments.
Compounds 2 and 14 Inhibit OMP Biogenesis
To analyze the potential effect of compounds 2 and 14 on OMP biogenesis in more detail, we examined the levels of OMPs after exposing E. coli cells to 0.25× MIC of the compound. This concentration induces cell envelope stress but is most likely low enough to prevent secondary effects, for example on protein synthesis. Cells were grown in the presence of compounds, lysed, and cell envelopes were collected for analysis by SDS-PAGE and Western blotting. As shown in Figure 4A, levels of the major β-barrel OMPs OmpF, OmpC, and OmpA dropped considerably after treatment with either compound compared to DMSO treated cells. In addition, the level of BamA, itself a β-barrel type OMP, was severely reduced whereas levels of the BamA-associated lipoprotein BamB as well as the unrelated lipoprotein LpoB were largely unaffected (Figure 4A).
Figure 4.

Compounds 2 and 14 inhibit OM targeting or insertion of β-barrel type OMPs. E. coli TOP10F′ cells were grown in LB in a regular culture flask for 3 h and exposed to a single concentration of compound 2 (12 μM) and compound 14 (25 μM), representing 0.25× MIC. Bacteria were then separated from medium by centrifugation. Cell envelopes were isolated using ultracentrifugation and analyzed by (A) Western blotting analysis using antibodies against BamA, BamB, PhoE (OmpF/C), LepB, and LpoB. Data are representative of 3 independent experiments. (B) TOP10F′ cells, expressing PhoE from pEH3, were grown in LB in a 96-well plate and treated with the indicated compounds for 3 h at 0.25× and 0.5× MIC. Cell envelopes were isolated and analyzed by a seminative PAGE and Western blotting using antibodies against PhoE (OmpF/C). To examine heat modifiability, samples were either incubated at room temperate (RT) or at 95 °C for 10 min. The lipoprotein LepB was used as loading control. Data are representative of 2 independent experiments. Quantification of the band intensities is displayed in Figure S8.
The effect of compounds 2 and 14 on OmpF/C could also be explained by the fact that σE stress downregulates OMP synthesis.35 However, we showed previously that directly activating σE stress in the absence of compound only results in a minor reduction in OmpF/C levels based on Western blot analysis.16 To address this issue in more detail we studied the effect of compounds 2 and 14 on de novo synthesized OMPs by inducing expression of the β-barrel OMP PhoE from a promoter that is not subject to regulation by stress. After addition of compound to the culture medium we analyzed PhoE membrane insertion and folding, which are known to be BAM-dependent.36 To examine the expression and conformation of PhoE in the membrane fraction its heat-modifiability was monitored using seminative SDS-PAGE.37,38 Native PhoE forms a trimer in the OM that migrates much slower than its heat denatured unfolded form in multiple bands that may include intermediates of folding and oligomerization.39 As shown in Figure 4B both compounds 2 and 14 reduced total levels of PhoE in a dose-dependent manner at 0.25× MIC and 0.5× MIC. Produced in presence or absence of compound, PhoE remained heat-modifiable, suggesting that the compounds may interfere with OM membrane targeting and insertion of PhoE and other β-barrel-type OMPs rather than being absolutely required for folding and assembly.
Compounds 2 and 14 Impair Hbp Secretion
We next wanted to verify that the σE stress induced by compounds 2 and 14 in the primary screen correlates with impaired secretion of the AT Hbp. Similar to OMPs Hbp uses the BAM complex to insert its C-terminal β-barrel domain into the OM, which is required for secretion and subsequent autoproteolytic cleavage of the adjacent passenger domain40 (Figure 5A). Impaired Hbp secretion results in accumulation of the so-called Hbp pro-form in the periplasm, which is subject to degradation by the periplasmic protease DegP.16,41 Hence, this Hbp intermediate that still contains its C-terminal β-barrel domain can only be detected in cells in which DegP is proteolytically inactive.16,41 We therefore examined the effect of compounds 2 and 14 on de novo biogenesis of Hbp in E. coli MC1601 degP::S210A that expresses mutant DegP that is proteolytically inactive. As shown in Figure 5B, in the absence of compound Hbp was normally processed, indicated by the presence of cell associated mature length Hbp passenger domain (110 kDa) and the cleaved Hbp β-barrel domain (28 kDa). In contrast, incubation with compound 2 or 14 at 0.25× MIC led to an accumulation of pro-Hbp with a corresponding decrease in the level of Hbp β-barrel domain, similar to the effect of the known Hbp secretion inhibitor VUF15259.16 Consistently, the amount of secreted Hbp passenger in the spent medium was decreased upon incubation with compounds 2 and 14 as well as VUF15259, further confirming that Hbp secretion is inhibited (Figure 5C). Of note, compounds 2 and 14 treated cells show a different effect on processing of the Hbp pro-form compared to cells treated with the Hbp secretion inhibitor VUF15259 (Figure 5B) arguing that they may act at different stages in the intricate BAM-dependent Hbp translocation process. Finally, the induction of σE stress on which the screening procedure was based was corroborated by an upregulation of the σE stress-regulated DegP (Figure 5B). In conclusion, the secretion of Hbp is reduced by compounds 2 and 14 probably through impaired OM assembly of its C-terminal β-barrel domain.
Figure 5.
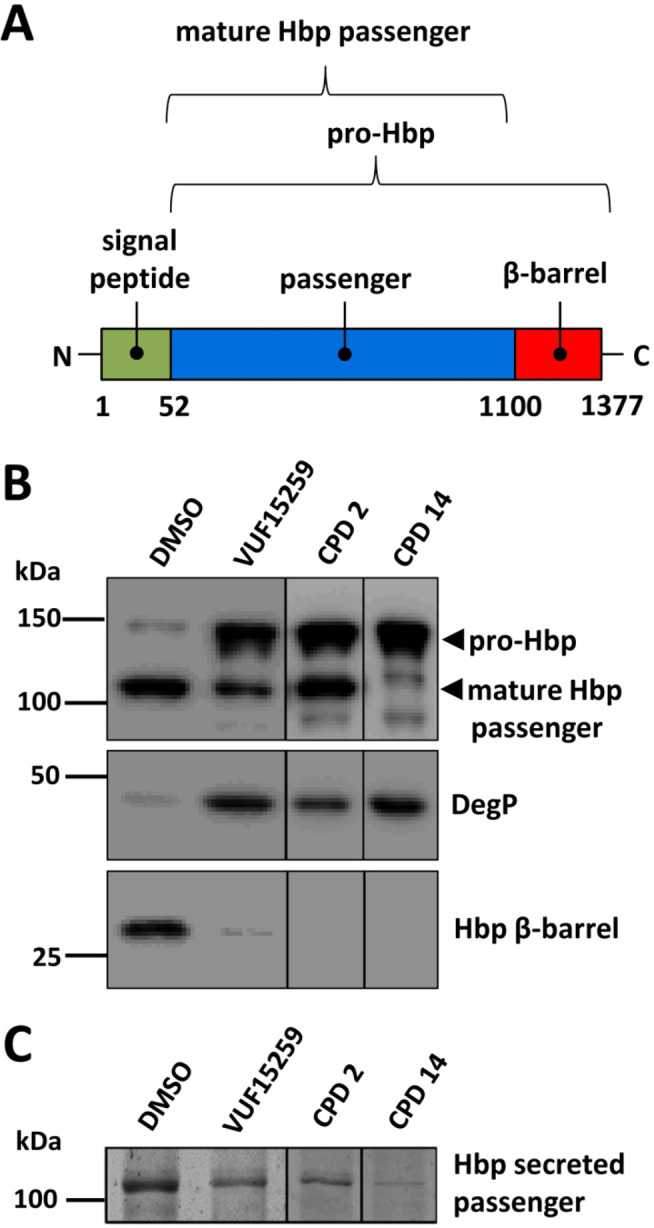
Hbp secretion is impaired by compounds 2 and 14. (A) Schematic overview of the domain organization of the autotransporter Hbp, including the amino acid boundaries of the domains. (B) E. coli TOP10F′ cells were grown in M9 in a 96-well plate and Hbp was expressed from pEH3 with IPTG. The cells were exposed to compound 2 (12 μM) and compound 14 (25 μM), representing 0.25× MIC. After 3 h incubation bacteria in the wells of the 96-well plate were collected and separated from medium by centrifugation. Whole cell lysates were analyzed by SDS-PAGE and Western blotting using antibodies against the Hbp passenger domain, Hbp β-barrel domain and DegP. (C) The spent medium was TCA precipitated and analyzed by SDS-PAGE and Western blotting using antibodies against the Hbp passenger domain. Data are representative of 3 independent experiments.
Compounds 2 and 14 Inhibit BAM Activity
To investigate more directly whether compounds 2 and 14 target the BAM complex we used an in vitro OMP insertion assay.42 Purified BAM complex was reconstituted in liposomes made from E. coli lipids by using a detergent dilution strategy.42,43 It has been shown that these proteoliposomes can insert and fold different β-barrel type OMPs that are added in purified, denatured form.43 The ability to fold the protease OmpT into the proteoliposomes was used to quantify the OmpT-folding activity of the BAM complex and thus indirectly the state of the BAM complex. OmpT folding can be monitored in real time by cleavage of an internally quenched fluorogenic peptide reporter that produces a fluorescent product upon cleavage by OmpT42 (Figure 6A). The solubility of unfolded OmpT was ensured by adding SurA, a periplasmic chaperone needed for delivery of OmpT to the BAM complex.43,44
Figure 6.
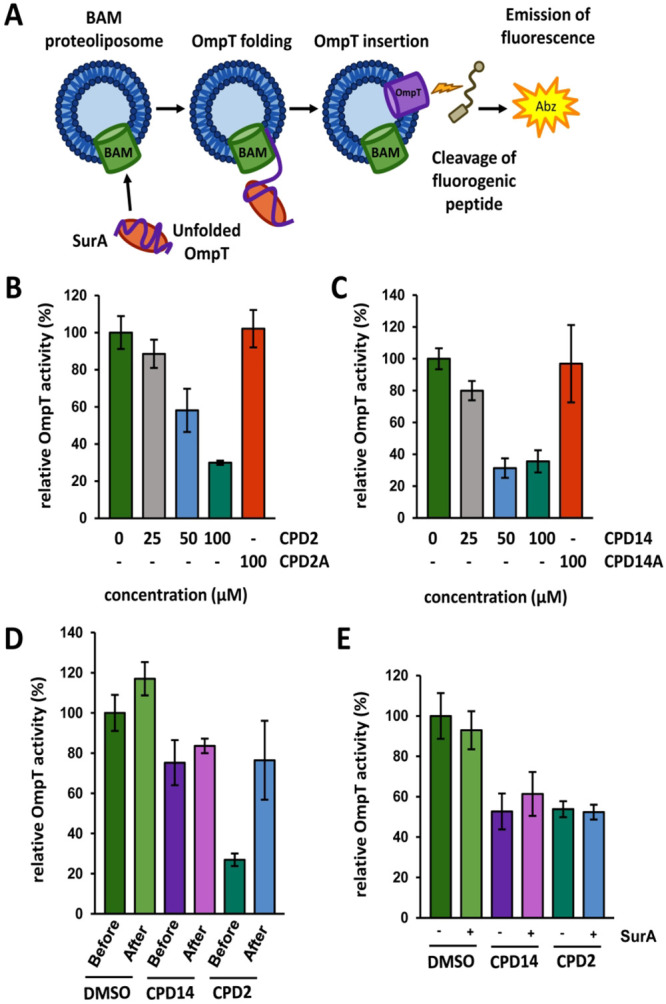
OmpT assembly is inhibited by compound 2. (A) Schematic of the activity assay with native BAM complex inserted into liposomes. Guanidine HCl-denatured OmpT protease, kept in a folding-competent state by purified SurA, was added to the BAM complex-containing proteoliposomes. OmpT was activated by its BAM complex-mediated insertion into the liposomes, enabling it to cleave an internally quenched peptide to release a fluorescent product. BAM-dependent OmpT activity was measured in the presence of different concentrations of compound 2 (B) or compound 14 (C) relative to a control sample without compound but the solvent DMSO. (D) OmpT protease activity was also measured when 100 μM compounds were added “before” OmpT folding occurred or “after” OmpT folding was completed. (E) OmpT protease activity was measured when 100 μM compounds were added in the presence of a 1:7 (−) or a 1:42 (+) OmpT:SurA molar ratio. The activity of OmpT (measured as the slope of the curves over linear increase in fluorescence, Figure S6A–F) is plotted against compound concentration. The values are mean ± standard deviation of 3 independent experiments.
To test the effect of compounds 2 and 14 on OmpT protease activity, BAM proteoliposomes were first incubated with an increasing concentration of compounds, up to 100 μM, before denatured OmpT and SurA were added to the reaction. As shown in Figure 6B and 6C, compounds 2 and 14 inhibited OmpT protease activity in a dose-dependent manner with an EC50 of 58.3 μM and 39.7 μM, respectively. As a control, the in vitro OMP insertion assay was performed with two structurally related compounds, 2A and 14A (Figure S5A and S5B), that showed no induction of σE cell envelope stress (Figure S5C). These compounds were part of the screening library, but classified as nonhit molecules. Consistently, the inactive derivatives 2A and 14A (Figure S5A and S5B) only had negligible effects on OmpT folding at the highest concentration, 100 μM, compared to the DMSO treated control.
To examine the possibility that the compounds inhibit OmpT protease directly, we assayed the effect of compounds 2 and 14 in an alternative assay setup, in which the compounds were added to the reaction either together with unfolded OmpT and SurA (as before) or 2 h after the folding reaction was started (i.e., when OmpT folding was completed). After adding the fluorogenic peptide, we observed that both compounds seem to display an inhibiting effect on OmpT protease activity, as the activity rates measured for samples that received compound 2 or 14 after OmpT was already folded show a lower activity than the samples that received only DMSO after OmpT was folded. In particular compound 14 might be more active on OmpT itself than on its folding (Figure 6D), although the in vivo data indicates an effect on OMP assembly. In contrast, the observed inhibition by compound 2 seems to be the result mostly of inhibition of BAM-mediated OmpT folding, consistent with the in vivo data.
Finally, to test whether the compounds affect the chaperone activity of SurA we hypothesized that adding a large excess of SurA would relieve the inhibiting effect of a compound. As shown in Figure 6E, adding a 6-fold excess of SurA did not influence the inhibiting effect of compounds 2 and 14, indicating that SurA is not the target of these compounds, consistent with the data presented in Figure 3.
Compounds 2 and 14 Affect Integrity of the OM
Given the effect of compounds 2 and 14 on OMP biogenesis, we considered the impact on OM integrity. To study this, we tested the ability of compounds 2 and 14 to potentiate the activity of vancomycin, a relatively large antibiotic (1449 Da) that acts on peptidoglycan synthesis34 but is not active against Gram-negative bacteria because it cannot pass the OM. E. coli cells were grown in the presence or absence of compound 2 or 14 at 0.25× MIC and a 2-fold dilution range of vancomycin to determine its MIC under these conditions. As shown in Figure 7, the MIC of vancomycin decreased 8- and 4-fold in the presence of compound 2 or 14, respectively. In contrast, the MICs of the smaller antibiotics ampicillin and chloramphenicol that target peptidoglycan and protein synthesis, respectively, were largely unaffected. Together, the data indicate that compounds 2 and 14 affect the barrier function of the OM.
Figure 7.
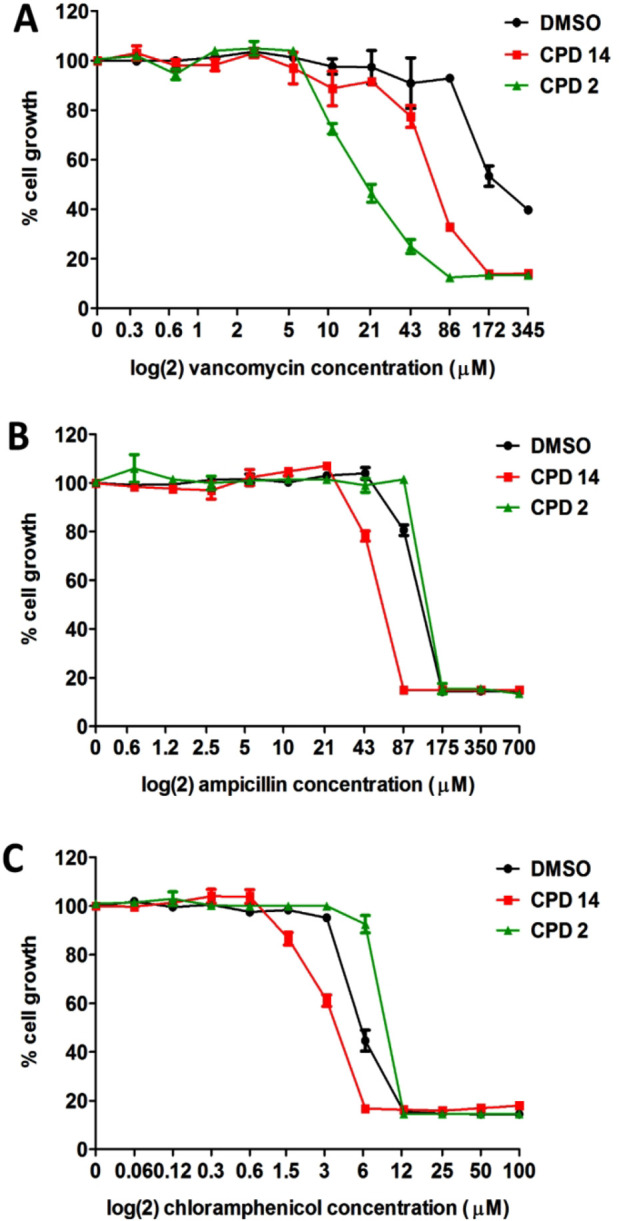
Compounds 2 and 14 affect the integrity of the OM. The effect on growth of (A) vancomycin (VANCO), (B) ampicillin (AMP), and (C) chloramphenicol (CM) on E. coli MC4100 cells was determined after 10 h of growth in LB supplemented with varying concentrations of antibiotic in a 96-well plate in presence or absence of a fixed concentration of compound 2 (12 μM) or compound 14 (25 μM), representing 0.25× MIC. The OD600 was measured and plotted as percentage cell growth compared to DMSO treated cells (set at 100%). Data are shown as the average of duplicate samples ± SD. Data are representative of 2 independent experiments.
Compounds 2 and 14 Affect Growth of ESKAPE Pathogens
Compounds 2 and 14 inhibit growth of the cloning and expression E. coli K-12 strain used. To examine the effect on pathogenic E. coli and other species, the MIC of compounds 2 and 14 was determined for a uropathogenic E. coli strain and 6 pathogens that belong to the ESKAPE group (Enterococcus faecium, Staphylococcus aureus, Klebsiella pneumoniae, Acinetobacter baumannii, Pseudomonas aeruginosa, and Enterobacter spp), responsible for the majority of nosocomial infections worldwide.3 As shown in Table 3, compound 2 inhibited growth of all strains albeit with a MIC of ≥100 μM, while compound 14 only inhibited growth of P. aeruginosa and A. baumannii with a MIC of 200 and 100 μM, respectively. Interestingly, compound 2 also impaired growth of the Gram-positive strains E. faecium and S. aureus. The absence of an OM in these species suggests that this compound may also affect the integrity of the cytoplasmic membrane or enter the cells and inhibit essential cytosolic processes. Consistently the MIC of compound 2 for Bacillus subtilis, a Gram-positive soil bacterium, was determined at 100 μM, while compound 14 did not affect cell growth up to the highest concentration tested, 200 μM.
Table 3. MIC (μM) of Compounds 2 and 14 against the Indicated Bacterial Strains.
| strain | CPD2a | CPD14a |
|---|---|---|
| ESKAPE group | ||
| Enterococcus faecium VRE | 200 | >200 |
| Staphylococcus aureus MRSA | 200 | >200 |
| Klebsiella pneumoniae | 200 | >200 |
| Acinetobacter baumannii | 100 | 100 |
| Pseudomonas aeruginosa | 200 | 200 |
| Enterobacter cloacae | 200 | >200 |
| Others | ||
| Bacillus subtilis 168 | 100 | >200 |
| Escherichia coli (uropathogenic) | 100 | >200 |
| Escherichia coli (K12) | 50 | 100 |
Inhibitory curves can be found in the Supporting Information (Figure S7).
Discussion
In this work we used a robust phenotypic HTS that combines reporters of the cell envelope σE and Rcs responses in primary and secondary assays to identify inhibitors of the BAM complex. The primary σE assay was sensitized by expression of the secreted AT Hbp that is known to readily induce the σE response when accumulating in the periplasm due to a dysfunctional BAM complex.16 Screening a library of 316 953 compounds resulted in the identification of 69 compounds that induced σE stress and detailed follow-up analysis indicated that only two compounds, 2 and 14, showed the characteristics of a BAM complex inhibitor.8,9 They were selected and confirmed to induce σE stress and Rcs stress, but not general cytoplasmic heat-shock stress. In addition to impairing Hbp secretion, the compounds were shown to reduce de novo biogenesis and steady state levels of β-barrel type OMPs, but not of OM lipoproteins. Furthermore, both compounds affected OM integrity, while strains with mutations in the biogenesis pathway of β-barrel OMPs showed increased sensitivity toward them. Finally, compounds 2 and 14 inhibited OmpT protease activity in an in vitro refolding assay using BAM complex containing proteoliposomes.
The BAM complex is increasingly recognized as a novel target for antimicrobials because it is essential for growth and for the secretion of many virulence factors.32,45 Importantly, it is directly accessible being located in the OM. The critical BamA insertase subunit is a β-barrel OMP with loops that are exposed at the surface within reach of large molecules that are unable to pass the OM. Recently, a few BAM inhibitors have been identified. First, in a strategy to find inhibitors of essential processes that occur on the cell surface the synthetic compound MRL-494 was reported by Hart and co-workers to target BamA from the outside, inhibit β-barrel OMP biogenesis and have moderate efficacy against Gram-negative pathogens in vitro.9 MRL-494 also permeabilized the cytoplasmic membrane of Gram-positive bacteria indicative of a second mechanism of action. Interestingly, for compound 2, but not for compound 14, we also observed antibacterial activity toward Gram-positive bacteria suggesting alternative target(s). Alternatively, the antibacterial activity against Gram-positives might reflect a general effect on the integrity of lipid bilayers, which would be consistent with the observed toxicity toward HEK239 cells. Second, Imal and co-workers reported on darobactin, a modified heptapeptid secreted by a nematode symbiont that also binds BamA at the cell surface.8 A single dose of darobactin protected mice challenged with various Gram-negative pathogens suggesting that darobactin is a promising broad-spectrum lead compound for antibiotic development. Interestingly, virulence of E. coli was strongly compromised by bamA mutations that were selected to confer resistance to darobactin in vitro.8 Possibly, mutations that lead to even partial loss-of-function of BAM are not tolerated in vivo, resulting in a low selection pressure for resistance.
The most direct evidence that compound 2 also targets the BAM complex is its inhibitory effect in a reconstituted refolding assay. In this assay purified BAM complex is integrated into liposomes and tested for its ability to catalyze folding of denatured OmpT in the presence of purified SurA chaperone. Although compound 14 shows the characteristics of a BAM inhibitor in vivo—impaired Hbp secretion, OMP biogenesis and OM integrity—the compound seems to primarily affect the OmpT protease directly in the in vitro refolding assay. However, it is important to note that in our experimental setup the inhibitory effect of compound 14 was overall smaller (Figure 6D) than in the validated published method42 (Figure 6C). Here, compounds are preincubated with the BAM complex, then SurA-OmpT is added, and the reaction is monitored immediately, while in our setup the compounds were exposed to the reaction for 2 h, which may affect the stability of the compound. Therefore, it cannot be excluded that the effect of compound 14 in this assay is due to the inhibition of OmpT, although the in vivo data indicate an effect on OMP assembly.
Of note, to catalyze insertion and folding of OmpT the BAM complex must be in inverted orientation in the proteoliposomes as compared to intact bacteria. Possibly, the compounds act at the originally periplasmic side of the BAM complex or its connection with SurA. Alternatively, the compounds cross the lipid bilayer to attack the originally surface exposed part of BamA, which is known to be targeted by MRL-4949 and darobactin.8 This could be feasible for the compounds we identified based on their modest size (compound 2:348.96 Da; compound 14:346.19 Da) and calculated partitioning coefficient LogP (compound 2:4.77; compound 14:3.17). Future studies will address the exact location and impact of compound binding.
Interestingly, under laboratory growth conditions E. coli can survive at a very low level of endogenous BAM complex. For instance, the bamA101 mutation reduces BAM complex abundance by 90% and still supports growth under laboratory conditions.29 This may also explain why our screening procedure identified relatively few hit compounds considering the large compound library size. Though not tested, we expect a higher impact of a reduced amount of functional BAM complex on growth and virulence of a pathogenic E. coli strain in the host organism, given the importance of β-barrel OMPs and secreted proteins that require BAM for optimal biogenesis and functioning. Consistent with a lower tolerance for changes in BAM in vivo is the observation that E. coli virulence is strongly compromised by bamA mutations that confer resistance to darobactin in vitro.8 In this respect, it may be useful to sensitize future in vitro screening efforts by using strains with a partially compromised BAM complex.
The low hit rate also signifies that the BAM complex is intrinsically poorly druggable by small molecules. Consistently, the earlier reported BAM complex inhibitors MRL-494 (622 Da) and darobactin (965 Da) are relatively large molecules. Considering this, it would be interesting to screen a natural compound library using the Rcs stress HTS. Also, a strategy to use chimeric antibiotics consisting of BAM and LPS targeting parts may be considered to increase bactericidal activity, as recently described by Luther and co-workers.10
To our knowledge, this is the first report on phenotypic HTS of small compounds based on cell envelope stress. Interestingly, both compounds 2 and 14 showed a stronger induction of Rcs stress (secondary screen) than σE stress (primary screen). Moreover, Rcs stress not only reports on defects in BAM function but also on compromised peptidoglycan synthesis, lipoprotein trafficking, phospholipid synthesis and LPS integrity,18 while σE stress mainly responds to the accumulation of unassembled OMPs in the periplasm.15 Hence, using Rcs stress as primary screen is likely to probe a broader scope of cell envelope targets.
Conclusions
Two compounds that directly or indirectly affect BAM complex function are identified based on their ability to activate σE and Rcs cell envelope stress systems. Future studies will focus on the inhibitory mechanism and the identification of more potent and less toxic derivatives. In addition, the pharmacokinetics and therapeutic capacity of the (derivative) compounds should be tested in animal models. Finally, the use of BAM inhibitors as potentiating compounds to increase uptake of large scaffold antibiotics deserves attention. Compounds 2 and 14 increased susceptibility to vancomycin, a 1449 Da antibiotic, by 8- and 4-fold, respectively. Similar findings were reported for MRL-4949 and darobactin.8 Potentiating existing antibiotics is currently considered as one of the strategies to break antibiotic resistance,46 and BAM complex inhibitors may play an important role in this.
Methods
Strains, Plasmids, and Media
The bacterial strains and plasmids that were used in this study are listed in Table S1 and S2, respectively. E. coli bacteria were grown in M9 minimal medium supplemented with 0.2% glucose and 0.2% casamino acids (Difco), in Luria Broth (LB) or in Mueller–Hinton broth cation adjusted II (MHB-II, Merck). For selective growth and transformations chloramphenicol (30 μg/mL), kanamycin (50 μg/mL), and streptomycin (50 μg/mL) were added to the medium, where appropriate.
Materials, Sera, and Compounds
Black clear bottom 384-well plates, white TC 384-well plates and μClear Chimney 96-well black clear-bottom plates TC sterile were from Greiner Bio-One. Microtiter MicroAmp Optical Adhesive films were bought from Applied Biosystems. All other materials were purchased from Sigma-Aldrich.
Antisera against BamA and PhoE (cross-reactive to OmpC and OmpF) were kind gifts from J. Tommassen (Utrecht University, The Netherlands), against BamB from D. Kahne (Harvard University, USA), and against DegP from J. Beckwith (Harvard Medical School, USA. Antisera against LepB and LpoB were from our own collections. HRP-conjugated affinity purified antirabbit IgG from Rockland was used as secondary antibody.
Synthesis of compound 14 (MW: 346.19 g/mol, 2-(2-aminopyridin-4-yl)-N4-benzyl-5,6,7,8-tetrahydroquinazoline-4,6-diamine) is described in the Supporting Information. Compound 2 (MW: 348.96 g/mol, N-(2-(1-(4-chlorobenzyl)cyclohexyl)ethyl)-1-methylpiperidin-4-amine) was obtained from Vitas M-lab (catalog number: STK661348).
High-Throughput Screening
Two chemical libraries (316 953 small-molecules in total) derived from Hit Discovery Constance (HDC, Konstanz, Germany) and the Centre for Drug Discovery and Design (CD3, KU Leuven, Belgium) containing 237 384 and 79 569 compound respectively were screened in collaboration with CD3. The molecules were selected based on different parameters (e.g., Lipinski’s rule of five, solubility, toxicophores, frequent hitters, unstable fraction).47 In addition, a small subset of marketed drugs and other bioactive compounds was included. All compounds were dissolved in 100% DMSO to a concentration of 1.66 mM and 180 nL was dispensed in the wells of columns 3–22 of a black clear bottom 384-well plates using the Echo 550 liquid handling robot system (Labcyte). The positive control compound, VUF15259, was dissolved in 100% DMSO to a concentration of 20 mM and 150 nL was dispensed in the wells of columns 1 and 2 of the 384-well plate, creating 32 positive controls per plate. In addition, 32 negative controls were included by dispensing 150 nL of a 100% DMSO solution in the wells of columns 23 and 24. The assay ready plates were stored vacuumed at 4 °C until use.
On the day of the screen E. coli TOP10F′ cells, harboring pEH3-Hbp and pUA66-PrpoE-mNG, were grown in prewarmed M9 at 37 °C to an optical density (OD) at 600 nm of 0.3 in a 250 mL regular culture flask. Then, the culture was diluted to an OD600 of 0.05 in prewarmed M9 and Hbp expression was induced with 40 μM isopropyl β-d-1-thiogalactopyranoside (IPTG) as final concentration. The culture was then incubated at 37 °C, stirred with a cylindrical PTFE stir bar (Thermo Scientific), on the custom-made Robocon 2 robotic system, while 30 μL culture aliquots were dispensed into the wells of the assay ready plates using the Multidrop (Thermo Scientific), followed by 2 min shaking. After sealing the plate was incubated nonshaken for 3 h at 37 °C with 90% humidity. The OD600 and mNG top-fluorescence (excitation 488 nm and emission 535 nm) were measured with the Envision plate reader (PerkinElmer).
Screening data were analyzed using R (freeware). The ability of the compounds to activate σE stress was analyzed on a plate-to-plate basis by comparing the OD600 corrected fluorescence value per compound well with the plate-averaged control wells using the relationship
| 1 |
where σEcompound is the well-specific OD600 corrected fluorescence value, and μneg and μpos are the plate-averaged OD600 corrected fluorescence values of the negative and positive controls, respectively. To determine the quality of the HTS assay, the Z′ factor for each assay plate was determined using the formula
| 2 |
where σneg and σpos are defined as the calculated standard deviations of the OD600 corrected fluorescence values of the negative and positive controls within a plate, and μneg and μpos are the plate-averaged OD600 corrected fluorescence values of the negative and positive control, respectively.
Autofluorescence
To test autofluorescence compounds were serially diluted 1:3 in 100% DMSO in a polypropylene 96-well V-shaped bottom plate by manual pipetting starting from 10 mM as highest concentration. The diluted compounds were transferred into an Echo compatible plate and dispensed in duplo with the Echo 550 liquid handling robot system into the wells of a black 384-well plate, as described above. Next, 30 μL sterile M9 was added per well followed by shaken incubation for 2 min at room temperature (RT), creating a 1:3 dose–response of each compound from 60 to 0.03 μM. After 10 min nonshaken incubation at RT the NG fluorescence in each well of the plates was measured on the Envision plate reader as described above. The obtained fluorescence values were not normalized.
Rcs and GroES Orthogonal Assays
To examine the Rcs stress response and cytoplasmic heat-shock response we used E. coli TOP10F′ cells harboring the PrprA-mNG and PgroES-mNG reporter constructs on pUA66, respectively. The procedure was the same as described for the PrpoE-mNG reporter assay using cells that did not contain the pEH3-Hbp expression vector, with the following changes. Selected compounds were tested in a 1:3 dose response, as described for testing autofluorescence. For the Rcs assay, 300 nL of a 20 mM VUF15259 stock solution was dispensed in the wells of columns 1 and 2 and 300 nL of a 100% DMSO solution was dispensed in the wells of columns 23–24 of the assay plate in order to create positive and negative controls, respectively. Aliquots of 30 μL M9 culture containing E. coli TOP10F′ with pUA66-PrprA-mNG at an OD600 of 0.05 were added to all the wells of the assay plate. For the heat-shock assay 180 nL of a 100% DMSO solution was dispensed into the wells of columns 1, 2, 23, and 24. As a positive control aliquots of 30 μL M9 culture containing E. coli TOP10F′ with pEH3-ssTorA-Hbp and pUA66-PgroES-mNG at an OD600 of 0.05 was seeded into wells of columns 1 and 2, and protein expression was induced with 40 μM IPTG as final concentration. In the other wells aliquots of 30 μL culture containing E. coli TOP10F′ with pEH3-empty and pUA66-PgroES-mNG at an OD600 of 0.05 was added.
Susceptibility to Compounds or Antibiotics
Cell growth was measured in a black μClear Chimney 96-well plate (clear-bottom plates TC sterile) as follows. Bacteria were grown either in LB or MHB-II, as indicated, to mid log phase in regular culture flasks at 37 °C. The culture was then diluted to an OD600 of 0.001 and 50 μL culture aliquots were transferred to the wells of a 96-well plate already containing 50 μL medium with 2-fold increasing concentrations of compound, antibiotics or DMSO (0.5% DMSO as final concentration). After sealing the plate, growth was continued at 37 °C in the Synergy H1 plate reader (Biotek) with 3 mm continuous linear shaking. The OD600 was measured every 15 min for 10 h. The OD600 read-out after 10 h was used to determine the minimal inhibitory concentration (MIC), which is the minimum concentration where no growth of strains could be detected by optical density measurements.
Hbp Secretion Analysis
E. coli MC1061 degP::S210A cells were grown in M9 to mid log phase in regular culture flasks and diluted to an OD600 of 0.1. Aliquots of 50 μL culture were then transferred to the wells of a black μClear Chimney 96-well plate (clear-bottom plates TC sterile) already containing 50 μL of M9 with compound or DMSO (0.5% DMSO as final concentration). Expression of Hbp was induced from the pEH3 vector using 40 μM IPTG as final concentration. Growth was continued in the Synergy H1 plate reader (Biotek) at 37 °C with 3 mm continuous linear shaking for 2.5 h. Subsequently, cells were collected by centrifugation at 5000g for 5 min and the supernatant was TCA (trichloroacetic acid) precipitated overnight at 4 °C. Both cell lysate and supernatant were analyzed by 11% SDS-PAGE, Coomassie staining and Western blotting. Sample loading on the protein gel was corrected based on OD600 of the culture prior to collection for analysis
Cell Envelope Protein Analysis
E. coli TOP10F′ cells were grown in LB at 37 °C to mid log phase in regular culture flasks and diluted to an OD600 of 0.05 in 2 mL LB in a round-bottom tube. PhoE was expressed from the pEH3 vector using 40 μM IPTG as final concentration. Subsequently, cells were exposed to different concentrations of compound or 0.5% DMSO at 37 °C with shaking for 2.5 h. Cells were then centrifuged at 5000g for 10 min and resuspended in ice-cold resuspension buffer (10 mM Tris-HCl, 3 mM EDTA, pH 8.0). After adding EDTA-free Protease Inhibitor Cocktail (cOmplete, Roche) cells were lysed by tip sonication on ice. Unbroken cells were removed by centrifugation at 5000g for 10 min. Cell envelopes were collected from the supernatant by ultracentrifugation at 200 000g for 1 h at 4 °C and resuspended in solubilization buffer, containing 50 mM Tris-HCl, 150 mM NaCl, pH 8.0 (TBS) with 1% (w/v) n-dodecyl-β-d-maltoside (DDM, Anatrace), followed by overnight incubation at 4 °C. The solubilized cell envelopes were analyzed by 11% seminative PAGE or 11% SDS-PAGE, Coomassie staining and Western blotting.7 Sample loading on the protein gel was corrected based on OD600 of the culture prior to collection of cells for analysis.
Purification of BamABCDE
The protocol was adapted from Roman Hernandez et al., 201442 and Iadanza et al., 2016.48 pJH114 (Roman Hernandez et al., 2014) was transformed into E. coli BL21(DE3). Transformants were grown at 37 °C, 175 rounds per minute (rpm) in LB containing 100 μg/mL ampicillin, to an OD600 of ∼0.5–0.6. Protein overproduction was induced by supplementing the culture with 0.4 mM IPTG and incubating at 37 °C, 175 rpm for 90 min. Cells were harvested by centrifugation at 9000g, for 15 min at 4 °C. The cell pellet was resuspended in 50 mL of cold 20 mM Tris/HCl, pH 8.0 and disrupted by sonication. Cell membranes were harvested by ultracentrifugation at 134 000g, for 1 h at 4 °C and extracted with 20 mL of 50 mM Tris/HCl, pH 8.0, 150 mM NaCl, 1% DDM for 1 h on ice. Insoluble material was removed by ultracentrifugation, then membrane extracts were incubated overnight with 2 mL of Ni-NTA agarose bead suspension (Qiagen) per liter culture volume at 4 °C on a tube roller. Ni-NTA beads were washed with 20 mL of 50 mM Tris/HCl, pH 8.0, 150 mM NaCl, 0.05% DDM, 50 mM imidazole, and the BAM complex was eluted with 10 mL of 50 mM Tris/HCl, pH 8.0, 150 mM NaCl, 0.05% DDM, 500 mM imidazole. Eluted fractions were applied to a Superdex 200 (10/300) column (GE Healthcare) in filtered and degassed 50 mM Tris/HCl, pH 8.0, 150 mM NaCl, 0.05% DDM. Purified BAM complex was briefly stored at 4 °C to be immediately reconstituted into proteoliposomes.
Purification of SurA
The protocol was adapted from Hagan et al., 201043 and Roman Hernandez et al., 2014.42 pSK257 (Hagan et al., 201043) was transformed into E. coli BL21(DE3). Transformants were grown (37 °C, 175 rpm) in LB, containing 50 μg/mL kanamycin, to OD600 ∼1. The culture was shifted to 16 °C and supplemented after 30 min with 0.1 mM IPTG to induce protein overproduction, then incubated at 16 °C, 175 rpm for 16–18 h. Cells were harvested by centrifugation at 9000g, for 15 min at 4 °C, and resuspended in 50 mL of 20 mM Tris/HCl, pH 8.0, then disrupted by sonication. The supernatant was incubated with 2 mL of Ni-NTA agarose beads (Qiagen) per liter culture volume at 4 °C on a tube roller. Ni-NTA beads were washed with 40 mL of 20 mM Tris/HCl, pH 8.0, 50 mM imidazole, and the protein eluted in 20 mL of 20 mM Tris/HCl, pH 8.0, 500 mM imidazole. Eluted fractions were dialyzed overnight at 4 °C against 20 mM Tris/HCl, pH 8.0, 10% glycerol. After dialysis, the protein was further purified by size-exclusion chromatography on a Superdex 75 (16/600) column (GE Healthcare) in filtered and degassed 20 mM Tris/HCl, pH 8.0, 10% glycerol at 1 mL/min. Eluted fractions were concentrated to ∼250 μM and stored in aliquots at −80 °C.
Purification of OmpT
The protocol was adapted from Iadanza et al., 2016.48 The protein was produced in E. coli BL21(DE3) from pCH18 (Hagan et al., 201043). Transformants were grown (37 °C, 175 rpm) in LB, containing 50 μg/mL kanamycin, to OD600 ∼ 0.5–0.6, then the culture was supplemented with 1 mM IPTG to induce protein overproduction and incubated (37 °C, 175 rpm) for further 4 h. Cells were harvested by centrifugation at 9000g, for 15 min at 4 °C, and resuspended in 50 mL of 50 mM Tris/HCl, pH 8.0, 5 mM EDTA. Cells were disrupted by sonication, and insoluble OmpT cytoplasmic inclusion bodies were collected by centrifugation (3220g, 15 min, 4 °C) and resuspended in 80 mL of 50 mM Tris/HCl, pH 8.0, 2% Triton X-100, incubating for 1 h at room temperature with gentle shaking. Inclusion bodies were harvested by centrifugation (3220g, 15 min, 4 °C) and washed twice in 50 mL of 50 mM Tris/HCl, pH 8.0, then solubilized in 10 mL of 25 mM Tris/HCl, pH 8.0, 6 M guanidine-HCl, incubating for 1 h at RT with gentle shaking. Insoluble material was removed by ultracentrifugation (134 000g, 1 h, 4 °C) and the supernatant was applied to a Superdex 75 (26/600) column (GE Healthcare) in filtered and degassed 25 mM Tris/HCl, pH 8.0, 6 M guanidine-HCl. Eluted fractions were stored in aliquots at −80 °C.
Reconstitution of the BAM Complex into Proteoliposomes
Purified BAM complex was reconstituted into proteoliposomes according to the dilution method described by Hagan et al., 201043 and Roman Hernandez et al., 2014.42E. coli polar lipids (Avanti) were resuspended in water at 20 mg/mL and sonicated until they were well dispersed, then 200 μL of lipid suspension were added to 1 mL of freshly purified BAM complex. The mixture was incubated on ice for 5 min, then diluted with 20 mL of cold 20 mM Tris/HCl, pH 8.0 and incubated on ice for further 30 min. Liposomes were pelleted by ultracentrifugation at 135 000g, for 30 min at 4 °C, washed in 20 mL of 20 mM Tris/HCl pH 8.0, and pelleted again. BAM-enriched proteoliposomes were resuspended in ∼800 μL of 20 mM Tris/HCl pH 8.0, flash-frozen in liquid nitrogen in small aliquots and stored at −80 °C.
OmpT Folding in Vitro Assay
The protocol was adapted from Roman Hernandez et al., 2014.42 Compounds 2 and 14 at different concentrations were incubated with 2 μM BAM proteoliposomes and 2 mM autoquenched fluorogenic peptide (Peptide Synthetics) in a 25 μL-subreaction in Tris/HCl, pH 6.5. A second 25 μL-subreaction contained 140 μM SurA and 20 μM denatured OmpT in Tris/HCl, pH 6.5. The two subreactions were incubated at 30 °C for 5 min, then mixed to initiate BAM-mediated OmpT assembly. Control samples contained inactive derivative compounds (100 μM), DMSO only or no BAM complex (empty liposomes). Alternatively, a 25 μL-subreaction containing 2 μM BAM proteoliposomes in Tris/HCl, pH 6.5 was mixed with a second 25 μL-subreaction contained 140 μM SurA and 20 μM denatured OmpT in Tris/HCl, pH 6.5 and incubated for at 30 °C for 2 h to prefold OmpT, then mixed with a third 50 μL-subreaction containing 200 μM compounds 2 and 14 or DMSO and 2 mM fluorogenic peptide in Tris/HCl, pH 6.5. Control reactions that received compounds 2 and 14 or DMSO prior to OmpT folding were included. Cleavage of the peptide by folded OmpT was monitored by measuring the fluorescence at 430 nm (excitation at 330 nm) in a CLARIOstar microplate reader (BMG Labtech), over 80 min of incubation at 30 °C, with readings every 20 s. Activity rates for three independent replicates were measured over linear increase in fluorescence after subtracting the background fluorescent signal at T = 0, averaged and converted into percentage relatively to DMSO controls. EC50 values were estimated using the online MyCurveFit tool (www.mycurvefit.com) by plotting relative OmpT activity from dose–response experiments against compound concentration.
HEK293 Cell Toxicity
HEK293 cells were cultured in regular flasks at 37 °C, 5% CO2 in Dulbecco’s Modified Eagle Medium (DMEM) supplemented with 10% fetal bovine serum (Thermo Fisher Scientific) for multiple passages. Toxicity to HEK293 was assessed by transferring 240 nL compound solution, 200 nL DMSO solution (negative control) and 200 nL of a 20 mM tamoxifen solution (positive control) in the wells of a white 384-well plate using robotics. Selected compounds were tested in a 1:3 dose response, as described for testing autofluorescence. Subsequently, ∼2000 HEK293 cells in 40 μL DMEM were seeded in all wells using robotics followed by incubation for 48 h in the incubator of the Robocon 2 system at 37 °C, 5% CO2 and 90% humidity. Afterward, 20 μL Cell Titer Glo reagent (Promega) was added to all wells and the plate was shaken thoroughly for 2 min. After 20 min incubation at RT, luminescence was measured using the Envision platereader.
Acknowledgments
We thank Thomas Silhavy (Princeton University, USA) for kindly providing E. colibamA101. We thank Harris Bernstein (National Institutes of Health, USA) for providing the pJH114 plasmid. Arnaud Marchand is acknowledged for performing chemical analysis. We also thank Peter van Ulsen and Alexander Speer (VU University Amsterdam, The Netherlands) for critical reading of the manuscript and valuable input into the project. This study was supported by the NWO graduate program (022.005.031) awarded to MS. This project has also received funding from the European Union’s Horizon 2020 research and innovation program under the Marie Skłodowska-Curie Grant Agreement No. 721484 (International Training Network Train2Target) awarded to WV. Mass spectrometry was made possible by the support of the Hercules Foundation of the Flemish Government (Grant 20100225-7).
Glossary
Abbreviations
- OD
optical density
- IPTG
isopropyl β-d-1-thiogalactopyranoside
- BAM
β-barrel assembly machine
- DDM
n-dodecyl-β-d-maltoside
- AT
autotransporter
- Hbp
hemoglobin protease
- Rcs
regulation of capsular polysaccharide synthesis
- HTS
high-throughput screening
- RT
room temperature
- RPM
round per minute
- g
centrifugal force
- MIC
minimal inhibitory concentration
- TCA
trichloroacetic acid
- EDTA
ethylenediaminetetraacetic acid
- DMEM
Dulbecco’s modified Eagle medium
- mNG
mNeongreen
- ss
signal sequence
- TorA
TMAO-reductase
- EC50
half maximal effective concentration
- LD50
median lethal dose
- OM
outer membrane.
Supporting Information Available
The Supporting Information is available free of charge at https://pubs.acs.org/doi/10.1021/acsinfecdis.0c00728.
Figure S1: Z′ factor and signal to background ratio of each 384-well plate; Figure S2: Autofluorescence of each hit compound from the primary screen; Figure S3: Dose-dependent induction of various stress responses; Figure S4: Compounds 2 and 14 do not synergize with increased membrane permeability; Figure S5: Dose-dependent activation of σE stress in response to 2A and 14A; Figure S6: Compounds 2 and 14 interfere with OmpT assembly in proteoliposomes; Figure S7: Effect of compounds 2 and 14 on growth of various Gram-negative and Gram-positive species; Figure S8: Quantification of the pixel intensities of the protein bands in Figure 4B; Synthesis of compound 14; Quality control of compound 2; Analytical methods descriptions; Table S1: Overview of the strains used in this study; Table S2: Overview of the plasmids used in this study; Table S3: Overview of marketed drugs and other bioactive molecules identified in the HTS screen to activate σE stress; References (PDF)
Author Contributions
M.S. and J.L. wrote the manuscript. M.S., J.L., H.K., W.V., and M.V. designed the study. M.S., P.S., F.C., and C.M.H.J. acquired, analyzed, and interpreted the data.
The authors declare no competing financial interest.
Supplementary Material
References
- Nikaido H. (2003) Molecular Basis of Bacterial Outer Membrane Permeability Revisited Molecular Basis of Bacterial Outer Membrane Permeability Revisited. Microbiol. Mol. Biol. Rev. 67, 593–656. 10.1128/MMBR.67.4.593-656.2003. [DOI] [PMC free article] [PubMed] [Google Scholar]
- Marquez B. (2005) Bacterial Efflux Systems and Efflux Pumps Inhibitors. Biochimie 87, 1137–1147. 10.1016/j.biochi.2005.04.012. [DOI] [PubMed] [Google Scholar]
- Boucher H. W.; Talbot G. H.; Benjamin D. K.; Bradley J.; Guidos R. J.; Jones R. N.; Murray B. E.; Bonomo R. A.; Gilbert D. (2013) 10 x’ ‘20 Progress--Development of New Drugs Active Against Gram-Negative Bacilli: An Update From the Infectious Diseases Society of America. Clin. Infect. Dis. 56, 1685–1694. 10.1093/cid/cit152. [DOI] [PMC free article] [PubMed] [Google Scholar]
- Allen R. C.; Popat R.; Diggle S. P.; Brown S. P. (2014) Targeting Virulence: Can We Make Evolution-Proof Drugs?. Nat. Rev. Microbiol. 12, 300–308. 10.1038/nrmicro3232. [DOI] [PubMed] [Google Scholar]
- Bos M. P.; Robert V.; Tommassen J. (2007) Biogenesis of the Gram-Negative Bacterial Outer Membrane. Annu. Rev. Microbiol. 61, 191–214. 10.1146/annurev.micro.61.080706.093245. [DOI] [PubMed] [Google Scholar]
- Sperandeo P.; Martorana A. M.; Polissi A. (2017) Lipopolysaccharide Biogenesis and Transport at the Outer Membrane of Gram-Negative Bacteria. Biochim. Biophys. Acta, Mol. Cell Biol. Lipids 1862, 1451–1460. 10.1016/j.bbalip.2016.10.006. [DOI] [PubMed] [Google Scholar]
- Noinaj N.; Rollauer S. E.; Buchanan S. K. (2015) The β-Barrel Membrane Protein Insertase Machinery from Gram-Negative Bacteria. Curr. Opin. Struct. Biol. 31, 35–42. 10.1016/j.sbi.2015.02.012. [DOI] [PMC free article] [PubMed] [Google Scholar]
- Imai Y.; Meyer K. J.; Iinishi A.; Favre-Godal Q.; Green R.; Manuse S.; Caboni M.; Mori M.; Niles S.; Ghiglieri M.; Honrao C.; Ma X.; Guo J. J.; Makriyannis A.; Linares-Otoya L.; Böhringer N.; Wuisan Z. G.; Kaur H.; Wu R.; Mateus A.; Typas A.; Savitski M. M.; Espinoza J. L.; O’Rourke A.; Nelson K. E.; Hiller S.; Noinaj N.; Schäberle T. F.; D’Onofrio A.; Lewis K. (2019) A New Antibiotic Selectively Kills Gram-Negative Pathogens. Nature 576, 459–464. 10.1038/s41586-019-1791-1. [DOI] [PMC free article] [PubMed] [Google Scholar]
- Hart E. M.; Mitchell A. M.; Konovalova A.; Grabowicz M.; Sheng J.; Han X.; Rodriguez-Rivera F. P.; Schwaid A. G.; Malinverni J. C.; Balibar C. J.; Bodea S.; Si Q.; Wang H.; Homsher M. F.; Painter R. E.; Ogawa A. K.; Sutterlin H.; Roemer T.; Black T. A.; Rothman D. M.; Walker S. S.; Silhavy T. J. (2019) A Small-Molecule Inhibitor of BamA Impervious to Efflux and the Outer Membrane Permeability Barrier. Proc. Natl. Acad. Sci. U. S. A. 116, 21748–21757. 10.1073/pnas.1912345116. [DOI] [PMC free article] [PubMed] [Google Scholar]
- Luther A.; Urfer M.; Zahn M.; Müller M.; Wang S. Y.; Mondal M.; Vitale A.; Hartmann J. B.; Sharpe T.; Monte F. Lo; Kocherla H.; Cline E.; Pessi G.; Rath P.; Modaresi S. M.; Chiquet P.; Stiegeler S.; Verbree C.; Remus T.; Schmitt M.; Kolopp C.; Westwood M. A.; Desjonquères N.; Brabet E.; Hell S.; LePoupon K.; Vermeulen A.; Jaisson R.; Rithié V.; Upert G.; Lederer A.; Zbinden P.; Wach A.; Moehle K.; Zerbe K.; Locher H. H.; Bernardini F.; Dale G. E.; Eberl L.; Wollscheid B.; Hiller S.; Robinson J. A.; Obrecht D. (2019) Chimeric Peptidomimetic Antibiotics against Gram-Negative Bacteria. Nature 576, 452–458. 10.1038/s41586-019-1665-6. [DOI] [PubMed] [Google Scholar]
- Storek K. M.; Vij R.; Sun D.; Smith P. A.; Koerber J. T.; Rutherford S. T. (2019) The Escherichia Coli β-Barrel Assembly Machinery Is Sensitized to Perturbations under High Membrane Fluidity. J. Bacteriol. 201, e00517-18. 10.1128/JB.00517-18. [DOI] [PMC free article] [PubMed] [Google Scholar]
- Hagan C. L.; Wzorek J. S.; Kahne D. (2015) Inhibition of the β-Barrel Assembly Machine by a Peptide That Binds BamD. Proc. Natl. Acad. Sci. U. S. A. 112, 2011–2016. 10.1073/pnas.1415955112. [DOI] [PMC free article] [PubMed] [Google Scholar]
- Mori N.; Ishii Y.; Tateda K.; Kimura S.; Kouyama Y.; Inoko H.; Mitsunaga S.; Yamaguchi K.; Yoshihara E. (2012) A Peptide Based on Homologous Sequences of the β-Barrel Assembly Machinery Component Bamd Potentiates Antibiotic Susceptibility of Pseudomonas Aeruginosa. J. Antimicrob. Chemother. 67, 2173–2181. 10.1093/jac/dks174. [DOI] [PubMed] [Google Scholar]
- Romano K. P.; Warrier T.; Poulsen B. E.; Nguyen P. H.; Loftis A. R.; Saebi A.; Pentelute B. L.; Hung D. T. (2019) Mutations in PmrB Confer Cross-Resistance between the LptD. Antimicrob. Agents Chemother. 63, 1–6. 10.1128/AAC.00511-19. [DOI] [PMC free article] [PubMed] [Google Scholar]
- Ruiz N.; Silhavy T. J. (2005) Sensing External Stress: Watchdogs of the Escherichia Coli Cell Envelope. Curr. Opin. Microbiol. 8, 122–126. 10.1016/j.mib.2005.02.013. [DOI] [PubMed] [Google Scholar]
- Steenhuis M.; Abdallah A. M.; de Munnik S. M.; Kuhne S.; Sterk G.-J.; van den Berg van Saparoea B.; Westerhausen S.; Wagner S.; van der Wel N. N.; Wijtmans M.; van Ulsen P.; Jong W. S. P.; Luirink J. (2019) Inhibition of Autotransporter Biogenesis by Small Molecules. Mol. Microbiol. 112, 1–18. 10.1111/mmi.14255. [DOI] [PMC free article] [PubMed] [Google Scholar]
- Laloux G. G.; Collet J.-F. (2017) Major Tom to Ground Control: How Lipoproteins Communicate Extra-Cytoplasmic Stress to the Decision Center of the Cell. J. Bacteriol. 199, 199. 10.1128/JB.00216-17. [DOI] [PMC free article] [PubMed] [Google Scholar]
- Wall E.; Majdalani N.; Gottesman S. (2018) The Complex Rcs Regulatory Cascade. Annu. Rev. Microbiol. 72, 111–139. 10.1146/annurev-micro-090817-062640. [DOI] [PubMed] [Google Scholar]
- Konovalova A.; Mitchell A. M.; Silhavy T. J. (2016) A Lipoprotein/b-Barrel Complex Monitors Lipopolysaccharide Integrity Transducing Information across the Outer Membrane. eLife 5, 1–17. 10.7554/eLife.15276. [DOI] [PMC free article] [PubMed] [Google Scholar]
- Konovalova A.; Perlman D. H.; Cowles C. E.; Silhavy T. J. (2014) Transmembrane Domain of Surface-Exposed Outer Membrane Lipoprotein RcsF Is Threaded through the Lumen of -Barrel Proteins. Proc. Natl. Acad. Sci. U. S. A. 111, E4350–E4358. 10.1073/pnas.1417138111. [DOI] [PMC free article] [PubMed] [Google Scholar]
- Delhaye A.; Collet J. F.; Laloux G. (2019) A Fly on the Wall: How Stress Response Systems Can Sense and Respond to Damage to Peptidoglycan. Front. Cell. Infect. Microbiol. 9, 9. 10.3389/fcimb.2019.00380. [DOI] [PMC free article] [PubMed] [Google Scholar]
- Létoquart J.; Rodriguez-Alonso R.; Nguyen V. S.; Louis G.; Calabrese A. N.; Radford S. E.; Cho S.-H.; Remaut H.; Collet J.-F. (2019) Structural Insight into the Formation of Lipoprotein-β-Barrel Complexes by the β-Barrel Assembly Machinery. bioRxiv 823146. 10.1101/823146. [DOI] [PMC free article] [PubMed] [Google Scholar]
- Cho S.-H.; Szewczyk J.; Pesavento C.; Zietek M.; Banzhaf M.; Roszczenko P.; Asmar A.; Laloux G.; Hov A.-K.; Leverrier P.; Van der Henst C.; Vertommen D.; Typas A.; Collet J.-F. (2014) Detecting Envelope Stress by Monitoring β-Barrel Assembly. Cell 159, 1652–1664. 10.1016/j.cell.2014.11.045. [DOI] [PubMed] [Google Scholar]
- Shaner N. C.; Lambert G. G.; Chammas A.; Ni Y.; Cranfill P. J.; Baird M. A.; Sell B. R.; Allen J. R.; Day R. N.; Israelsson M.; Davidson M. W.; Wang J. (2013) A Bright Monomeric Green Fluorescent Protein Derived from Branchiostoma Lanceolatum. Nat. Methods 10, 407–409. 10.1038/nmeth.2413. [DOI] [PMC free article] [PubMed] [Google Scholar]
- Zhang J.; Chung T. D. Y.; Oldenburg K. R. (1999) A Simple Statistical Parameter for Use in Evaluation and Validation of High Throughput Screening Assays. J. Biomol. Screening 4, 67–73. 10.1177/108705719900400206. [DOI] [PubMed] [Google Scholar]
- Arsène F.; Tomoyasu T.; Bukau B. (2000) The Heat Shock Response of Escherichia Coli. Int. J. Food Microbiol. 55, 3–9. 10.1016/S0168-1605(00)00206-3. [DOI] [PubMed] [Google Scholar]
- Steenhuis M.; Ten Hagen-Jongman C. M.; van Ulsen P.; Luirink J. (2020) Stress-Based High-Throughput Screening Assays to Identify Inhibitors of Cell Envelope Biogenesis. Antibiotics 9, 808. 10.3390/antibiotics9110808. [DOI] [PMC free article] [PubMed] [Google Scholar]
- Jong W. S. P.; Vikström D.; Houben D.; Berg van Saparoea H. B.; Gier J. W.; Luirink J. (2017) Application of an E. Coli Signal Sequence as a Versatile Inclusion Body Tag. Microb. Cell Fact. 16, 1–13. 10.1186/s12934-017-0662-4. [DOI] [PMC free article] [PubMed] [Google Scholar]
- Aoki S. K.; Malinverni J. C.; Jacoby K.; Thomas B.; Pamma R.; Trinh B. N.; Remers S.; Webb J.; Braaten B. A.; Silhavy T. J.; Low D. A. (2008) Contact-Dependent Growth Inhibition Requires the Essential Outer Membrane Protein BamA (YaeT) as the Receptor and the Inner Membrane Transport Protein AcrB. Mol. Microbiol. 70, 323–340. 10.1111/j.1365-2958.2008.06404.x. [DOI] [PMC free article] [PubMed] [Google Scholar]
- Konovalova A.; Kahne D. E.; Silhavy T. J. (2017) Outer Membrane Biogenesis. Annu. Rev. Microbiol. 71, 539–556. 10.1146/annurev-micro-090816-093754. [DOI] [PMC free article] [PubMed] [Google Scholar]
- Sklar J. G.; Wu T.; Kahne D.; Silhavy T. J. (2007) Defining the Roles of the Periplasmic Chaperones SurA, Skp, and DegP in Escherichia Coli. Genes Dev. 21, 2473–2484. 10.1101/gad.1581007. [DOI] [PMC free article] [PubMed] [Google Scholar]
- Mahoney T. F.; Ricci D. P.; Silhavy T. J. (2016) Classifying β-Barrel Assembly Substrates by Manipulating Essential Bam Complex Members. J. Bacteriol. 198, 1984. 10.1128/JB.00263-16. [DOI] [PMC free article] [PubMed] [Google Scholar]
- Jonkers T. J. H.; Steenhuis M.; Schalkwijk L.; Luirink J.; Bald D.; Houtman C. J.; Kool J.; Lamoree M. H.; Hamers T. (2020) Development of a High-Throughput Bioassay for Screening of Antibiotics in Aquatic Environmental Samples. Sci. Total Environ. 729, 139028. 10.1016/j.scitotenv.2020.139028. [DOI] [PubMed] [Google Scholar]
- Krishnamoorthy G.; Wolloscheck D.; Weeks J. W.; Croft C.; Rybenkov V. V.; Zgurskaya H. I. (2016) Breaking the Permeability Barrier of Escherichia Coli by Controlled Hyperporination of the Outer Membrane. Antimicrob. Agents Chemother. 60, 7372–7381. 10.1128/AAC.01882-16. [DOI] [PMC free article] [PubMed] [Google Scholar]
- Bury-Moné S.; Nomane Y.; Reymond N.; Barbet R.; Jacquet E.; Imbeaud S.; Jacq A.; Bouloc P. (2009) Global Analysis of Extracytoplasmic Stress Signaling in Escherichia Coli. PLoS Genet. 5, e1000651. 10.1371/journal.pgen.1000651. [DOI] [PMC free article] [PubMed] [Google Scholar]
- Jansen C.; Wiese A.; Reubsaet L.; Dekker N.; De Cock H.; Seydel U.; Tommassen J. (2000) Biochemical and Biophysical Characterization of in Vitro Folded Outer Membrane Porin PorA of Neisseria Meningitidis. Biochim. Biophys. Acta, Biomembr. 1464, 284–298. 10.1016/S0005-2736(00)00155-3. [DOI] [PubMed] [Google Scholar]
- Noinaj N.; Kuszak A. J.; Buchanan S. K. (2015) Heat Modifiability of Outer Membrane Proteins from Gram-Negative Bacteria. Methods Mol. Biol. 1329, 51–56. 10.1007/978-1-4939-2871-2_4. [DOI] [PMC free article] [PubMed] [Google Scholar]
- Oomen C. J.; Van Ulsen P.; Van Gelder P.; Feijen M.; Tommassen J.; Gros P. (2004) Structure of the Translocator Domain of a Bacterial Autotransporter. EMBO J. 23, 1257–1266. 10.1038/sj.emboj.7600148. [DOI] [PMC free article] [PubMed] [Google Scholar]
- Jansen C.; Heutink M.; Tommassen J.; De Cock H. (2000) The Assembly Pathway of Outer Membrane Protein PhoE of Escherichia Coli. Eur. J. Biochem. 267, 3792–3800. 10.1046/j.1432-1327.2000.01417.x. [DOI] [PubMed] [Google Scholar]
- van Ulsen P.; Rahman S. U.; Jong W. S. P.; Daleke-Schermerhorn M. H.; Luirink J. (2014) Type V Secretion: From Biogenesis to Biotechnology. Biochim. Biophys. Acta, Mol. Cell Res. 1843, 1592–1611. 10.1016/j.bbamcr.2013.11.006. [DOI] [PubMed] [Google Scholar]
- Jong W. S. P.; ten Hagen-Jongman C. M.; den Blaauwen T.; Jan Slotboom D.; Tame J. R. H.; Wickstrom D.; de Gier J.-W.; Otto B. R.; Luirink J. (2007) Limited Tolerance towards Folded Elements during Secretion of the Autotransporter Hbp. Mol. Microbiol. 63, 1524–1536. 10.1111/j.1365-2958.2007.05605.x. [DOI] [PubMed] [Google Scholar]
- Roman-Hernandez G.; Peterson J. H.; Bernstein H. D. (2014) Reconstitution of Bacterial Autotransporter Assembly Using Purified Components. eLife 3, e04234 10.7554/eLife.04234. [DOI] [PMC free article] [PubMed] [Google Scholar]
- Hagan C. L.; Kim S.; Kahne D. (2010) Reconstitution of Outer Membrane Protein Assembly from Purified Components. Science (Washington, DC, U. S.) 328, 890–892. 10.1126/science.1188919. [DOI] [PMC free article] [PubMed] [Google Scholar]
- Hagan C. L.; Westwood D. B.; Kahne D. (2013) Bam Lipoproteins Assemble BamA in Vitro. Biochemistry 52, 6108. 10.1021/bi400865z. [DOI] [PMC free article] [PubMed] [Google Scholar]
- Sauri A.; Soprova Z.; Wickström D.; de Gier J.-W.; Van der Schors R. C.; Smit A. B.; Jong W. S. P.; Luirink J. (2009) The Bam (Omp85) Complex Is Involved in Secretion of the Autotransporter Haemoglobin Protease. Microbiology 155, 3982–3991. 10.1099/mic.0.034991-0. [DOI] [PubMed] [Google Scholar]
- Laws M.; Shaaban A.; Rahman K. M. (2019) Antibiotic Resistance Breakers: Current Approaches and Future Directions. FEMS Microbiol. Rev. 43, 490–516. 10.1093/femsre/fuz014. [DOI] [PMC free article] [PubMed] [Google Scholar]
- Walters W. P.; Murcko A.; Murcko M. A. (1999) Recognizing Molecules with Drug-like Properties. Curr. Opin. Chem. Biol. 3, 384–387. 10.1016/S1367-5931(99)80058-1. [DOI] [PubMed] [Google Scholar]
- Iadanza M. G.; Higgins A. J.; Schiffrin B.; Calabrese A. N.; Brockwell D. J.; Ashcroft A. E.; Radford S. E.; Ranson N. A. (2016) Lateral Opening in the Intact β-Barrel Assembly Machinery Captured by Cryo-EM. Nat. Commun. 7, 12865. 10.1038/ncomms12865. [DOI] [PMC free article] [PubMed] [Google Scholar]
Associated Data
This section collects any data citations, data availability statements, or supplementary materials included in this article.