

Abstract
Hermansky–Pudlak syndrome (HPS) is a disorder of lysosome-related organelle biogenesis resulting in melanosome dysfunction and absent platelet dense bodies. HPS patients have oculocutaneous albinism, bruising, and bleeding. HPS-5 results from deficiency of the HPS5 protein, a component of the biogenesis of lysosome-related organelles complex-2 (BLOC-2). HPS5 has an unknown function and lacks homology to known proteins. We performed ultrastructural studies of HPS-5 melanocytes revealing predominantly early-stage melanosomes with many small 3,4(OH)2-phenylalanine-positive vesicles throughout the cell body and dendrites. These findings resemble the distinct ultrastructural features of HPS-3 melanocytes;HPS3 is also a BLOC-2 component. Immunofluorescence and immunoEM studies showed decreased TYRP1 labeling in the dendrites of HPS-5 melanocytes, and the overall abundance of TYRP1 was reduced. No substantial differences were observed in the distribution or abundance of Pmel17 in HPS-5 melanocytes. In normal melanocytes, endogenous tyrosinase colocalized with Pmel17 and TYRP1 in the perinuclear area and dendritic tips; this was much reduced in HPS-5 melanocytes, particularly in the tips. We conclude that early stage melanosome formation and Pmel17 trafficking are preserved in HPS5-deficient cells. Tyrosinase and TYRP1 are mistrafficked, however, and fail to be efficiently delivered to melanosomes of HPS-5 melanocytes.
INTRODUCTION
Hermansky–Pudlak syndrome (HPS [MIM: 203300]) is a disorder of lysosome-related organelle biogenesis Characterized by oculocutaneous albinism and a bleeding diathesis (Hermansky and Pudlak, 1959; King et al., 2001; Huizing et al., 2002; Bonifacino, 2004; Di Pietro and Dell’Angelica, 2005; Wei, 2006). Defects in the melanosome, a lysosome-related organelle, cause HPS patients to manifest congenital nystagmus, reduced visual acuity, and hypopigmentation of the irides, skin, and hair (Simon et al., 1982; Witkop et al., 1987; Summers et al., 1988). Complete absence of the platelet dense body, another lysosome-related organelle, results in impaired platelet aggregation with easy bruising, epistaxis, and excessive bleeding following dental or surgical procedures (Witkop et al., 1987; Gahl et al., 1998; King et al., 2001).
Eight subtypes of HPS have been identified in humans (HPS-1 through HPS-8); all exhibit oculocutaneous albinism and absent platelet dense bodies. HPS-2 ([MIM: 603401]) results from mutations in the β3A subunit of adaptor complex-3. The functions of the remaining HPS proteins remain unknown, although several interact with each other in the biogenesis of lysosome-related organelles complexes or BLOCs (Li et al., 2003; Martina et al., 2003; Nazarian et al., 2003; Zhang et al., 2003). Specifically, HPS1 and HPS4 form BLOC-3 (Chiang et al., 2003; Martina et al., 2003; Nazarian et al., 2003); the associated diseases HPS-1 ([MIM: 604982]) and HPS-4 ([MIM: 606682]) are relatively severe, with adult-onset pulmonary fibrosis. HPS3, HPS5, and HPS6 comprise BLOC-2 (Zhang et al., 2003; Di Pietro et al., 2004; Gautam et al., 2004); patients with HPS-3 ([MIM: 606118]), HPS-5 ([MIM: 607521]), or HPS-6 ([MIM: 607522]) have mild hypopigmentation but no lung disease has been reported. HPS7 ([MIM: 607145]) and HPS8 ([MIM: 609762]) are components of BLOC-1; clinical descriptions are limited to one brief case report each (Li et al., 2003; Morgan et al., 2006). BLOC-specific clinical findings in murine models and in human patients suggest a distinct role for each BLOC.
Individuals with HPS-3 disease have been extensively described (Anikster et al., 2001; Huizing et al., 2001), and their cultured fibroblasts and melanocytes have been characterized (Boissy et al., 2005). However, HPS-5 patients are very rare, and only limited studies of their fibroblasts are available (Huizing et al., 2004). Herein we describe the phenotype of human HPS-5 melanocytes using immuneblotting, 3,4(OH)2-phenylalanine (DOPA) staining and immunoelectron microscopy, and immunofluorescence.
RESULTS
Biochemical characterization of HPS-5 melanocytes
Melanocytes were cultured from lightly pigmented normal individuals and an HPS-5 patient (HPS106-5). Whole-cell lysates containing 50 μg total protein were electrophoresed and immunoblotted using HPS5 antibodies. Two closely migrating bands were observed in normal melanocytes; these bands were absent from HPS-5 melanocytes (Figure 1a). The two bands migrated at approximately 120 and 130 kDa, close to the predicted molecular weights of the long isoform a (127 kDa) and the short isoform b (114 kDa) of HPS5 (GI numbers 31657123 and 31657127).
Figure 1. Cultured melanocytes deficient in HPS5 demonstrate reduced in vivo tyrosinase activity.

Western blotting and assays of enzyme activity were performed on melanocytes cultured from an HPS-5 patient and from individuals with light (NHM L), medium (NHM M), or dark (NHM D) pigmentation, as indicated. (a) Normal melanocyte lysates immunoblotted with HPS5 antibodies demonstrate two bands corresponding to the long and short isoforms of HPS5; these bands are absent from the HPS-5 melanocyte lysate. α-Tubulin served as a loading control. (b) Normal and HPS-5 melanocyte lysates (25 μg total protein) immunoblotted and probed with antibodies against TYRP1. TYRP1 protein abundance is markedly reduced in HPS-5 melanocytes relative to normal. α-Tubulin served as a loading control. (c) Normal and HPS-5 melanocyte lysates (25 μg total protein) immunoblotted and probed with antibodies against tyrosinase. Tyrosinase protein is minimally decreased in HPS-5 melanocytes relative to normal. α-Tubulin served as a loading control. (d) In vivo tyrosine hydroxylase activity of intact HPS-5 and control melanocytes. (e) In vitro tyrosine hydroxylase activity of lysed HPS-5 and control melanocytes. Activity is expressed relative to the NHM L control. Results are means ± SD of three determinations.
Western blots indicated that the amount of TYRP1 protein was drastically reduced in HPS-5 compared with normal melanocytes, while tyrosinase protein was negligibly decreased (Figure 1b and c).
Tyrosinase was further assessed by measuring its enzymatic activity in intact and lysed melanocytes. Intact HPS-5 melanocytes demonstrated markedly reduced in vivo tyrosinase activity compared with that of normal melanocytes from either dark or light-skinned individuals (Figure 1d; P<4 × 10⁻⁸ and P<1 × 10⁻¹⁰, respectively). In contrast, the in vitro tyrosinase activity of lysed HPS-5 melanocytes exceeded that of normals with light or medium pigmentation (Figure 1e; P<0.0004 and P<0.003, respectively). Thus, HPS-5 melanocytes contain a normal or greater than normal amount of endogenous tyrosinase, with reduced or suppressed function in vivo.
Ultrastructure of HPS-5 melanocytes
Cultured HPS-5 melanocytes exhibited predominantly lightly pigmented early-stage (stage II–III) melanosomes (Figure 2a and b, arrows). In contrast, normal melanocytes demonstrated primarily darkly pigmented late-stage (stage IV) melanosomes (Figure 2c and d). DOPA histochemistry (indicating sites of tyrosinase activity) in both HPS-5 (Figure 3a and b) and normal (Figure 3c) melanocytes revealed reaction product in the trans-Golgi network (TGN; G) and in small (50–100 nm) vesicles (arrowheads in C) associated with the TGN. In HPS-5 melanocytes, these small DOPA-positive vesicles are not restricted to the TGN, as they are in normal melanocytes, but instead are found throughout the cell body and dendrites (Figure 3a and b, arrows). Additionally, HPS-5 melanocytes have a small number of melanosomes, notably in the dendrites, that are devoid of DOPA reaction product (Figure 3a, arrowheads).
Figure 2. HPS-5 melanocytes contain more early melanosomes as demonstrated by electron microscopy.

(a, b) HPS-5 melanocytes viewed with (a) low and (b) high magnification demonstrate predominantly lightly pigmented early-stage (stages II–III) melanosomes (arrows) prominent throughout the cell body. (c, d) Normal melanocytes (NHM) viewed with (c) low and (d) high magnification contain primarily darkly pigmented late stage (stage IV) melanosomes. Bar: (a, c) 3 μm and (b, d) 1 μm. N = nucleus.
Figure 3. HPS-5 melanocytes contain more DOPA-positive small vesicles throughout the cells.
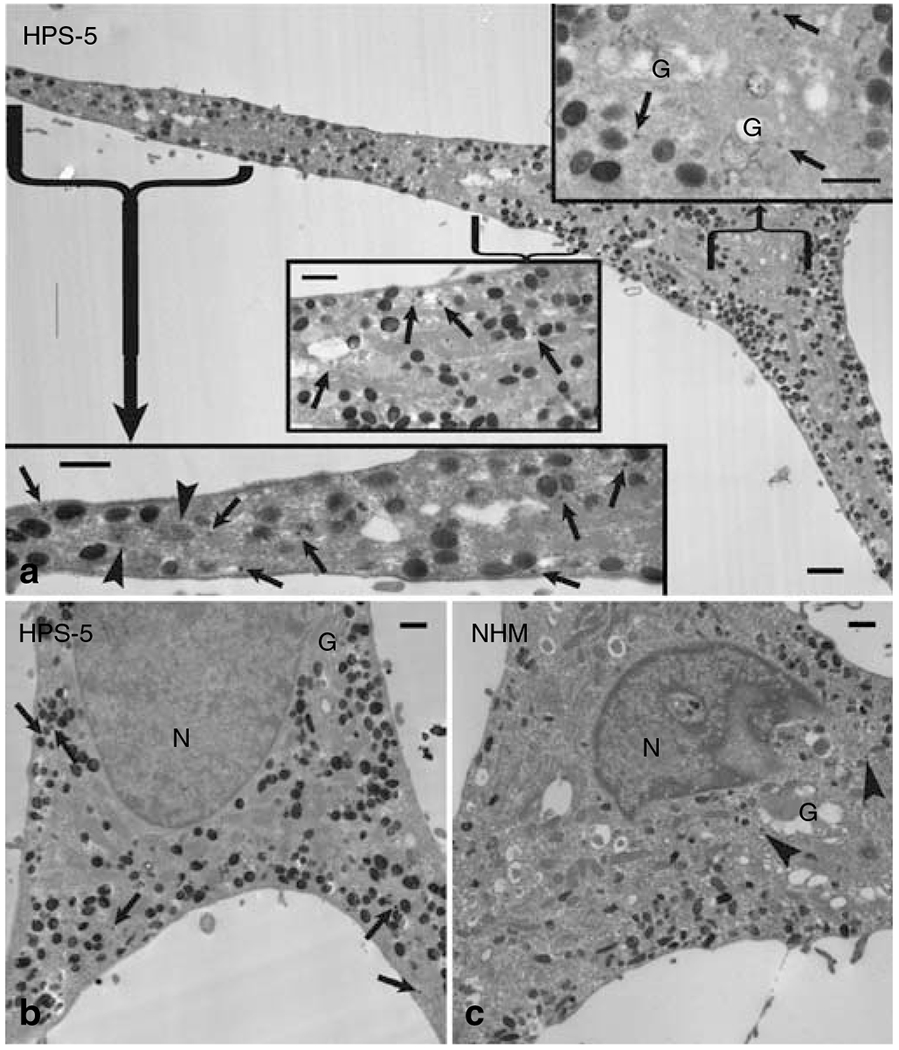
Demonstrated by electron microscopy DOPA histochemistry. (a) DOPA histochemistry in HPS-5 melanocytes reveals reaction product in the TGN (G) and in small (50–100 nm) vesicles (arrows) associated with the TGN and throughout the cell body and dendrites. A small number of melanosomes in HPS-5 melanocytes, notably in the dendrites, are devoid of DOPA reaction product (arrowheads). (b) DOPA histochemistry in the perinuclear region of an HPS-5 melanocyte. Reaction product is detected in small vesicles outside of the TGN (G) region (arrows). (c) DOPA histochemistry reveals reaction product in small vesicles in the TGN (G) region (arrowheads) of a normal human melanocyte, but not outside of this region. Bar: (a–c) 1.5 μm; (a) insets, 1 μm. N = nucleus.
Two different antibodies against TYRP1, the monoclonal antibody MEL5 and the polyclonal αPEP1, were used to localize the melanosomal protein TYRP1 in normal and HPS-5 melanocytes using immunoelectron microscopy. EM images of melanocytes labeled with αPEP1 are shown (Figures 4 and 5; MEL5 labeling yielded similar results (not shown)). More overall TYRP1 staining was observed in normal melanocytes (Figure 4a) compared with HPS-5 melanocytes (Figure 5a). Immunogold label was quantified on endosomal compartments and organelles, identified using morphological criteria (see Figure S1). The majority of TYRP1 in normal melanocytes (36% of total αPEP1 and 30% of total MEL5 labeling) was found in melanosomes with visible fibrillar structures (Figure 4c, arrows; Table 1). In addition, 12% of total MEL5 and 13% of total αPEP1 labeling was on early endosomes, and 26% of total MEL5 and 11% of total αPEP1 labeling was on late endosomes, lysosomes, and multivesicular bodies (Figure 4b; Table 1). HPS-5 melanocytes, in contrast, contained very little TYRP1 associated with melanosomes (3% of total MEL5 and 8% of total αPEP1 labeling; Figure 5; Table 1). The majority of TYRP1 label in HPS-5 melanocytes (68% of MEL5 and 44% of αPEP1) was on small vesicles, outside of the Golgi region (Figure 5b–d, arrows; Table 1). The same relative distribution of TYRP1 labeling was observed when all the TYRP1 particles in one normal cell were counted and then compared to an equal number of particles counted in multiple HPS-5 cells (data not shown).
Figure 4. TYRP1 localizes to melanosomes and endosomal structures in normal melanocytes.

Ultrathin cryosections of cultured normal melanocytes with immunogold labeling for TYRP1 using the rabbit polyclonal antibody αPEP1 (10 nm gold). (a) Normal melanocytes demonstrate abundant TYRP1 labeling on early endosomal structures (EE, arrows), small vesicles (asterisk), and melanosomes (M, arrowheads). (b) TYRP1 labeling localized to electron lucent early endosomal structures (EE, arrows) and early endosomes with some electron-dense content (EE, arrowheads). (c) TYRP1 labeling (arrows) localized to melanosomes (M) in a melanosome-rich peripheral area of the cell. The majority of melanosomes that have gold label are stage III, characterized by electron-dense melanin accumulation on the still visible fibrils. Bar = 530 nm. Mit = Mitochondrion.
Figure 5. TYRP1 localizes to small vesicles in HPS-5 melanocytes.

Ultrathin cryosections of cultured HPS-5 melanocytes with immunogold labeling for TYRP1 using the rabbit polyclonal antibody αPEP1 (10 nm gold). (a) HPS-5 melanocytes demonstrate minimal immunogold labeling for TYRP1 in a melanosome-rich dendritic area. Label is found on an electron-lucent early endosome (EE, arrowhead) and a small vesicle (arrow). (b) TYRP1 labeling in the perinuclear area of an HPS-5 melanocyte is mainly localized to small vesicles (arrows) that are not closely associated with the Golgi stacks (G). Some TYRP1 label is also found on Golgi stacks. (c) TYRP1 label close to but distinct from larger endosomes (arrows). (d) TYRP1 labeling on small vesicles in the cell periphery (arrows). Bar = 530 nm. Mit = Mitochondrion; N = Nucleus.
Table 1.
Distribution of TYRP1 in normal and HPS-5 melanocyte organelles, using immunoEM
| Intracellular compartment | Particles detected by MEL5 labeling (%)1 | Particles detected by αPEP1 labeling (%)2 | ||
|---|---|---|---|---|
| Normal | HPS-5 | Normal | HPS-5 | |
| Melanosomes | 52 (30) | 1 (3) | 42 (36) | 4 (8) |
| Small vesicles not in the Golgi region | 30 (17) | 26 (68) | 19 (16) | 22 (44) |
| Golgi stacks and associated vesicles | 14 (8) | 0 (0) | 23 (19) | 5 (10) |
| Early endosomes | 21 (12) | 2 (5) | 15 (13) | 3 (6) |
| Late endosomes, MVBs, lysosomes | 45 (26) | 5 (13) | 13 (11) | 11 (22) |
| Small tubules | 12 (7) | 4 (11) | 6 (5) | 5 (10) |
| Total | 174 (100) | 38 (100) | 118 (100) | 50 (100) |
HPS-5, Hermansky-Pudlak syndrome 5; MVBs, multivesicular bodies.
A total of six normal and four HPS-5 cells labeled with MEL5 were scored. Percentage of total is indicated in parenthesis.
Five normal and six HPS-5 cells labeled with αPEP1 were scored. Percentage of total is indicated in parenthesis.
Relative abundance of TYRP1
One striking finding in both the western analysis and immunoEM studies was the marked reduction of TYRP1 staining in HPS-5 melanocytes relative to control. Confocal images taken at low magnification (under identical staining and imaging conditions) also demonstrated the reduced intensity of TYRP1 (MEL5) staining (Figure 6a and d) in untreated HPS-5 cells, supporting immunoblotting and immunoEM findings (Figures 1b and 5a). The reduced staining suggests that there is increased degradation of TYRP1 in HPS-5 melanocytes. To determine the site of TYRP1 degradation, inhibitors of lysosomal function (i.e., the protonophore monensin) and proteasomal function (i.e., MG132) were used. Incubation of HPS-5 melanocytes with 5 μm monensin for 3 hours greatly increased MEL5 staining (Figure 6e), but incubation with 0.5 μm MG132 for 3 hours did not (Figure 6f). Normal melanocytes showed a slight increase in MEL5 staining upon treatment with monensin or MG132 (Figure 6b and c).
Figure 6. TYRP1 is subject to increased lysosomal degradation in HPS-5 melanocytes.

Confocal images were taken at low magnification under identical staining and imaging conditions. Bar, 50 μm. (a) TYRP1 (MEL5) staining in normal untreated melanocytes. (b) TYRP1 staining is slightly increased in normal melanocytes treated with 5 μm monensin for 3 hours. (c) Treatment of normal melanocytes with 0.5 μm MG132 for 3 hours does not alter the intensity of TYRP1 staining. (d)TYRP1 staining is reduced in untreated HPS-5 melanocytes, particularly in the dendrites and tips. (e) HPS-5 melanocytes treated with 5 μm monensin (an inhibitor of lysosomal function) for 3 hours show marked increase in TYRP1 staining, predominantly in the perinuclear area. (f) Incubation with 0.5 μm MG132 for 3 hours has minimal effect on the intensity of TYRP1 staining in HPS-5 melanocytes. Bar = 50 μm.
Distribution of melanosomal proteins
Immunofluorescence confocal microscopy was used to assess the relative distribution of endogenous melanosomal proteins in normal and HPS-5 melanocytes. Normal melanocytes stained with MEL5 antibodies (recognizing TYRP1) exhibited a vesicular pattern throughout the cell with a concentration of MEL5-positive vesicles along the dendrites and in the tips (Figure 7a, right panel). HPS-5 melanocytes lacked this concentration of MEL5-positive vesicles in the dendrites and tips; the majority of MEL5 staining was in the perinuclear area (Figure 7b, right panel). No substantial differences in Pmel17 distribution, visualized with either antibody HMB45 (Figure 7c and d and right panels) or antibody HMB50 (not shown), were observed in HPS-5 melanocytes relative to normal melanocytes.
Figure 7. TYRP1 is abnormally distributed in HPS-5 melanocytes.

Immunofluorescence confocal microscopy shows endogenous melanosomal proteins in fixed normal and HPS-5 melanocytes. Cells were co-stained with BODIPY 558/568 phalloidin (red; actin stain) to visualize the cell boundary, TO-PRO-3 (blue) to stain the nucleus, and specific antibodies, as indicated (green). These images were acquired with non-uniform settings to achieve maximal signal intensity without saturation. To quantify the differences in MEL5 (TYRP1) staining between HPS-5 and normal melanocytes, randomly selected fields of stained cells were imaged and then scored by three independent observers in a blinded fashion. Normal melanocytes displayed increased MEL5 staining in the tips compared with the cell body significantly more often than did HPS-5 cells. Representative low magnification fields are shown; higher magnification images are included (right panels) to show details. (a) Normal melanocytes stained with MEL5 antibodies (recognizing TYRP1) exhibit a vesicular pattern throughout the cell with a concentration of MEL5-positive vesicles along the dendrites and in the tips. (b) HPS-5 melanocytes demonstrate primarily perinuclear staining with MEL5. (c) Normal melanocytes show Pmel17 (HMB45) staining in a vesicular pattern throughout the cell body, extending into the dendrites and tips. (d) HPS-5 melanocytes display the same, normal pattern of Pmel17 staining. Bar = 10 μm.
The degree to which MEL5 staining was reduced in the tips and dendrites of HPS-5 cells was variable. Therefore, to quantify the differences in TYRP1 distribution between HPS-5 and normal melanocytes, randomly selected fields of MEL5-stained cells were imaged and then scored by three independent observers in a blinded fashion. Representative fields are shown in Figure 7a and b (left panels); several of such fields were counted for each cell strain. Means of the three evaluations were calculated and analyzed by Student’s t-test. MEL5 staining (green) in the tips was found to be as bright as or brighter than that in the cell body in 77% of the 39 normal melanocytes evaluated (Figure 7a, left panel), compared with only 27% of 42 HPS-5 cells (Figure 7b, left panel). This difference was found to be statistically significant (P⩽ 0.002).
Compartments containing melanogenic proteins were examined further in normal and HPS-5 melanocytes. Co-staining of endogenous tyrosinase (red) and MEL5 (TYRP1; green) in normal melanocytes revealed co-localization of these two proteins (merge; yellow) to a large extent in the perinuclear area and in the tips (Figure 8a). In contrast, less co-localization of tyrosinase (red) and MEL5 (green) was observed in HPS-5 melanocytes (Figure 8b), particularly in the tips (Figure 8b, inset). Likewise, co-localization of tyrosinase (red) with Pmel17 (HMB45; green) was evident in normal melanocytes, most notably in the tips (Figure 8c), but was greatly reduced in HPS-5 melanocytes (Figure 8d).
Figure 8. HPS-5 melanocytes demonstrate reduced co-localization of tyrosinase with either TYRP1 or Pmel17.
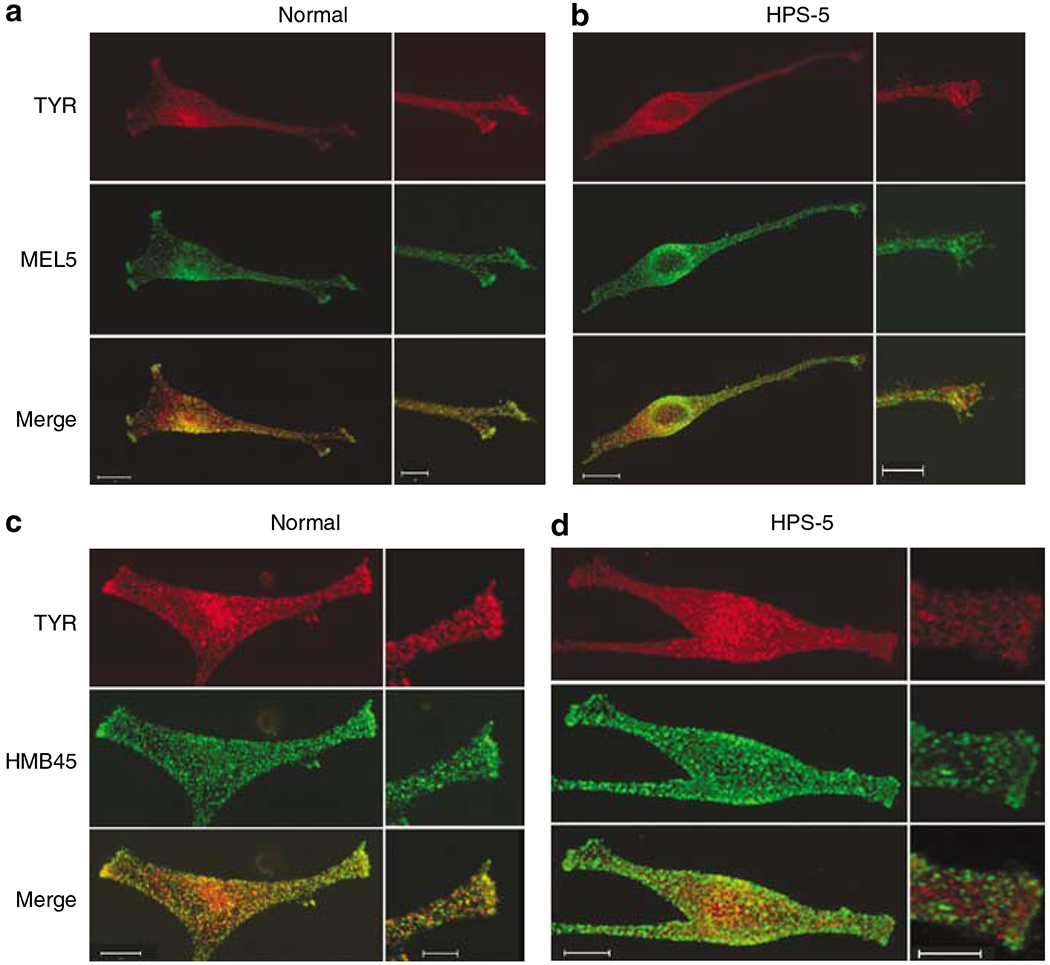
(a) Co-staining of endogenous tyrosinase (red) and TYRP1 (MEL5; green) in normal melanocytes revealed co-localization of these two proteins (merge; yellow) to a large extent in the perinuclear area and in the tips (inset). (b) Less co-localization of tyrosinase (red) and TYRP1 (MEL5; green) was observed in HPS-5 melanocytes, particularly in the tips (inset). (c) Co-localization of tyrosinase (red) with Pmel17 (HMB45; green) was evident in normal melanocytes, most notably in the tips (inset). (d) Co-localization of tyrosinase and Pmel17 was greatly reduced in HPS-5 melanocytes. Bar: (a–d) 10 μm; insets 5 μm.
DISCUSSION
The exact pathological mechanism responsible for the hypopigmentation of HPS-5 melanocytes has not been determined. HPS-5 patients are extremely unusual (Zhang et al., 2003; Huizing et al., 2004), so the availability of human melanocytes cultured from an HPS-5 patient presented a unique opportunity to investigate this topic. We first showed that HPS-5 melanocytes have an approximately normal contingent of the melanogenic protein, tyrosinase, based upon both Western blotting (Figure 1c) and modestly increased in vitro enzyme activity (Figure 1e). In contrast, the assay for in vivo tyrosine hydroxylase activity, which requires that the enzyme be properly localized to melanosomes, showed negligible activity in HPS-5 melanocytes (Figure 1d). In fact, DOPA histochemistry for tyrosinase demonstrated that the enzyme was present in small vesicles but was deficient in the proper compartment, that is, the melanosome (Figure 3).
Studies of another melanogenic protein, TYRP1, yielded similar results, except that the total amount of this protein was reduced in HPS-5 melanocytes (Figure 1b). TYRP1 localized predominantly to small vesicles throughout the cell, rather than to melanosomes and endosomal structures (Figure 5). Immunofluorescence further revealed a marked paucity of TYRP1 in HPS-5 melanocytes, particularly in the dendrites and tips (Figures 6d, 7b, and 8b). The decrement in TYRP1 is most likely due to degradation in lysosomes as opposed to proteasomes, as treatment with the lysosomal pH inhibitor monensin increased TYRP1 staining (Figure 6). In contrast to the abnormal distribution of tyrosinase and TYRP1, the early melanosomal marker, Pmel17, appeared to localize normally in HPS-5 melanocytes. Pmel17, which provides a matrix for melanin production within melanosomes, decorated the dendrites and tips of HPS-5 melanocytes in a normal fashion (Figure 7d). The cell biological findings for HPS-5 melanocytes closely resemble those previously reported for HPS-3 melanocytes (Boissy et al., 2005). Specifically, HPS-3 melanocytes displayed reduced in vivo tyrosinase activity, increased in vitro tyrosinase activity (relative to lightly pigmented control melanocytes), abundant DOPA-positive small vesicles throughout the cells, a reduced number of mature stage IV melanosomes, and a normal distribution of Pmel17 (Boissy et al., 2005). The similarity of cell biological phenotypes for HPS-5 and HPS-3 melanocytes reflects the interaction of the HPS5 and HPS3 proteins, along with HPS6, in BLOC-2 (Zhang et al., 2003; Di Pietro et al., 2004; Gautam et al., 2004).
The combined HPS-5 and HPS-3 studies suggest that in the absence of functional BLOC-2, early-stage I/II melanosomes, marked by Pmel17, are formed normally; however, they fail to receive a normal contingent of melanogenic proteins to allow maturation to later stages. TYRP1 fails to be sorted appropriately to maturing stage II/III melanosomes, as is the case in normal melanocytes, and is subsequently degraded in lysosomes. Tyrosinase largely avoids such a fate possibly due to the resistance of tyrosinase to degradation, or because tyrosinase and TYRP1 are capable of employing distinct pathways to reach melanosomes, as previously suggested (Huizing et al., 2001; Raposo et al., 2001; Theos et al., 2005).
Recent studies have demonstrated the presence of BLOC-2 components on EEA1-positive tubulovesicular endosomes and increased cycling of TYRP1 via the cell membrane in BLOC-2-deficient cells (Di Pietro et al., 2006). Taken together, these data support a model in which BLOC-2 functions in sorting a subset of melanosomal proteins into transport vesicles at the early endosome. In BLOC-2-deficient cells, these proteins are not segregated into specialized vesicles and directed towards melanosomes. Instead they cycle between endosomes and the cell membrane and are ultimately degraded in lysosomes. Increased TYRP1 trafficking between endosomes and the cell membrane in BLOC-2-deficient cells may explain the observed localization of TYRP1 to small vesicles. We cannot, however, exclude the possibility that BLOC-2 functions in the trafficking or fusion of these vesicles with maturing melanosomes. Further studies will be necessary to understand exactly how BLOC-2 and each of its components facilitate melanogenic protein trafficking.
MATERIALS AND METHODS
Patients and cells
Normal human primary epidermal melanocytes were purchased from Cascade Biologics (Portland, OR). HPS-5 primary epidermal melanocytes were obtained from a forearm skin biopsy and cultured as previously described (Naeyaert et al., 1991; Smit et al., 1998). HPS-5 patient HPS106-5 was enrolled in a protocol approved by the National Human Genome Research Institute Institutional Review Board to study the clinical and molecular aspects of HPS; written informed consent was obtained. The study was conducted according to the Declaration of Helsinki Principles. This HPS-5 patient is compound heterozygous for a frameshift mutation in exon 18 and a nonsense mutation (R865X), resulting in markedly decreased HPS5 RNA on Northern blot (Huizing et al., 2004).
Western blots
Equivalent amounts of total protein, as determined by BCA assay (Pierce Biotechnology, Rockford, IL), from two lightly pigmented normal melanocyte strains and HPS-5 patient melanocytes (50 μg) were loaded onto SDS-PAGE gels and immunoblotted with polyclonal antibodies raised in rabbits against an HPS5 peptide (TEREKFWKIGNKERDGEY; Quality Controlled Biochemicals, Hopkinton, MA). Proteins were detected on immunoblot using goat polyclonal TYRP1 and mouse monoclonal tyrosinase antibodies (Santa Cruz Biotechnology, Santa Cruz, CA). Monoclonal α-tubulin antibodies were used as a loading control (Calbiochem, San Diego, CA). Blots were incubated with appropriate HRP-conjugated secondary antibodies (1:10,000; Amersham Biosciences, Piscataway, NJ) and results were visualized with enhanced chemiluminescence (ECL Western Blotting Detection Reagents, Amersham Biosciences, Piscataway, NJ) and exposure to CL-XPosure film (Pierce Biotechnology).
Tyrosinase activity
Endogenous (i.e., in vitro) and functional (i.e., in vivo) tyrosinase activity was assayed as previously described (Zhao and Boissy, 1994). For the in vitro assay, lysates from solubilized melanocytes were incubated in 250 μl of reaction mixture containing 10–25 μg of protein, 0.08 mm l-DOPA, 0.08 mm tyrosine, and 8 μCi/ml of (3 hours) tyrosine at 37°C for 1 hour. For the in vivo assay, intact cultured melanocytes were incubated in medium containing 1 μCi/ml (3 hours) tyrosine (specific activity, 54.2 Ci/mmol) for 24 hours. Duplicate aliquots of lysate/reaction mixture (250 μl) or medium (1 ml), respectively, were mixed with an equal volume of 10% (w/v) activated charcoal in 0.2 n citric acid. The samples were centrifuged at 2500 r.p.m and the supernatants were passed over a Dowex ion-exchange column followed by a wash of 0.1 n citric acid. Radioactivity of the eluate was counted in a liquid scintillation analyzer. Tyrosinase activity was expressed as dpm/mg protein.
DOPA histochemistry and electron microscopy
Melanocyte cultures from a control and an HPS-5 individual, maintained in regular MCDB-153 growth medium, were seeded into Lab-Tek chamber slides (Nunc Inc., Naperville, IL) coated with 1% pig gelatin and grown to 90% confluence. Melanocytes were fixed with half-strength Karnovsky’s fixative (Karnovsky, 1965) in 0.2 m sodium cacodylate buffer at pH 7.2 for 30 minutes at room temperature. For DOPA histochemistry, fixed cells were incubated in a 0.1% solution of l-DOPA twice for 2.5 hours. The cells were washed three times in buffer and treated with 1.0% osmium tetroxide containing 1.5% potassium ferrocyanide (Karnovsky, 1971) for 30 minutes. The cells were washed, stained en bloc with 0.5% uranyl acetate for 30 minutes, dehydrated, and embedded in Eponate 12. Areas of the Epon cast were cut out and mounted on Epon pegs and sectioned on an RMC MT 6,000-XL ultramicrotome. Ultrathin sections were stained with aqueous solutions of uranyl acetate (2%) and lead citrate (0.3%) for 15 minutes each and then viewed and photographed in a JEOL 1,230 transmission electron microscope. All tissue-processing supplies were purchased from Ted Pella Inc. (Tustin, CA).
Immunoelectron microscopy
Primary human epidermal melanocytes were fixed for 2 hours at room temperature in 2% formaldehyde with 0.2% glutaraldehyde in 0.1 m phosphate buffer. After washing in PBS, the cells were pelleted and embedded in 12% gelatin. The pellet was divided into 1-mm3 cubes, cryoprotected in 2.3 m sucrose, and snap frozen in liquid nitrogen. Ultra-thin cryosections were labelled with polyclonal PEP-1 (kindly provided by Dr Vincent Hearing, NIH, MD) or MEL-5 antibody (Signet Laboratories, Dedham, MA), and secondary labelling was performed with a rabbit anti-mouse IgG bridging antibody (Aurion, The Netherlands) and 10 nm protein A-gold particles (Aurion, The Netherlands). Sections were contrasted with uranyl acetate and analyzed by a Philips electron microscope.
Fluorescence microscopy
Melanocytes were grown overnight on glass slides and fixed in 3% paraformaldehyde. For studies of lysosome and proteasome inhibitors, cells were incubated in culture media containing either 5 μm monensin or 0.5 μm MG132 (Sigma-Aldrich, St Louis, MO) for 3 hours before fixation. The slides were blocked in PBS containing 0.1% saponin, 100 μm glycine, 0.1% BSA, and 2% donkey serum then incubated with the following mouse monoclonal antibodies (1:200 dilution): MEL-5 (Signet Laboratories, Dedham, MA), HMB45, and HMB50 (Lab Vision, Fremont, CA). For single antibody stainings, cells were co-stained with BODIPY 558/568 phalloidin to visualize the cell boundary and TO-PRO-3 to stain the nucleus (Invitrogen, Carlsbad, CA). For double antibody stainings, rabbit polyclonal tyrosinase was used (1:50 dilution; a kind gift of Dr Vincent Hearing, NIH, MD). The cells were washed and incubated with donkey anti-mouse antibodies conjugated to ALEXA-488 and/or anti-rabbit conjugated to ALEXA-555 (Invitrogen), washed again, and mounted in VectaShield (Vector Laboratories, Burlingame, CA). Cells were imaged with a Zeiss 510 META confocal laser-scanning microscope (Carl Zeiss, Microimaging Inc., Germany). All images are one-dimensional projections of confocal z-sections, with the exception of the dual stained tip insets in Figure 7, which are single z-sections to assess co-localization.
Supplementary Material
Figure 1. Morphological characterization of organelles and endosomal structures present in melanocytes.
Figure 2. Quantitative analysis of TYRP1 distribution in normal and HPS-5 melanocytes.
ACKNOWLEDGMENTS
This study was supported by the Intramural Research Program of the National Human Genome Research Institute, National Institutes of Health. Excellent technical support was provided by Mariam Ayub, Richard Hess, Elizabeth Erickson, and Andrew Jeong.
Abbreviations:
- BLOC-2
biogenesis of lysosome-related organelles complex-2
- HPS
Hermansky–Pudlak syndrome
- TGN
trans-Golgi network
Footnotes
CONFLICT OF INTEREST
The authors state no conflict of interest.
REFERENCES
- Anikster Y, Huizing M, White J, Shevchenko YO, Fitzpatrick DL, Touchman JW et al. (2001) Mutation of a new gene causes a unique form of Hermansky–Pudlak syndrome in a genetic isolate of central Puerto Rico. Nat Genet 28:376–80 [DOI] [PubMed] [Google Scholar]
- Boissy R, Richmond B, Huizing M, Helip-Wooley A, Zhao Y, Koshoffer A et al. (2005) Melanocyte-specific proteins are aberrantly trafficked in melanocytes of Hermansky–Pudlak syndrome-type 3. Am J Pathol 165:231–40 [DOI] [PMC free article] [PubMed] [Google Scholar]
- Bonifacino J (2004) Insights into the biogenesis of lysosome-related organelles from the study of the Hermansky–Pudlak syndrome. Ann NY Acad Sci 1038:103–14 [DOI] [PubMed] [Google Scholar]
- Chiang PW, Oiso N, Gautam R, Suzuki T, Swank RT, Spritz RA (2003) The Hermansky–Pudlak syndrome 1 (HPS1) and HPS4 proteins are components of two complexes, BLOC-3 and BLOC-4, involved in the biogenesis of lysosome-related organelles. J Biol Chem 278:20332–7 [DOI] [PubMed] [Google Scholar]
- Di Pietro S, Dell’Angelica E (2005) The cell biology of Hermansky–Pudlak syndrome: recent advances. Traffic 6:525–33 [DOI] [PubMed] [Google Scholar]
- Di Pietro S, Falcon-Perez J, Dell’Angelica E (2004) Characterization of BLOC-2, a complex containing the Hermansky–Pudlak syndrome proteins HPS3, HPS5 and HPS6. Traffic 5:276–83 [DOI] [PubMed] [Google Scholar]
- Di Pietro S, Falcon-Perez J, Tenza D, Setty S, Marks M, Raposo G et al. (2006) BLOC-1 interacts with BLOC-2 and the AP-3 complex to facilitate protein trafficking on endosomes. Mol Biol Cell 17:4027–38 [DOI] [PMC free article] [PubMed] [Google Scholar]
- Gahl WA, Brantly M, Kaiser-Kupfer MI, Iwata F, Hazelwood S, Shotelersuk V et al. (1998) Genetic defects and clinical characteristics of patients with a form of oculocutaneous albinism (Hermansky–Pudlak syndrome). N Engl J Med 338:1258–64 [DOI] [PubMed] [Google Scholar]
- Gautam R, Chintala S, Li W, Zhang Q, Tan J, Novak EK et al. (2004) The Hermansky–Pudlak syndrome 3 (cocoa) protein is a component of the biogenesis of lysosome-related organelles complex-2 (BLOC-2). J Biol Chem 279:12935–42 [DOI] [PubMed] [Google Scholar]
- Hermansky F, Pudlak P (1959) Albinism associated with hemorrhagic diathesis and unusual pigment reticular cells in the bone marrow: report of two cases with histochemical studies. Blood 14:162–9 [PubMed] [Google Scholar]
- Huizing M, Boissy R, Gahl W (2002) Hermansky–Pudlak syndrome: vesicle formation from yeast to man. Pig Cell Res 15:405–19 [DOI] [PubMed] [Google Scholar]
- Huizing M, Hess R, Dorward H, Claassen D, Helip-Wooley A, Kleta R et al. (2004) Cellular, molecular and clinical characterization of patients with Hermansky–Pudlak syndrome type 5. Traffic 5:711–22 [DOI] [PubMed] [Google Scholar]
- Huizing M, Sarangarajan R, Strovel E, Zhao Y, Gahl WA, Boissy RE (2001) AP-3 mediates tyrosinase but not TRP-1 trafficking in human melanocytes. Mol Biol Cell 12:2075–85 [DOI] [PMC free article] [PubMed] [Google Scholar]
- Karnovsky MJ (1965) A formaldehyde-glutaraldehyde fixative of high osmolality for use in electron microscopy. J Cell Biol 27:137 [Google Scholar]
- Karnovsky MJ (1971) Use of ferrocyanide-reduced osmium tetroxide in electron microscopy. J Cell Biol 51:146 [Google Scholar]
- King R, Hearing V, Creel D, Oetting W (2001) Albinism. In: The metabolic and molecular bases of inherited disease. (Scriver C, Beaudet A, Valle D, Sly W, eds), New York: McGraw-Hill, 558–627 [Google Scholar]
- Li W, Zhang Q, Oiso N, Novak E, Gautam R, O’Brien E et al. (2003) Hermansky–Pudlak syndrome type 7 (HPS-7) results from mutant dysbindin, a member of the biogenesis of lysosome-related organelles complex 1 (BLOC-1). Nat Genet 35:84–9 [DOI] [PMC free article] [PubMed] [Google Scholar]
- Martina J, Moriyama K, Bonifacino J (2003) BLOC-3, a protein complex containing the Hermansky–Pudlak syndrome gene products HPS1 and HPS4. J Biol Chem 278:29376–84 [DOI] [PubMed] [Google Scholar]
- Morgan NV, Pasha S, Johnson CA, Ainsworth JR, Eady RAJ, Dawood B et al. (2006) A germline mutation in BLOC1S3/reduced pigmentation causes a novel variant of Hermansky–Pudlak syndrome (HPS8). Am J Hum Genet 78:160–6 [DOI] [PMC free article] [PubMed] [Google Scholar]
- Naeyaert J, Eller M, Gordon P, Park H, Gilchrest B (1991) Pigment content of cultured human melanocytes does not correlate with tyrosinase message level. Br J Dermatol 125:297–303 [DOI] [PubMed] [Google Scholar]
- Nazarian R, Falcon-Perez J, Dell’Angelica E (2003) Biogenesis of lysosome-related organelles complex 3 (BLOC-3): a complex containing the Hermansky–Pudlak syndrome (HPS) proteins HPS1 and HPS4. Proc Natl AcadSci USA 100:8770–5 [DOI] [PMC free article] [PubMed] [Google Scholar]
- Raposo G, Tenza D, Murphy D, Berson J, Marks M (2001) Distinct protein sorting and localization to premelanosomes, melanosomes, and lysosomes in pigmented melanocytic cells. J Cell Biol 152:809–24 [DOI] [PMC free article] [PubMed] [Google Scholar]
- Simon JW, Adams RJ, Calhoun JH, Shapiro SS, Ingerman CM (1982) Ophthalmic manifestations of the Hermansky–Pudlak syndrome (oculocutaneous albinism and hemorrhagic diathesis). Am J Ophthal 93:71–7 [DOI] [PubMed] [Google Scholar]
- Smit N, Kolb R, Lentjesm E, Noz K, van der Meulen H, Koerten H et al. (1998) Variations in melanin formation by cultured melanocytes from different skin types. Arch Dermatol Res 290:342–9 [DOI] [PubMed] [Google Scholar]
- Summers CG, Knobloch WH, Witkop CJ Jr, King RA (1988) Hermansky—Pudlak syndrome. Ophthalmic findings. Ophthalmology 95:545–54 [DOI] [PubMed] [Google Scholar]
- Theos A, Tenza D, Martina J, Hurbain I, Peden A, Sviderskaya E et al. (2005) Functions of adaptor protein (AP)-3 and AP-1 in tyrosinase sorting from endosomes to melanosomes. Mol Biol Cell 16:5356–72 [DOI] [PMC free article] [PubMed] [Google Scholar]
- Wei M (2006) Hermansky–Pudlak syndrome: a disease of protein trafficking and organelle function. Pig Cell Res 19:19–42 [DOI] [PubMed] [Google Scholar]
- Witkop CJ, Krumwiede M, Sedano H, White JG (1987) Reliability of absent platelet dense bodies as a diagnostic criterion for Hermansky–Pudlak syndrome. Am J Hematol 26:305–11 [DOI] [PubMed] [Google Scholar]
- Zhao H, Boissy RE (1994) Distinguishing between the catalytic potential and apparent expression of tyrosinase activities. Am J Med Sci 308:322–30 [DOI] [PubMed] [Google Scholar]
- Zhang Q, Zhao B, Li W, Oiso N, Novak EK, Rusiniak ME et al. (2003) Ru2 and Ru encode mouse orthologs of the genes mutated in human Hermansky–Pudlak syndrome types 5 and 6. Nat Genet 33:145–53 [DOI] [PubMed] [Google Scholar]
Associated Data
This section collects any data citations, data availability statements, or supplementary materials included in this article.
Supplementary Materials
Figure 1. Morphological characterization of organelles and endosomal structures present in melanocytes.
Figure 2. Quantitative analysis of TYRP1 distribution in normal and HPS-5 melanocytes.