Abstract
Purpose: Because of its diagnostic and prognostic value, right ventricular strain assessed by speckle-tracking imaging (RVS) has been incorporated into echocardiographic guidelines. However, it suffers from limitations including the need of good image quality and of dedicated software with inter-vendor variability. We hypothesized that RV free wall longitudinal fractional shortening (LFS) could be used as a substitute to RVS, without suffering from the aforementioned limitations. Methods: We aimed to establish in a series of non-selected consecutive patients in sinus rhythm the value of LFS, calculated as [-(TAPSE/RVdiastolic length)] and of several common echocardiographic and Doppler parameters to predict an abnormal RV function, defined as RVS > − 20.2%. Results: Among 144 consecutive patients, poor image quality precluded the assessment of RVS and of LFS in 31 and 4 patients, respectively (P = 0.0018), resulting in a final study group of 113 patients. The intraclass correlation coefficients for inter- and intra-observer variability were 0.97 (95% CI 0.92; 0.98) and 0.93 (CI 0.92; 0.98) for LFS and RVS, respectively. Among all tested RV function indices, LFS best correlated with RVS (R 0.97, 95% CI 0.81; 0.91). Bland–Altman analysis for the comparison between LFS and RVS showed no systematic bias. The area under the ROC-curve of the various RV function indices to detect abnormal RVS was best for LFS (0.97, 95% CI 0.94–1), with sensitivity, specificity, negative and positive predictive value of 83%, 96%, 96%, and 83%, respectively. Conclusion: LFS performs reasonably well to predict abnormal RVS and is more often feasible than RVS.
Keywords: Right ventricular function, Speckle tracking, Echocardiography, Strain imaging
Introduction
Right ventricular (RV) function has important diagnostic, prognostic, and therapeutic implications in a wide range of cardiac conditions [1]. However, its assessment is challenging due to the complex geometric shape of the RV, the available imaging windows and the difficulties to differentiate active from passive movement and therefore to assess intrinsic myocardial performance. Conventional echocardiographic indices of RV systolic function include tricuspid annular plane systolic excursion (TAPSE), tricuspid S wave velocity, RV myocardial performance index (RV Tei index), and RV fractional area change (FAC).
Longitudinal strain is a dimensionless parameter measuring myocardial deformation whose value to assess RV function has recently emerged. It represents the percentage change in longitudinal myocardial length during systole in comparison to its end-diastolic dimension, and can be assessed by both tissue Doppler imaging and speckle-tracking echocardiography, with the latter showing the advantages of angle-independency and better reproducibility. RV strain highly correlates with cardiac magnetic resonance imaging-derived RV ejection fraction [2] and provides an independent prognostic value in various clinical conditions [3–9]. Impaired RV free wall longitudinal strain identifies higher rates of RV dysfunction and is associated with worse outcome than conventional echocardiographic parameters of RV systolic function [6, 10]. In addition, its prognostic value is incremental to TAPSE and RV FAC [10]. Therefore, strain has now been incorporated into echocardiographic guidelines for the assessment of RV systolic function [11, 12].
However, RV strain analysis using two-dimensional speckle tracking analysis suffers several limitations. Image quality is a fundamental albeit frequently unmet requirement for strain imaging, particularly in patients with obesity or lung diseases. Moreover, it requires dedicated software, which is not available on all echocardiographic platforms. In addition, despite the recent efforts of a joint standardization task force [11], inter-vendor variability in strain estimates remains an issue, resulting in the restrictive recommendation to use the same machine and software to measure strain values in consecutive echocardiographic examinations, or, alternatively, to use vendor-independent analyzing software.
Longitudinal fractional shortening (LFS) of the RV free wall is calculated as the ratio of TAPSE to RV end-diastolic length obtained by two-dimensional echocardiography [13]. It is easily obtainable by conventional echocardiography, without the need of dedicated software. Since both RV free wall longitudinal strain (RVS) and LFS reflect the percentage change in RV free wall length, we hypothesized that LFS could be used as a substitute of RVS. Therefore, we sought to establish the value of LFS along with several commonly used echocardiographic parameters of RV function to predict impaired RVS in a series of non-selected consecutive patients undergoing echocardiography.
Patients and methods
Patients
The ethics committee of the CHU Saint-Pierre approved the study. One hundred and forty-four consecutive adult patients (≥ 18 year-old) in sinus rhythm referred to the echocardiographic laboratory of Saint-Pierre University Hospital were included.
Echocardiographic examination
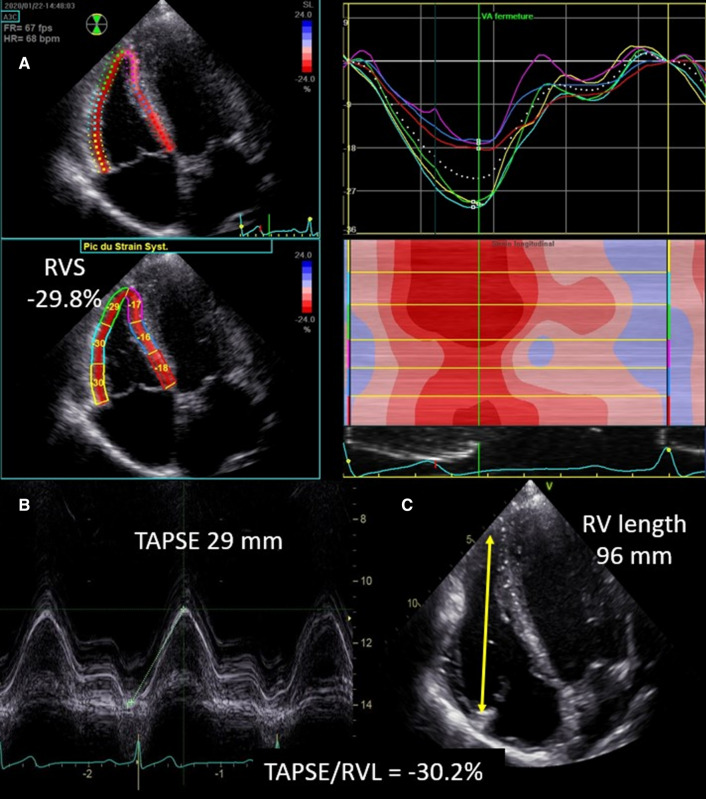
Transthoracic echocardiographic examinations with Doppler studies were performed using a Vivid E95 platform (GE Vingmed, Horten, Norway) according to the guidelines and standard recommendations of the European Association of Cardiovascular Imaging and the American Society of Echocardiography [11, 14]. The echocardiographic images required to assess RVS were obtained from a modified apical four chamber view to allow the best view possible of the RV free wall (RV focused apical four chamber view) (Fig. 1). This view was obtained by moving the transducer laterally with slight rotation to obtain the maximal diameter across the base of the RV. Images and loop were stored digitally and analyzed offline using EchoPac 2.02 software (GE Healthcare). Briefly, after manual tracing, the end-systolic RV endocardial border, a region of interest (ROI) was automatically generated; its width and position were manually adjusted to include the entire myocardial wall and to exclude the pericardium. Pulmonary valve closure was identified on Doppler tracing of the RV outflow tract. The software automatically divides the RV free wall and the interventricular septum in three segments each (basal, mid, and apical); the septal segments were discarded from the analysis. The quality of the tracking was automatically validated by the software and confirmed visually from the 2D images. RV free wall longitudinal strain was defined as the arithmetic mean of the strain values in the three segments of RV free wall [15, 16]. Frame rates between 55 and 110 frames/s were accepted for RV deformation imaging. Abnormal RV systolic function was defined by RVS > − 20.2%, as suggested by Badano et al. [17]. LFS was calculated as [LFS = –(TAPSE/RVdiastolic length)], where TAPSE and RV diastolic length are obtained using the apical four chamber view or the modified apical four chamber view when the latter view was inconclusive (Fig. 1). Therefore, higher values of both RVS and LFS refer throughout this manuscript to reduced RV function. TAPSE was measured by aligning the M-mode cursor parallel with the RV free wall at the level of the tricuspid annulus. RV length was measured from an end-diastolic two-dimensional still frame from the outer part of apex to the tricuspid annulus in the apical four chamber view. S’ wave of the tricuspid annulus was obtained using Tissue Doppler Imaging. Tei index was obtained using pulsed wave Tissue Doppler Imaging of the lateral tricuspid annulus (calculated as the sum of the isovolumic contraction time and the isovolumic relaxation time divided by the ejection time). RV fractional area change (FAC) was calculated from the apical four-chamber view using the percentage change in areas of the end-diastolic and end-systolic areas of the RV.
Fig. 1.
Assessment of right ventricular free-wall-strain using speckle-tracking imaging (Panel A). Assessment of longitudinal fractional shortening (Panels B and C). Right ventricular longitudinal fractional shortening corresponds to minus the ratio of tricuspid annular plane systolic excursion (TAPSE, Panel B) and right ventricular end-diastolic free wall length (Panel C)
Statistical analysis
Spearman correlation coefficients were calculated to assess associations between RV echocardiographic parameters and RVS. Receiver operating characteristic curves were created for determining the diagnostic performance of LFS, tricuspid S wave, FAC, and TAPSE to predict abnormal RVS. Fisher’s exact test was used to compare proportions. Bland–Altman plots were analyzed to assess the presence or absence of systematic bias if LFS was considered as a substitute for RVS. A P value < 0.05 was considered statistically significant. Analysis of images for 30 randomly selected patients was repeated by the same observer (PU) at 2 different time points to test intra-observer variability of LFS assessment and also performed by another observer (ADC) to test the inter-observer variability. This was done with the calculation of intraclass correlation coefficients. Both readers were blind to the results of the first analysis.
Statistical analysis was performed using SAS v9.4.
Results
The indications for performing the echocardiography were: valvular heart disease (19%), ischemic heart disease (18%), heart failure and left ventricular dysfunction (16%), hypertension (9%), pulmonary embolism (6%), chest pain, palpitations or dyspnea (19%), cardio-oncology (5%), and miscellaneous (27%). The total is > 100% because of multiple indications in some patients.
Feasibility
Among the included 144 consecutive patients, poor image quality precluded the assessment of RVS in 27 patients (18.8%), and of both RVS and LFS in 4 additional patients (2.8%), resulting in a final study group of 113 patients (Fig. 2). Thus, feasibility of LFS and of RVS were 97.2% and 78.5%, respectively (P = 0.0018).
Fig. 2.
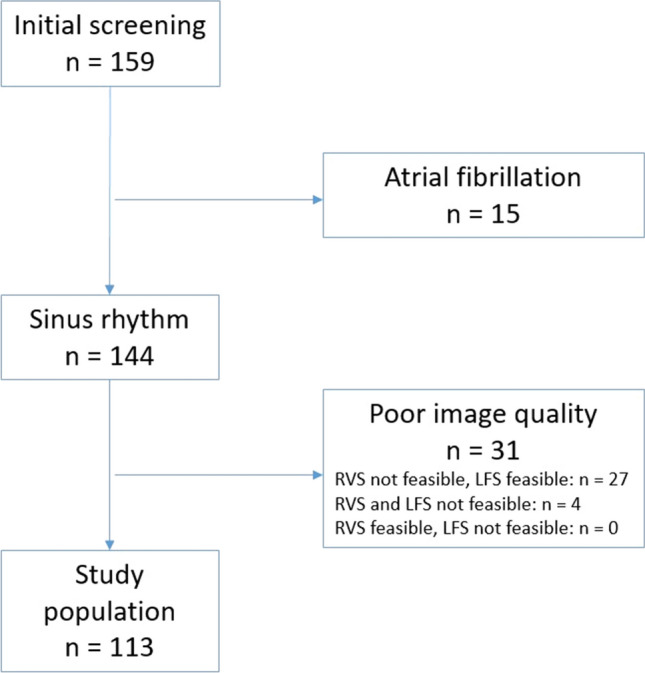
Chart of the study population
Comparison of patients with and without right ventricular dysfunction
Abnormal RV function, defined by a RVS > − 20.2% was more frequent in men and in older patients (Table 1). Patients with abnormal RV function had lower TAPSE, tricuspid S wave, FAC, and higher RV diastolic length, LFS, RV area in systole and diastole, Tei index, transtricuspid pressure gradient and pulmonary arterial systolic pressure.
Table 1.
Comparison of patients with and without right ventricular dysfunction
| Parameter | Normal RV function (RVS ≤− 20.2%) | Abnormal RV function (RVS > − 20.2%) | P value |
|---|---|---|---|
| Number of patients | 90 | 23 | |
| Male (%) | 72 | 28 | 0.02 |
| Female (%) | 91 | 9 | |
| Median age (years) | 54 | 68 | 0.004 |
| Median TAPSE (mm) | 23 | 15 | < 0.0001 |
| Median RV end-diastolic length (mm) | 83 | 91 | 0.003 |
| LFS (%) | − 28 | − 17 | < 0.0001 |
| End-diastolic RV area (cm2) | 18 | 21 | 0.01 |
| End-systolic RV area (cm2) | 9 | 13 | 0.0003 |
| FAC (%) | 0.49 | 0.36 | < 0.0001 |
| Tricuspid S wave (cm/s) | 15 | 8 | < 0.0001 |
| Tei index | 0.34 | 0.55 | < 0.0001 |
| Transtricuspid pressure gradient (mm Hg) | 21 | 30 | 0.008 |
| Pulmonary arterial systolic pressure estimate (mm Hg) | 28 | 35 | 0.01 |
TAPSE tricuspid annular systolic excursion, RV right ventricle, LFS longitudinal fractional shortening, FAC fractional area change
Reproducibility
The intraclass correlation coefficients for intra-observer variability and inter-observer variability of LFS assessment were both 0.97 (95% CI 0.92–0.98), thus showing an excellent agreement. For RVS assessment, the intraclass correlation coefficients for intraobserver variability and interobserver variability were both 0.96 (CI 0.92–0.98).
Correlation between RV function indices and RVS
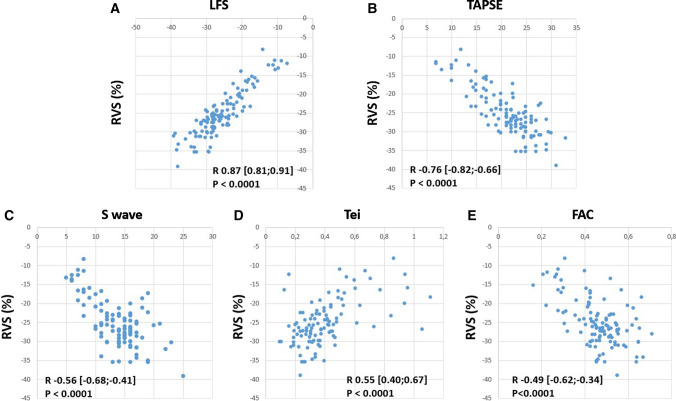
The correlation between RVS and RV function parameters is shown in Fig. 3. Among RV function indices, the correlation with RVS was best for LFS, with an R value of 0.87 (95% confidence interval 0.81–0.91).
Fig. 3.
Correlation between longitudinal fractional shortening (LFS, Panel A), tricuspid annular plane systolic excursion (TAPSE, Panel B), tricuspid S wave velocity (Panel C), Tei index (Panel D), right ventricular fractional area change (FAC, Panel E), and right ventricular free wall strain (RVS). R values are given with 95% confidence intervals
Bland–Altman analysis for the comparison between LFS and RVS showed a mean of the difference between LFS and RVS of 0.17% [95% CI (− 0.39; 0.76)], which was not significantly different from 0 (P = 0.54, Student’s t test) (Fig. 4). The standard deviation of the differences was 3.02%, resulting in 95% of the differences being in the interval (− 5.9; 6.2).
Fig. 4.
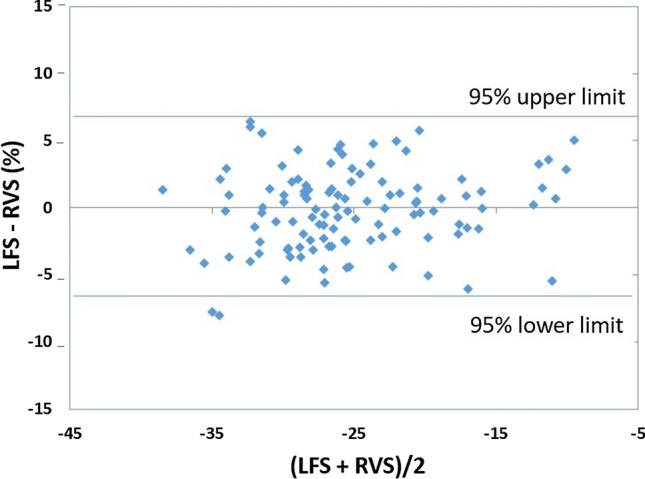
Bland–Altman Plot showing the absence of bias between longitudinal fractional shortening (LFS) and right ventricular free wall strain (RVS)
Predictive value of LFS to detect impaired RVS
Using a threshold of − 20.2% to detect abnormal RVS [17], the area under the ROC-curve of the various RV function parameters to detect abnormal RVS was best for LFS, namely 0.97 (CI 95% 0.94–1) (Fig. 5), whereas sensitivity, specificity, negative and positive predictive value were 83%, 96%, 96%, and 83%, respectively.
Fig. 5.
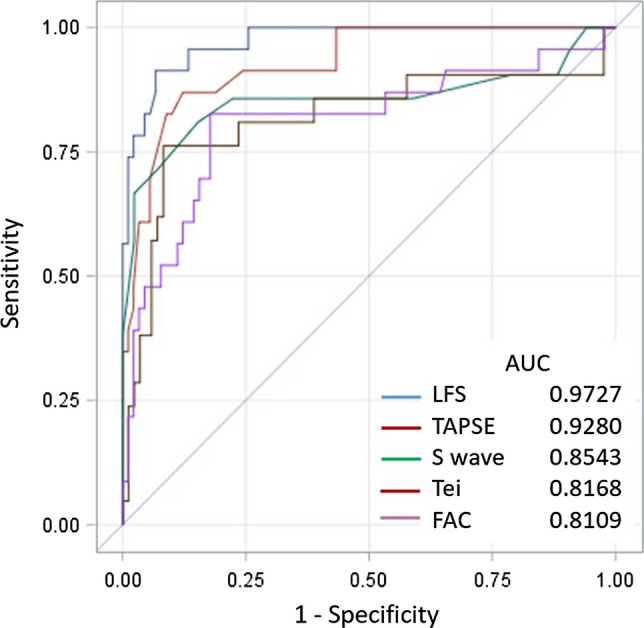
Receiver operating characteristic curve to detect abnormal right ventricular free wall strain (defined as > − 20.2%) for longitudinal fractional shortening (LFS), tricuspid annular plane systolic excursion (TAPSE), tricuspid S wave velocity, Tei index, and right ventricular fractional area shortening (FAC)
Using a gender-specific threshold of − 22.5% and − 23.3% for men and women, respectively [15], the area under the ROC-curve for LFS to detect abnormal RVS was 0.97 (IC 95% 0.0.995), and sensitivity, specificity, negative and positive predictive value were 90%, 91%, 96%, and 80%, respectively.
Discussion
Our results show that LFS (1) better correlates with RVS than usual parameters of RV systolic performance; (2) better predicts RV systolic dysfunction; and (3) is less technically challenging and more often feasible than RVS, and (4) is a reproducible parameter.
LFS, TAPSE and tricuspid annulus S’ better correlated with RVS than did RV Tei index and FAC. This finding is not unexpected as these three parameters also assess RV free-wall longitudinal function. Due to the longitudinal orientation of RV muscle fibers, RV longitudinal shortening is the main contributor to global RV function [18], which provides the basis to using longitudinal shortening indices to assess RV function. The rationale for using LFS as a substitute of RVS results from the observation that RV apex shows no or only limited displacement throughout the cardiac cycle, while RV free wall segments shorten and displace towards the apex [19]. Thus, because tricuspid annulus moves toward a stable apex during systole, TAPSE approximates the absolute shortening of the RV free wall. LFS, which represents normalization of TAPSE to RV diastolic length, approximates global RV free wall deformation and, hence, strain, thereby improving the correlation with RVS and the ability to predict RV systolic dysfunction. There was a lesser correlation between FAC and RVS. This may have resulted from the complex crescent-shaped RV geometry which makes challenging the detection of RV systolic dysfunction by a single-plane technique. It may also have resulted from the known limited reproducibility of FAC, which is obtained from manually drawn contours [20]. The lesser correlation with Tei index probably reflects incorporation of both systolic and diastolic time intervals it the assessment of the latter, whereas RVS is a purely systolic parameter.
Due to the small wall thickness of the RV ventricle, to its large systolic excursion and to lower quality of speckles, speckle-tracking imaging for the assessment of RV free wall longitudinal deformation has been previously shown to be challenging, resulting in an overall feasibility of around 85% [6, 21]. In the current study, the overall feasibility of RVS (78.5%) was even slightly lower, which probably reflects the inclusion of poorly echogenic patients including those with chronic lung disease and obesity in this unselected series of patients. However, the feasibility of LFS remained nevertheless very high, allowing an assessment of RV longitudinal function in the vast majority of the patients (97.2%).
Importantly, another potential advantage of LFS over RVS is that recording simultaneously an electrocardiogram is not mandatory, which may contribute to physician safety during the current COVID-19 pandemics [22].
Several theoretical limitations should be considered for the assessment of LFS. Due to the angle-dependency in the assessment of TAPSE, LFS is also inherently angle-dependent. Therefore, care should be taken to minimize the angle between tricuspid annulus plane motion and the ultrasonic beam, usually best obtained from the conventional apical four-chamber view, to avoid underestimation of TAPSE, and hence, of LFS. However, this angle-dependency would be expected to result in lower values of LFS as compared to RVS; noticeably, we did not observe a systematic bias between the two parameters, a finding which argues against a significant impact of angle-dependency on LFS calculation.
LFS is a marker of global RV free wall function, which, unlike RVS, does not enable assessing regional dysfunction of RV free wall. The assumption that the TAPSE and, hence, LFS are reflecting global RV function may not be valid in some situations such as myocardial infarction. However, despite evidence that regional RV function might be of clinical interest [23, 24], previous studies have highlighted the correlation between global RV strain and RV ejection fraction obtained with magnetic resonance imaging and its value to predict outcome even in patients with ischemic right ventricular dysfunction [25].
Another theoretical concern results from the observation that RV free wall morphology may be curvilinear. Therefore, TAPSE may not necessarily reflect the total absolute RV free wall shortening. This could explain some discrepancies observed between the measurements of LFS and RVS.
Both LFS and RV longitudinal free wall strain do not evaluate the septal component of RV function. However, RV free wall longitudinal strain has incremental prognostic value over conventional echocardiographic indices, and many published studies performed in different pathological conditions reported only free wall RVS, assuming that interventricular septum is mainly a constituent part of the left ventricle [10, 15, 26].
In conclusion, LFS performs reasonably well to predict an abnormal RV function in this unselected series of patients. It uses the same cutoff values than RVS and the substitution of RVS by LFS does not result into a systematic error. The feasibility of LFS is significantly better than that of RVS. It does not require dedicated software, and is independent on the ultrasound platform. These results suggest that LFS might be of value to assess RV function. However, before implementing this parameter in clinical practice, its prognostic value should be tested prospectively in specific populations such as patients with pulmonary arterial hypertension.
Declarations
Conflict of interest
The authors declare that they have no conflict of interest.
Footnotes
Publisher's Note
Springer Nature remains neutral with regard to jurisdictional claims in published maps and institutional affiliations.
References
- 1.Sanz J, Sánchez-Quintana D, Bossone E, Bogaard HJ, Naeije R. Anatomy, function, and dysfunction of the right ventricle. J Am Coll Cardiol. 2019;73:1463–1482. doi: 10.1016/j.jacc.2018.12.076. [DOI] [PubMed] [Google Scholar]
- 2.Focardi M, Cameli M, Carbone SF, Massoni A, De Vito R, Lisi M, Mondillo S. Traditional and innovative echocardiographic parameters for the analysis of right ventricular performance in comparison with cardiac magnetic resonance. Eur Heart J Cardiovasc Imaging. 2015;16:47–52. doi: 10.1093/ehjci/jeu156. [DOI] [PubMed] [Google Scholar]
- 3.Lee JH, Park JH. Strain analysis of the right ventricle using two-dimensional echocardiography. J Cardiovasc Imaging. 2018;26:111–124. doi: 10.4250/jcvi.2018.26.e11. [DOI] [PMC free article] [PubMed] [Google Scholar]
- 4.Gavazzoni M, Badano L, Vizzardi E, Raddino R, Genovese D, Taramasso M, Sciatti E, Palermo C, Metra M, Muraru D. Prognostic value of right ventricular free wall longitudinal strain in a large cohort of outpatients with left-sided heart disease. Eur Heart J Cardiovasc Imaging. 2020;21:1013–1021. doi: 10.1093/ehjci/jez246. [DOI] [PubMed] [Google Scholar]
- 5.Hulshof HG, Eijsvogels TMH, Kleinnibbelink G, van Dijk AP, George KP, Oxborough DL, Thijssen DHJ. Prognostic value of right ventricular longitudinal strain in patients with pulmonary hypertension: a systematic review and meta-analysis. Eur Heart J Cardiovasc Imaging. 2019;20:475–484. doi: 10.1093/ehjci/jey120. [DOI] [PubMed] [Google Scholar]
- 6.Fine NM, Chen L, Bastiansen PM, Frantz RP, Pellikka PA, Oh JK, Kane GC. Outcome prediction by quantitative right ventricular function assessment in 575 subjects evaluated for pulmonary hypertension. Circ Cardiovasc imaging. 2013;6:711–721. doi: 10.1161/CIRCIMAGING.113.000640. [DOI] [PubMed] [Google Scholar]
- 7.Haeck ML, Scherptong RW, Marsan NA, Holman ER, Schalij MJ, Bax JJ, Vliegen HW, Delgado V. Prognostic value of right ventricular longitudinal peak systolic strain in patients with pulmonary hypertension. Circ Cardiovasc Imaging. 2012;5:628–636. doi: 10.1161/CIRCIMAGING.111.971465. [DOI] [PubMed] [Google Scholar]
- 8.Shukla M, Park JH, Thomas JD, Delgado V, Bax JJ, Kane GC, Howlett JG, White JA, Fine NM. Prognostic value of right ventricular strain using speckle-tracking echocardiography in pulmonary hypertension: a systematic review and meta-analysis. Can J Cardiol. 2018;34:1069–1078. doi: 10.1016/j.cjca.2018.04.016. [DOI] [PubMed] [Google Scholar]
- 9.Tadic M, Pieske-Kraigher E, Cuspidi C, Morris DA, Burkhardt F, Baudisch A, Haßfeld S, Tschöpe C, Pieske B. Right ventricular strain in heart failure: clinical perspective. Arch Cardiovasc Dis. 2017;110:562–571. doi: 10.1016/j.acvd.2017.05.002. [DOI] [PubMed] [Google Scholar]
- 10.Prihadi EA, van der Bijl P, Dietz M, Abou R, Vollema EM, Marsan NA, Delgado V, Bax JJ. Prognostic implications of right ventricular free wall longitudinal strain in patients with significant functional tricuspid regurgitation. Circ Cardiovasc Imaging. 2019;12:e008666. doi: 10.1161/CIRCIMAGING.118.008666. [DOI] [PubMed] [Google Scholar]
- 11.Badano LP, Kolias TJ, Muraru D, Abraham TP, Aurigemma G, Edvardsen T, D'Hooge J, Donal E, Fraser AG, Marwick T, Mertens L, Popescu BA, Sengupta PP, Lancellotti P, Thomas JD, Voigt JU. Standardization of left atrial, right ventricular, and right atrial deformation imaging using two-dimensional speckle tracking echocardiography: a consensus document of the EACVI/ASE/Industry task force to standardize deformation imaging. Eur Heart J Cardiovasc Imaging. 2018;19:591–600. doi: 10.1093/ehjci/jey042. [DOI] [PubMed] [Google Scholar]
- 12.Lang RM, Badano LP, Mor-Avi V, Afilalo J, Armstrong A, Ernande L, Flachskampf FA, Foster E, Goldstein SA, Kuznetsova T, Lancellotti P, Muraru D, Picard MH, Rietzschel ER, Rudski L, Spencer KT, Tsang W, Voigt JU. Recommendations for cardiac chamber quantification by echocardiography in adults: an update from the American Society of Echocardiography and the European Association of Cardiovascular Imaging. Eur Heart J Cardiovasc Imaging. 2015;16:233–270. doi: 10.1093/ehjci/jev014. [DOI] [PubMed] [Google Scholar]
- 13.Rydman R, Söderberg M, Larsen F, Caidahl K, Alam M. Echocardiographic evaluation of right ventricular function in patients with acute pulmonary embolism: a study using tricuspid annular motion. Echocardiography. 2010;27:286–293. doi: 10.1111/j.1540-8175.2009.01015.x. [DOI] [PubMed] [Google Scholar]
- 14.Rudski LG, Lai WW, Afilalo J, Hua L, Handschumacher MD, Chandrasekaran K, Solomon SD, Louie EK, Schiller NB. Guidelines for the echocardiographic assessment of the right heart in adults: a report from the American Society of Echocardiography endorsed by the European Association of Echocardiography, a registered branch of the European Society of Cardiology, and the Canadian Society of Echocardiography. J Am Soc Echocardiogr. 2010;23:685–713. doi: 10.1016/j.echo.2010.05.010. [DOI] [PubMed] [Google Scholar]
- 15.Muraru D, Onciul S, Peluso D, Soriani N, Cucchini U, Aruta P, Romeo G, Cavalli G, IIliceto S, Badano LP. Sex- and method-specific reference values for right ventricular strain by 2-dimensional speckle-tracking echocardiography. Circ Cardiovasc Imaging. 2016 doi: 10.1161/CIRCIMAGING.115.003866. [DOI] [PubMed] [Google Scholar]
- 16.Chia EM, Hsieh CH, Boyd A, Pham P, Vidaic J, Leung D, Thomas L. Effects of age and gender on right ventricular systolic and diastolic function using two-dimensional speckle-tracking strain. J Am Soc Echocardiogr. 2014;27:1079–1086. doi: 10.1016/j.echo.2014.06.007. [DOI] [PubMed] [Google Scholar]
- 17.Badano LP, Muraru D, Parati G, Haugaa K, Voigt JU. How to do right ventricular strain. Eur Heart J Cardiovasc Imaging. 2020;21:825–827. doi: 10.1093/ehjci/jeaa126. [DOI] [PubMed] [Google Scholar]
- 18.Carlsson M, Ugander M, Heiberg E, Arheden H. The quantitative relationship between longitudinal and radial function in left, right, and total heart pumping in humans. Am J Physiol Heart Circ Physiol. 2007;293:H636–H644. doi: 10.1152/ajpheart.01376.2006. [DOI] [PubMed] [Google Scholar]
- 19.Moya Mur JL, García Martín A, García Lledó A, Lázaro Rivera C, Rincón Díaz LM, Hycka JM, Boretti I, Gimaraes C, Rojo EC, Nacher J-JJ, Fernández-Golfín C, Rodríguez-Roda Stuart J, Zamorano JL. Geometrical and functional cardiac changes after cardiac surgery: a phisiopatological explanation based on speckle tracking. Int J Cardiovasc Imaging. 2018;34:1905–1915. doi: 10.1007/s10554-018-1424-z. [DOI] [PubMed] [Google Scholar]
- 20.Dandel M, Hetzer R. (2018) Evaluation of the right ventricle by echocardiography: particularities and major challenges. Expert Rev Cardiovasc Ther. 2018;16:259–275. doi: 10.1080/14779072.2018.1449646. [DOI] [PubMed] [Google Scholar]
- 21.Antoni ML, Scherptong RW, Atary JZ, Boersma E, Holman ER, van der Wall EE, Schalij MJ, Bax JJ. Prognostic value of right ventricular function in patients after acute myocardial infarction treated with primary percutaneous coronary intervention. Circ Cardiovasc Imaging. 2010;3:264–271. doi: 10.1161/CIRCIMAGING.109.914366. [DOI] [PubMed] [Google Scholar]
- 22.Skulstad H, Cosyns B, Popescu BA, Galderisi M, Di Salvo G, Donal E, Petersen S, Gimelli A, Haugaa KH, Muraru D, Almeida AG, Schulz-Menger J, Dweck MR, Pontone G, Sade LE, Gerber B, Maurovich-Horvat P, Bharucha T, Cameli M, Magne J, Westwood M, Maurer G, Edvardsen T. COVID-19 pandemic and cardiac imaging: EACVI recommendations on precautions, indications, prioritization, and protection for patients and healthcare personnel. Eur Heart J Cardiovasc Imaging. 2020;21:592–598. doi: 10.1093/ehjci/jeaa072. [DOI] [PMC free article] [PubMed] [Google Scholar]
- 23.Nowak-Machen M, Lang T, Schilling A, Mockenhaupt L, Keller M, Rosenberger P, Magunia H. Regional right ventricular volume and function analysis using intraoperative 3-dimensional echocardiography-derived mesh models. J Cardiothorac Vasc Anesth. 2019;33:1527–1532. doi: 10.1053/j.jvca.2019.02.011. [DOI] [PubMed] [Google Scholar]
- 24.Teske AJ, Cox MGPJ, Te Riele ASJM, De Boeck BW, Doevendans PA, Hauer RNW, Cramer MJM. Early detection of regional functional abnormalities in asymptomatic ARVD/C gene carriers. J Am Soc Echocardiogr. 2012;25:997–1006. doi: 10.1016/j.echo.2012.05.008. [DOI] [PubMed] [Google Scholar]
- 25.Park SJ, Park J-H, Lee HS, Kim MS, Park YK, Park Y, Kim YJ, Lee J-H, Choi SW, Jeong JO, KwonIS S-W. Impaired RV global longitudinal strain is associated with poor long-term clinical outcomes in patients with acute inferior STEMI. JACC Cardiovasc Imaging. 2015;8:161–169. doi: 10.1016/j.jcmg.2014.10.011. [DOI] [PubMed] [Google Scholar]
- 26.Carluccio E, Biagioli P, Lauciello R, Zuchi C, Mengoni A, Bardelli G, Alunni G, Gronda EG, Ambrosio G. Superior prognostic value of right ventricular free wall compared to global longitudinal strain in patients with heart failure. J Am Soc Echocardiogr. 2020;32:836–844. doi: 10.1016/j.echo.2019.02.011. [DOI] [PubMed] [Google Scholar]


