Abstract
The acute course of coronavirus disease 2019 (COVID-19) is variable and ranges from asymptomatic infection to fulminant respiratory failure. Patients recovering from COVID-19 can have persistent symptoms and computed tomography (CT) abnormalities of variable severity. At 3 months after acute infection, a subset of patients will have CT abnormalities that include ground glass abnormalities (GGO) and subpleural bands with concomitant pulmonary function abnormalities. At 6 months after acute infection, some patients have persistent CT changes to include the resolution of GGOs seen in the early recovery phase and the persistence or development of changes suggestive of fibrosis such as reticulation with or without parenchymal distortion. Predictors of post-COVID lung disease include need for intensive care unit (ICU) admission, mechanical ventilation, higher inflammatory markers, longer hospital stay and a diagnosis of acute respiratory distress syndrome (ARDS). Treatments of post-COVID lung disease are being investigated with anti-fibrotic agents being investigated for the prevention of post-COVID lung fibrosis. The etiology of post-COVID lung disease may be a sequela of prolonged mechanical ventilation, COVID-induced ARDS or direct injury from the virus. Future research is needed to determine the long-term persistence of post-COVID lung disease, its impact on patients and ways to prevent or treat it.
Summary Statement
A subset of people recovering from COVID-19 will have persistent chest imaging abnormalities, most commonly ground-glass opacity and/or reticular abnormality; the natural history of these abnormalities remains uncertain.
Essentials
Over 50% of previously hospitalized survivors of SARS-CoV-2 infection will have abnormality on CT, more commonly in those with more severe acute infection.
The most common abnormalities are ground glass opacity, parenchymal or subpleural bands, reticular abnormality, evidence of fibrotic abnormality, and air trapping.
Precise radiologic description is important; the term fibrosis should be reserved for those with clear evidence of fibrosis (traction bronchiectasis or bronchiolectasis, honeycombing, or architectural distortion).
Comparison with acute-phase imaging is important to understand the temporal course of abnormality.
The long-term outcome of post-COVID CT changes and the impact on pulmonary function and quality of life are unknown.
Introduction
Since the discovery of coronaviruses in the 1960s, there have been three outbreaks of a severe acute respiratory syndrome (SARS) caused by novel coronaviruses (1–3). The most recent outbreak of SARS started with a group of patients admitted to hospitals in Wuhan China in December 2019 with pneumonia of unknown etiology (4). This new disease, termed coronavirus disease 2019 (COVID-19) (Table 1), was found to be caused by a novel coronavirus called SARS-coronavirus (CoV)-2, a virus closely related to those previously found in bats (5). SARS-CoV-2 quickly spread around the world and was associated with progression of lung injury to overt respiratory failure in a subgroup of those infected (6). As of July 20th, 2021, there have been 34,150,195 cases in the United States with 609,377 deaths (7). Lung involvement is common in the acute phase of infection, and it was recognized early in the pandemic that a subset of patients recovering from infection had persistent respiratory symptoms and chest imaging abnormalities. This manuscript will review the chest imaging abnormalities in patients who have recovered from SARS-CoV-2 infection.
Table 1:
Glossary of Terms Used in Postacute Sequelae of COVID-19

Acute Pulmonary Covid-19: Clinical Course and Imaging
After exposure to SARS-Cov-2, the median incubation time is 4 to 5 days, and the vast majority of patients who become symptomatic will have symptoms by day 11 (8). The number of patients positive for SARS-COV-2 that are symptomatic widely varies in the literature with 25 to 80% of patients reporting fever, cough or shortness of breath at some point during the course of infection (9, 10). 14% of subjects who test positive for SARS-Cov-2 will be hospitalized (11). The rate of Intensive Care Unit (ICU) admission amongst hospitalized patients is 20 to 30% (12) and 60 to 70% of those admitted to the ICU need invasive mechanical ventilation (13). Mortality rates have decreased over time and vary according to region and timing during the pandemic. A study in a health system in New York found that in-hospital adjusted mortality decreased from 25% to 7% over 6 months of the pandemic (14). Overall ICU mortality has ranged from 30 to 50% throughout the pandemic (15) and is influenced by many factors including ICU strain (16) and location (epicenter vs. non-epicenter) (17). Severe disease is associated with advanced age, male sex, residence in a nursing home, underlying comorbidities (e.g., cardiovascular disease, diabetes, chronic lung disease, hypertension etc.) and higher computed tomography (CT) severity scores (18–21). In patients with underlying co-morbidities, the rate of hospitalization is 6-times higher and the rate of death is 12-times higher (11). ICU mortality is associated with advanced age, male sex, higher body mass index, coronary artery disease, cancer, diabetes mellitus, hypercholesterolemia and chronic obstructive pulmonary disease (22) as well as hypoxia, liver dysfunction or kidney dysfunction on ICU admit (15). Though African American/Black and Hispanic populations have higher rates of infection and mortality, case fatality rates are similar to non-Hispanic whites (23).
The lungs are the organ of greatest concern in patients with acute COVID-19 and hypoxemia on ICU admission is an independent risk factor for death (15). Of those infected with SARS-CoV-2, 14% will develop dyspnea, tachypnea, hypoxia and/or lung opacities and 5% develop respiratory failure, septic shock, and/or multiorgan dysfunction or failure (24). When there is lung involvement, chest CT in the first five days after symptoms most commonly reveals ground glass opacities (GGO) or mixed GGO and consolidation in a peripheral and subpleural distribution (25–27) with a peak in acute CT findings around day 10 (Fig 1) (28). The opacities may be nodular and peribronchovascular in distribution. Pleural effusions and adenopathy are typically absent. Those with lesions initially in a unilateral distribution quickly evolve into bilateral involvement (29). A study evaluating early radiologic features in COVID-19 found that a dilated pulmonary artery and air bronchograms were seen in the majority of patients. The dilated vessel, a finding seen in thrombosis, increased blood flow, or small emboli, could be a marker of the coagulopathy seen in COVID-19 (30). A quarter of patients had a halo sign composed of ground glass opacity around a solid nodule (Fig 2) (25, 31). While the halo sign has often been associated with a vascular etiology it may also represent organizing pneumonia (32). Additionally, a reversed-halo appearance, in which soft tissue density surrounds more central ground-glass opacity has been described (33). In some patients these changes will evolve to include mild and focal reticular abnormalities by week 2 and an increase in consolidative abnormalities by week 3 (29) while others will have decrease in CT findings by week 3 (27).
Figure 1.
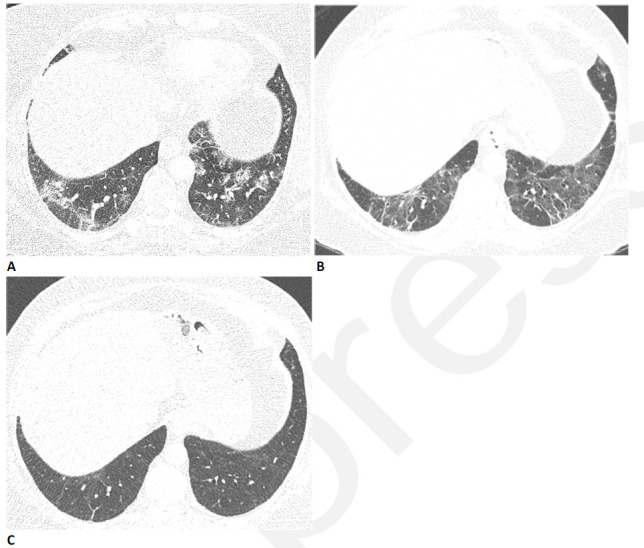
59-year-old woman with sequelae of COVID-related acute respiratory distress syndrome (ARDS). (A) CT on admission shows patchy consolidation and ground glass abnormality. This subsequently progressed to ARDS. (B) Two months later, the consolidation has resolved but there is moderate ground glass abnormality, multifocal linear abnormality and mild bronchiectasis. (C) Seven months after admission, these abnormalities had almost completely resolved, and restrictive pulmonary function also resolved.
Figure 2.
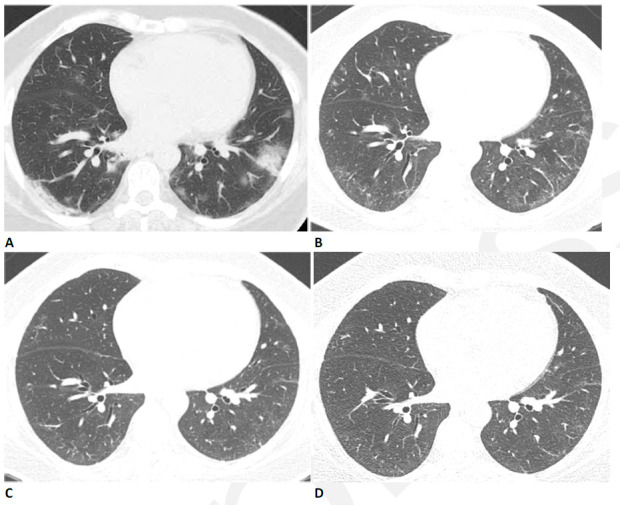
59-year-old woman with sequelae of COVID-related acute respiratory distress syndrome (ARDS). (A) CT on admission shows patchy nodular consolidation. A halo of ground glass opacity is present around the largest left lower lobe nodule. The patient subsequently developed ARDS. (B) Two months later, the consolidation has resolved with moderate ground glass abnormality. (C) Three months after admission there is further improvement in ground glass. (D) Eleven months after admission there is still mild residual ground glass abnormality, but symptoms had resolved and pulmonary function was normal.
The extent of lung involvement in the acute phase of infection is associated with the degree of underlying systemic inflammation and portends a worse outcome (34, 35). The resolution of these acute changes is variable (27) and some patients will go on to develop post-acute fibrosis. In spite of the prevalence of lung involvement in acute COVID-19 and the recognition of characteristic patterns, these patterns in acute disease are nonspecific. Imaging however plays a central role in the diagnosis and management of patients with suspected acute COVID-19, including the identification of alternative diagnoses and the presence of complications as pulmonary embolism (36).
Post-Acute Sequelae of Covid-19
The recovery from SARS-CoV-2 infection is variable. Though most will make a total recovery, others will suffer from post-infection sequalae long after they recover from the acute infection with severity of symptoms ranging from mild to debilitating. In a study of healthcare workers with mild COVID-19, 26% had moderate to severe symptoms for 2 months and 15% had moderate to severe symptoms for 8 months (37). The most common symptoms reported were lost of taste or smell, fatigue and shortness of breath. Identified risk factors for post-infection symptoms include increasing age and body mass index, female sex and a higher number of symptoms during the acute illness (38). This constellation of symptoms, initially referred to as “Long COVID”, is now called “Post-Acute Sequelae of COVID-19” (PASC), and the National Institutes of Health (NIH) convened a workshop in December 2020 to summarize existing knowledge and identify knowledge gaps and research priorities (39). Lingering questions that were addressed include the cause and risk factors for PASC as well as management.
Post-Covid Lung Disease
Studies from other viral infections with pulmonary involvement suggest that functional and radiologic impairments persist beyond hospital discharge. In the original SARS-CoV outbreak in 2003, which had 8,000 confirmed cases and a 9% mortality rate (40), reticular abnormalities were first noticed at 2 weeks when CT abnormalities were most severe (41). While the GGOs and consolidations slowly improved, fibrosis was seen in 50 to 60% of patients on follow-up scans after discharge (41, 42). Fibrosis was more common in the elderly, those with a longer length of stay, those with a higher lactate dehydrogenase (LDH) in the acute phase (43) and those with notable exercise intolerance after recovery (44). In 2012, Middle East Respiratory Syndrome (MERS), caused by the coronavirus MERS-CoV, was first identified in Saudi Arabia. As of January 2020 there were 2,519 confirmed cases with just over a 34% mortality rate (45). A study of 36 patients who had follow up chest X-rays (median of 43 days) after recovering from MERS showed that 33% had residual reticular opacities suggestive of fibrosis (46). Similar to the SARS data, these patients also had significantly longer ICU stays, higher peak LDH levels, and were older compared to those without reticulations. Post-acute fibrosis has also been reported in other viral infections with lower morbidity and mortality. In H1N1 influenza infection, which was benign in most cases and had an overall 0.5% mortality, there are reports of post-infection fibrosis (47–49) though the exact incidence is unknown. A recent meta-analysis in preprint of 60 studies looking at follow-up imaging after inpatient admissions for SARS-CoV, SARS-CoV-2, MERS or influenza pneumonia found inflammatory changes (ground glass opacity or consolidation) in 56% of scans and “fibrosis” (reticulation, lung architectural distortion, interlobular septal thickening, traction bronchiectasis, or honeycombing) in 40% (50). Given the known association between other viral pneumonias and fibrosis as well as the incidence of pulmonary involvement in COVID-19 during the acute illness and persistent respiratory symptoms after recovery, there has been a focus on the post-acute lung disease in COVID-19 (51).
In the evaluation of subjects with post-covid lung disease, clinical phenotypes have emerged. The majority of patients with significant radiographic abnormalities will have accompanying symptoms (i.e., breathlessness with or without cough) or abnormalities on lung physiology. However, it is recognized that a subset of patients will have symptoms suggestive of lung involvement without imaging abnormalities; conversely significant imaging abnormalities may be present without attributable symptoms.
Etiology of Post-Covid Lung Disease
It is unclear if post-acute changes are a sequela of lung injury/acute respiratory distress syndrome (ARDS), the effects of mechanical ventilation or direct injury from the virus. Pulmonary fibrosis is known to develop in a subset of patients with ARDS (52) and the duration of acute respiratory failure in ARDS has been independently implicated in the development of pulmonary fibrosis (53). In a subset of ARDS survivors, persistent fibrotic changes often correlate with restrictive physiology on pulmonary function tests (PFTs) and a worse health- and pulmonary-related quality of life up to 2 years after index hospitalization (54, 55). Ventilator-induced lung injury, a direct injury to alveoli that leads to pulmonary interstitial edema, hyaline membrane formation and alveolar collapse, is commonly seen in patients with ARDS (56) and can directly contribute to the development of pulmonary fibrosis (57). It may have a role in the development of post-COVID lung disease given the longer duration of mechanical ventilation (58) and higher incidence of barotrauma (59) seen in subjects with COVID-19 ARDS compared to non-COVID ARDS. Autopsy studies of subjects dying from COVID-19 show evidence of ARDS on biopsy as well as SARS-CoV-2 in pneumocytes (60, 61), fibroblast proliferation and microscopic honeycombing (62). Viruses are known to influence responses to other fibrotic stimuli and in select cases cause fibrosis on their own (63). The relative contributions of these factors to post-COVID lung disease are currently unknown. In a small subset of patients, the etiology of post-COVID lung disease appears to be an exacerbation of underlying interstitial lung disease (Fig 3) (64), a known complication in these patients after lung infection (65).
Figure 3.
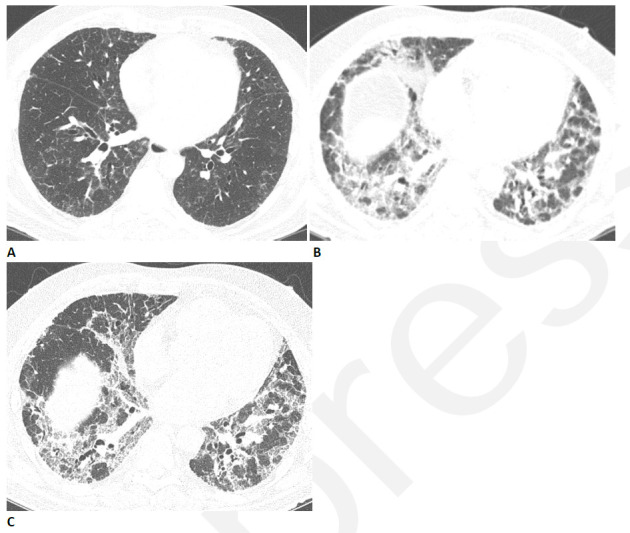
Progressive pulmonary fibrosis in a 67-year-old man with a history of relatively mild, stable fibrotic hypersensitivity pneumonitis. (A) Baseline CT shows mild ground glass and reticular abnormality. (B) CT angiogram obtained two months after infection shows substantially increased reticular abnormality with mild traction bronchiectasis. (C) CT obtained two months later shows increased traction bronchiectasis indicating progressive fibrosis.
CT Evaluation
A comprehensive CT examination of a patient who has dyspnea following COVID-19 should include helical supine inspiratory chest CT acquisition with contiguous or overlapping thin (≤1.5 mm) section reconstructions and expiratory thin-section CT (66, 67). The identification of new emphysema, cysts, and mosaic attenuation in some patients after COVID-19 infection suggests that the infection may sometimes result in airflow obstruction (Fig 4). Persistent air trapping was previously identified after SARS infection (68), and can also be seen after other viral infections. For this reason, expiratory CT should be routine in the post-COVID patient. Prone thin-section imaging through the lung bases is often important to clarify whether dependent opacities on supine imaging represent atelectasis or true abnormality. As discussed below, acute or chronic pulmonary thromboembolic disease may also be a cause of symptoms in the post-acute COVID patient (Fig 5), and the threshold for performing CT angiography should be low. Comparison with acute-phase imaging is important to understand the temporal course of the abnormality.
Figure 4.
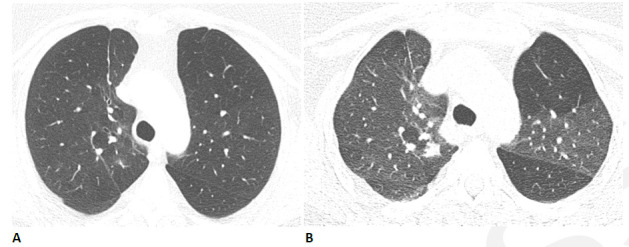
Obstructive lung disease after COVID-19 in a 60-year-old woman. (A) Inspiratory CT with persistent shortness of breath and chest tightness eight months following COVID-19 infection shows subtle mosaic attenuation, best seen in the anterior left upper lobe. (B) Expiratory CT confirms lobular air trapping, which was present on multiple images, indicating small airway obstruction.
Figure 5.
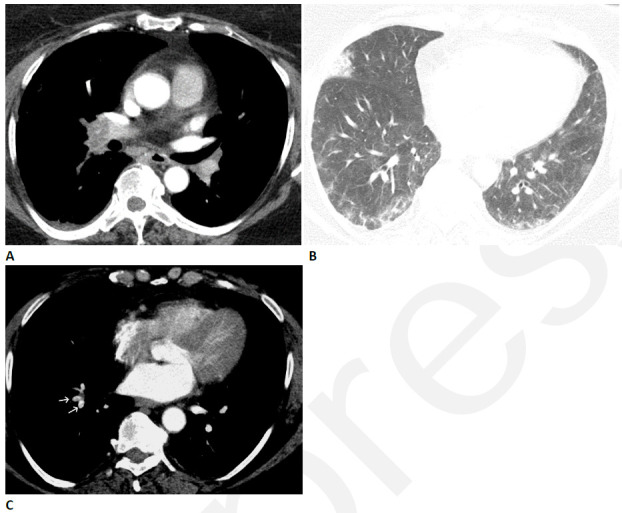
Pulmonary vascular disease after COVID-19 in a 63-year-old woman. (A) CT pulmonary arteriogram with persistent shortness of breath and elevated d-Dimer, seven weeks after onset of infection, shows obstructive thrombus in right interlobar pulmonary artery. (B) CT with lung windows at a lower level shows patchy ground glass opacity, and a focal wedge-shaped consolidative abnormality in the right middle lobe typical for pulmonary infarct. (C) Three months later, the large central thrombus had resolved, but nonocclusive linear webs were present in segmental vessels (arrows), typical for chronic thromboembolic disease.
CT Features in Post-Covid Lung Disease
In the early convalescent phase of COVID-19, radiologic changes are common, though the prevalence clearly varies depending on the study population, the interval after infection, and the severity of initial illness. Reticular abnormality was found at about two weeks after onset of symptoms in seven of 20 patients who had isolated abnormality on baseline CT (25). In 51 hospitalized patients studied at about four weeks after discharge, there was substantial improvement in CT findings in most patients, but 54% had persistent abnormalities, most commonly interlobular septal thickening and focal or multifocal GGO (Fig 2) (69). About 75% of discharged subjects will have abnormalities in pulmonary function at 30 days (70), most commonly a reduced diffusing capacity for carbon monoxide (DLCO). The reduction in DLCO and the extent of lung abnormality and fibrotic abnormality on CT are correlated with severity of illness during hospitalization (70).
In a subset of patients, these early convalescent changes persist. In a study of follow-up scans at 3 months in 52 subjects with COVID-19 and abnormal initial CT (25% of whom were never hospitalized) 22 (42%) showed residual abnormalities (71). Those with residual disease were more likely to be symptomatic with dyspnea, chest pain or cough, but 10 of 30 patients with complete resolution of CT abnormality were also symptomatic. The most common findings at follow-up were GGO and subpleural parenchymal bands (Fig 6). A study of three-month scans in 48 survivors of severe COVID-19 who required mechanical ventilation found normal imaging in only 4% (72). GGO was seen in 89%, and signs of fibrosis (described as coarse fibrous bands either with or without obvious parenchymal distortion, bronchiectasis, and bronchiolectasis) were seen in 67%. CT severity scores were elevated and patients had corresponding PFT abnormalities (reductions in lung volumes and DLCO). Residual abnormalities were predominantly located in areas that showed GGO with reticulation on baseline scans. Areas that had consolidation at baseline usually cleared on follow-up and the distribution of fibrosis in this cohort was diffuse. Areas of decreased attenuation attributed to small airways disease or hypoperfusion were seen in 46%, and new emphysematous or cystic lesions were seen in 25%.
Figure 6.
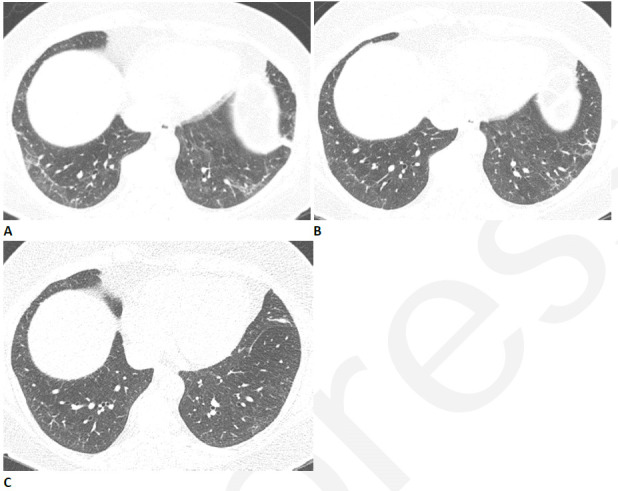
Resolving reticular abnormality and subpleural bands following COVID-related acute respiratory distress syndrome (ARDS). (A) CT two months after infection shows ground glass abnormality with mild reticular abnormality and subpleural bands. No traction bronchiectasis or architectural distortion is visible. (B) CT six months after infection shows partial clearing. (C) CT eleven months after infection shows near complete resolution, with mild residual ground glass abnormality. Pulmonary function returned to normal.
Longer follow-up studies on these patients are currently limited. A study of 171 patients scanned 4 months after hospitalization for COVID-19 found abnormalities in 76% of intubated patients and 58% non-intubated patients (73). GGO was the most common abnormality but 19% had fibrotic lesions predominately in a subpleural location involving less than 25% of the lung parenchyma. There was a high prevalence of dyspnea and reduced lung function in those with CT abnormalities, and the prevalence of fibrotic abnormalities was higher in those who had ARDS during the acute phase. In a 6-month follow-up study of 114 survivors of severe COVID-19 pneumonia, 35% had CT evidence of fibrotic-like changes (traction bronchiectasis, parenchymal bands and/or honeycombing) and a portion of these had reductions in DLCO (74). GGO was present in 21%, but the extent of GGO and consolidation was clearly decreased in extent from baseline, while the prevalence of reticular abnormality increased from baseline. Predictors of fibrotic-like changes at six months included ARDS, extensive baseline CT abnormality, noninvasive mechanical ventilation, prolonged hospital stay, and age>50. A brief report on 6 month scans in 12 patients showed that the fibrotic-appearing abnormality occurs in areas of the original changes during the acute phase of infection (75). A more recent follow-up study of 118 patients who had moderate or severe COVID-19 pneumonia, which adopted a stricter definition of fibrotic-like changes, found fibrotic-like changes in 72% (Caruso et al [119]). On multivariate analysis, these fibrotic like changes were correlated with age >65 years, and need for mechanical ventilation, and inversely correlated with the extent of aerated lung at baseline.
The identification of a subgroup of patients with persistent or slowly resolving groundglass and/or consolidative opacities has led to the speculation that some patients recovering from COVID-19 will have persistent organizing pneumonia (OP) or its histologic variant acute and fibrinous organizing pneumonia (AFOP) (76). It is certainly true that some patients with PASC have typical CT findings of OP including perilobular thickening (Fig 7) and atoll sign (Fig 8), which usually resolve with time. It is our experience that the majority of subjects have opacities in areas of abnormalities during the acute infection suggesting resolving lung injury as opposed to new areas of injury. OP is a known post-viral response that has been reported in both H1N1 and SARS (77, 78) and early post-mortem studies in COVID-19 have reported histopathologic evidence of AFOP (79, 80). Though reports of temporal changes vary, it seems a third will resolve in one to two months after acute infection (76). Corticosteroids have been reported to speed resolution of these abnormalities (81, 82) and it is speculated that the impact of steroids on outcome measures in acute COVID-19 (83, 84) may be in part due to treatment of OP or AFOP. However, in the absence of clinical trials, we would caution against the use of steroid treatment based on imaging findings alone.
Figure 7.
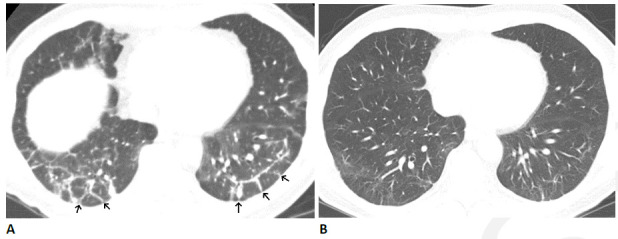
Organizing pneumonia pattern after COVID-19 infection in 64-year-old man. (A) CT obtained four months after infection onset shows patchy ground glass abnormality with bilateral peri-lobular thickening (arrows). (B) CT obtained three months later shows near complete resolution, with mild residual ground glass and linear abnormality. The patient had mild residual pulmonary symptoms.
Figure 8.
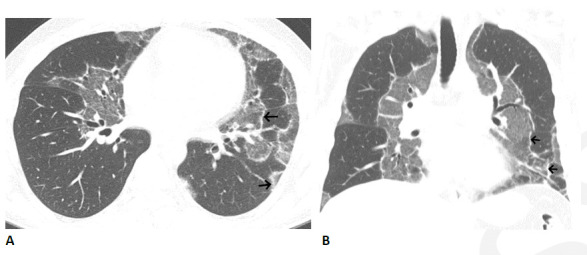
Organizing pneumonia pattern with atoll sign following COVID-19. (A, B) Axial and coronal CT images show multiple areas of sharply demarcated ground glass abnormality with thin peripheral rim (arrows).
The Role of Pulmonary Embolism in Pasc
Given the evidence of direct invasion of the endothelium by SARS-CoV-2 (85) as well as the associated hypercoagulable state and increased risk of deep vein thrombosis and pulmonary embolism in acute infection (86), there is concern that venous thromboembolism (VTE) may play a role in a subset of patients with PASC. The prevalence of VTE in hospitalized acute COVID-19 patients may be as high as 25% (87, 88) and one study found the rate of pulmonary embolism to be 24% for patients on the general wards and 49% for patients in the ICU (89). A meta-analysis of 3342 patients showed that pulmonary embolism and deep venous thrombosis occurred in 16.5% and 14.8%, primarily in the acute phase of infection, and more commonly in those admitted to the intensive care unit (90). Two thirds of the pulmonary emboli in the acute setting are found in the segmental and subsegmental arteries (89). Given that the duration of the hypercoagulable state is unknown, patients in the recovery phase may still be at increased risk for new pulmonary emboli or suffering from symptoms of undiagnosed pulmonary emboli in the acute setting. Evaluation for pulmonary emboli should be considered in patients with pulmonary symptoms unexplained by imaging and/or unexplained reductions in DLCO with some recommending lung perfusion imaging as a routine triage tool in survivors of COVID-19 (91).
Dual energy CT may have an important role in evaluating post-COVID patients with persistent symptoms. In a study of 55 patients who underwent dual-energy CT angiography for persistent symptoms at three months after COVID-19, three had filling defects compatible with thromboembolism, but 32 (58%) had perfusion defects, (including four patients who had normal-appearing lung parenchyma) suggesting persistent microvascular abnormalities in these patients (92). Interestingly 15 patients had areas of increased perfusion, which corresponded to areas of GGO, parenchymal bands or tree-in-bud pattern. These findings suggest that vascular dysregulation is common after COVID-19.
Classifying Patterns of Post Covid Lung Disease
Interpretation of the published studies of CT following COVID-19 is complicated by the varying definition of CT findings and lack of histologic correlation. Although the finding of GGO in PASC is often assumed to represent inflammatory abnormality, there is little or no histologic or other evidence to support this assumption, and it is possible that GGO represents immature fibrosis which may either resolve or progress with time (93). Conversely, the term fibrosis is often used to encompass post-COVID findings such as parenchymal bands, subpleural bands which likely represent focal atelectasis or scarring rather than diffuse fibrosis. Reticular abnormality and interlobular septal thickening without other evidence of fibrosis may reflect inflammatory interstitial thickening. These changes may resolve on further follow-up (Fig 6).
The broad definition of “fibrosis” in above-cited studies of post-acute COVID may have inflated its prevalence. We believe that the term fibrosis should be reserved for more specific signs such as traction bronchiectasis or bronchiolectasis, honeycombing, or architectural distortion (Figs 9, 10) (94). The natural history of these fibrotic-like abnormalities remains unclear. In our experience at least some reticular abnormality improves slowly with time (Fig 6), but there also appears to be a subset of patients who develop progressive lung fibrosis (Figs 3, 11). We propose that CT appearances in PASC should be classified as follows: 1) predominantly ground glass; 2) mixed ground glass and fibrotic; 3) predominantly fibrotic. Parenchymal or subpleural bands without other fibrotic abnormality can usually be ignored.
Figure 9.
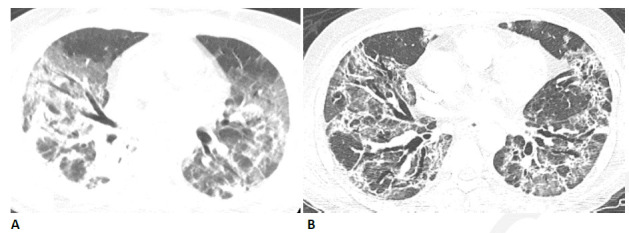
54-year-old man with COVID-related acute respiratory distress syndrome (ARDS) and subsequent fibrosis. (A) CT two weeks after admission shows diffuse ground glass abnormality with reticular abnormality and traction bronchiectasis in the right middle lobe indicating an organizing phase of lung injury. (B) CT six months after admission shows decreased ground glass abnormality but extensive traction bronchiectasis and architectural distortion suggesting fibrosis. The patient remained symptomatic with restricted pulmonary function.
Figure 10.
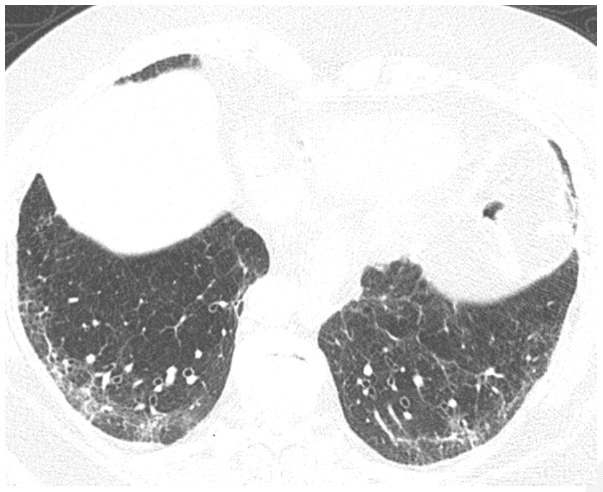
Post-COVID fibrosis in a 79-year-old woman. CT obtained three months after acute infection with acute respiratory distress syndrome (ARDS) shows reticular abnormality with traction bronchiectasis. Mild patchy ground glass abnormality is also present. The findings were new from a pre-COVID-19 CT scan, and the patient had persistent exertional dyspnea.
Figure 11.
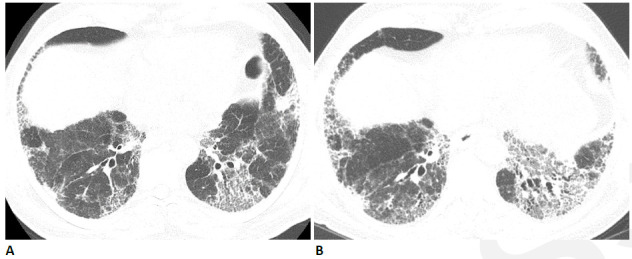
Progressive fibrosis following COVID-19 in 64-year-old man. The patient had a relatively mild COVID-19 infection which did not require intensive care unit (ICU) care, but subsequently developed progressive shortness of breath. (A) CT obtained six weeks after infection shows moderately extensive reticular abnormality with traction bronchiectasis. (B) CT obtained six months later shows progressive reticular abnormality and traction bronchiectasis. The patient had progressive shortness of breath and physiologic impairment.
Potential Role for Quantitative Imaging in Post-Covid Lung Disease
A variety of quantitative techniques have been used to quantify COVID-19 infection in the early phase, ranging from simple densitometry to deep learning methods (95, 96). Quantitative CT (QCT) assessment of severity of COVID-19 infection in the early phase of infection is an independent predictor of ICU admission and of mortality (97–99). QCT may also be used to assess sequential change in lung volumes and pulmonary opacity (99). Evaluation of QCT in the post-acute stage of COVID has been more limited. A study of 41 COVID survivors and a similar study of 29 subjects both showed that QCT metrics of pneumonia decreased progressively over 6-7 months (100, 101). However, in order for QCT to have a useful role in assessment of PASC in the lung, it will be important to develop distinct metrics to differentiate between ground glass opacity (which may be identified by densitometry) and fibrotic appearing abnormality.
Quantitative CT metrics of fibrotic lung disease may have a role in the evaluation of post-COVID lung disease (102). For example, data-Driven Textural Analysis (DTA), a deep learning based technique (103–107), when used in chronic fibrotic lung disease, correlates with visually estimated fibrosis and with physiologic impairment, and can predict progression (104, 105). In a pilot evaluation, we have found that DTA effectively discriminates between ground glass and fibrotic-appearing abnormality and can detect improvement in fibrotic-appearing abnormality over time (Fig 12). Other texture-based analysis systems (108) will likely demonstrate similar performance. However, much more technical and clinical validation will be necessary in order for QCT to have a clinical role in assessment of PASC
Figure 12.
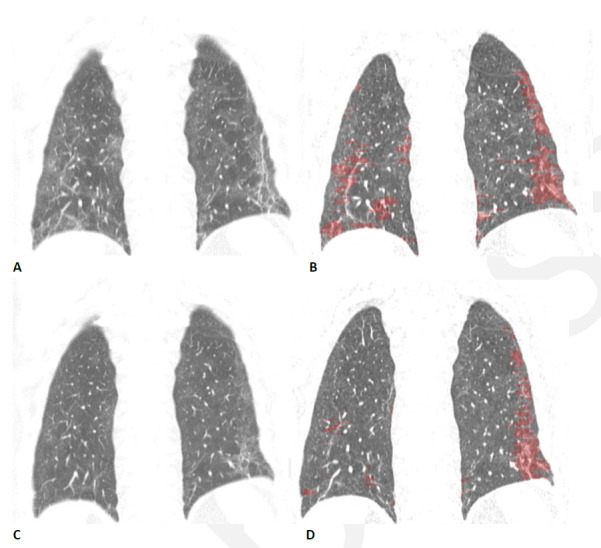
Quantitative CT assessment of linear/reticular abnormality following COVID-19 acute respiratory distress syndrome (ARDS) in a 59-year-old woman. (A) Coronal CT obtained ten weeks after onset of infection shows ground glass abnormality with linear and reticular abnormality at both bases. (B) Corresponding quantitative CT image delineates the linear/reticular abnormality, quantified at 10.5% of the lung volume. (C) Four months later, the extent of ground glass and of linear/reticular abnormality has decreased substantially. Symptoms had resolved, and pulmonary function had returned to normal. (D) Corresponding quantitative CT indicates decrease in linear/reticular abnormality, now 4.6%.
Predictors of Post-Covid Lung Disease
Studies are beginning to identify risk factors for post-COVID lung disease. In a study of patients that looked at HRCT scans 5 months after discharge, there was a correlation between the extent of abnormality on HRCT and the severity of illness as measured by the need for admission, oxygen and mechanical ventilation (109). Pulmonary function testing in these subjects revealed a correlation between reduced DLCO and severity of illness with women and elderly patients having a higher likelihood of having a diffusion impairment. Other studies have found that higher inflammatory markers (C-reactive protein, LDH and interleukin-6) (102, 110–112), high d-dimer (113), white blood cell count (110), albumin level (102), older age (74, 113), male sex (113, 114), underlying co-morbidities (113), ICU admission (114), longer hospital stay (74, 111), the need for mechanical ventilation (73, 112), the duration of mechanical ventilation (112) and a diagnosis of ARDS (73, 74) have been associated with worse fibrosis on follow-up scan. Recently, shorter leukocyte telomere length, a risk factor for other fibrotic lung diseases including idiopathic pulmonary fibrosis (IPF), has been associated with post-COVID fibrotic changes on CT (112). Tobacco smoking may not predict residual disease (71). COVID-19 that develops in patients with pre-existing pulmonary fibrosis may lead to accelerated fibrosis (Fig 3).
Treatment of Post-Covid Lung Disease
Therapies for patients with post-COVID lung disease are beginning to be investigated. In the early stages after acute infection with CT patterns suggestive of OP, corticosteroids are being considered as discussed above. In addition, agents to mitigate or prevent fibrosis are actively being investigated. The antifibrotic therapies used in chronic fibrotic lung disease (nintedanib and pirfenidone) have biologic plausibility in post-COVID lung fibrosis (115) and nintedanib, a tyrosine-kinase inhibitor shown to slow progression in idiopathic pulmonary fibrosis (116), is being investigated as an agent to mitigate the fibrosis after COVID-19 (ClinicalTrials.gov # NCT04619680). Genistein is a selective agonist of estrogen receptor beta (ERβ). ERβ activation promotes DNA repair, cell cycle regulation, and importantly, anti-inflammatory and ant-fibrotic effects through repression of expression and activation of nuclear factor kappa light-chain-enhancer of activated B cells (NF-κB) (117). It is currently being investigated, in a National Institute of Allergy and Infectious Diseases (NIAID) supported trial, as an oral agent to mitigate fibrosis post COVID. The role of emerging treatments in the subset of patients with asymptomatic lung disease is currently unclear.
Conclusion
A detailed high-resolution CT should be performed in all patients with dyspnea following SARS-CoV-2 infection. The most common abnormalities are GGO, parenchymal bands, reticular abnormality, traction bronchiectasis, and mosaic attenuation. The prevalence of CT abnormalities varies depending on the severity of initial lung involvement, and the time interval since infection. Longitudinal studies suggest that GGO can be replaced with fibrotic-appearing abnormalities, and abnormalities may persist in patients with known risk factors. However multiple areas of uncertainty persist and will require further research (Table 2). Although no therapy is approved for post-COVID lung fibrosis, investigations of candidate drugs are ongoing. The long-term impact of CT findings on respiratory symptoms, pulmonary function or quality of life is unknown.
Table 2.
Imaging of Postacute Sequelae of COVID-19: Areas of Uncertainty

No funding
Abbreviations:
- SARS
- severe acute respiratory syndrome
- COVID-19
- coronavirus disease 2019
- CoV
- coronavirus
- ICU
- intensive care unit
- CT
- computed tomography
- GGO
- ground glass abnormalities
- PASC
- Post-Acute Sequelae of COVID-19
- NIH
- National Institutes of Health
- LDH
- lactate dehydrogenase
- MERS
- Middle East Respiratory Syndrome
- ARDS
- acute respiratory distress syndrome
- PFT
- pulmonary function test
- DLCO
- diffusing capacity for carbon monoxide
- OP
- organizing pneumonia
- AFOP
- acute and fibrinous organizing pneumonia
- VTE
- venous thromboembolism
- QCT
- quantitative CT
- ERβ
- estrogen receptor beta
- NF-κB
- nuclear factor kappa light-chain-enhancer of activated B cells
References
- 1. Stadler K , Masignani V , Eickmann M , Becker S , Abrignani S , Klenk HD , et al . SARS--beginning to understand a new virus . Nat Rev Microbiol . 2003. ; 1 ( 3 ): 209 – 18 . 10.1038/nrmicro775 [DOI] [PMC free article] [PubMed] [Google Scholar]
- 2. Mackay IM , Arden KE . MERS coronavirus: diagnostics, epidemiology and transmission . Virol J . 2015. ; 12 : 222 . 10.1186/s12985-015-0439-5 [DOI] [PMC free article] [PubMed] [Google Scholar]
- 3. Jin Y , Yang H , Ji W , Wu W , Chen S , Zhang W , et al . Virology, Epidemiology, Pathogenesis, and Control of COVID-19 . Viruses . 2020. ; 12 ( 4 . 10.3390/v12040372 [DOI] [PMC free article] [PubMed] [Google Scholar]
- 4. Wang C , Horby PW , Hayden FG , Gao GF . A novel coronavirus outbreak of global health concern . Lancet . 2020. ; 395 ( 10223 ): 470 – 3 . 10.1016/S0140-6736(20)30185-9 [DOI] [PMC free article] [PubMed] [Google Scholar]
- 5. Wu F , Zhao S , Yu B , Chen YM , Wang W , Song ZG , et al . A new coronavirus associated with human respiratory disease in China . Nature . 2020. ; 579 ( 7798 ): 265 – 9 . 10.1038/s41586-020-2008-3 [DOI] [PMC free article] [PubMed] [Google Scholar]
- 6. Wu C , Chen X , Cai Y , Xia J , Zhou X , Xu S , et al . Risk Factors Associated With Acute Respiratory Distress Syndrome and Death in Patients With Coronavirus Disease 2019 Pneumonia in Wuhan, China . JAMA Intern Med . 2020. . 10.1001/jamainternmed.2020.0994 [DOI] [PMC free article] [PubMed]
- 7. COVID-19 dashboard by the Center for Science and Engineering .: Johns Hopkins; .; 2021. [ April 28th , 2021. .]. https://coronavirus.jhu.edu/map.html . [Google Scholar]
- 8. Lauer SA , Grantz KH , Bi Q , Jones FK , Zheng Q , Meredith HR , et al . The Incubation Period of Coronavirus Disease 2019 (COVID-19) From Publicly Reported Confirmed Cases: Estimation and Application . Annals of Internal Medicine . 2020. ; 172 ( 9 ): 577 – 82 . 10.7326/m20-0504 [DOI] [PMC free article] [PubMed] [Google Scholar]
- 9. Buitrago-Garcia D , Egli-Gany D , Counotte MJ , Hossmann S , Imeri H , Ipekci AM , et al . Occurrence and transmission potential of asymptomatic and presymptomatic SARS-CoV-2 infections: A living systematic review and meta-analysis . PLOS Medicine . 2020. ; 17 ( 9 ): e1003346 . 10.1371/journal.pmed.1003346 [DOI] [PMC free article] [PubMed] [Google Scholar]
- 10. Oran DP , Topol EJ . The Proportion of SARS-CoV-2 Infections That Are Asymptomatic : A Systematic Review . Ann Intern Med . 2021. ; 174 ( 5 ): 655 – 62 . 10.7326/M20-6976 [DOI] [PMC free article] [PubMed] [Google Scholar]
- 11. Stokes EK , Zambrano LD , Anderson KN , Marder EP , Raz KM , Felix SEB , et al . Coronavirus Disease 2019 Case Surveillance — United States, January 22–May 30, 2020 . MMWR Morb Mortal Wkly Rep 2020. ; 69 : 759 – 65 . [DOI] [PMC free article] [PubMed] [Google Scholar]
- 12. Abate SM , Ahmed Ali S , Mantfardo B , Basu B . Rate of Intensive Care Unit admission and outcomes among patients with coronavirus: A systematic review and Meta-analysis . PLOS ONE . 2020. ; 15 ( 7 ): e0235653 . 10.1371/journal.pone.0235653 [DOI] [PMC free article] [PubMed] [Google Scholar]
- 13. Chang R , Elhusseiny KM , Yeh YC , Sun WZ . COVID-19 ICU and mechanical ventilation patient characteristics and outcomes—A systematic review and meta-analysis . PLOS ONE . 2021. ; 16 ( 2 ): e0246318 . 10.1371/journal.pone.0246318 [DOI] [PMC free article] [PubMed] [Google Scholar]
- 14. Horwitz LI , Jones SA , Cerfolio RJ , Francois F , Greco J , Rudy B , et al . Trends in COVID-19 Risk-Adjusted Mortality Rates . Journal of Hospital Medicine . 2021. ; 16 ( 2 ): 90 – 2 . 10.12788/jhm.3552 [DOI] [PubMed] [Google Scholar]
- 15. Gupta S , Hayek SS , Wang W , Chan L , Mathews KS , Melamed ML , et al . Factors Associated With Death in Critically Ill Patients With Coronavirus Disease 2019 in the US . JAMA Internal Medicine . 2020. ; 180 ( 11 ): 1436 . 10.1001/jamainternmed.2020.3596 [DOI] [PMC free article] [PubMed] [Google Scholar]
- 16. Bravata DM , Perkins AJ , Myers LJ , Arling G , Zhang Y , Zillich AJ , et al . Association of Intensive Care Unit Patient Load and Demand With Mortality Rates in US Department of Veterans Affairs Hospitals During the COVID-19 Pandemic . JAMA Network Open . 2021. ; 4 ( 1 ): e2034266 . 10.1001/jamanetworkopen.2020.34266 [DOI] [PMC free article] [PubMed] [Google Scholar]
- 17. Lim ZJ , Subramaniam A , Ponnapa Reddy M , Blecher G , Kadam U , Afroz A , et al . Case Fatality Rates for Patients with COVID-19 Requiring Invasive Mechanical Ventilation. A Meta-analysis . American Journal of Respiratory and Critical Care Medicine . 2021. ; 203 ( 1 ): 54 – 66 . 10.1164/rccm.202006-2405oc [DOI] [PMC free article] [PubMed] [Google Scholar]
- 18. Mehta HB , Li S , Goodwin JS . Risk Factors Associated With SARS-CoV-2 Infections, Hospitalization, and Mortality Among US Nursing Home Residents . JAMA Network Open . 2021. ; 4 ( 3 ): e216315 . 10.1001/jamanetworkopen.2021.6315 [DOI] [PMC free article] [PubMed] [Google Scholar]
- 19. Ioannou GN , Locke E , Green P , Berry K , O'Hare AM , Shah JA , et al . Risk Factors for Hospitalization, Mechanical Ventilation, or Death Among 10 131 US Veterans With SARS-CoV-2 Infection . JAMA Network Open . 2020. ; 3 ( 9 ): e2022310 . 10.1001/jamanetworkopen.2020.22310 [DOI] [PMC free article] [PubMed] [Google Scholar]
- 20. Williamson EJ , Walker AJ , Bhaskaran K , Bacon S , Bates C , Morton CE , et al . Factors associated with COVID-19-related death using OpenSAFELY . Nature . 2020. ; 584 ( 7821 ): 430 – 6 . 10.1038/s41586-020-2521-4 [DOI] [PMC free article] [PubMed] [Google Scholar]
- 21. Lieveld AWE , Azijli K , Teunissen BP , van Haaften RM , Kootte RS , van den Berk IAH , et al . Chest CT in COVID-19 at the ED: Validation of the COVID-19 Reporting and Data System (CO-RADS) and CT Severity Score: A Prospective, Multicenter, Observational Study . Chest . 2021. ; 159 ( 3 ): 1126 – 35 . 10.1016/j.chest.2020.11.026 [DOI] [PMC free article] [PubMed] [Google Scholar]
- 22. Grasselli G , Greco M , Zanella A , Albano G , Antonelli M , Bellani G , et al . Risk Factors Associated With Mortality Among Patients With COVID-19 in Intensive Care Units in Lombardy, Italy . JAMA Internal Medicine . 2020. ; 180 ( 10 ): 1345 . 10.1001/jamainternmed.2020.3539 [DOI] [PMC free article] [PubMed] [Google Scholar]
- 23. Mackey K , Ayers CK , Kondo KK , Saha S , Advani SM , Young S , et al . Racial and Ethnic Disparities in COVID-19–Related Infections, Hospitalizations, and Deaths . Annals of Internal Medicine . 2020. ; 174 ( 3 ): 362 – 73 . 10.7326/M20-6306 [DOI] [PMC free article] [PubMed] [Google Scholar]
- 24. Wu Z , McGoogan JM . Characteristics of and Important Lessons From the Coronavirus Disease 2019 (COVID-19) Outbreak in China . JAMA . 2020. ; 323 ( 13 ): 1239 . 10.1001/jama.2020.2648 [DOI] [PubMed] [Google Scholar]
- 25. Hu Q , Guan H , Sun Z , Huang L , Chen C , Ai T , et al . Early CT features and temporal lung changes in COVID-19 pneumonia in Wuhan, China . European Journal of Radiology . 2020. ; 128 : 109017 . 10.1016/j.ejrad.2020.109017 [DOI] [PMC free article] [PubMed] [Google Scholar]
- 26. Zhao W , Zhong Z , Xie X , Yu Q , Liu J . Relation Between Chest CT Findings and Clinical Conditions of Coronavirus Disease (COVID-19) Pneumonia: A Multicenter Study . American Journal of Roentgenology . 2020. ; 214 ( 5 ): 1072 – 7 . 10.2214/ajr.20.22976 [DOI] [PubMed] [Google Scholar]
- 27. Zhou S , Zhu T , Wang Y , Xia L . Imaging features and evolution on CT in 100 COVID-19 pneumonia patients in Wuhan, China . Eur Radiol . 2020. ; 30 ( 10 ): 5446 – 54 . 10.1007/s00330-020-06879-6 [DOI] [PMC free article] [PubMed] [Google Scholar]
- 28. Pan F YT , Sun P , Gui S , Liang B , Li L , Zheng D , Wang J , Hesketh R , Yang L , Zheng C . Time Course of Lung Changes on Chest CT During Recovery From 2019 Novel Coronavirus (COVID-19) Pneumonia . Radiology . 2020. ; 295 : 715 – 21 . 10.1148/radiol.2020200370 [DOI] [PMC free article] [PubMed] [Google Scholar]
- 29. Shi H , Han X , Jiang N , Cao Y , Alwalid O , Gu J , et al . Radiological findings from 81 patients with COVID-19 pneumonia in Wuhan, China: a descriptive study . Lancet Infect Dis . 2020. ; 20 ( 4 ): 425 – 34 . 10.1016/S1473-3099(20)30086-4 [DOI] [PMC free article] [PubMed] [Google Scholar]
- 30. Leentjens J , Van Haaps TF , Wessels PF , Schutgens REG , Middeldorp S . COVID-19-associated coagulopathy and antithrombotic agents—lessons after 1 year . The Lancet Haematology . 2021. . 10.1016/s2352-3026(21)00105-8 [DOI] [PMC free article] [PubMed] [Google Scholar]
- 31. Meiler S , Schaible J , Poschenrieder F , Scharf G , Zeman F , Rennert J , et al . Can CT performed in the early disease phase predict outcome of patients with COVID 19 pneumonia? Analysis of a cohort of 64 patients from Germany . European Journal of Radiology . 2020. ; 131 : 109256 . 10.1016/j.ejrad.2020.109256 [DOI] [PMC free article] [PubMed] [Google Scholar]
- 32. Marchiori E , Penha D , Nobre LF , Hochhegger B , Zanetti G . Differences and Similarities between the Double Halo Sign, the Chest CT Target Sign and the Reversed Halo Sign in Patients with COVID-19 Pneumonia . Korean J Radiol . 2021. ; 22 ( 4 ): 672 – 6 . 10.3348/kjr.2020.1150 [DOI] [PMC free article] [PubMed] [Google Scholar]
- 33. Bernheim A , Mei X , Huang M , Yang Y , Fayad ZA , Zhang N , et al . Chest CT Findings in Coronavirus Disease-19 (COVID-19): Relationship to Duration of Infection . Radiology . 2020. ; 295 ( 3 ): 200463 . 10.1148/radiol.2020200463 [DOI] [PMC free article] [PubMed] [Google Scholar]
- 34. Lei Q , Li G , Ma X , Tian J , Wu YF , Chen H , et al . Correlation between CT findings and outcomes in 46 patients with coronavirus disease 2019 . Scientific Reports . 2021. ; 11 ( 1 . 10.1038/s41598-020-79183-4 [DOI] [PMC free article] [PubMed] [Google Scholar]
- 35. Hu Y , Zhan C , Chen C , Ai T , Xia L . Chest CT findings related to mortality of patients with COVID-19: A retrospective case-series study . PLOS ONE . 2020. ; 15 ( 8 ): e0237302 . 10.1371/journal.pone.0237302 [DOI] [PMC free article] [PubMed] [Google Scholar]
- 36. Rubin GD , Ryerson CJ , Haramati LB , Sverzellati N , Kanne JP , Raoof S , et al . The Role of Chest Imaging in Patient Management During the COVID-19 Pandemic: A Multinational Consensus Statement From the Fleischner Society . Chest . 2020. ; 158 ( 1 ): 106 – 16 . 10.1016/j.chest.2020.04.003 [DOI] [PMC free article] [PubMed] [Google Scholar]
- 37. Havervall S , Rosell A , Phillipson M , Mangsbo SM , Nilsson P , Hober S , et al . Symptoms and Functional Impairment Assessed 8 Months After Mild COVID-19 Among Health Care Workers . JAMA . 2021. . 10.1001/jama.2021.5612 [DOI] [PMC free article] [PubMed] [Google Scholar]
- 38. Sudre CH , Murray B , Varsavsky T , Graham MS , Penfold RS , Bowyer RC , et al . Attributes and predictors of long COVID . Nature Medicine . 2021. ; 27 ( 4 ): 626 – 31 . 10.1038/s41591-021-01292-y [DOI] [PMC free article] [PubMed] [Google Scholar]
- 39. Lerner AM , Robinson DA , Yang L , Williams CF , Newman LM , Breen JJ , et al . Toward Understanding COVID-19 Recovery: National Institutes of Health Workshop on Postacute COVID-19 . Annals of Internal Medicine . 2021. . 10.7326/M21-1043 [DOI] [PMC free article] [PubMed] [Google Scholar]
- 40. Cherry JD , Krogstad P . SARS: The First Pandemic of the 21st Century . Pediatric Research . 2004. ; 56 ( 1 ): 1 – 5 . 10.1203/01.pdr.0000129184.87042.fc [DOI] [PMC free article] [PubMed] [Google Scholar]
- 41. Ooi GC KP , Muller NL , Yiu WC , Zhou LJ , Ho JC , Lam B , Nicolaou S , Tsang KW . Severe acute respiratory syndrome: temporal lung changes at thin-section CT in 30 patients . Radiology . 2004. ; 230 : 836 – 44 . 10.1148/radiol.2303030853 [DOI] [PubMed] [Google Scholar]
- 42. Antonio GE , Wong KT , Chu WC , Hui DS , Cheng FW , Yuen EH , et al . Imaging in severe acute respiratory syndrome (SARS) . Clin Radiol . 2003. ; 58 ( 11 ): 825 – 32 . 10.1016/s0009-9260(03)00308-8 [DOI] [PMC free article] [PubMed] [Google Scholar]
- 43. Antonio GE WK , Hui DS , Wu A , Lee N , Yuen EH , Leung CB , Rainer TH , Cameron P , Chung SS , Sung JJ , Ahuja AT . Thin-Section CT in Patients with Severe Acute Respiratory Syndrome Following Hospital Discharge: Preliminary Experience . Radiology . 2003. ; 228 : 810 – 5 . 10.1148/radiol.2283030726 [DOI] [PubMed] [Google Scholar]
- 44. Chan KS ZJ , Mok YW , Li YM , Liu YN , Chu CM , Ip MS . SARS: prognosis, outcome and sequelae . Respirology . 2003. ; 8 : S36 – S40 . 10.1046/j.1440-1843.2003.00522.x [DOI] [PMC free article] [PubMed] [Google Scholar]
- 45. Da Costa VG , Moreli ML , Saivish MV . The emergence of SARS, MERS and novel SARS-2 coronaviruses in the 21st century . Archives of Virology . 2020. ; 165 ( 7 ): 1517 – 26 . 10.1007/s00705-020-04628-0 [DOI] [PMC free article] [PubMed] [Google Scholar]
- 46. Das KM , Lee EY , Singh R , Enani MA , Al Dossari K , Van Gorkom K , et al . Follow-up chest radiographic findings in patients with MERS-CoV after recovery . Indian J Radiol Imaging . 2017. ; 27 ( 3 ): 342 – 9 . 10.4103/ijri.IJRI_469_16 [DOI] [PMC free article] [PubMed] [Google Scholar]
- 47. Mineo G , Ciccarese F , Modolon C , Landini MP , Valentino M , Zompatori M . Post-ARDS pulmonary fibrosis in patients with H1N1 pneumonia: role of follow-up CT . Radiol Med . 2012. ; 117 ( 2 ): 185 – 200 . 10.1007/s11547-011-0740-3 [DOI] [PMC free article] [PubMed] [Google Scholar]
- 48. Singh V , Sharma BB , Patel V . Pulmonary sequelae in a patient recovered from swine flu . Lung India . 2012. ; 29 ( 3 ): 277 – 9 . 10.4103/0970-2113.99118 [DOI] [PMC free article] [PubMed] [Google Scholar]
- 49. Shieh W-J BD , Denison AM , DeLeon-Carnes M , Adem P , Bhatnagar J , Sumner J , Liu L , Patel M , Batten B , Greer P , Jones T , Smith C , Bartlett J , Montague J , White E , Rollin D , Gao R , Seales C , Jost H , Metcalfe M , Goldsmith CS , Humphrey C , Schmitz A , Drew C , Paddock C , Uyeki TM , Zaki SR . 2009 Pandemic Influenza A (H1N1) Pathology and Pathogenesis of 100 Fatal Cases in the United States . American Journal of Pathology . 2010. ; 177 : 166 – 75 . 10.2353/ajpath.2010.100115 [DOI] [PMC free article] [PubMed] [Google Scholar]
- 50. Fabbri L , Moss S , Khan F , Chi W , Xia J , Robinson K , et al . Post-viral parenchymal lung disease of COVID-19 and viral pneumonitis: A systematic review and meta-analysis . medRxiv . 2021. : 10.1101/2021.03.15.21253593 [DOI] [PubMed] [Google Scholar]
- 51. Spagnolo P , Balestro E , Aliberti S , Cocconcelli E , Biondini D , Casa GD , et al . Pulmonary fibrosis secondary to COVID-19: a call to arms? Lancet Respir Med . 2020. . 10.1016/S2213-2600(20)30222-8 [DOI] [PMC free article] [PubMed] [Google Scholar]
- 52. Zapol WM , Trelstad RL , Coffey JW , Tsai I , Salvador RA . Pulmonary fibrosis in severe acute respiratory failure . Am Rev Respir Dis . 1979. ; 119 ( 4 ): 547 – 54 . 10.1164/arrd.1979.119.4.547 [DOI] [PubMed] [Google Scholar]
- 53. Ichikado K , Muranaka H , Gushima Y , Kotani T , Nader HM , Fujimoto K , et al . Fibroproliferative changes on high-resolution CT in the acute respiratory distress syndrome predict mortality and ventilator dependency: a prospective observational cohort study . BMJ Open . 2012. ; 2 ( 2 ): e000545 . 10.1136/bmjopen-2011-000545 [DOI] [PMC free article] [PubMed] [Google Scholar]
- 54. Davidson TA , Caldwell ES , Curtis JR , Hudson LD , Steinberg KP . Reduced quality of life in survivors of acute respiratory distress syndrome compared with critically ill control patients . JAMA . 1999. ; 281 ( 4 ): 354 – 60 . 10.1001/jama.281.4.354 [DOI] [PubMed] [Google Scholar]
- 55. Burnham EL , Hyzy RC , Paine R , Coley C , Kelly AM , Quint LE , et al . Chest CT Features are Associated With Poorer Quality of Life in Acute Lung Injury Survivors* . Critical Care Medicine . 2013. ; 41 ( 2 ): 445 – 56 . 10.1097/ccm.0b013e31826a5062 [DOI] [PMC free article] [PubMed] [Google Scholar]
- 56. International consensus conferences in intensive care medicine: Ventilator-associated Lung Injury in ARDS. This official conference report was cosponsored by the American Thoracic Society, The European Society of Intensive Care Medicine, and The Societe de Reanimation de Langue Francaise, and was approved by the ATS Board of Directors, July 1999 . Am J Respir Crit Care Med . 1999. ; 160 ( 6 ): 2118 – 24 . 10.1164/ajrccm.160.6.ats16060 [DOI] [PubMed] [Google Scholar]
- 57. Cabrera-Benitez NE , Laffey JG , Parotto M , Spieth PM , Villar J , Zhang H , et al . Mechanical ventilation-associated lung fibrosis in acute respiratory distress syndrome: a significant contributor to poor outcome . Anesthesiology . 2014. ; 121 ( 1 ): 189 – 98 . 10.1097/ALN.0000000000000264 [DOI] [PMC free article] [PubMed] [Google Scholar]
- 58. Bain W , Yang H , Shah FA , Suber T , Drohan C , Al-Yousif N , et al . COVID-19 versus Non-COVID ARDS: Comparison of Demographics, Physiologic Parameters, Inflammatory Biomarkers and Clinical Outcomes . Ann Am Thorac Soc . 2021. . 10.1513/AnnalsATS.202008-1026OC [DOI] [PMC free article] [PubMed] [Google Scholar]
- 59. McGuinness G , Zhan C , Rosenberg N , Azour L , Wickstrom M , Mason DM , et al . Increased Incidence of Barotrauma in Patients with COVID-19 on Invasive Mechanical Ventilation . Radiology . 2020. ; 297 ( 2 ): E252 – E62 . 10.1148/radiol.2020202352 [DOI] [PMC free article] [PubMed] [Google Scholar]
- 60. Carsana L , Sonzogni A , Nasr A , Rossi RS , Pellegrinelli A , Zerbi P , et al . Pulmonary post-mortem findings in a series of COVID-19 cases from northern Italy: a two-centre descriptive study . Lancet Infect Dis . 2020. ; 20 ( 10 ): 1135 – 40 . 10.1016/S1473-3099(20)30434-5 [DOI] [PMC free article] [PubMed] [Google Scholar]
- 61. Borczuk AC . Pulmonary pathology of COVID-19: a review of autopsy studies . Curr Opin Pulm Med . 2021. ; 27 ( 3 ): 184 – 92 . 10.1097/MCP.0000000000000761 [DOI] [PubMed] [Google Scholar]
- 62. Grillo F , Barisione E , Ball L , Mastracci L , Fiocca R . Lung fibrosis: an undervalued finding in COVID-19 pathological series . Lancet Infect Dis . 2021. ; 21 ( 4 ): e72 . 10.1016/S1473-3099(20)30582-X [DOI] [PMC free article] [PubMed] [Google Scholar]
- 63. Naik PK , Moore BB . Viral infection and aging as cofactors for the development of pulmonary fibrosis . Expert Review of Respiratory Medicine . 2010. ; 4 ( 6 ): 759 – 71 . 10.1586/ers.10.73 [DOI] [PMC free article] [PubMed] [Google Scholar]
- 64. Fonseca M , Summer R , Roman J . Acute Exacerbation of Interstitial Lung Disease as a Sequela of COVID-19 Pneumonia . The American Journal of the Medical Sciences . 2021. ; 361 ( 1 ): 126 – 9 . 10.1016/j.amjms.2020.08.017 [DOI] [PMC free article] [PubMed] [Google Scholar]
- 65. Leuschner G , Behr J . Acute Exacerbation in Interstitial Lung Disease . Front Med (Lausanne) . 2017. ; 4 : 176 . 10.3389/fmed.2017.00176 [DOI] [PMC free article] [PubMed] [Google Scholar]
- 66. American College of Radiology . ACR–STR practice parameter for the performance of high-resolution computed tomography (HRCT) of the lungs in adults [updated 2020] . https://www.acr.org/-/media/ACR/Files/Practice-Parameters/HRCT-Lungs.pdf .
- 67. Nagpal P , Guo J , Shin KM , Lim JK , Kim KB , Comellas AP , et al . Quantitative CT imaging and advanced visualization methods: potential application in novel coronavirus disease 2019 (COVID-19) pneumonia . BJR Open . 2021. ; 3 ( 1 ): 20200043 . 10.1259/bjro.20200043 [DOI] [PMC free article] [PubMed] [Google Scholar]
- 68. Ketai L , Paul NS , Wong KT . Radiology of severe acute respiratory syndrome (SARS): the emerging pathologic-radiologic correlates of an emerging disease . J Thorac Imaging . 2006. ; 21 ( 4 ): 276 – 83 . 10.1097/01.rti.0000213581.14225.f1 [DOI] [PubMed] [Google Scholar]
- 69. Liu C , Ye L , Xia R , Zheng X , Yuan C , Wang Z , et al . Chest Computed Tomography and Clinical Follow-Up of Discharged Patients with COVID-19 in Wenzhou City, Zhejiang, China . Ann Am Thorac Soc . 2020. ; 17 ( 10 ): 1231 – 7 . 10.1513/AnnalsATS.202004-324OC [DOI] [PMC free article] [PubMed] [Google Scholar]
- 70. Huang Y , Tan C , Wu J , Chen M , Wang Z , Luo L , et al . Impact of coronavirus disease 2019 on pulmonary function in early convalescence phase . Respiratory Research . 2020. ; 21 ( 1 . 10.1186/s12931-020-01429-6 [DOI] [PMC free article] [PubMed] [Google Scholar]
- 71. Tabatabaei SMH , Rajebi H , Moghaddas F , Ghasemiadl M , Talari H . Chest CT in COVID-19 pneumonia: what are the findings in mid-term follow-up? Emerg Radiol . 2020. ; 27 ( 6 ): 711 – 9 . 10.1007/s10140-020-01869-z [DOI] [PMC free article] [PubMed] [Google Scholar]
- 72. van Gassel RJJ , Bels JLM , Raafs A , van Bussel BCT , van de Poll MCG , Simons SO , et al . High Prevalence of Pulmonary Sequelae at 3 Months after Hospital Discharge in Mechanically Ventilated Survivors of COVID-19 . Am J Respir Crit Care Med . 2021. ; 203 ( 3 ): 371 – 4 . 10.1164/rccm.202010-3823LE [DOI] [PMC free article] [PubMed] [Google Scholar]
- 73. Morin L , Savale L , Pham T , Colle R , Figueiredo S , Harrois A , et al . Four-Month Clinical Status of a Cohort of Patients After Hospitalization for COVID-19 . JAMA . 2021. ; 325 ( 15 ): 1525 . 10.1001/jama.2021.3331 [DOI] [PMC free article] [PubMed] [Google Scholar]
- 74. Han X , Fan Y , Alwalid O , Li N , Jia X , Yuan M , et al . Six-Month Follow-up Chest CT findings after Severe COVID-19 Pneumonia . Radiology . 2021. : 203153 . 10.1148/radiol.2021203153 [DOI] [PMC free article] [PubMed] [Google Scholar]
- 75. Gulati A , Lakhani P . Interstitial lung abnormalities and pulmonary fibrosis in COVID-19 patients: a short-term follow-up case series . Clin Imaging . 2021. ; 77 : 180 – 6 . 10.1016/j.clinimag.2021.03.030 [DOI] [PMC free article] [PubMed] [Google Scholar]
- 76. Wang Y , Jin C , Wu CC , Zhao H , Liang T , Liu Z , et al . Organizing pneumonia of COVID-19: Time-dependent evolution and outcome in CT findings . PLoS One . 2020. ; 15 ( 11 ): e0240347 . 10.1371/journal.pone.0240347 [DOI] [PMC free article] [PubMed] [Google Scholar]
- 77. Cornejo R , Llanos O , Fernandez C , Carlos Diaz J , Cardemil G , Salguero J , et al . Organizing pneumonia in patients with severe respiratory failure due to novel A (H1N1) influenza . Case Reports . 2010. ; 2010 ( jul16 2 ): bcr0220102708 – b . 10.1136/bcr.02.2010.2708 [DOI] [PMC free article] [PubMed] [Google Scholar]
- 78. Hwang DM , Chamberlain DW , Poutanen SM , Low DE , Asa SL , Butany J . Pulmonary pathology of severe acute respiratory syndrome in Toronto . Modern Pathology . 2005. ; 18 ( 1 ): 1 – 10 . 10.1038/modpathol.3800247 [DOI] [PMC free article] [PubMed] [Google Scholar]
- 79. Copin MC , Parmentier E , Duburcq T , Poissy J , Mathieu D . Time to consider histologic pattern of lung injury to treat critically ill patients with COVID-19 infection . Intensive Care Medicine . 2020. ; 46 ( 6 ): 1124 – 6 . 10.1007/s00134-020-06057-8 [DOI] [PMC free article] [PubMed] [Google Scholar]
- 80. Polak SB , Van Gool IC , Cohen D , Von Der Thüsen JH , Van Paassen J . A systematic review of pathological findings in COVID-19: a pathophysiological timeline and possible mechanisms of disease progression . Modern Pathology . 2020. ; 33 ( 11 ): 2128 – 38 . 10.1038/s41379-020-0603-3 [DOI] [PMC free article] [PubMed] [Google Scholar]
- 81. Simoes JP , Alves Ferreira AR , Almeida PM , Trigueiros F , Braz A , Inacio JR , et al . Organizing pneumonia and COVID-19: A report of two cases . Respir Med Case Rep . 2021. ; 32 : 101359 . 10.1016/j.rmcr.2021.101359 [DOI] [PMC free article] [PubMed] [Google Scholar]
- 82. Myall KJ , Mukherjee B , Castanheira AM , Lam JL , Benedetti G , Mak SM , et al . Persistent Post-COVID-19 Inflammatory Interstitial Lung Disease: An Observational Study of Corticosteroid Treatment . Ann Am Thorac Soc . 2021. . 10.1513/AnnalsATS.202008-1002OC [DOI] [PMC free article] [PubMed] [Google Scholar]
- 83. Chen H , Xie J , Su N , Wang J , Sun Q , Li S , et al . Corticosteroid Therapy Is Associated With Improved Outcome in Critically Ill Patients With COVID-19 With Hyperinflammatory Phenotype . Chest . 2021. ; 159 ( 5 ): 1793 – 802 . 10.1016/j.chest.2020.11.050 [DOI] [PMC free article] [PubMed] [Google Scholar]
- 84. Dexamethasone in Hospitalized Patients with Covid-19 . New England Journal of Medicine . 2021. ; 384 ( 8 ): 693 – 704 . 10.1056/nejmoa2021436 [DOI] [PMC free article] [PubMed] [Google Scholar]
- 85. Lowenstein CJ , Solomon SD . Severe COVID-19 Is a Microvascular Disease . Circulation . 2020. ; 142 ( 17 ): 1609 – 11 . 10.1161/CIRCULATIONAHA.120.050354 [DOI] [PMC free article] [PubMed] [Google Scholar]
- 86. Bilaloglu S , Aphinyanaphongs Y , Jones S , Iturrate E , Hochman J , Berger JS . Thrombosis in Hospitalized Patients With COVID-19 in a New York City Health System . JAMA . 2020. ; 324 ( 8 ): 799 – 801 . 10.1001/jama.2020.13372 [DOI] [PMC free article] [PubMed] [Google Scholar]
- 87. Cau R , Pacielli A , Fatemeh H , Vaudano P , Arru C , Crivelli P , et al . Complications in COVID-19 patients: Characteristics of pulmonary embolism . Clin Imaging . 2021. ; 77 : 244 – 9 . 10.1016/j.clinimag.2021.05.016 [DOI] [PMC free article] [PubMed] [Google Scholar]
- 88. Wu C , Liu Y , Cai X , Zhang W , Li Y , Fu C . Prevalence of Venous Thromboembolism in Critically Ill Patients With Coronavirus Disease 2019: A Meta-Analysis . Front Med (Lausanne) . 2021. ; 8 : 603558 . 10.3389/fmed.2021.603558 [DOI] [PMC free article] [PubMed] [Google Scholar]
- 89. Kwee RM , Adams HJA , Kwee TC . Pulmonary embolism in patients with COVID-19 and value of D-dimer assessment: a meta-analysis . European Radiology . 2021. . 10.1007/s00330-021-08003-8 [DOI] [PMC free article] [PubMed] [Google Scholar]
- 90. Suh YJ , Hong H , Ohana M , Bompard F , Revel MP , Valle C , et al . Pulmonary Embolism and Deep Vein Thrombosis in COVID-19: A Systematic Review and Meta-Analysis . Radiology . 2021. ; 298 ( 2 ): E70 – E80 . 10.1148/radiol.2020203557 [DOI] [PMC free article] [PubMed] [Google Scholar]
- 91. Dhawan RT , Gopalan D , Howard L , Vicente A , Park M , Manalan K , et al . Beyond the clot: perfusion imaging of the pulmonary vasculature after COVID-19 . The Lancet Respiratory Medicine . 2021. ; 9 ( 1 ): 107 – 16 . 10.1016/s2213-2600(20)30407-0 [DOI] [PMC free article] [PubMed] [Google Scholar]
- 92. Remy-Jardin M , Duthoit L , Perez T , Felloni P , Faivre JB , Fry S , et al . Assessment of pulmonary arterial circulation 3 months after hospitalization for SARS-CoV-2 pneumonia: Dual-energy CT (DECT) angiographic study in 55 patients . EClinicalMedicine . 2021. ; 34 : 100778 . 10.1016/j.eclinm.2021.100778 [DOI] [PMC free article] [PubMed] [Google Scholar]
- 93. Wells AU , Devaraj A , Desai SR . Interstitial Lung Disease after COVID-19 Infection: A Catalog of Uncertainties . Radiology . 2021. ; 299 ( 1 ): E216 – E8 . 10.1148/radiol.2021204482 [DOI] [PMC free article] [PubMed] [Google Scholar]
- 94. Hansell DM , Bankier AA , MacMahon H , McLoud TC , Muller NL , Remy J . Fleischner Society: glossary of terms for thoracic imaging . Radiology . 2008. ; 246 ( 3 ): 697 – 722 . 10.1148/radiol.2462070712 [DOI] [PubMed] [Google Scholar]
- 95. Zhang Y , Liu Y , Gong H , Wu L . Quantitative lung lesion features and temporal changes on chest CT in patients with common and severe SARS-CoV-2 pneumonia . PLoS One . 2020. ; 15 ( 7 ): e0236858 . 10.1371/journal.pone.0236858 [DOI] [PMC free article] [PubMed] [Google Scholar]
- 96. Wang YC , Luo H , Liu S , Huang S , Zhou Z , Yu Q , et al . Dynamic evolution of COVID-19 on chest computed tomography: experience from Jiangsu Province of China . Eur Radiol . 2020. ; 30 ( 11 ): 6194 – 203 . 10.1007/s00330-020-06976-6 [DOI] [PMC free article] [PubMed] [Google Scholar]
- 97. Li K , Liu X , Yip R , Yankelevitz DF , Henschke CI , Geng Y , et al . Early prediction of severity in coronavirus disease (COVID-19) using quantitative CT imaging . Clinical Imaging . 2021. ; 78 : 223 – 9 . 10.1016/j.clinimag.2021.02.003 [DOI] [PMC free article] [PubMed] [Google Scholar]
- 98. Chabi ML , Dana O , Kennel T , Gence-Breney A , Salvator H , Ballester MC , et al . Automated AI-Driven CT Quantification of Lung Disease Predicts Adverse Outcomes in Patients Hospitalized for COVID-19 Pneumonia . Diagnostics (Basel) . 2021. ; 11 ( 5 . 10.3390/diagnostics11050878 [DOI] [PMC free article] [PubMed] [Google Scholar]
- 99. Pang B , Li H , Liu Q , Wu P , Xia T , Zhang X , et al . CT Quantification of COVID-19 Pneumonia at Admission Can Predict Progression to Critical Illness: A Retrospective Multicenter Cohort Study . Frontiers in Medicine . 2021. ; 8 ( 810 . 10.3389/fmed.2021.689568 [DOI] [PMC free article] [PubMed] [Google Scholar]
- 100. Liu M , Lv F , Huang Y , Xiao K . Follow-Up Study of the Chest CT Characteristics of COVID-19 Survivors Seven Months After Recovery . Front Med (Lausanne) . 2021. ; 8 : 636298 . 10.3389/fmed.2021.636298 [DOI] [PMC free article] [PubMed] [Google Scholar]
- 101. Kassin MT , Varble N , Blain M , Xu S , Turkbey EB , Harmon S , et al . Generalized chest CT and lab curves throughout the course of COVID-19 . Sci Rep . 2021. ; 11 ( 1 ): 6940 . 10.1038/s41598-021-85694-5 [DOI] [PMC free article] [PubMed] [Google Scholar]
- 102. Zou JN , Sun L , Wang BR , Zou Y , Xu S , Ding YJ , et al . The characteristics and evolution of pulmonary fibrosis in COVID-19 patients as assessed by AI-assisted chest HRCT . PLOS ONE . 2021. ; 16 ( 3 ): e0248957 . 10.1371/journal.pone.0248957 [DOI] [PMC free article] [PubMed] [Google Scholar]
- 103. Humphries SM , Swigris JJ , Brown KK , Strand M , Gong Q , Sundy JS , et al . Quantitative high-resolution computed tomography fibrosis score: performance characteristics in idiopathic pulmonary fibrosis . Eur Respir J . 2018. ; 52 ( 3 . 10.1183/13993003.01384-2018 [DOI] [PubMed] [Google Scholar]
- 104. Humphries SM , Yagihashi K , Huckleberry J , Rho BH , Schroeder JD , Strand M , et al . Idiopathic Pulmonary Fibrosis: Data-driven Textural Analysis of Extent of Fibrosis at Baseline and 15-Month Follow-up . Radiology . 2017. ; 285 ( 1 ): 270 – 8 . 10.1148/radiol.2017161177 [DOI] [PMC free article] [PubMed] [Google Scholar]
- 105. Raghu G , Wilson KC . COVID-19 interstitial pneumonia: monitoring the clinical course in survivors . Lancet Respir Med . 2020. ; 8 ( 9 ): 839 – 42 . 10.1016/S2213-2600(20)30349-0 [DOI] [PMC free article] [PubMed] [Google Scholar]
- 106. Mathai SK , Humphries S , Kropski JA , Blackwell TS , Powers J , Walts AD , et al . MUC5B variant is associated with visually and quantitatively detected preclinical pulmonary fibrosis . Thorax . 2019. ; 74 ( 12 ): 1131 – 9 . 10.1136/thoraxjnl-2018-212430 [DOI] [PMC free article] [PubMed] [Google Scholar]
- 107. Salisbury ML , Hewlett JC , Ding G , Markin CR , Douglas K , Mason W , et al . Development and Progression of Radiologic Abnormalities in Individuals at Risk for Familial Interstitial Lung Disease . American Journal of Respiratory and Critical Care Medicine . 2020. ; 201 ( 10 ): 1230 – 9 . 10.1164/rccm.201909-1834OC [DOI] [PMC free article] [PubMed] [Google Scholar]
- 108. Jacob J , Bartholmai BJ , Rajagopalan S , Kokosi M , Egashira R , Brun AL , et al . Serial automated quantitative CT analysis in idiopathic pulmonary fibrosis: functional correlations and comparison with changes in visual CT scores . Eur Radiol . 2018. ; 28 ( 3 ): 1318 – 27 . 10.1007/s00330-017-5053-z [DOI] [PubMed] [Google Scholar]
- 109. Huang C , Huang L , Wang Y , Li X , Ren L , Gu X , et al . 6-month consequences of COVID-19 in patients discharged from hospital: a cohort study . The Lancet . 2021. ; 397 ( 10270 ): 220 – 32 . 10.1016/s0140-6736(20)32656-8 [DOI] [PMC free article] [PubMed] [Google Scholar]
- 110. Tabatabaei SMH , Rajebi H , Moghaddas F , Ghasemiadl M , Talari H . Chest CT in COVID-19 pneumonia: what are the findings in mid-term follow-up? Emergency Radiology . 2020. ; 27 ( 6 ): 711 – 9 . 10.1007/s10140-020-01869-z [DOI] [PMC free article] [PubMed] [Google Scholar]
- 111. Yu M LY , Xu D , Zhang R , Lan L , Xu H . Prediction of the Development of Pulmonary Fibrosis using Serial Thin-Section CT and Clinical Features in Patients Discharged after Treatment for COVID-19 Pneumonia . Korean Journal of Radiology . 2020. ; 21 ( 6 ): 746 – 55 . 10.3348/kjr.2020.0215 [DOI] [PMC free article] [PubMed] [Google Scholar]
- 112. McGroder CF , Zhang D , Choudhury MA , Salvatore MM , D'Souza BM , Hoffman EA , et al . Pulmonary fibrosis 4 months after COVID-19 is associated with severity of illness and blood leucocyte telomere length . Thorax . 2021. : 10.1136/thoraxjnl-2021-217031 [DOI] [PMC free article] [PubMed] [Google Scholar]
- 113. Huang W , Wu Q , Chen Z , Xiong Z , Wang K , Tian J , et al . The potential indicators for pulmonary fibrosis in survivors of severe COVID-19 . J Infect . 2021. ; 82 ( 2 ): e5 – e7 . 10.1016/j.jinf.2020.09.027 [DOI] [PMC free article] [PubMed] [Google Scholar]
- 114. Lerum TV , Aaløkken TM , Brønstad E , Aarli B , Ikdahl E , Lund KMA , et al . Dyspnoea, lung function and CT findings three months after hospital admission for COVID-19 . European Respiratory Journal . 2020. : 2003448 . 10.1183/13993003.03448-2020 [DOI] [PMC free article] [PubMed] [Google Scholar]
- 115. George PM , Wells AU , Jenkins RG . Pulmonary fibrosis and COVID-19: the potential role for antifibrotic therapy . Lancet Respir Med . 2020. ; 8 ( 8 ): 807 – 15 . 10.1016/S2213-2600(20)30225-3 [DOI] [PMC free article] [PubMed] [Google Scholar]
- 116. Richeldi L , Du Bois RM , Raghu G , Azuma A , Brown KK , Costabel U , et al . Efficacy and Safety of Nintedanib in Idiopathic Pulmonary Fibrosis . New England Journal of Medicine . 2014. ; 370 ( 22 ): 2071 – 82 . 10.1056/nejmoa1402584 [DOI] [PubMed] [Google Scholar]
- 117. Hamalainen M , Nieminen R , Vuorela P , Heinonen M , Moilanen E . Anti-inflammatory effects of flavonoids: genistein, kaempferol, quercetin, and daidzein inhibit STAT-1 and NF-kappaB activations, whereas flavone, isorhamnetin, naringenin, and pelargonidin inhibit only NF-kappaB activation along with their inhibitory effect on iNOS expression and NO production in activated macrophages . Mediators Inflamm . 2007. ; 2007 : 45673 . 10.1155/2007/45673 [DOI] [PMC free article] [PubMed] [Google Scholar]
- 118. Nalbandian A , Sehgal K , Gupta A , Madhavan MV , McGroder C , Stevens JS , et al . Post-acute COVID-19 syndrome . Nat Med . 2021. ; 27 ( 4 ): 601 – 15 . 10.1038/s41591-021-01283-z [DOI] [PMC free article] [PubMed] [Google Scholar]
- 119. Caruso D et al . Postacute sequelae of COVID-19 pneumonia: 6-month chest CT follow-up . Radiology (in press) . https://pubs.rsna.org/doi/10.1148/radiol.2021210834 . [DOI] [PMC free article] [PubMed]


