Abstract
Some pulmonary diseases and injuries are believed to correlate with lung viscoelasticity changes. Hence, a better understanding of lung viscoelastic models could provide new perspectives on the progression of lung pathology and trauma. In the presented study, stress relaxation measurements were performed to quantify relaxation behavior of pig lungs. Results have uncovered certain trends, including an initial steep decay followed by a slow asymptotic relaxation, which would be better described by a power law than exponential decay. The fractional standard linear solid (FSLS) and two integer order viscoelastic models – standard linear solid (SLS) and generalized Maxwell (GM) – were used to fit the stress relaxation curves; the FSLS was found to be a better fit. It is suggested that fractional order viscoelastic models, which have nonlocal, multi-scale attributes and exhibit power law behavior, better capture the lung parenchyma viscoelastic behavior.
1. Introduction
Viscoelastic materials are those which behave between elastic solids and viscous fluids. Lung parenchyma, like many biological soft tissues, is highly viscoelastic. A wide range of pulmonary pathologies and injuries such as fibrosis, asthma and emphysema correlate with significant changes, locally or diffusely, in lung viscoelasticity [1–5]. Better understanding of lung viscoelastic properties could provide new perspectives on the relation between lung structure and function, and the progression of pathology and trauma from a biomechanical point of view. By developing an improved understanding of the viscoelastic behavior of biological tissue, more realistic analytical models of biological tissues would be possible. These in turn may enable improved pulmonary diagnostic, therapeutic and educational modalities. Examples of these possibilities include: diagnostic systems based on breath sound analysis; diagnosis utilizing magnetic resonance and ultrasound elastography; therapeutic approaches such as lung cancer particle beam and other radiation therapy; and improved haptic and other simulation technologies to facilitate video assisted thoracoscopic surgery training.
Lung tissue was first noted to be viscoelastic by Bayliss and Robertson in 1939 and by Mount in 1955 [6–7]. Lung stress relaxation and hysteresis were studied by Marshall et al. [8]. Hildebrandt [9–10] and Bachofen [11] studied lung viscoelasticity in human and in isolated cat lung.
Hildebrandt [12] and Suki [13] found that for an isolated cat lung the ratio of pressure and volume followed temporal power law dependence. Suki et al. [13] used fractional viscoelasticity to model the lung tissue mechanics and hypothesized on its molecular basis. Magin [14] provides a review of fractional viscoelasticity modeling and describes its fractal origins making it a rational choice for biological and other materials with a complex multi-scale structure.
Models using mechanical analogies of spring and dashpot components have been used to represent material viscoelastic properties. The parameters of these components can be estimated by least square fitting the measurements of the temporal or spectral response of the material Young’s or shear modulus to the predictions of the different models. The standard linear solid (SLS) is the simplest model that predicts stress relaxation and creep with a parallel combination of a Maxwell model (spring and dashpot in series) and a spring [15]. Its temporal response to a step strain is a decaying exponential function. The SLS model shows limitations in its ability to accurately capture dynamic phenomena over multiple time scales and/or with broad spectral content, particularly for biological tissues. One way to overcome such limitations is through the use of more complex models with a larger number of parameters to increase agreement with experimental behavior; but, this comes at the expense of obscuring the physical meaning of the viscoelastic model.
Recently, some models based on the fractional order derivative have been applied to biological tissue viscoelasticity [13,16–21]. The fractional order derivative leads to a component called a spring-pot of order α which behaves between pure elastic and viscous materials. Both temporal relaxation and frequency response of a spring-pot follow power law functions that seem to be naturally adapted to fit soft tissue viscoelasticity. Craiem et al. [22] performed uniaxial elongations on human arteries and found that a fractional SLS model predicted arterial stress relaxation better than the conventional SLS model. Fractional order viscoelastic models also have shown the potential to yield new disease and treatment specific parameters that more effectively predict underlying changes in tissue associated with developing pathology, such as liver cirrhosis and breast cancer. For example, a relatively simple power law relationship was fit to the complex shear modulus of human breast tissue and tumors measured by magnetic resonance elastography [21]. The results, when plotted as the fractional power exponent versus the fractional order attenuation, separated benign from malignant tumors with an increased specificity and sensitivity compared to other models.
The objective of the current study is to measure the stress relaxation on freshly excised and inflated pig lungs and fit the measurement with typical models: SLS, GM and FSLS. The degree of fitting, and advantages and disadvantages of each model will be evaluated. The stress-strain relationship and relaxation function due to a unit step strain are covered in Sec. 2. The experimental procedures including: fresh and inflated pig lung preparation, the stress relaxation test, and mechanical indentation test are described in Sec. 3. Sec. 4 displays the experimental and fitting results followed by a discussion in Sec. 5.
2. Theory
According to Fung [15], the stress-strain relationship for the standard linear solid (SLS) model (shown in Fig. 1) is
| (1) |
where σ is the stress, ε is the strain, t is the time, E0 and E1 are the spring stiffness in the SLS model and η is the damping coefficient of the dashpot. Subject to a strain of a unit step function 1(t) and according to Fung [15], the relaxation function, which is the stress resulting from that strain, is
| (2) |
where τ = η/E1 and is called the relaxation time for constant strain.
Fig. 1.
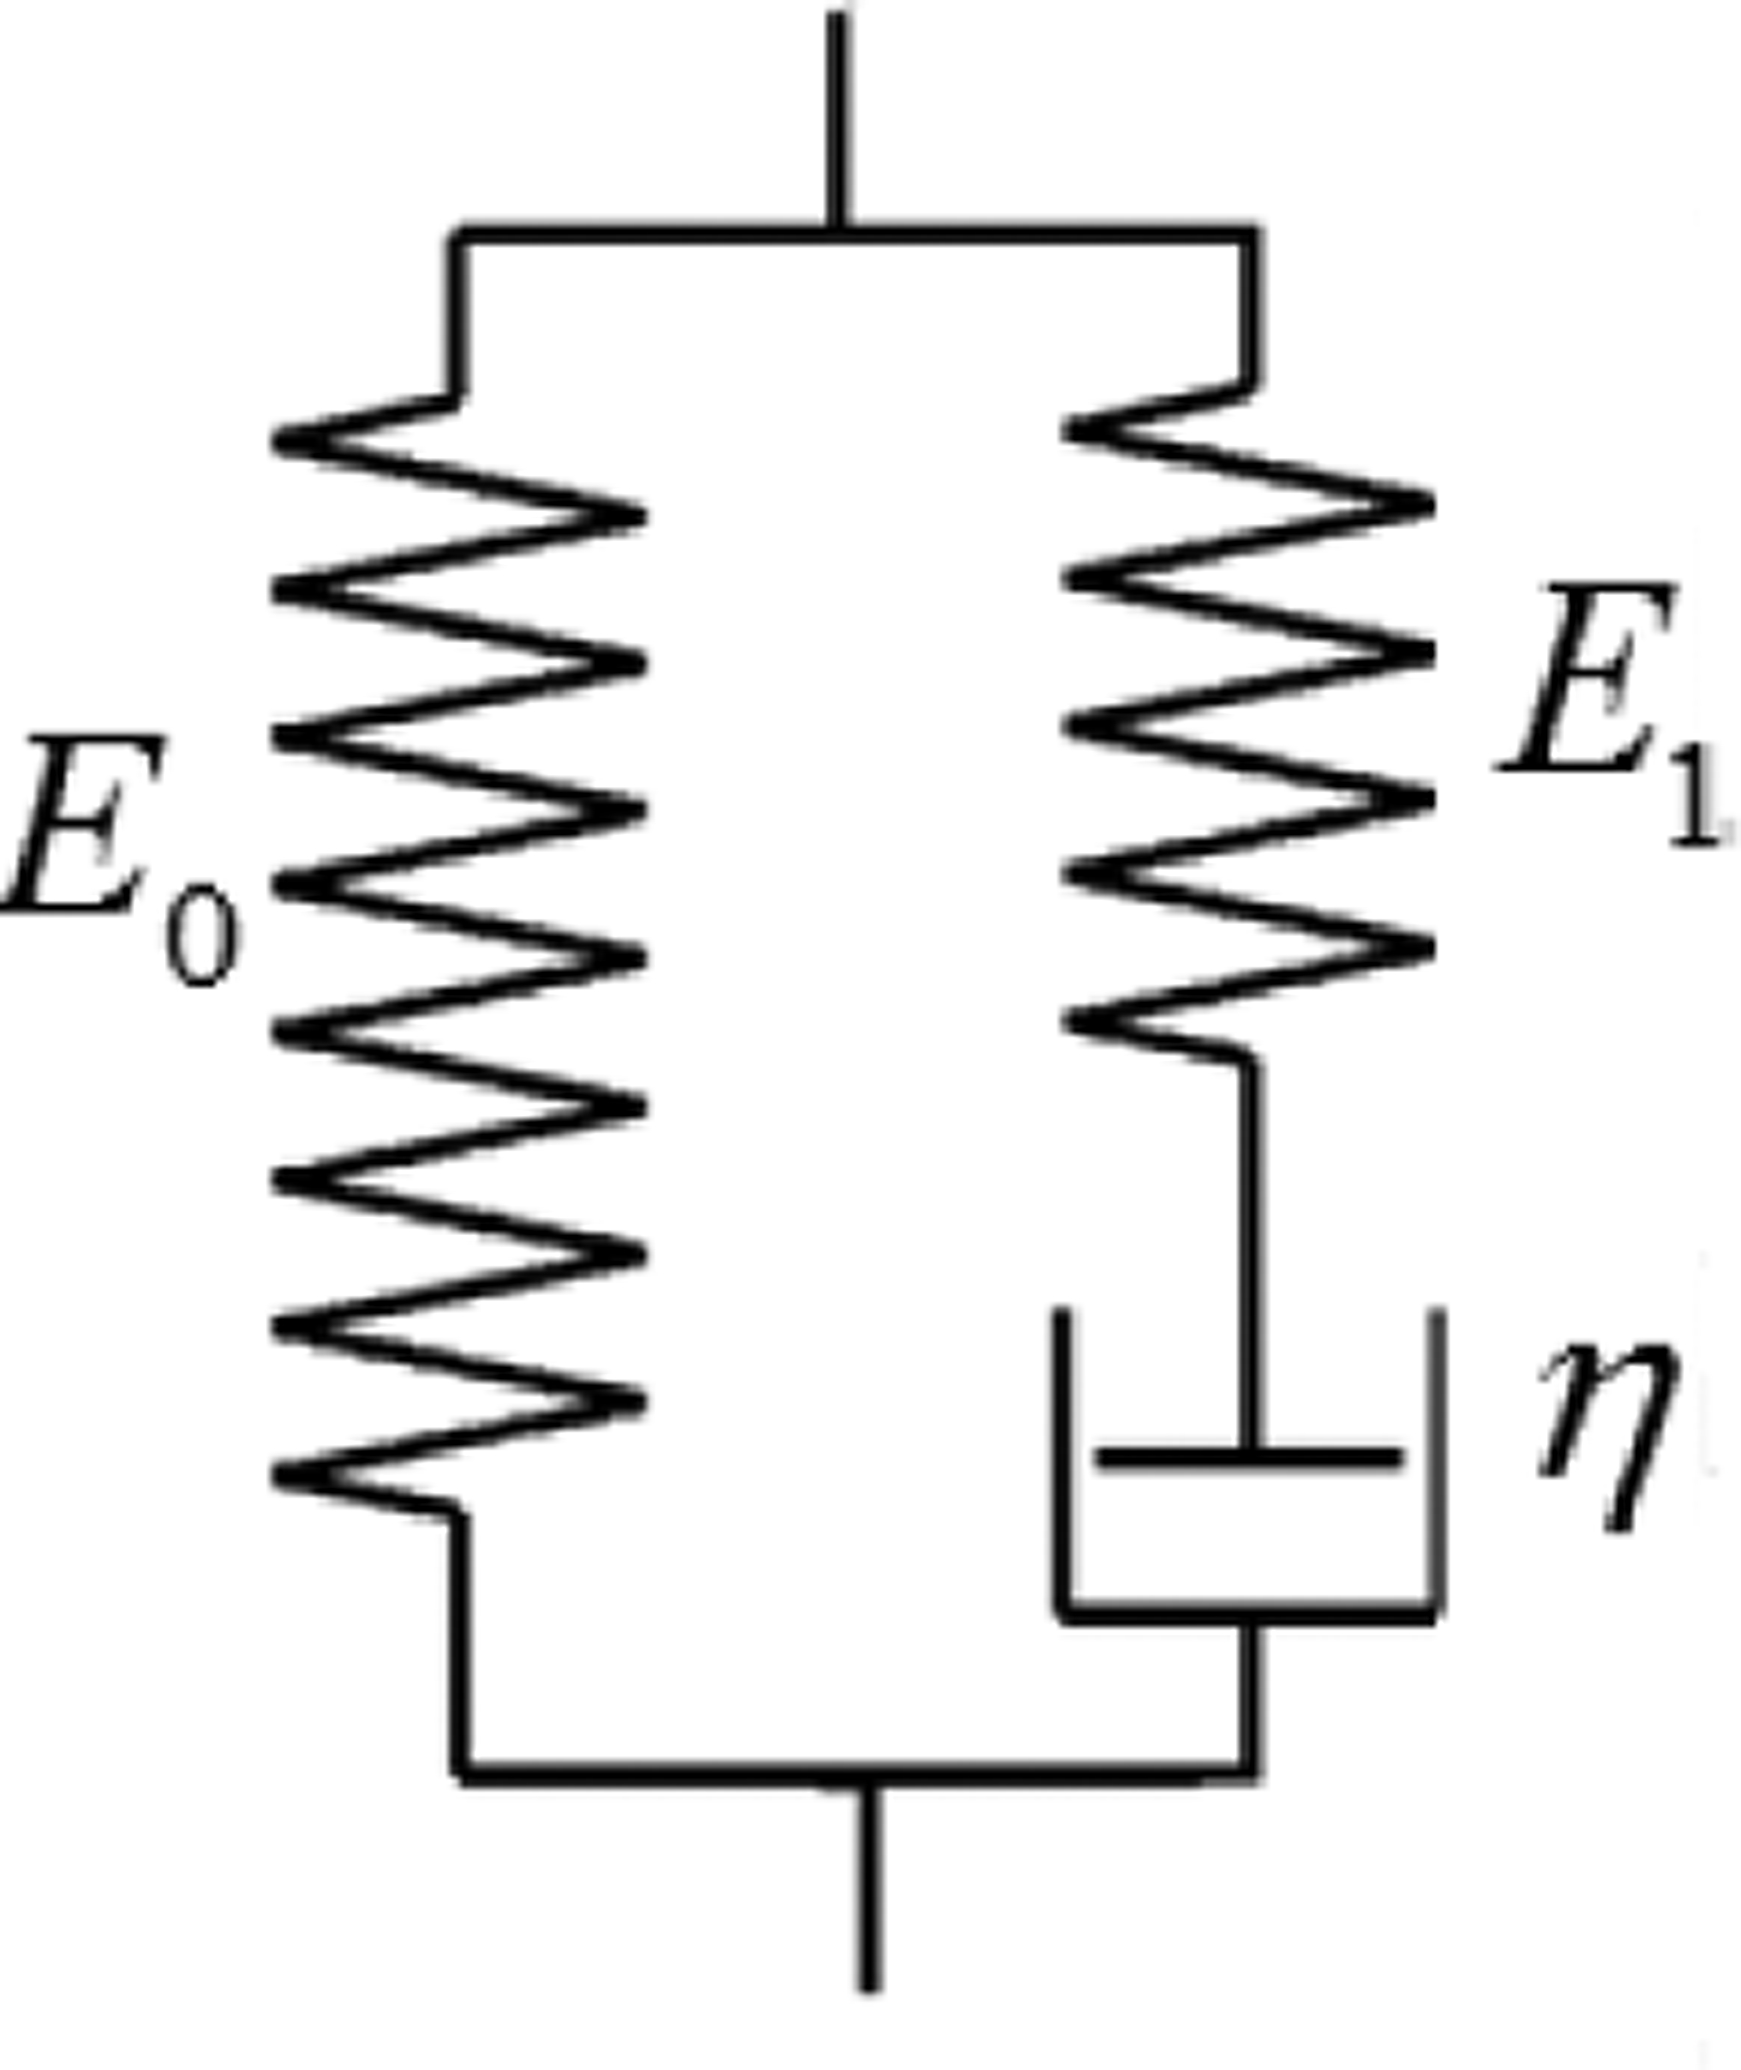
Schematic diagram of SLS model.
According to Craiem [22], the fractional order derivative α of a function f(t) can be expressed by the following integral representation
| (3) |
where Dα denotes the α -th order derivative of f(t) with respect to time, and Г is the gamma function. By using fractional order derivatives, we can create a component called a spring-pot of order α that behaves between pure elastic and viscous materials. The stress strain relationship of a spring-pot is
| (4) |
where Eα is the viscoelastic coefficient. Substituting the dashpot in the SLS model with a spring-pot leads to the fractional SLS (FSLS) model shown in Fig. 2 and according to Craiem [22] the stress strain relationship is
| (5) |
Fig. 2.
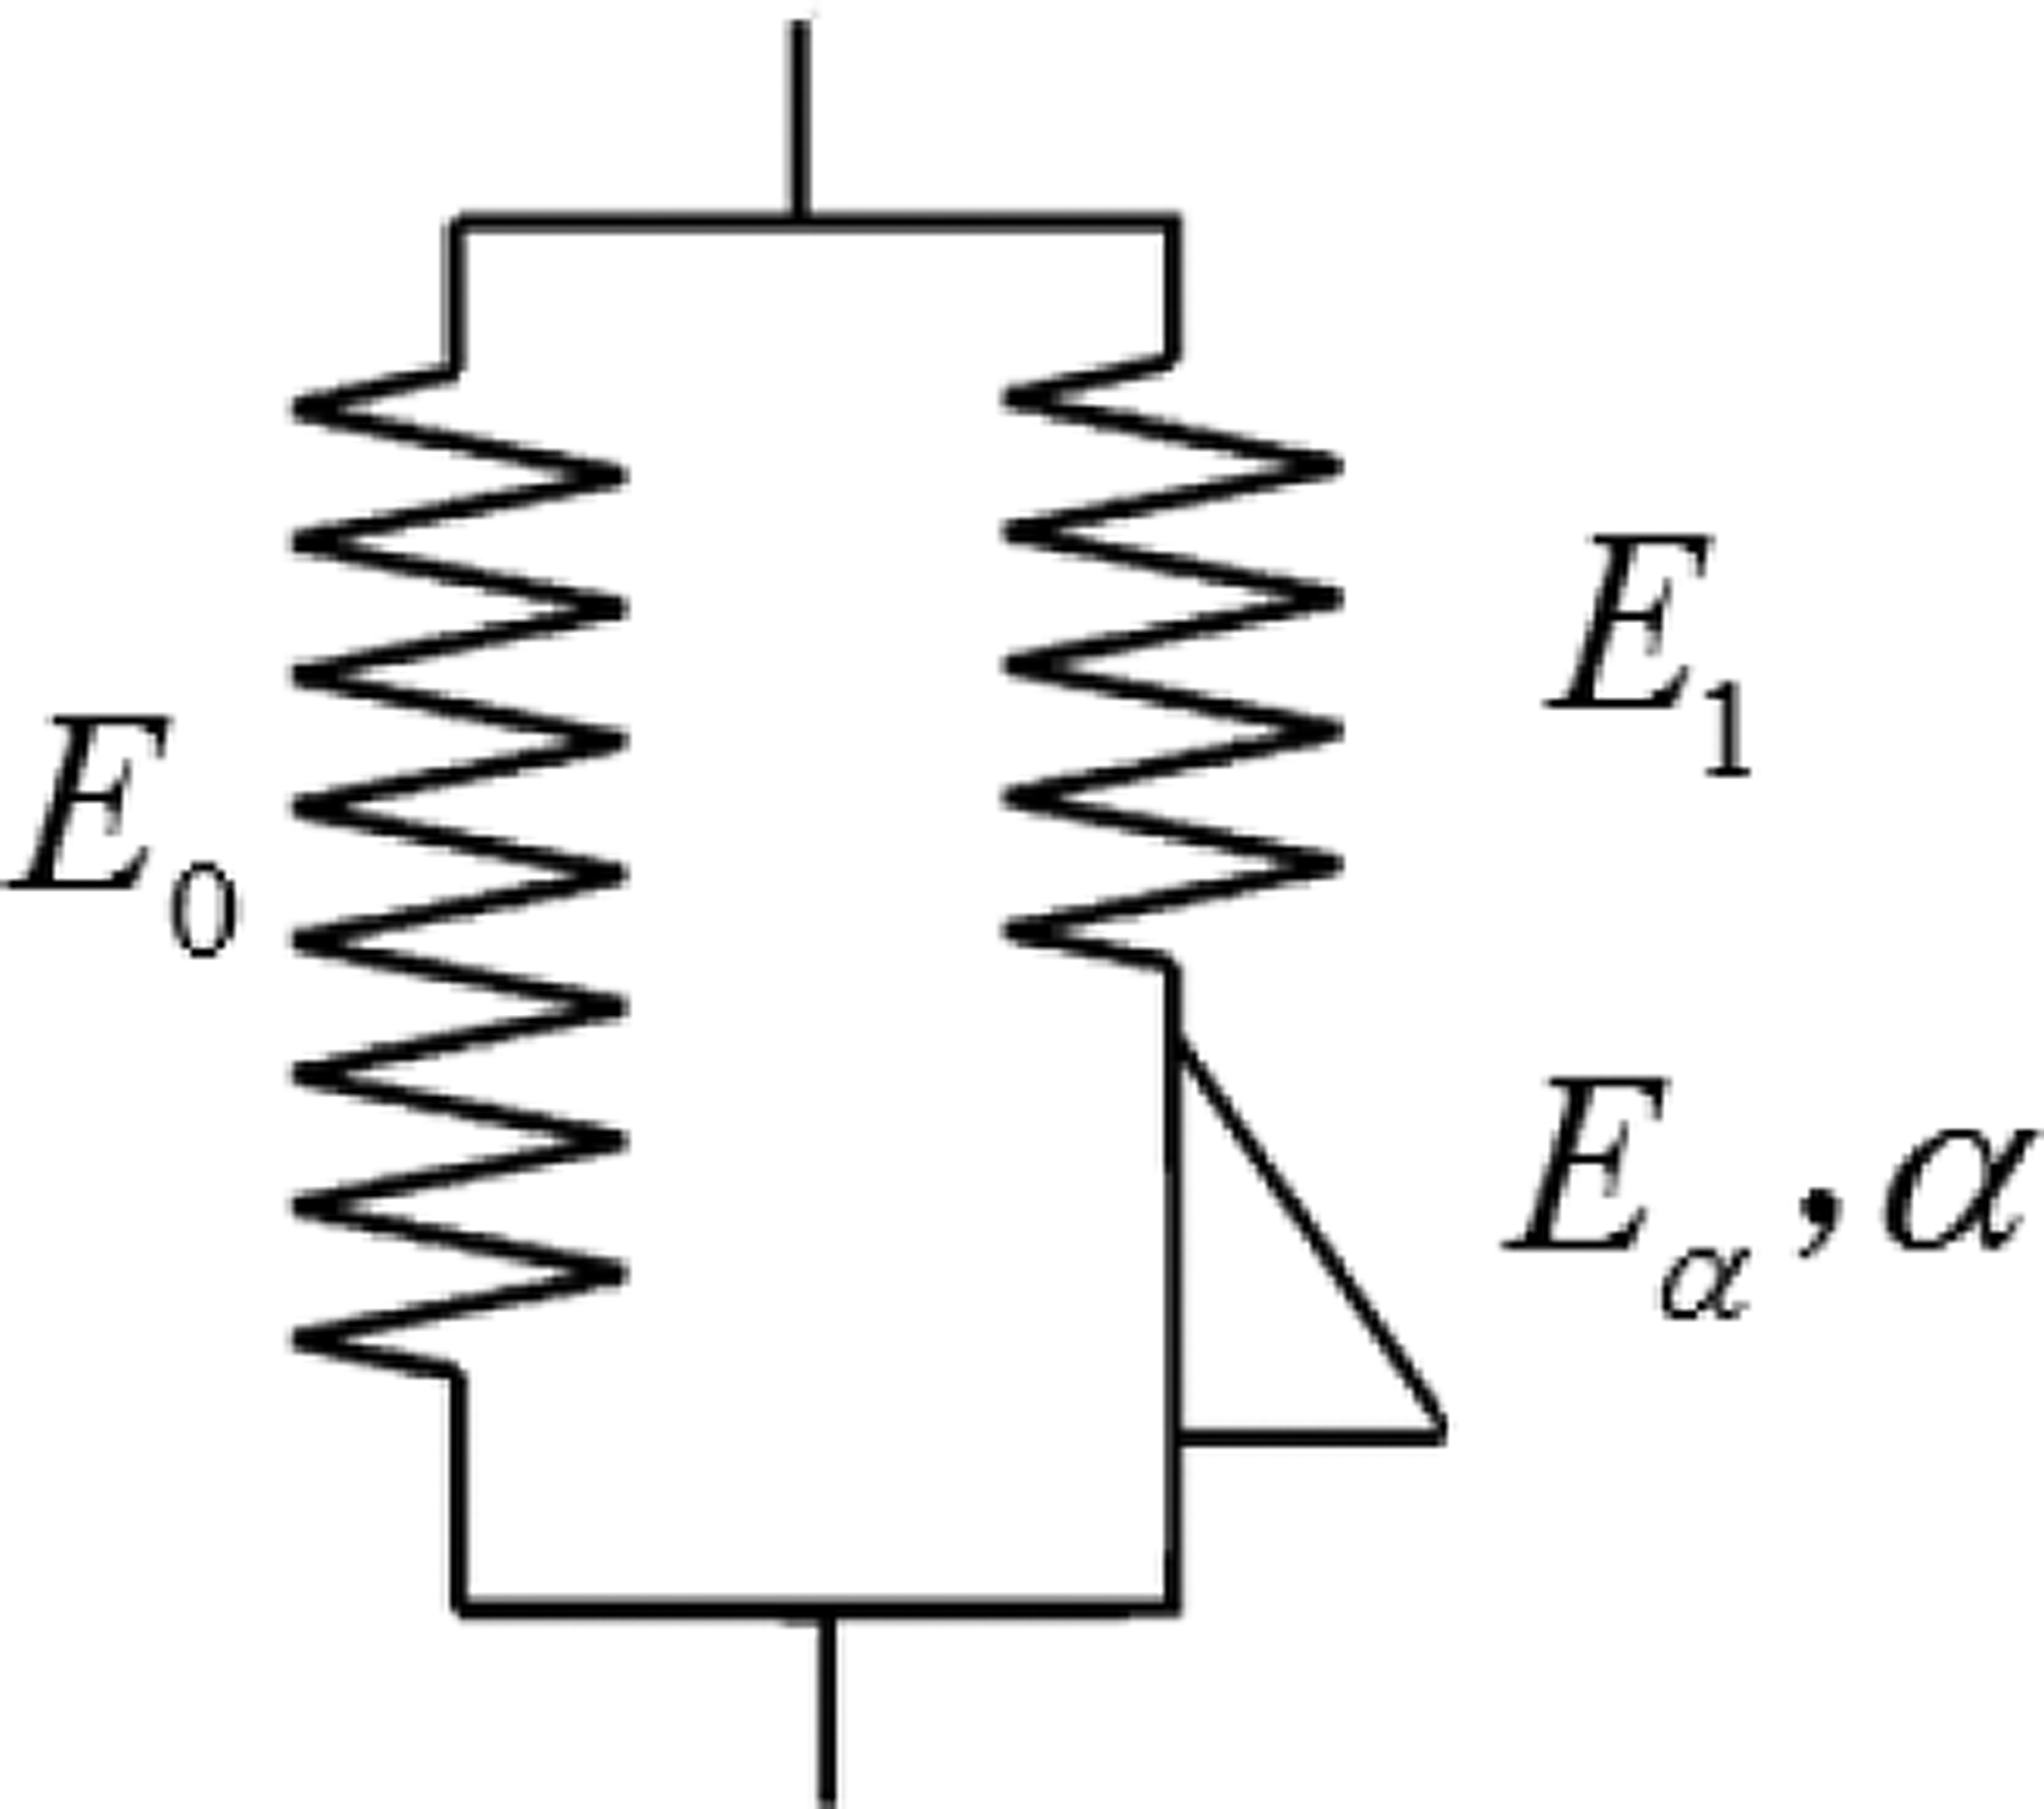
Schematic diagram of FSLS model.
Subject to a strain of a unit step function 1(t) and according to Craiem [22], the relaxation function of the FSLS model is
| (6) |
where τσ = (Eα / E1)1/α and Fα is the Mittag-Leffler function defined as
| (7) |
If the spring E1 is removed in the FSLS model this leads to the fractional Voigt (FV) model. According to Magin [14], its relaxation function due to unit step function shows the power law relaxation and it is
| (8) |
It is observed that there is a singularity at t=0. So the FV model was not used for stress relaxation fitting in the current study due to this singularity even though it is widely used in fitting the dynamic modulus in the frequency domain.
The generalized Maxwell (GM) model with two Maxwell elements assembled in parallel is shown in Fig. 3. Its relaxation function is
| (9) |
where τ1 = η1 / E1, τ2 = η2 / E2. E0, E1 and E2 are the spring stiffness. η1 and η2 are the damping coefficients of the dashpots. τ1 and τ2 are the different relaxation times for constant strain.
Fig. 3.
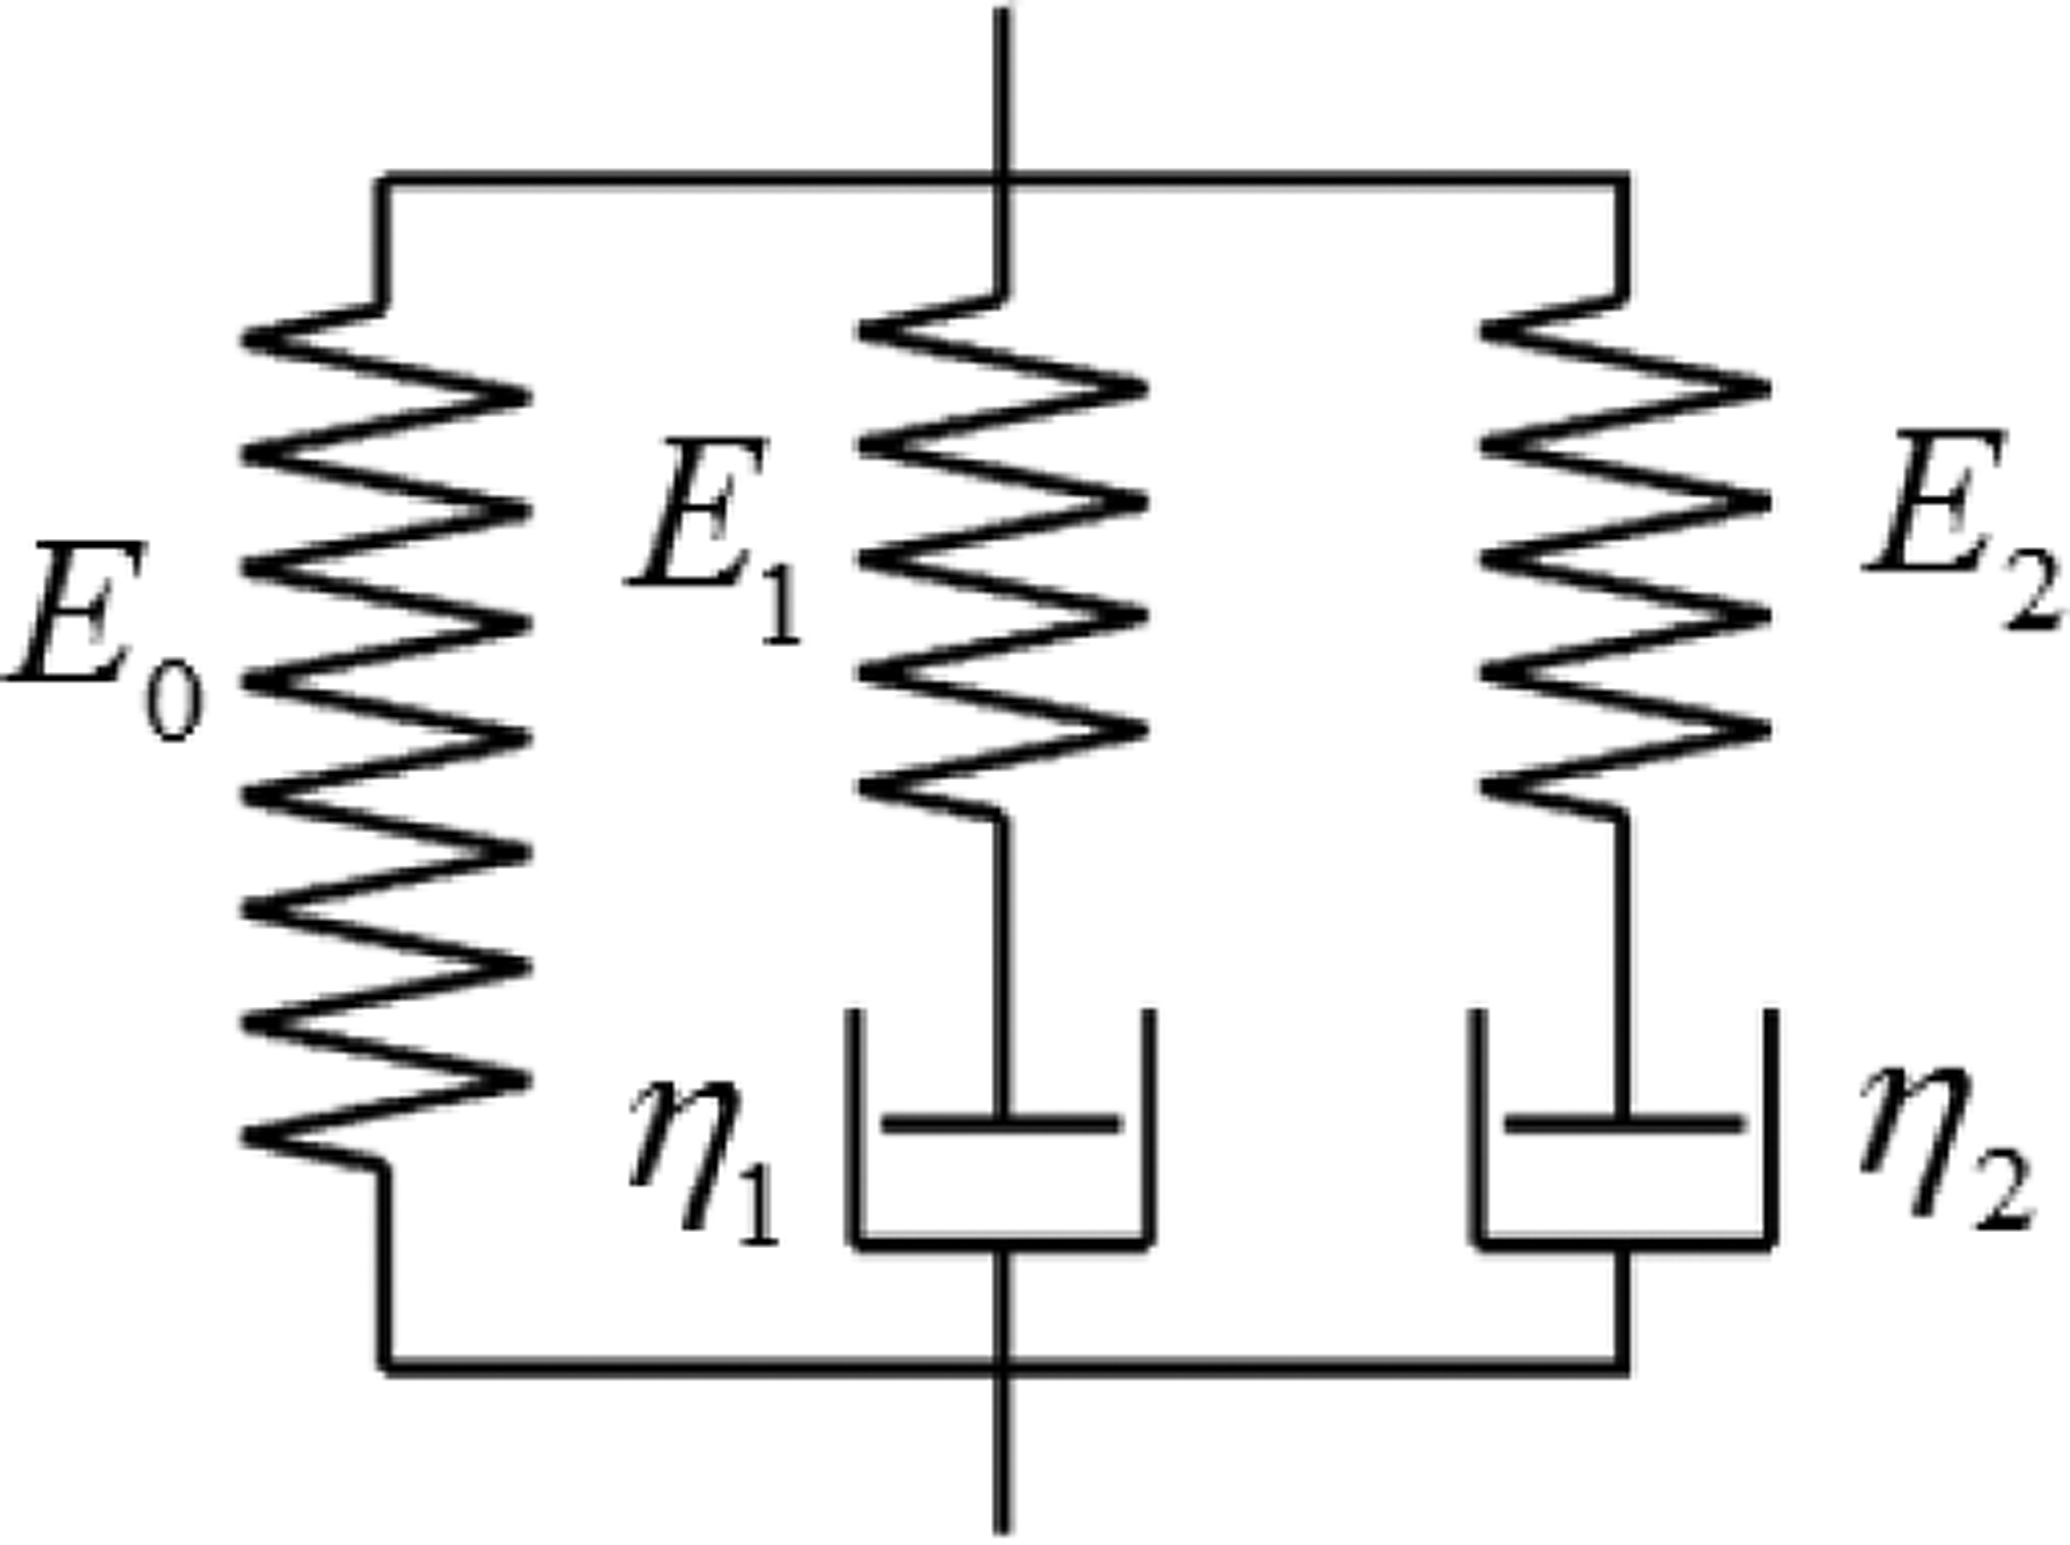
Schematic diagram of Generalized Maxwell model.
In the current study, the ability of different models to describe stress relaxation of the pig lung is assessed. Model selection should be done with care. The selection criterion is that the model should accurately capture the lung stress relaxation with the fewest number of parameters, which can render an easier physical interpretation. It is reported that for most soft biological tissues subject to step function strain, the relaxation stress is finite and asymptotically reaches a steady state non-zero value [13,23,24]; so models with stress singularity at t=0 or those with zero stress for a large times should be excluded. Considering two-parameter models, it can be seen that the Voigt model has stress singularity at t=0 and the Maxwell model has an exponentially decaying stress to a zero value. For a spring-pot model, the stress has a singularity at t=0 and asymptotically approaches zero. Among the three-parameter integer order models shown in Fig. 4, the first two are called Zener models and the last two are called anti-Zener models by Mainardi et al. [25]. For Zener models, stress decays exponentially and for anti-Zener models, stress has a singularity at t=0 and exponentially decays to zero [25]. For the fractional Maxwell model (another three-parameter non-integer order model besides the fractional Voigt model), the stress decays to zero like the Maxwell model but with a power law instead of with an exponential law.
Fig. 4.
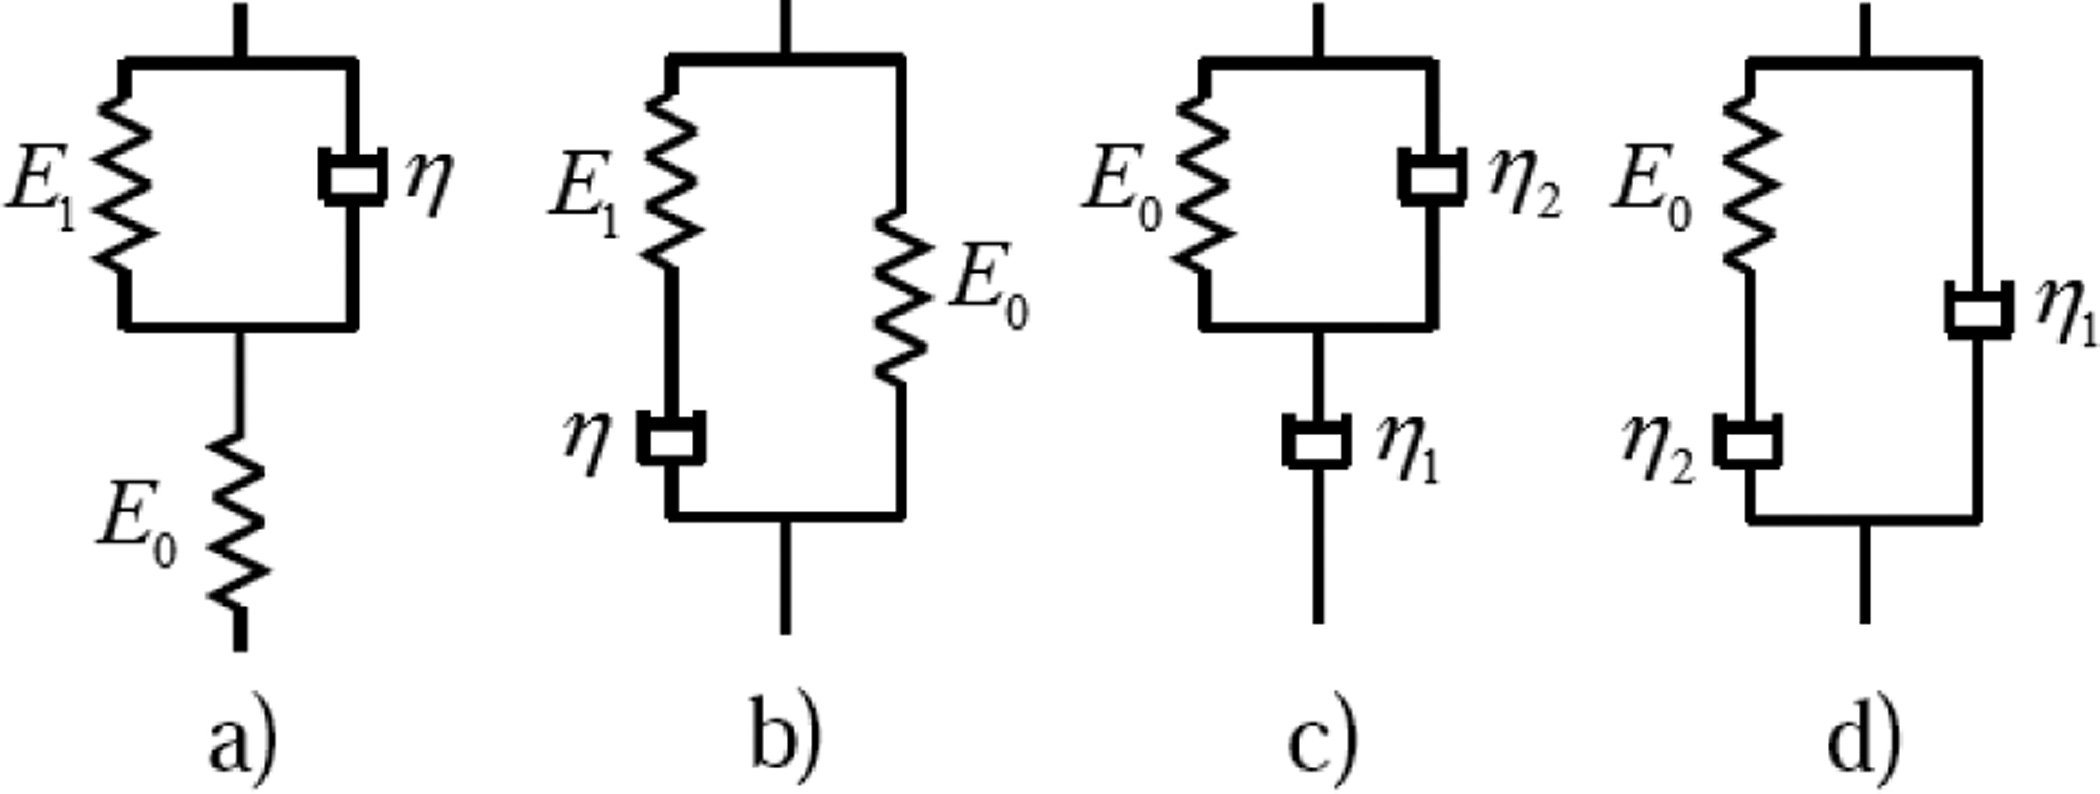
Schematic diagram of the Zener models (a), (b) and of the anti-Zener models (c), (d), where: (a) spring in series with Voigt, (b) spring in parallel with Maxwell, (c) dashpot in series with Voigt, (d) dashpot in parallel with Maxwell.
Among the four-parameter integer-order models shown in Fig. 5, the first two will cause the stress to decay to zero at two exponential rates while for the last two models, the stress has a singularity at t=0. Based on models in Fig. 5, the four-parameter non-integer-order models can be constructed by replacing a spring or dashpot with a spring-pot. But at least one spring should remain in the model to prevent the stress from decaying to zero. For models in Fig. 5 (c) and (d), replacing either dashpot will still cause the stress to have a singularity at t=0. For the Zener model in Fig. 4 (a), the relaxed Young’s modulus is E0E1/(E0+E1); the two parameters E0 and E1 can’t be estimated from an indentation test. For the SLS model, E0 is estimated from an indentation test and only two other parameters need to be estimated from the measured stress relaxation time history. So, only the SLS model was selected for new model construction. In order to avoid a singularity at t=0 for the stress, both springs in the SLS model need to be kept; so the dashpot was replaced by the spring-pot and this leads to the FSLS model. From the above it is found that FSLS model is the only four-parameter non-integer-order model which does not have a singularity for stress subject to step function strain and allows the stress to relax to a non-zero steady state value. It also suffices to describe the power law stress relaxation feature of the lung parenchyma within our time duration of interest by the FSLS model as shown in Sec. 4.
Fig. 5.
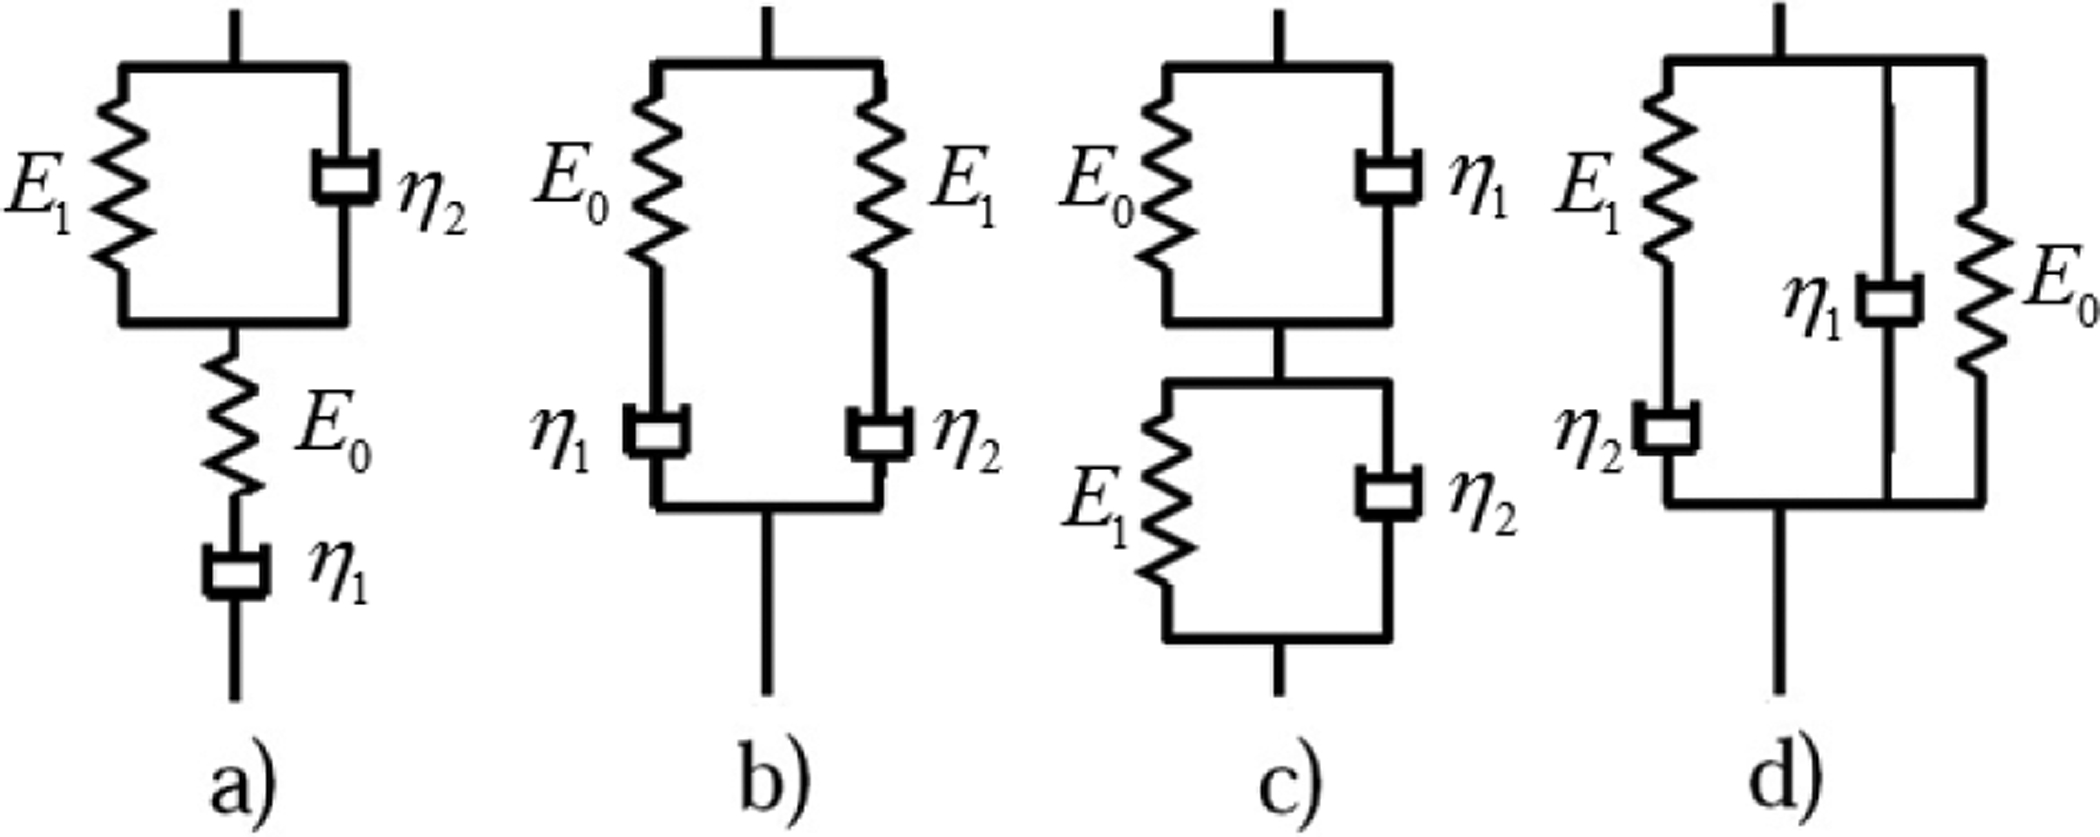
Schematic diagram of four-parameter integer-order models.
3. Materials and Methods
Freshly Excised Lung Preparation.
Stress relaxation experiments were carried out on the lung of two female Landrace and Yorkshire cross pigs (weight 30 to 35 kg). Immediately upon sacrifice the lungs were inflated with air to a positive pressure of 20 cm H2O. As the chest cavity was surgically opened and pleural pressure became atmospheric pressure, the transpulmonary pressure was maintained at 20 cm H2O. It was observed that all the lung lobes were uniformly inflated and no noticeable gas trapping was present. While maintaining 20 cm H2O pressure, a bilateral pulmonectomy was performed. The blood was gravity drained via the great vessels for 15 minutes, and the lung was placed on a vibration isolated test bench in a room maintained at 20°C. During this time the lung was periodically and lightly sprayed with water to keep the surface moist.
Stress Relaxation Tests on Excised and Inflated Lung.
A custom-built displacement-controlled instrument was used for the stress relaxation test. As shown in Fig. 6, it operates with a single downward lever stroke and the downward displacement is measured by the displacement sensor (LD320-5, Omega Engineering, Stamford, CT). A digital force gauge (DS2-1, Imada, Northbrook, IL) with a rod is mounted on the instrument. A steel cylindrical indenter with a 1.1 cm diameter is installed at the bottom end of the rod. The instrument was mounted vertically on a vibration isolation bench and downward displacements were applied normal to the lung surface. Stress relaxation tests were conducted in air at room temperature of 20°C for the lung. Displacement was applied to the lung by quickly pushing down the lever stroke of the instrument, which works like a stamping press. The created displacement was approximately treated as step function input. Six points on the anterior surface of the left cranial lobe of each pig lung were selected as the test points and a peak displacement of about 3.25 mm was applied to each test point with a 120 s hold period at peak depth. The duration of the stress relaxation test for each lung was about 15 minutes. The force–time data and the peak displacement were recorded by a custom-written data acquisition program using Labview 2012 (National Instruments, Austin, TX). As the rise time is about 0.5s (shown in Results Section), it is short enough that the stress relaxation response due to the applied ramp indentation force can be approximated as response due to a step force. The viscoelastic parameters can be estimated by fitting the force–time data to the equation
| (10) |
Fig. 6.
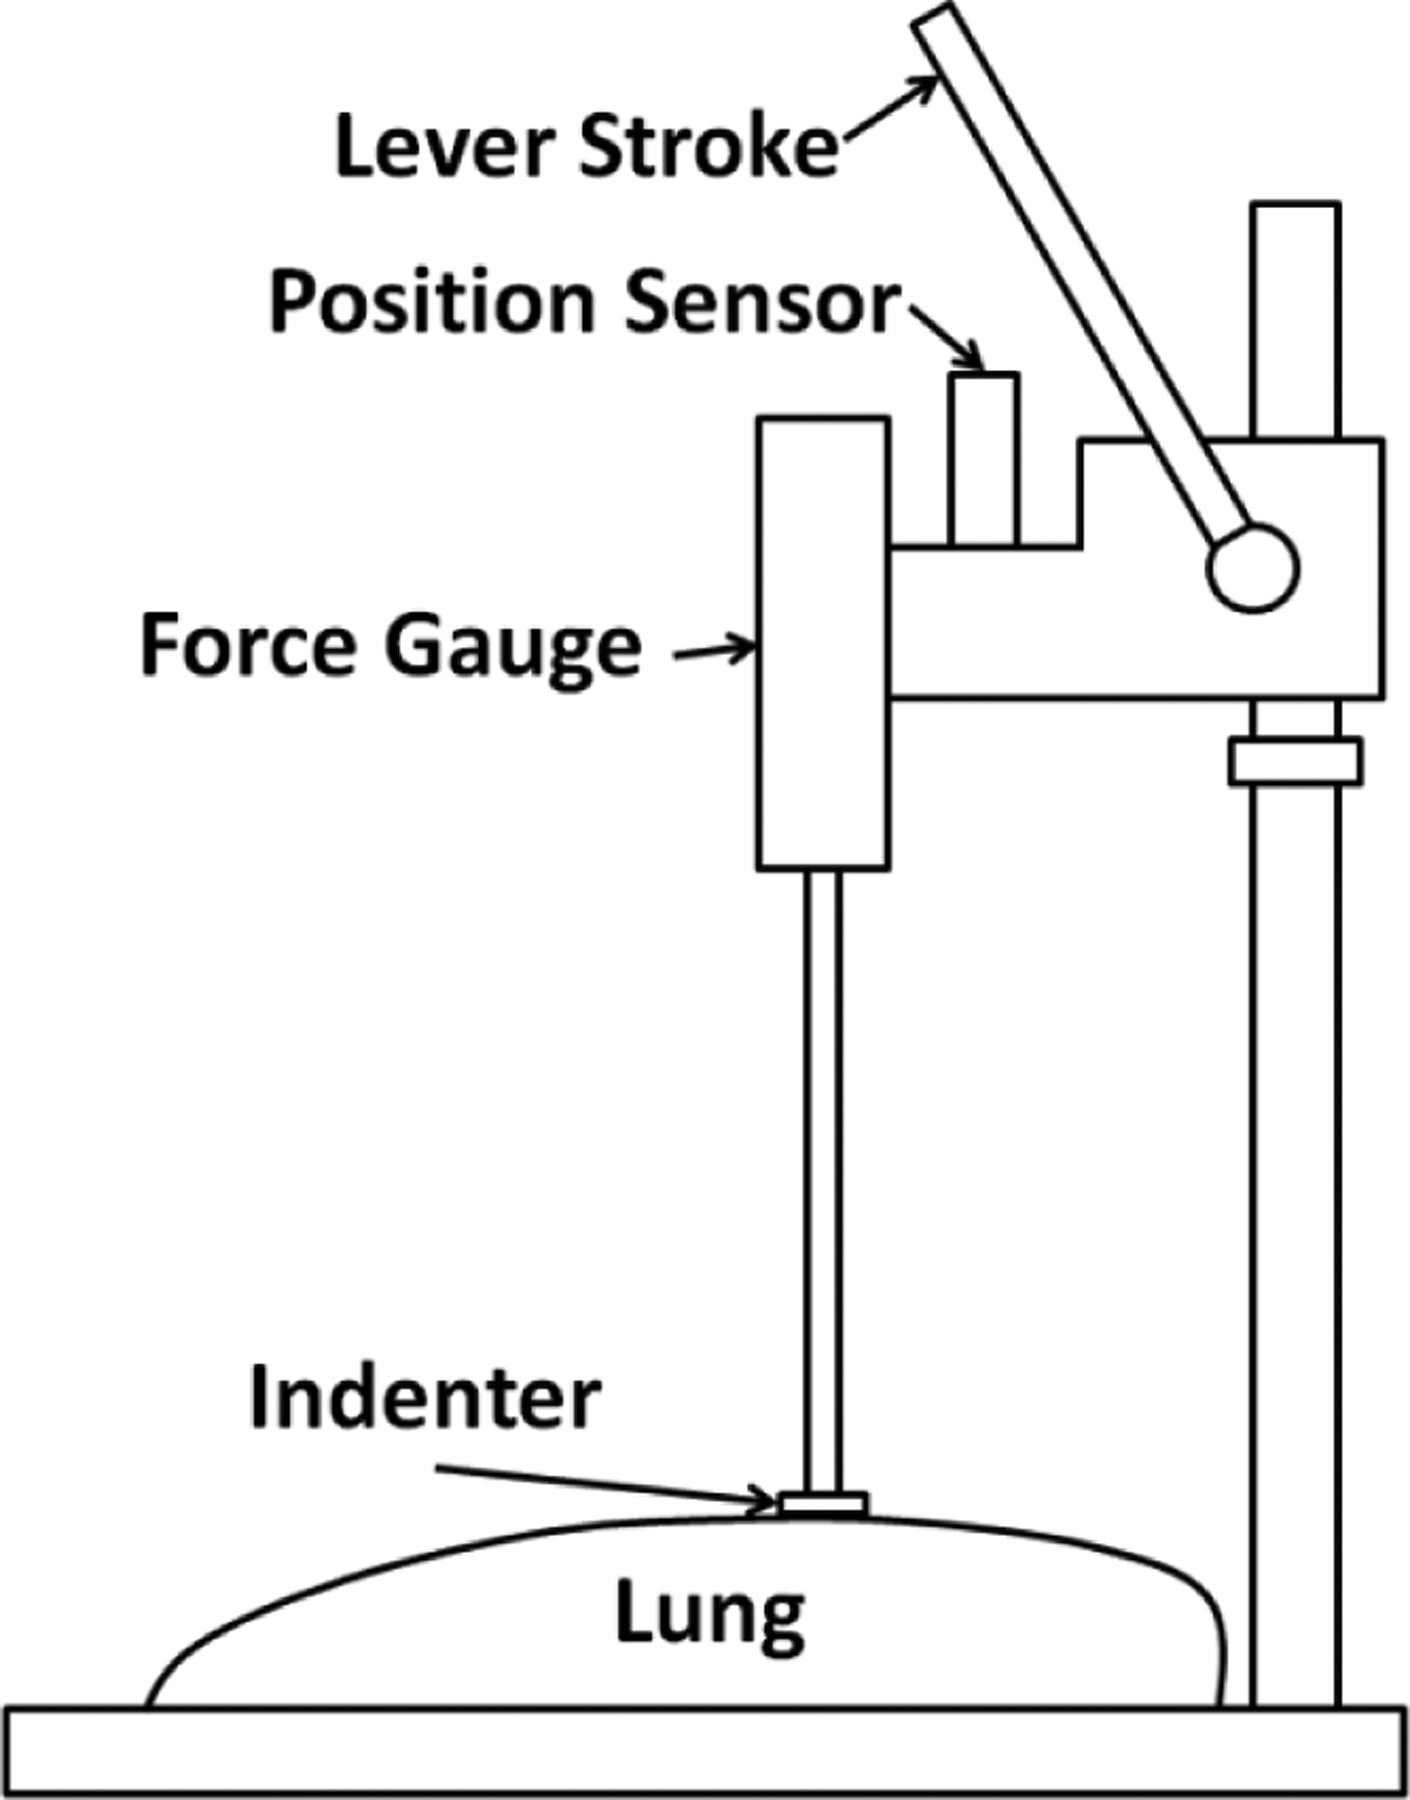
Schematic diagram of experimental setup of stress relaxation test.
Here, G(t) is the relaxation function with its viscoelastic parameters depending on the viscoelastic models in Sec. 2; R is the radius of the cylindrical indenter and d is the indentation depth. To evaluate the curve fitting quality, the root-mean-square error (RMSE) between the measured curve and the fitting curve is defined as
| (11) |
Mechanical Indentation Tests on Excised and Inflated Lung.
After completing the stress relaxation test, a mechanical indentation test was performed at the above selected six points of each pig lung using the same cylindrical indenter to determine the lung relaxed Young’s modulus at 20 cm H2O. In this test the indentation was gradually increased while measuring the force after each displacement change. The increment in displacement (d) was 0.25 mm and it was produced and measured by a micrometer (460A, Newport, Irvine, CA) fixed with the digital force gauge. The maximum displacement was kept to 1.25 mm to ensure small deformation; which is smaller than the cylindrical indenter radius (5.5 mm) and so the strains at the indentation area were small such that an approximation of linearity was considered reasonable. The indentation force F was measured by a digital force gauge (DS2-1, Imada, Northbrook, IL). The experimental setup of the indentation test is shown in Fig. 7. The duration of the indentation test for each lung was about 20 minutes. As the lung surface dimension is much larger than the indenter radius, the indentation can be approximated as a cylindrical indenter acting on a viscoelastic half-space. The applied force F is related to the displacement by [26]
| (12) |
where
| (13) |
Fig. 7.
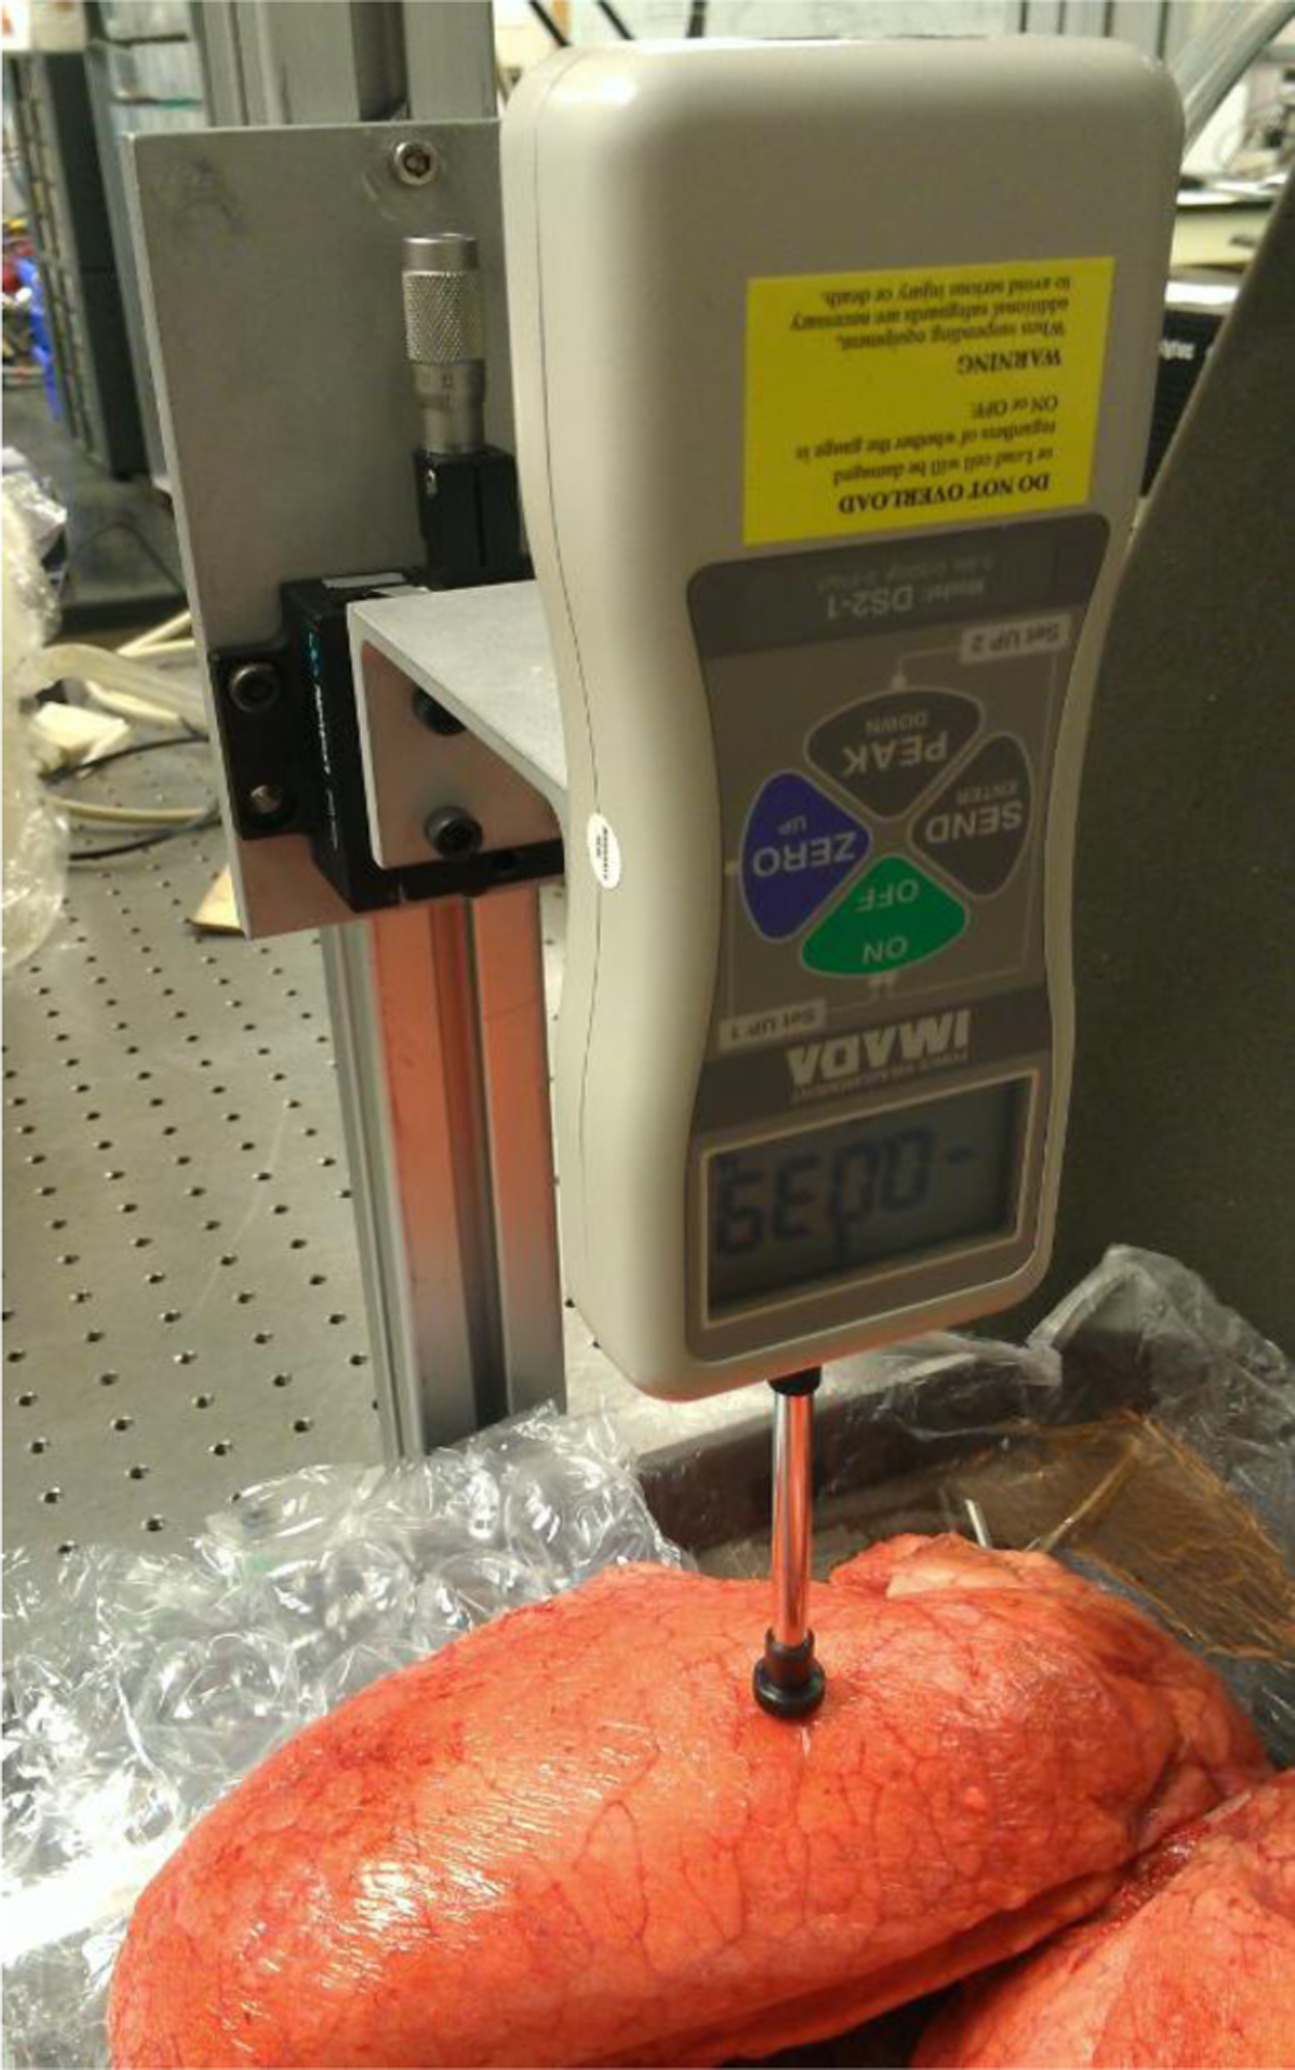
Mechanical indentation test setup.
Here, E0, E2 are the Young’s modulus and v1, v2 are Poisson ratio associated with the lung and the steel indenter, respectively. The force initially decays with time when the lung is indented; so, it was recorded when it reached an asymptotic value and the relaxed Young’s modulus of the lung E0 is used in Eq. (13). In Eq. (12), R is the radius of the cylindrical indenter. The steel indenter is much stiffer than the lung tissue; so E2 ≫ E0. Thus, the applied force and displacement relation can be expressed as
| (14) |
Thus, with Eq. (14) the lung relaxed Young modulus E0 can be estimated by least square fitting the measured force-displacement points.
4. Results
The force and indentation depth of point 1, pigs 1 and 2 of the indentation test are plotted in Fig. 8. The relaxed Young’s modulus of each point was estimated by least square fitting of the measurement data and it is 2.55 kPa and 3.02 kPa respectively. Comparing the average from six points of each pig lung, the second pig lung was stiffer than the first one by 17%.
Fig. 8.
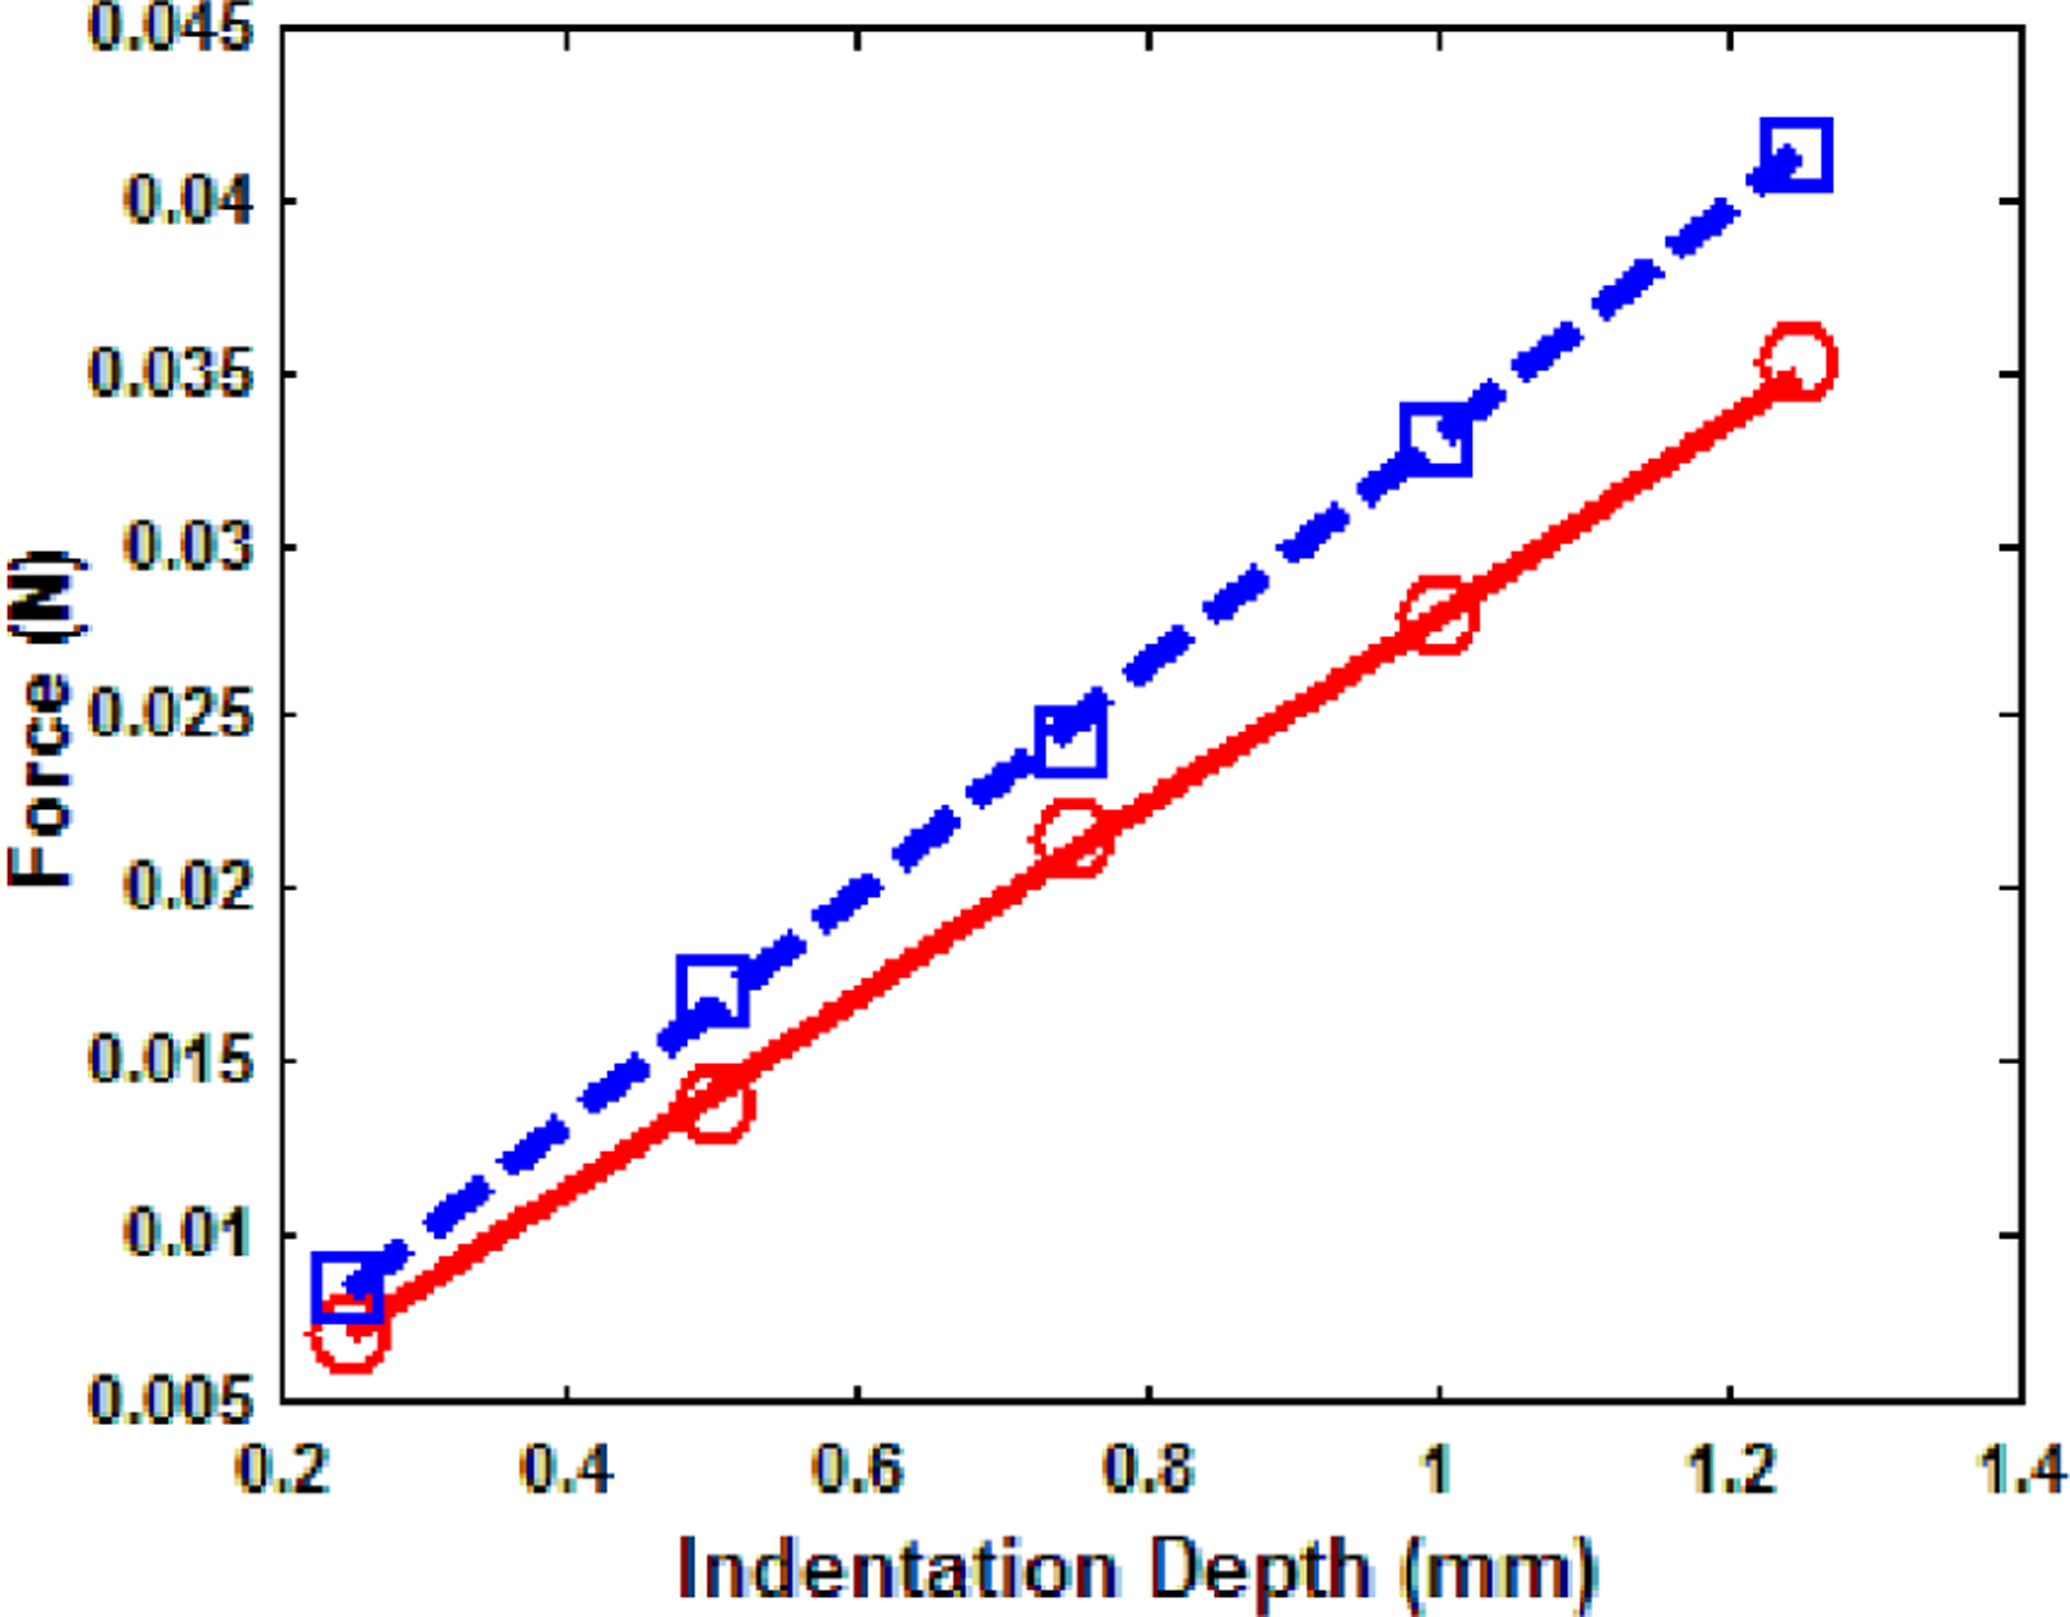
Force and indentation depth plot of the indentation test, ○ ○ ○ pig 1 measurement, ── pig 1 fitting, □ □ □ pig 2 measurement, ─ ─ pig 2 fitting.
The force-time data of point 1, pig 1 is plotted in Fig. 9 together with a FSLS model fitting curve. Detailed comparisons of fitting by different models will be shown later. As the stress relaxation response is approximated by the response of a step function, the time instant when the relaxation force reaches maximum is denoted as t=0 and the force-time data between t=0 and 120s was used for least square curve fitting. At these six points where the stress relaxation test was carried out, the average lung thickness is 86.7 mm for pig 1 and 88.2 mm for pig 2. The force-displacement curve still forms a good linear relationship during the indentation test when the displacement incrementally increased up to 3.5 mm. This suggests that the linearity assumption is valid in the current study.
Fig. 9.
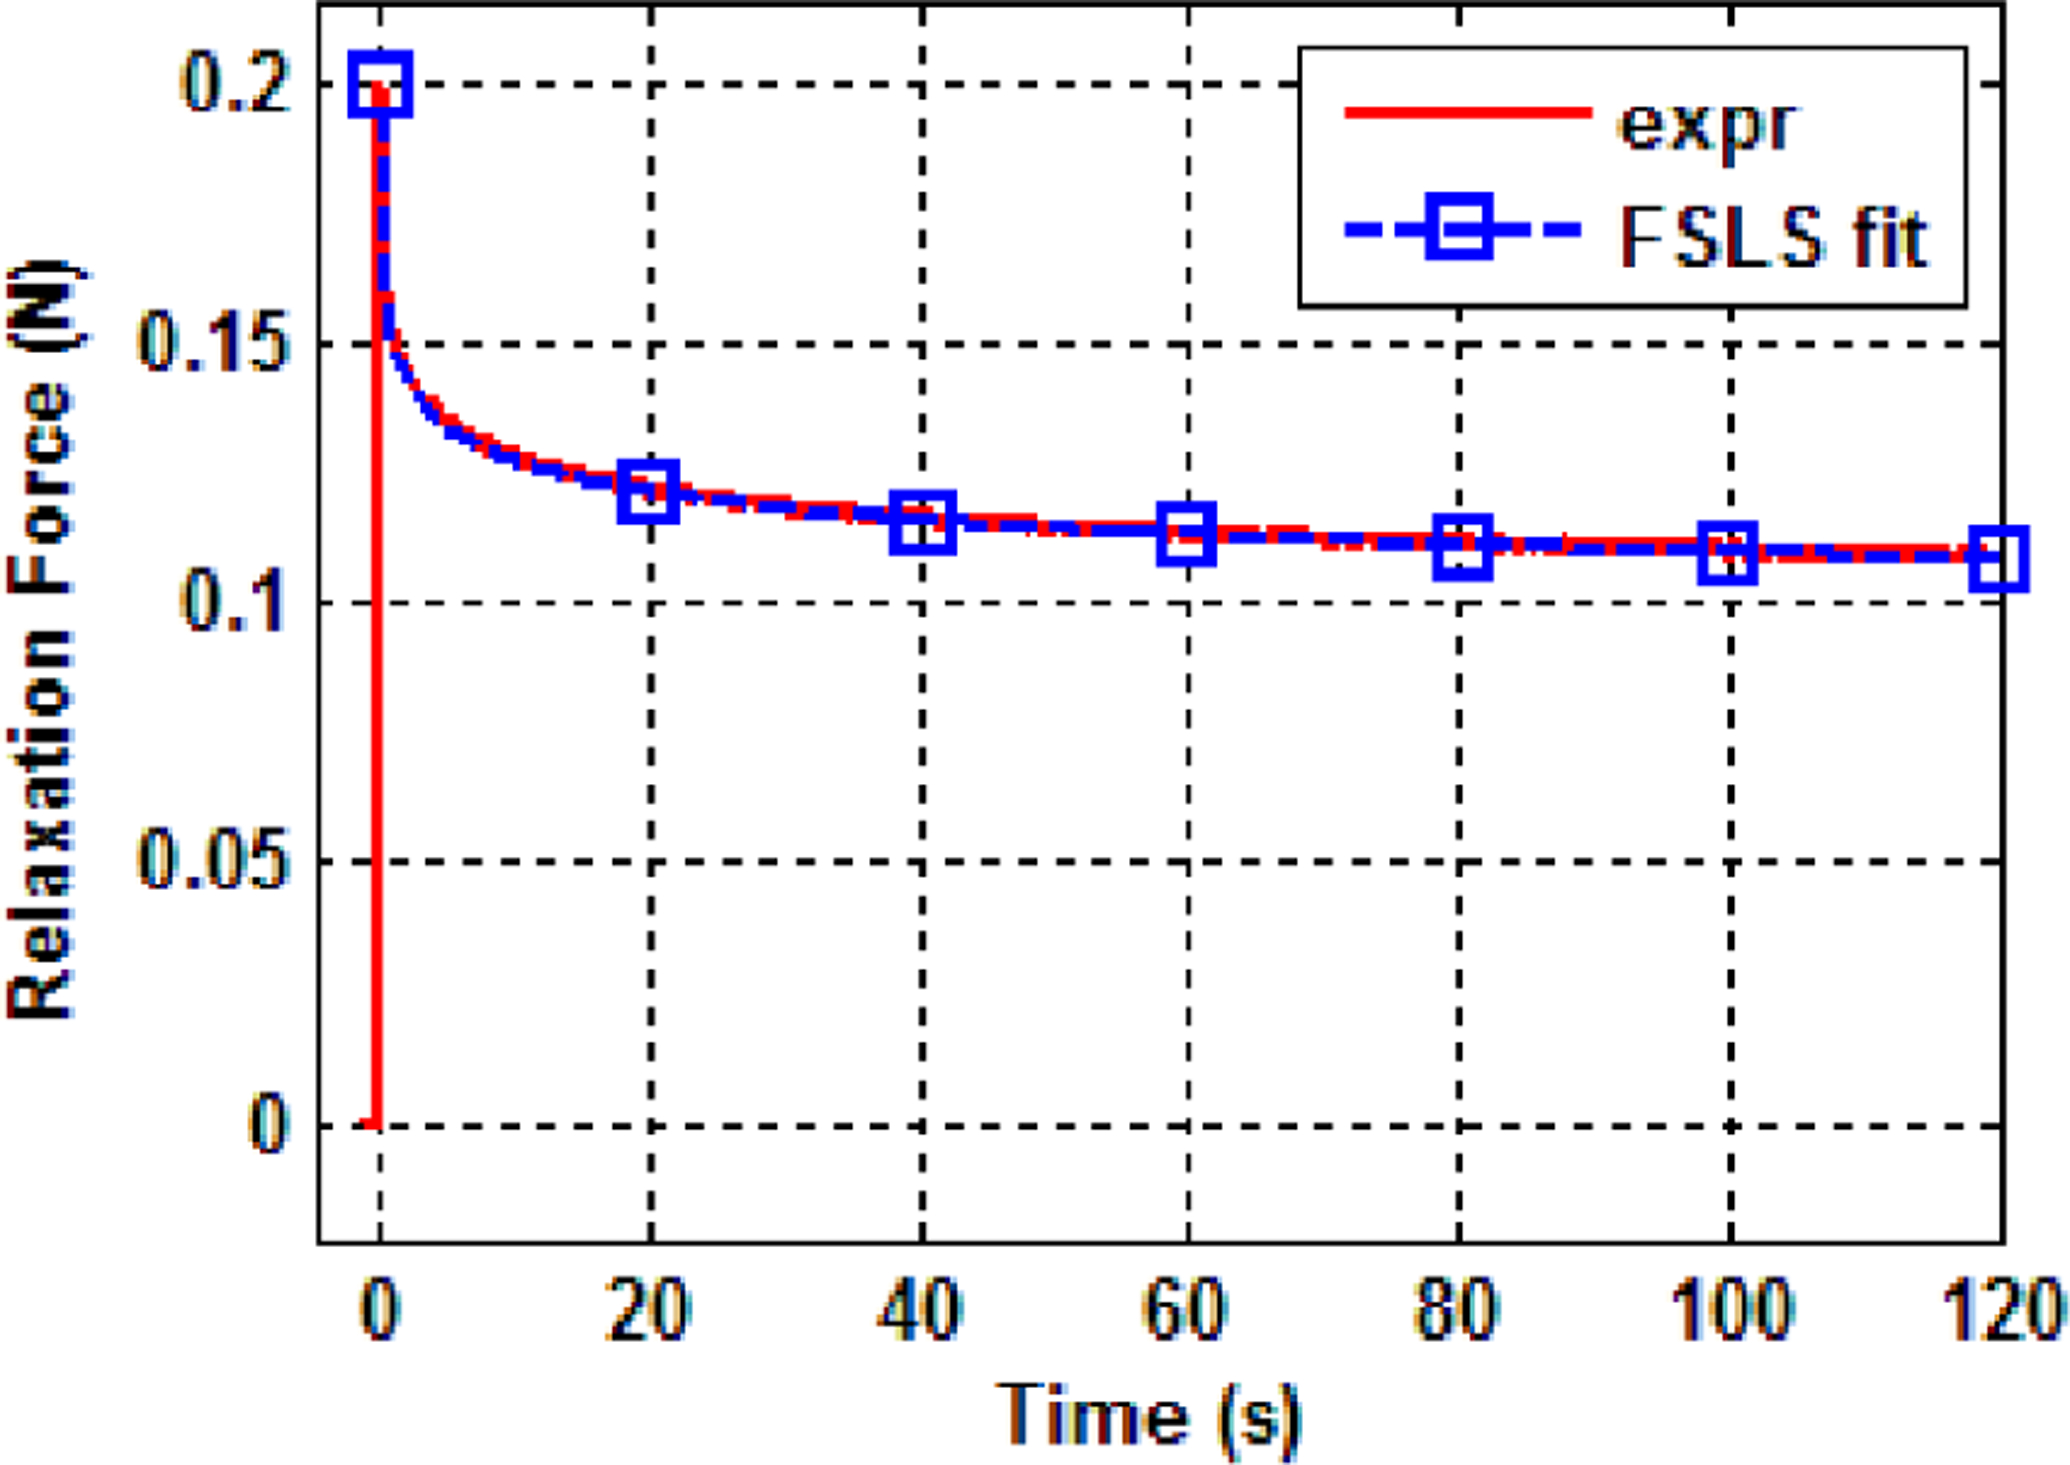
Force-time data of point 1, pig 1 in the stress relaxation test.
The estimated viscoelastic parameters for each point are listed in Table 1. The relaxed Young’s modulus E0 was estimated from the mechanical indentation test and the other viscoelastic parameters were estimated from curve fitting the stress relaxation data. It is seen that for all the test points, the FSLS model yields the smallest RMSE among the three models. Visual comparison of fitting by the three models of point 1, pig 1 is shown in Fig. 10. Here G(t)/E0, the instantaneous Young’s modulus normalized to the relaxed modulus, is plotted. We call this quantity Young’s modulus ratio and it clearly shows the rate at which the dynamic Young’s modulus decays with respect to time. After 120 s from the peak stress, the stress in the lung parenchyma is still 1.2 times the relaxed stress. The SLS model is inferior to the FSLS and GM model while the FSLS model fits better than the GM model even though it has one less fitting parameter. In particular, the FSLS model captures the initial stress relaxation process better than the GM model with a predicted peak Young’s modulus ratio of 2.175 compared to the measured value of 2.154 while the GM model predicts a Young’s modulus ratio of 1.778. This superior fitting capability of the FSLS model was consistent for all the other eleven test points.
Table 1.
Estimated Parameters of Each Viscoelastic Model
| SLS | FSLS | GM | ||||||||||||
|---|---|---|---|---|---|---|---|---|---|---|---|---|---|---|
| Pig # | Data # | E 0 | E 1 | η | RMSE | α | E 1 | E α | RMSE | E 1 | η 1 | E 2 | η 2 | RMSE |
| (kPa) | (kPa) | (kPa·s) | (×10−2) | (kPa) | (kPa·sα) | (×10−2) | (kPa) | (kPa·s) | (kPa) | (kPa·s) | (×10−2) | |||
| 1 | 1 | 2.55 | 1.16 | 135.64 | 4.88 | 0.36 | 3.00 | 4.67 | 0.64 | 1.06 | 4.96 | 0.93 | 174.38 | 0.97 |
| 2 | 2.57 | 0.90 | 98.35 | 4.11 | 0.36 | 2.55 | 3.44 | 0.55 | 0.92 | 3.90 | 0.71 | 125.44 | 0.95 | |
| 3 | 2.54 | 1.13 | 122.61 | 5.06 | 0.37 | 3.03 | 4.58 | 0.60 | 1.10 | 5.12 | 0.89 | 157.28 | 1.12 | |
| 4 | 2.61 | 1.15 | 126.94 | 4.98 | 0.37 | 3.10 | 4.61 | 0.62 | 1.13 | 4.96 | 0.92 | 161.12 | 0.93 | |
| 5 | 2.58 | 1.02 | 108.24 | 4.56 | 0.37 | 2.77 | 4.06 | 0.66 | 1.02 | 4.56 | 0.80 | 138.22 | 1.02 | |
| 6 | 2.6 | 1.07 | 109.14 | 4.85 | 0.38 | 2.95 | 4.36 | 0.63 | 1.11 | 4.87 | 0.83 | 138.05 | 1.07 | |
| Mean | 2.58 | 1.07 | 116.82 | 0.37 | 2.90 | 4.29 | 1.06 | 4.73 | 0.85 | 149.08 | ||||
| SD | 0.03 | 0.09 | 12.67 | 0.01 | 0.19 | 0.43 | 0.07 | 0.41 | 0.08 | 16.59 | ||||
| 2 | 1 | 3.02 | 0.93 | 97.31 | 3.63 | 0.37 | 2.59 | 3.66 | 0.57 | 0.96 | 4.11 | 0.73 | 123.41 | 0.83 |
| 2 | 2.97 | 1.00 | 108.98 | 3.81 | 0.37 | 2.69 | 3.97 | 0.53 | 0.97 | 4.39 | 0.79 | 139.18 | 0.87 | |
| 3 | 3.07 | 1.22 | 143.21 | 4.36 | 0.36 | 3.22 | 4.86 | 0.63 | 1.14 | 5.29 | 0.98 | 185.03 | 0.96 | |
| 4 | 3.04 | 1.22 | 150.75 | 4.10 | 0.35 | 3.03 | 4.96 | 0.66 | 1.04 | 5.14 | 0.98 | 195.62 | 1.02 | |
| 5 | 2.99 | 1.14 | 134.10 | 4.03 | 0.36 | 2.87 | 4.74 | 0.57 | 1.02 | 4.89 | 0.92 | 172.30 | 0.85 | |
| 6 | 3.00 | 1.18 | 148.17 | 4.34 | 0.33 | 3.22 | 4.39 | 0.63 | 1.08 | 4.77 | 0.96 | 191.48 | 1.07 | |
| Mean | 3.02 | 1.11 | 130.42 | 0.36 | 2.94 | 4.43 | 1.04 | 4.77 | 0.89 | 167.84 | ||||
| SD | 0.03 | 0.11 | 20.26 | 0.01 | 0.24 | 0.48 | 0.06 | 0.41 | 0.10 | 27.21 |
Fig. 10.
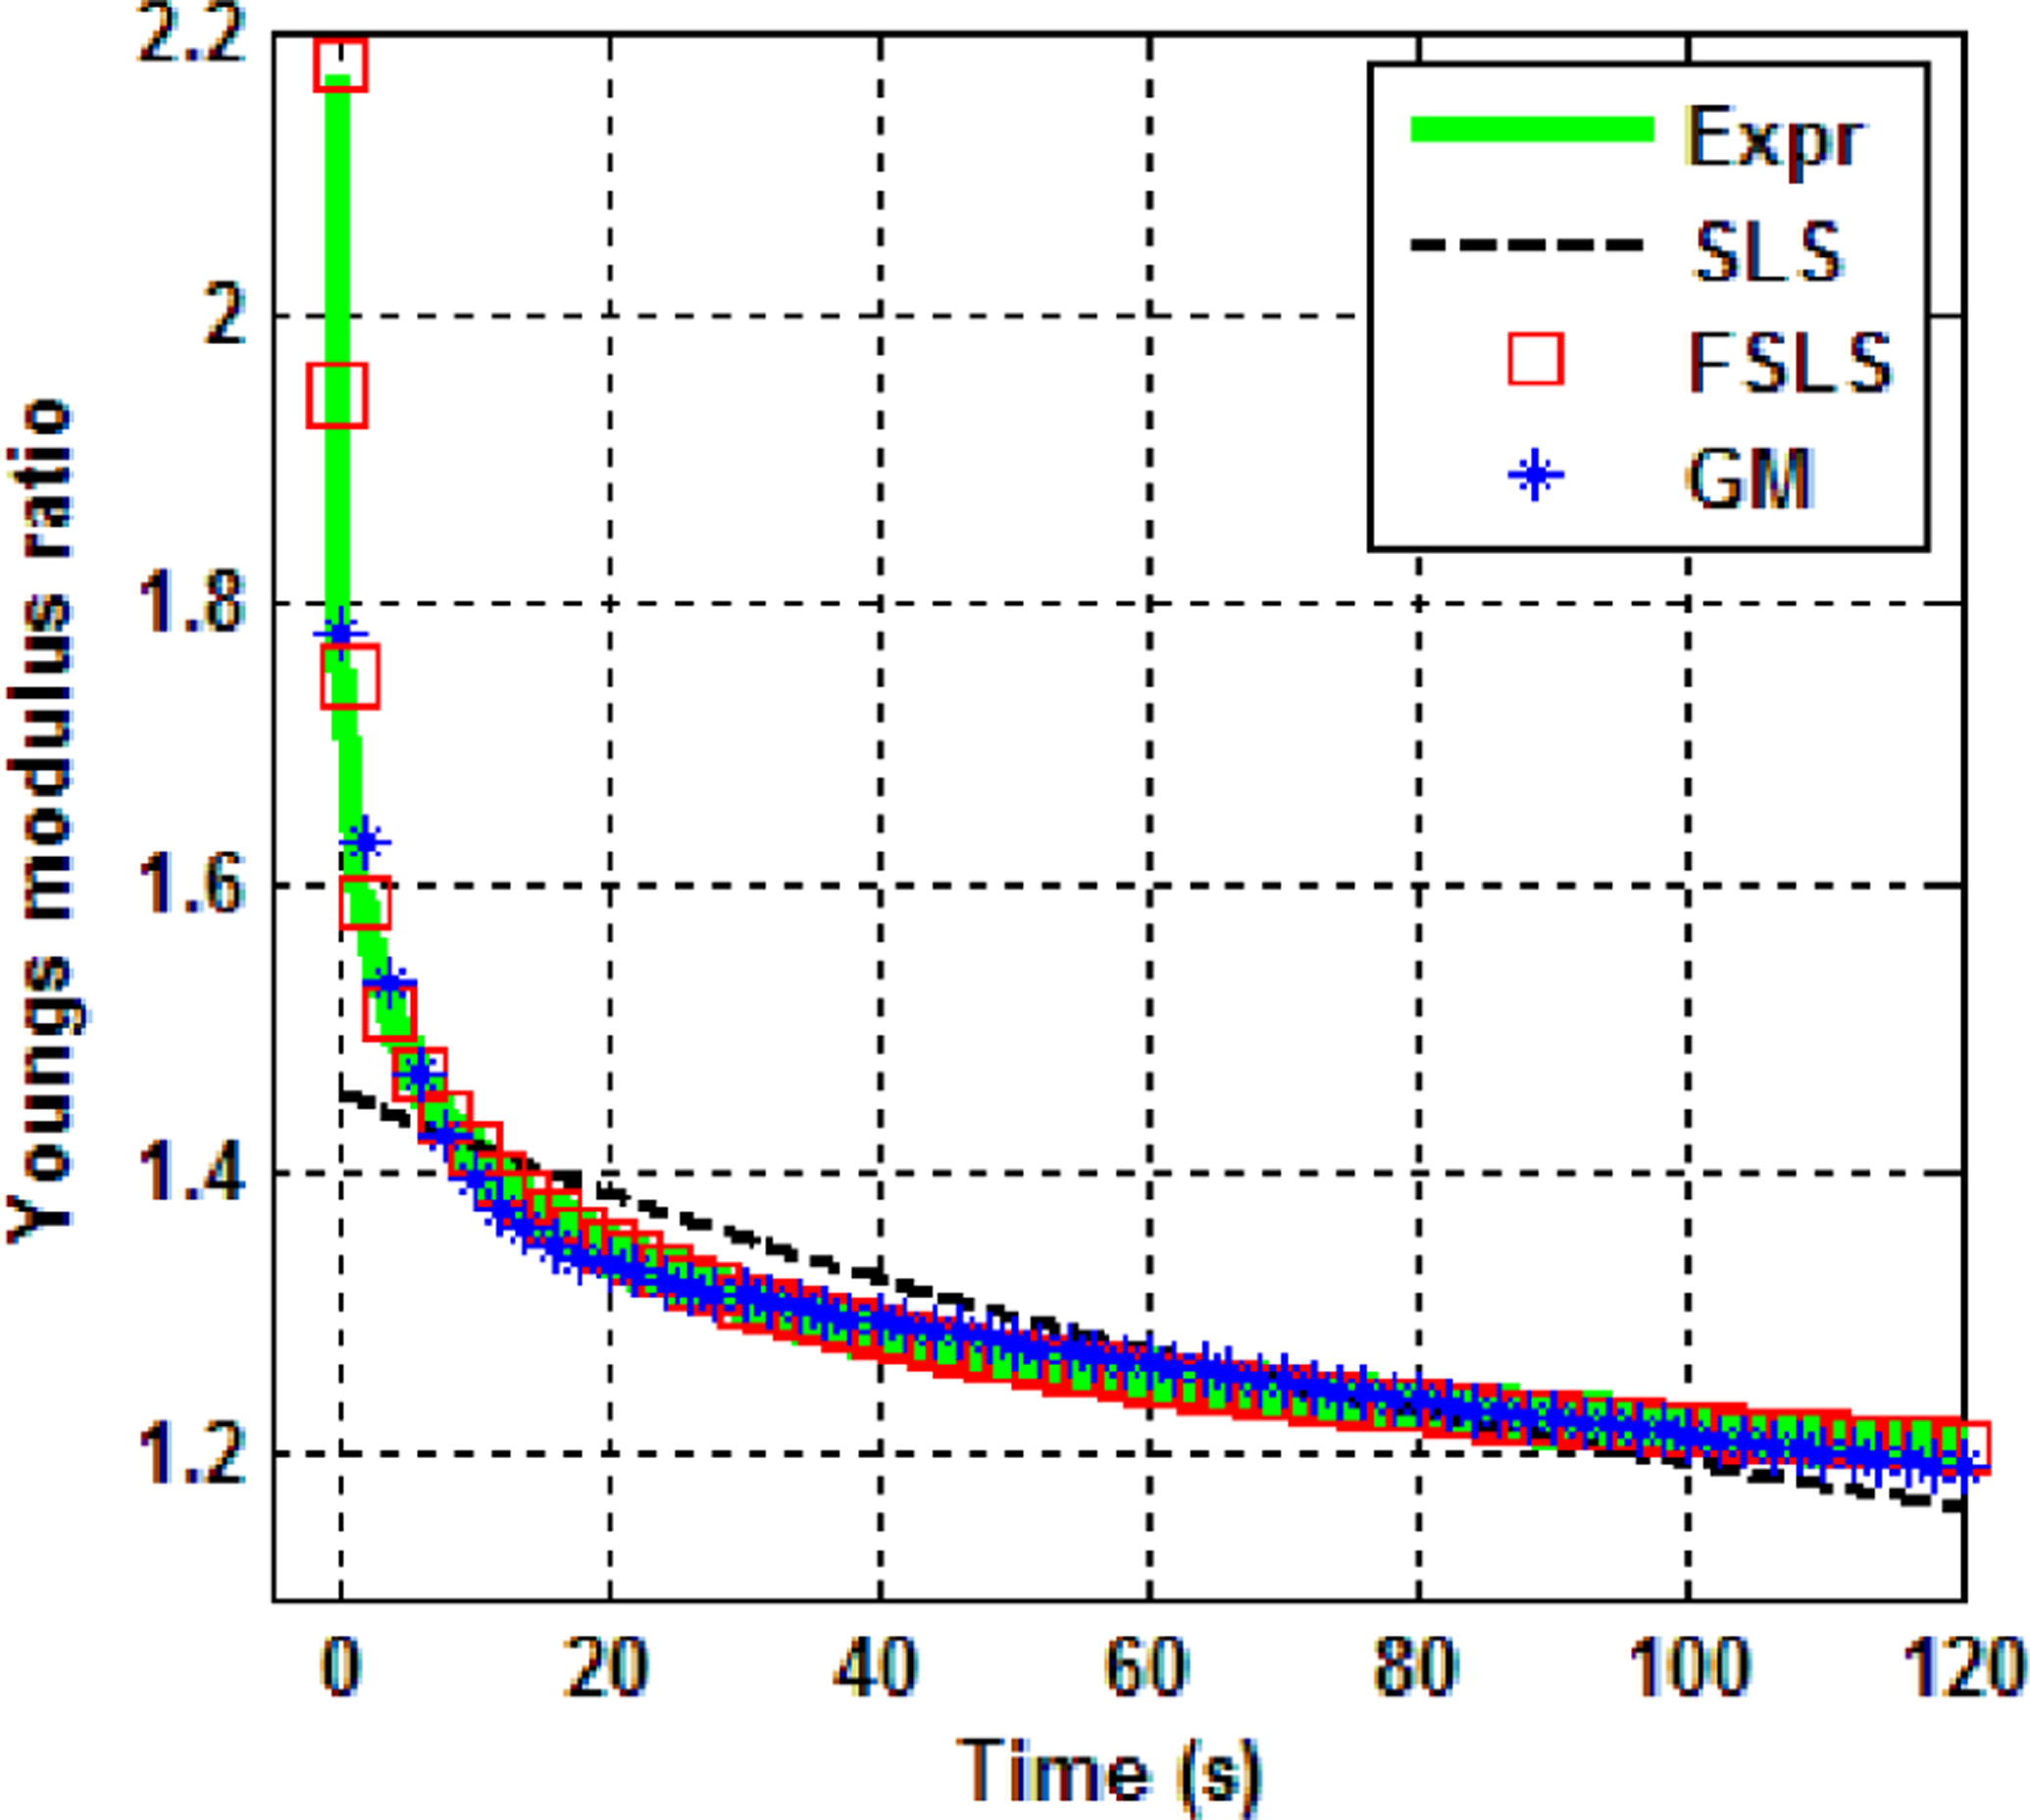
Comparison of model fitting of point 1, pig 1.
From Table 1, it is seen that the variation among the six test points on a pig lung is about 10% of the corresponding mean value. The estimated Young’s modulus ratio with respect to time for each pig lung is plotted in Fig. 11. The average Young’s modulus ratio of pig 1 and 2 are 1.18 and 1.17, respectively; this difference is much smaller than the difference in relaxed Young’s modulus between the pig lungs. As seen from Fig. 11, no significant difference of stress relaxation rate was found between the two lungs. For the FSLS model, the estimated fractional order value α is robust with a standard deviation of 0.01. Test points on pig 2 are found to have a larger relaxed Young’s modulus than points on pig 1 from the indentation test, thus leading to larger estimated viscoelastic parameters except for α in the FSLS model and E1 in GM model. Note that α represents the intrinsic power law decay rate of the stress relaxation process. Results suggest that for a certain type of biological tissue, the stress relaxation rate at the macroscopic scale may not depend on the relaxed Young’s modulus of the tissue.
Fig. 11.
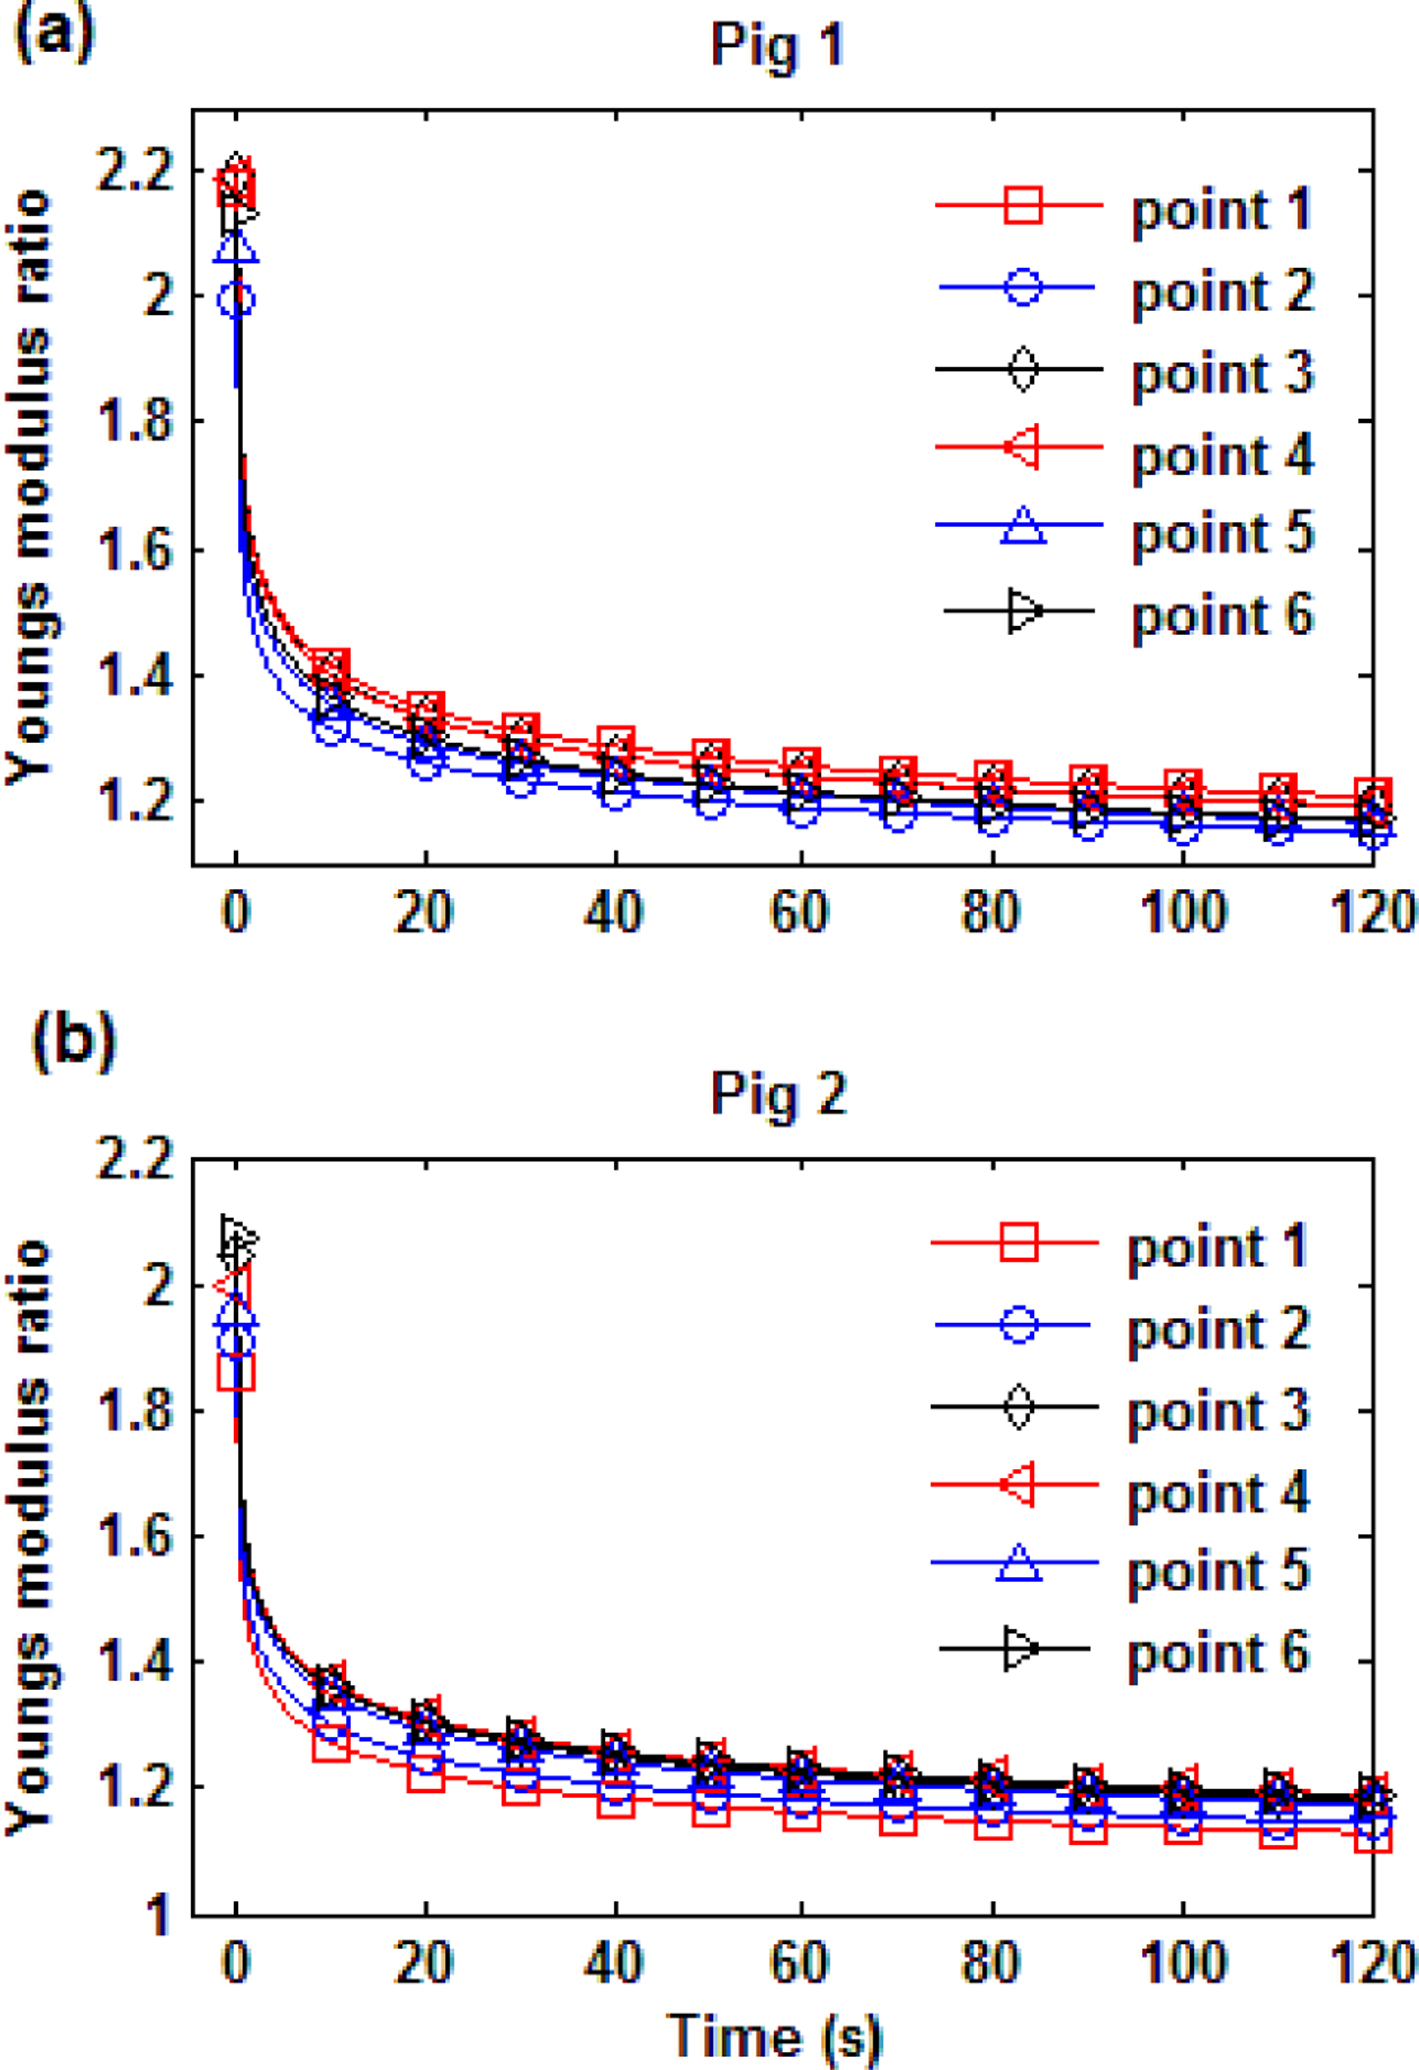
Young’s modulus ratio (a) pig 1 (b) pig 2.
5. Discussion
In the current study the stress relaxation of two pig lungs was measured and fit by the standard linear solid (SLS) model, generalized Maxwell (GM) model and the fractional standard linear solid (FSLS) model. Among the 3 models, the FSLS model best captures the stress relaxation features including: the initial steep decay and slow asymptotic decay to stability as seen in Fig. 10. This suggests that the sress relaxtion follows a power law decay more so than an exponential decay [15]. The estimated α value of 0.37 reveals a more pronounced elastic than viscous behavior of the pig lung tissue. Similar fractional order values in lung tissue was reported [13]. In the current study the stress relaxation function followed a power law given by G(t) = at−β+b with an approximate β value of 0.07 based on experimental measurements. It was reported in Bates [27] that degassed strips of dog lung parenchyma were subject to 10% step changes of resting length from three different initial resting lengths and an approximate β value of 0.045 was obtained. Inflated lung parenchyma was tested here; but, the β value still has the same order of magnitude as that in Bates et al. The FSLS model includes a combination of power law functions represented by the Mittag-Leffler summation of Eq. (7).
In the current stress relaxation test, the force-time data included a loading ramp and a 120 second relaxation stage. Only relaxation stages were used to fit viscoelastic parameters; the time duration of the loading ramp was about 0.5 second; so, it was negligible compared to the 120 seconds relaxation time. In fact, biological tissues proved to be relatively insensitive to strain rates [28], which supports our assumptions. As the relaxation process continues beyond 120 seconds, the Young’s modulus ratio will continue to drop and ultimately reaches the steady state with a value of one. In future studies, stress relaxation with much longer time history could be recorded and whether a single fractional order model could capture relaxation over multiple time scales could be studied.
The lung parenchyma is very different from most other soft tissues in the human body. The relaxed Young’s modulus changes significantly at different transpulmonary pressures. Also, the lung parenchyma undergoes large deformation during the breathing cycle. These two characteristics add complexity to documenting the lung viscoelasticity. In the current study, measurements were conducted only at one transpulmonary pressure due to time constraints and the number of points tested. Future studies conducted at different airway pressures could reveal the pressure influence on stress relaxation behavior. During the breathing cycle lung volume changes significantly as well as the transpulmonary pressure (the difference between the alveolar and intraplural pressure). For example, the average total lung capacity (the volume in the lungs at maximal inflation) of an adult human male is about 6 liters while the average tidal volume (the normal volume of air displaced between normal inhalation and exhalation) is about 0.5 liters. This dynamic process is associated with changes in transpulmonary pressure and lung parenchyma large deformation. The lung inflation pressure used in the current study (20 cm of water) was chosen to be comparable to normal values under spontaneous breathing [29]. Under these conditions, no lung collapse or over inflation was noticed, while some lung collapse was seen at pressures below 25%−50% of the pressure used in this study. To the best knowledge of the authors, indentation and stress relaxation tests have been only conducted under a static transpulmonary pressure and small lung parenchyma deformation. Studies of lung dynamic viscoelasticity during the breathing cycle will provide a more comprehensive understanding of breathing mechanics and ultimately may help in understanding lung pathology and its diagnosis.
Conclusion
In the current study, lung viscoelasticity was characterized by measuring lung stress relaxation behavior. The fractional standard linear solid (FSLS) and two integer order models – the standard linear solid (SLS) and generalized Maxwell (GM) models – were used to fit the stress relaxation curves. The relaxed Young’s modulus of the pig lung was independently measured by an indentation test. It was found that the FSLS model was the best fit among three models although it has one less fitting parameter than the GM model. The superiority of the fractional order viscoelastic model is likely due to its ability to predict a power law stress decay seen in the experiments.
Highlights.
Lung parenchyma viscoelasticity was studied via stress relaxation.
Stress relaxation studies were conducted on freshly exercised inflated pig lungs.
Fractional order and integer order viscoelastic models were compared.
Fractional standard linear solid was the best among four-parameter models.
Financial Acknowledgement
Financial supported by NIH Grant # EB012142 is acknowledged.
Footnotes
Publisher's Disclaimer: This is a PDF file of an unedited manuscript that has been accepted for publication. As a service to our customers we are providing this early version of the manuscript. The manuscript will undergo copyediting, typesetting, and review of the resulting proof before it is published in its final citable form. Please note that during the production process errors may be discovered which could affect the content, and all legal disclaimers that apply to the journal pertain.
Conflict of Interest Statement
No conflicts of interest to declare.
Ethical Approval
Not required for this study.
References
- [1].Ebihara T, Venkatesan N, Tanaka R, Ludwig MS. Changes in extracellular matrix and tissue viscoelasticity in bleomycin-induced lung fibrosis. Temporal aspects. Am J Respir Crit Care Med 2000;162:1569–76. doi: 10.1164/ajrccm.162.4.9912011. [DOI] [PubMed] [Google Scholar]
- [2].Ito S, Ingenito EP, Brewer KK, Black LD, Parameswaran H, Lutchen KR, Suki B. Mechanics, nonlinearity, and failure strength of lung tissue in a mouse model of emphysema: possible role of collagen remodeling. J Appl Physiol 2005;98:503–11. doi: 10.1152/japplphysiol.00590.2004. [DOI] [PubMed] [Google Scholar]
- [3].Faffe DS, Zin WA. Lung parenchymal mechanics in health and disease. Physiol Rev 2009;89:759–75. doi: 10.1152/physrev.00019.2007. [DOI] [PMC free article] [PubMed] [Google Scholar]
- [4].Salerno FG, Ludwig MS. Elastic moduli of excised constricted rat lungs. J Appl Physiol 1999;86:66–70. [DOI] [PubMed] [Google Scholar]
- [5].Kononov S, Brewer K, Sakai H, Cavalcante FS, Sabayanagam CR, Ingenito EP, Suki B. Roles of mechanical forces and collagen failure in the development of elastase-induced emphysema. Am J Respir Crit Care Med 2001;164:1920–6. doi: 10.1164/ajrccm.164.10.2101083. [DOI] [PubMed] [Google Scholar]
- [6].Bayliss LE, Robertson GW. The visco-elastic properties of the lungs. Q J Exp Physiol Cogn Med Sci 1939;29:27–47. [Google Scholar]
- [7].Mount L The ventilation flow-resistance and compliance of rat lungs. J Physiol 1955; 127:157–67. [DOI] [PMC free article] [PubMed] [Google Scholar]
- [8].MARSHALL R, WIDDICOMBE JG. Stress relaxation of the human lung. Clin Sci 1961;20:19–31. [PubMed] [Google Scholar]
- [9].Hildebrandt J Dynamic properties of air-filled excised cat lung determined by liquid plethysmograph. J Appl Physiol 1969;27:246–50. [DOI] [PubMed] [Google Scholar]
- [10].Hildebrandt J Pressure-volume data of cat lung interpreted by a plastoelastic, linear viscoelastic model. J Appl Physiol 1970;28:365–72. [DOI] [PubMed] [Google Scholar]
- [11].Bachofen H Lung tissue resistance and pulmonary hysteresis. J Appl Physiol 1968;24:296–301. [DOI] [PubMed] [Google Scholar]
- [12].Hildebrandt J Comparison of mathematical models for cat lung and viscoelastic balloon derived by laplace transform methods from pressurevolume data. Bull Math Biophys 1969;31:651–67. doi: 10.1007/BF02477779. [DOI] [PubMed] [Google Scholar]
- [13].Suki B, Barabasi AL, Lutchen KR. Lung tissue viscoelasticity: a mathematical framework and its molecular basis. J Appl Physiol 1994;76:2749–59. [DOI] [PubMed] [Google Scholar]
- [14].Magin RL. Fractional Calculus in Bioengineering, Begell House, Connecticut, (2006), 154 – 75. [Google Scholar]
- [15].Fung YC. Biomechanics: Mechanical Properties of Living Tissues, 2nd ed.Springer-Verlag, New York: (1993), 336–43. [Google Scholar]
- [16].Doehring TC. Fractional Order Viscoelasticity of the Aortic Valve Cusp: An Alternative to Quasilinear Viscoelasticity. J Biomech Eng 2005;127(4):700–08. doi: 10.1115/1.1933900. [DOI] [PubMed] [Google Scholar]
- [17].Craiem D, Armentano R. A fractional derivative model to describe arterial viscoelasticity. Biorheology 2007; 44:251–63. [PubMed] [Google Scholar]
- [18].Kiss MZ, Varghese T, Hall TJ. Viscoelastic characterization of in vitro canine tissue. Phys Med Biol 2004;49:4207–18. doi: 10.1088/0031-9155/49/18/002. [DOI] [PMC free article] [PubMed] [Google Scholar]
- [19].Kohandel M, Sivaloganathan S, Tenti G, Darvish K. Frequency dependence of complex moduli of brain tissue using a fractional Zener model. Phys Med Biol 2005;50:2799–805. doi: 10.1088/0031-9155/50/12/005. [DOI] [PubMed] [Google Scholar]
- [20].Zhang M, Castaneda B, Wu Z, Nigwekar P, Joseph JV, Rubens DJ, Parker KJ. Congruence of imaging estimators and mechanical measurements of viscoelastic properties of soft tissues. Ultrasound Med Biol 2007;33:1617–31. doi: 10.1016/j.ultrasmedbio.2007.04.012. [DOI] [PMC free article] [PubMed] [Google Scholar]
- [21].Sinkus R, Siegmann K, Xydeas T, Tanter M, Claussen C, Fink M, MR elastography of breast lesions: understanding the solid/liquid duality can improve the specificity of contrast-enhanced MR mammography. Mag Reson Med 2007; 58: 1135–1144. [DOI] [PubMed] [Google Scholar]
- [22].Craiem D, Rojo Pérez FJ, Atienza Riera JM, Guinea Tortuero GV., Armentano RL. Fractional calculus applied to model arterial viscoelasticity. Lat Am Appl Res 2008; 38:141–45. [Google Scholar]
- [23].Purslow PP, Wess TJ, Hukins DW. Collagen orientation and molecular spacing during creep and stress-relaxation in soft connective tissues. J Exp Biol 1998; 201:135–42. [DOI] [PubMed] [Google Scholar]
- [24].Duenwald S, Vanderby R, Lakes R. Stress relaxation and recovery in tendon and ligament: experiment and modeling. Biorheology 2010; 47: 1–14. [DOI] [PubMed] [Google Scholar]
- [25].Mainardi F, Spada G. Creep, relaxation and viscosity properties for basic fractional models in rheology. Eur Phys Journal-Special Top 2011; 193: 133–60. [Google Scholar]
- [26].Timoshenko S, Goodier J. Theory of Elasticity, 3rd ed., McGraw-Hill, New York: (1970), 409–412. [Google Scholar]
- [27].Bates JHT. A recruitment model of quasi-linear power-law stress adaptation in lung tissue. Ann Biomed Eng 2007; 35:1165–1174. [DOI] [PubMed] [Google Scholar]
- [28].Doehring TC, Carew EO, Vesely I. The effect of strain rate on the viscoelastic response of aortic valve tissue: a direct-fit approach. Ann Biomed Eng 2004;32:223–32. doi: 10.1023/B:ABME.0000012742.01261.b0. [DOI] [PubMed] [Google Scholar]
- [29].Briel M, Meade M, Mercat A, Brower RG, Talmor D, Walter SD, et al. Higher vs lower positive end-expiratory pressure in patients with acute lung injury and acute respiratory distress syndrome: systematic review and meta-analysis. JAMA 2010;303:865–73. doi: 10.1001/jama.2010.218. [DOI] [PubMed] [Google Scholar]


