Abstract
Background: This article describes the effects of nanosecond pulsed electric fields (nsPEFs) on the structure and enzyme activity of three types of proteins.
Materials and Methods: Intense (up to 300 kV/cm) 5-ns-long electrical pulses were applied for 500 times at 3 Hz to solutions of lysozyme, albumin, and urease. We analyzed covalent bonds (peptide bonds and disulfide bonds) of lysozyme and albumin, and also the tertiary and quaternary structures of urease as well as urease activity.
Results: The results indicated deformation of both the quaternary and tertiary structures of urease upon exposure to an electric field with an amplitude of 250 kV/cm or higher, whereas no structural changes were observed in lysozyme or albumin, even at 300 kV/cm. The enzyme activity of urease also decreased at field strengths of 250 kV/cm or higher.
Conclusion: Our experiments demonstrated that intense nsPEFs physically affected the conformation and function of some types of proteins. Such intense electric fields often occur in cell membranes when exposed to a moderate pulsed electric field.
Keywords: nanosecond pulsed electric field (nsPEF), protein, slight thermal effect, intracellular condition
Introduction
Electroporation (or electropermeabilization) has been widely observed, and several attempts to investigate this phenomenon using lipid vesicles have suggested that electric pulses can damage plasma membranes.1 Numerous studies have started with this behavior. Electrochemotherapy, calcium electroporation, and tumor ablations for medical applications; nonthermal pasteurization; and electroextraction for food-processing applications based on nanosecond pulsed electric fields (nsPEFs) are attractive techniques, and many attempts have been reported for their application.2,3
Numerous reports have indicated that nsPEFs lead to several biological responses, whose kinetics have been substantial, such as cell morphology transformations, stress responses, signal transductions relevant to cell death, and calcium-ion reactions.4,5 Most of these responses have been attributed to an abrupt increase in the concentration of calcium ions, which act as messengers to signal diverse biological reactions, triggered by permeabilization of the plasma membrane or the surface of the endoplasmic reticulum, promoting transmembrane calcium mobilization into the cytoplasm.6,7
Other cell components such as proteins, which are electrical-charged dielectric compounds, exhibit stress caused by electric fields. In particular, membrane proteins are exposed to extremely high electric fields, on the order of MV/cm, because the electric field is enhanced at the membrane, which is a sub-10-nm-thick dielectric film, due to polarization and charge accumulation under an external field. Several numerical calculations have predicted that proteins will respond to electricity. Microtubules can transmit electrical pulses along their structures and have a dipole moment, which generates a surrounding electric field.8–11
However, few reports have described experimentally proven effects of electric fields on proteins. Amino acid residues of a crystallized protein were found to change their direction when exposed to a 1 MV/cm electric field,12 but because a protein crystal was used instead of a solution, the conditions were not physiological. Therefore, it is important to evaluate the effects of nsPEFs on proteins under physiological conditions to understand their physical impact and resultant biological reactions.
In addition, membrane proteins are subjected to substantial electric fields, on the order of 100 kV/cm, because of the residual membrane potential of ∼70 mV. It may be necessary to consider electrical perspectives to completely understand biology. Several articles have suggested that electric fields affect cell activity, and most of the proposed mechanisms are supported by numerical calculations.9,11,13–17
There are several applications for proteins exposed to high electric fields; for example, controlling intracellular electric fields may enable the manipulation of cell activities such as cell division, which may suppress tumor growth.15,18 A previous study reported that a bacterial spore wall composed of peptidoglycan was damaged by intense pulsed electric fields with an intensity of 7.5 kV/cm.19 Thus, it is critical to examine the electrical impact on proteins from the viewpoints of bioelectrics, basic biology, and applications.
In this study, we focused on proteins in a liquid to simulate intracellular conditions and analyzed irreversible responses. Because proteins have four hierarchical structure levels, ranging from primary to quaternary, we studied the destructive effect of intense electric fields on the different structure levels, molecular size, and chemical binding. This study investigates the deformations of the primary, tertiary, and quaternary structures using several proteins with different structural features.
Materials and Methods
Samples
We purchased three proteins with various structures and molar weights (all from Fujifilm), namely lysozyme from egg whites (14 kDa, monomer), albumin from bovine serum (67 kDa, monomer), and urease from jack beans (480 kDa, hexamer). Each protein was dissolved in Dulbecco's phosphate-buffered saline (KCl 0.02 w/v%, KH2PO4 0.02 w/v%, NaCl 0.8 w/v%, Na2HPO4 0.115 w/v%) (conductivity: 1.64 S/m) to obtain 1 mg/mL protein solutions.
Nanosecond pulsed electric field
We have developed a 5-ns-duration high-voltage pulse generator to apply intense electric fields to protein solutions in a 1-mm-gap electroporation cuvette whose electrode was made of aluminum (Molecular BioProducts). A 10 Ω Blumlein line generator was energized by a pulse charging circuit and triggered by a nitrogen-filled pressurized spark gap switch.20 The voltage deviation was ∼8%. The cuvette was cut and shortened to be the resistance of 10 Ω, whereas the capacitance was calculated to be 20 pF, which does not significantly deform the pulse shape. The protein solution of 120 μL was poured into the cut cuvette and covered the electrode to prevent corona discharges. We applied 500 shots of nsPEFs at a repetition frequency of 3 Hz. The solution temperature, which was measured using the fiber optic thermometer (FL-2000; Anritsu Meter), did not exceed 3 K during the treatment. Here, we prepared sham samples, which underwent the same procedure as PEF-exposed samples without delivering pulses and were described as 0 kV/cm exposure. Furthermore, negative controls described as NC were that normal urease was dissolved in 300 kV/cm-nsPEF-treated phosphate-buffered saline (PBS). Based on the previous experiments (data not shown), 500 shots of 300 kV/cm at 3 Hz showed the most obvious results. Since, this time, we focused on impacts of electric fields, and we analyzed protein structures with different electric fields less than 300 kV/cm.
Sodium dodecyl sulfate-polyacrylamide gel electrophoresis
The sodium dodecyl sulfate-polyacrylamide gel electrophoresis (SDS-PAGE) protocol applied in this study was based on the Laemmli method. For this experiment, we obtained 5–12% gradient gels [SuperSep (TM) Ace 5–12% 17-well], running buffer solution ( × 10), and sample buffers with and without 2ME from Fujifilm. The remaining gels were prepared in-house: 7.5% separating gel (7.5 w/v% acrylamide/bis mixed solution 29:1, 0.375 M Tris-Cl pH 8.8, 0.1 w/v% ammonium peroxodisulfate solution, 7 v/v% N,N,N′,N′-tetramethylethylenediamine), 15% separating gel (15 w/v% acrylamide/bis mixed solution 29:1, 0.375 M Tris-Cl pH 8.8, 0.1 w/v% ammonium peroxodisulfate solution, 4 v/v% N,N,N′,N′-tetramethylethylenediamine), and stacking gel (5 w/v% acrylamide/bis mixed solution 29:1, 0.125 M Tris-Cl pH 6.8, 0.1 w/v% ammonium peroxodisulfate solution, 0.1 v/v% N,N,N′,N′-tetramethylethylenediamine). A Mini300 electric power source obtained from AS ONE applied a constant 20 mA current for 90 min for electrophoresis.
Native PAGE
Protein solutions were mixed with sample buffer (0.125 M Tris-Cl, pH 6.8, 20% glycerol, 0.004 w/v% BPB) at a ratio of 5:5 μL and electrophoresed in a gel [SuperSep (TM) Ace 5–12% 17-well]. The Mini300 electric power source applied a constant voltage of 200 V for 100 min at 4°C using running buffer (0.025 M Tris, 0.192 M glycine).
Urease assay
The impact of nsPEFs on urease activity was examined with the Urease Assay Kit (QuantiChrom, BAS, DURE-100). We mixed urease samples with urea solution and put them under 37°C for 30 min to change urea into ammonia. Then, we added color reaction solution into the treated samples to detect ammonia concentration. We measured absorbance at 670 nm whose intensity was linear to ammonia concentration. Finally, we calculated urease activity, dividing ammonia concentration with reaction time (30 min). The enzyme activity was described by the ammonia content (in μmol) synthesized in 1 min in 1 L of urea liquid.
Band intensity distribution analysis
ImageJ software was used to analyze the electrophoresis band intensity distributions; for the native PAGE and SDS-PAGE results, 10 vertical lines were drawn across each band at the center, ImageJ determined the intensity distribution through the lines for each band and presented the average distributions measured through the 10 vertical lines for each band.
Statistical analysis
Statistics for native and SDS-PAGE were written in Band Intensity Distribution Analysis section. The data in Figure 5 ares presented as the mean ± standard error of the mean for three samples. Statistical analyses were performed using a two-tailed t-test, where p < 0.01 was considered statistically significant.
FIG. 5.
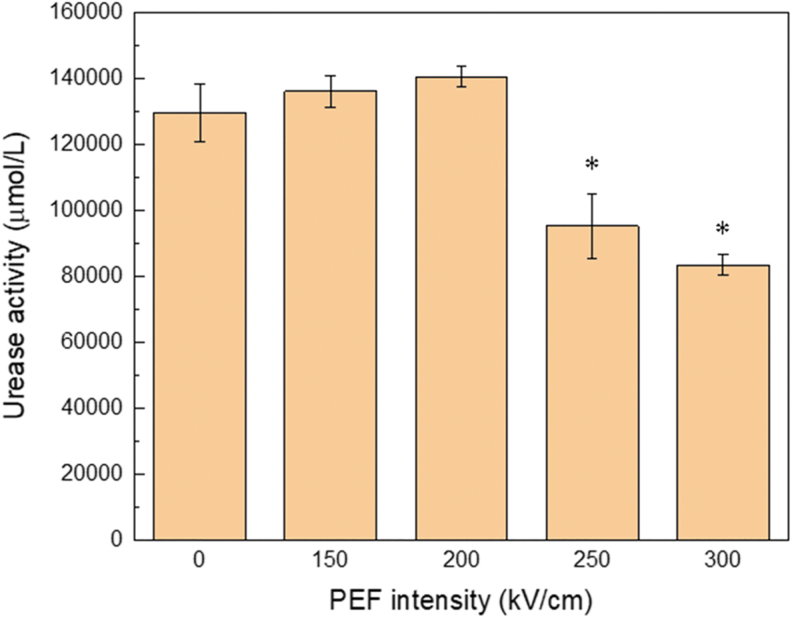
Enzyme activity of urease exposed to nsPEFs for varying electric field strengths. The error bars represent the standard error. n = 3, *p < 0.01, t-test.
Results and Discussion
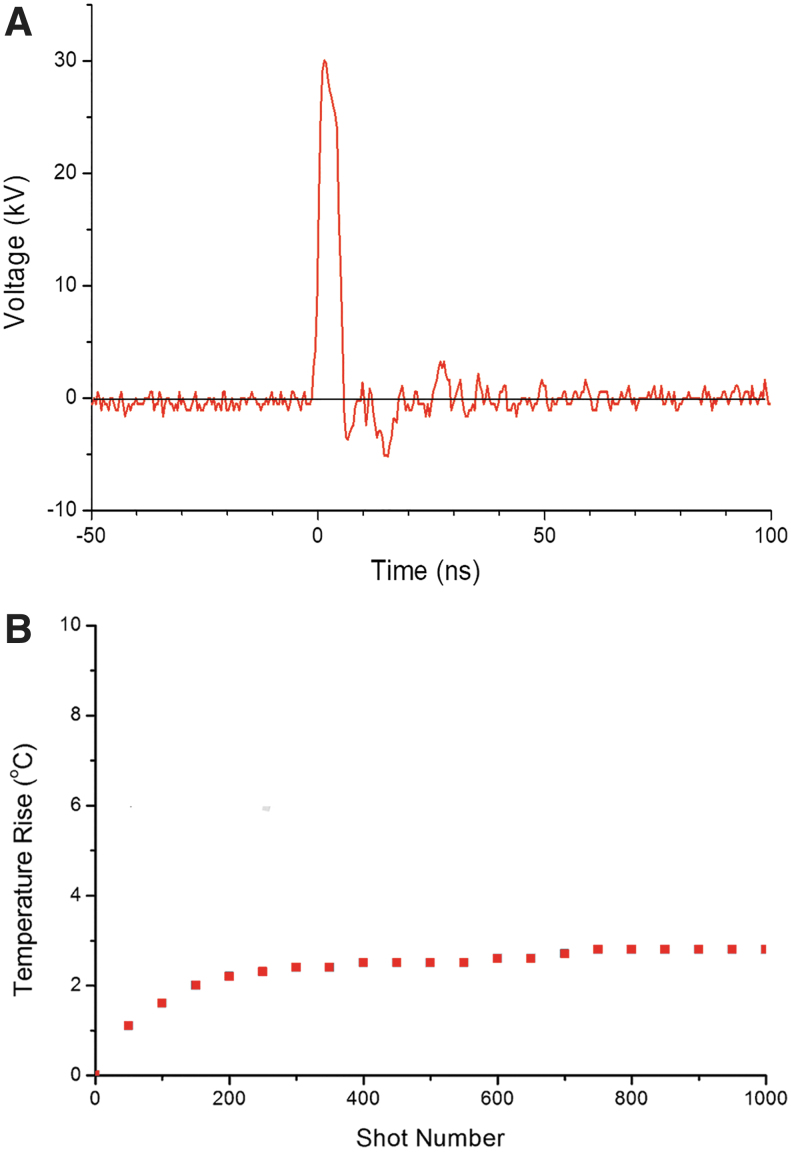
Voltage pulses with a duration of 5 ns, as shown in Figure 1, measured in a 1 mm gap cuvette using a capacitive divider, were delivered to the cuvette for 500 times at a repetition frequency of 3 Hz.20 The maximum electric field strength in the cuvette was 300 kV/cm, and the repetitive pulsing had a slight thermal effect, with a temperature rise of 3°C (Fig. 1B).
FIG. 1.
(A) Typical waveform of the voltage applied to a 1 mm gap cuvette containing a protein solution. (B) Temperature rise during pulse application. The temperature rise plateaued after 300 shots.
To analyze the effects of an electric field on the primary structure of proteins, we exposed lysozyme and albumin to nsPEFs and examined their structures using SDS-PAGE. Samples were boiled at 95°C for 5 min with SDS (surfactant) and 2-mercaptoethanol (2ME) (reducing agent) to completely destroy tertiary and secondary structures, and to leave primary structure only (Fig. 2A, B). The bands observed for all of the samples were the same as those obtained without PEF exposure, suggesting that the electric fields were unable to break the peptide bonds (Fig. 2A, B). Experiments of albumin were done for four times and those of lysozyme were three times. The band patterns for each protein were quite reproducible. We chose the best looking SDS-PAGE photo with less distorted shape, less noise, and higher contrast.
FIG. 2.
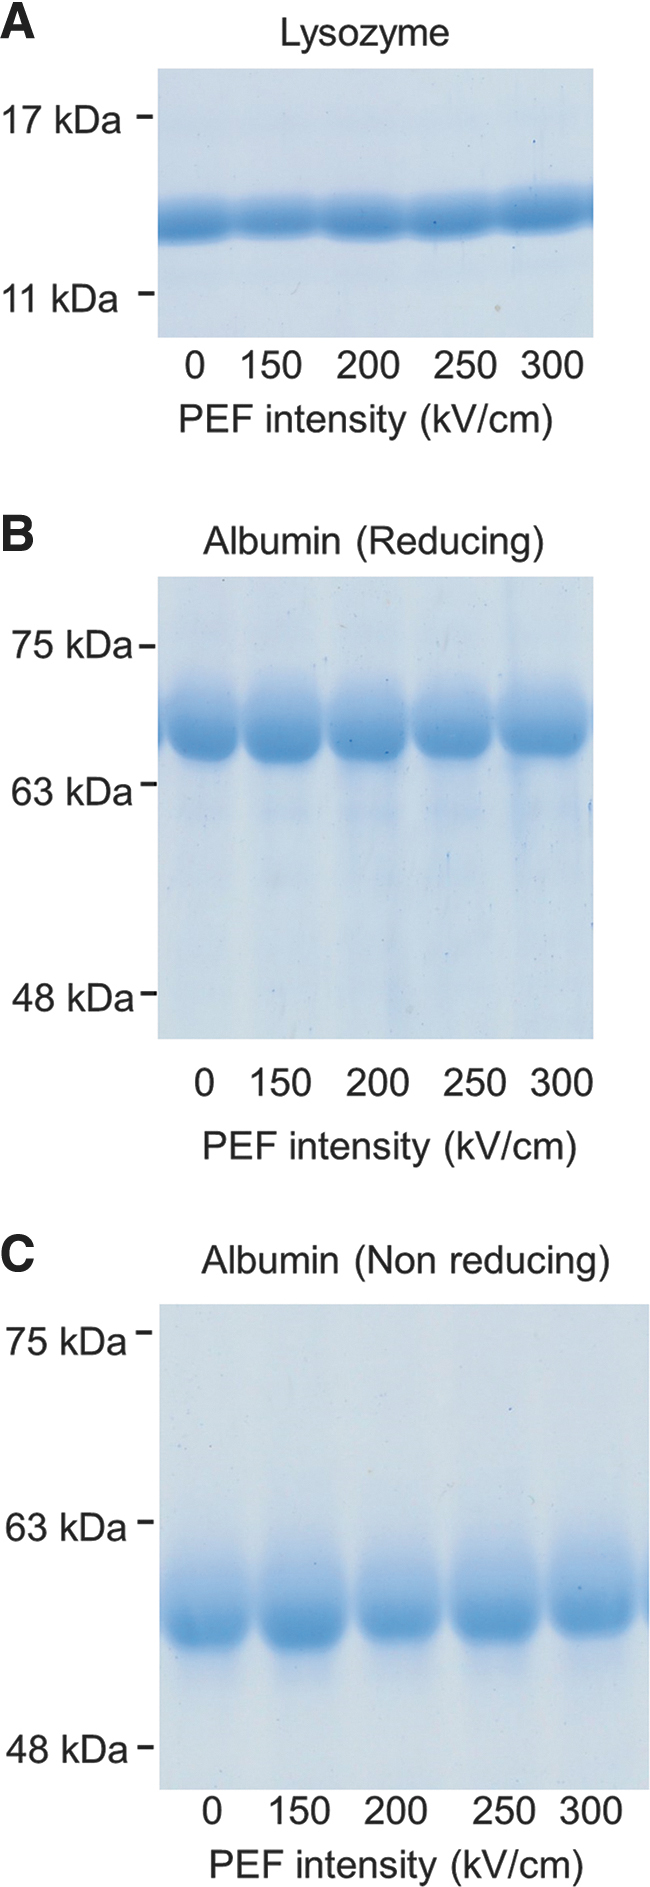
SDS-PAGE results for lysozyme and albumin exposed to nsPEFs: (A) Electrophoresis of lysozyme mixed with a reducing agent. The numbers below the gels indicate the strength of the nsPEF. The values on the left side of the gels indicate the positions of markers for the indicated molar weights. (B, C) Electrophoresis of albumin with (B) and without (C) a reducing agent. nsPEF, nanosecond pulsed electric field; SDS-PAGE, sodium dodecyl sulfate-polyacrylamide gel electrophoresis.
The tertiary structures involve two bond types, namely disulfide bonds and noncovalent bonds. To evaluate the damage incurred by the disulfide bonds, we compared albumin samples boiled with SDS (surfactant) at 95°C for 5 min under two different treatment conditions using SDS-PAGE; in one case, both primary structure and the disulfide bonds remained intact (nonreducing conditions), whereas only primary structure remained but the disulfide bonds were broken in the second case (reducing conditions). The two conditions differed in whether 2ME (reducing agent) was added to the samples, showing that it was possible to detect the existence of the disulfide bonds with albumin. The albumin band pattern did not change under reducing or nonreducing conditions, which implied that a 300 kV/cm nsPEF did not break the disulfide bonds (Fig. 2B, C).
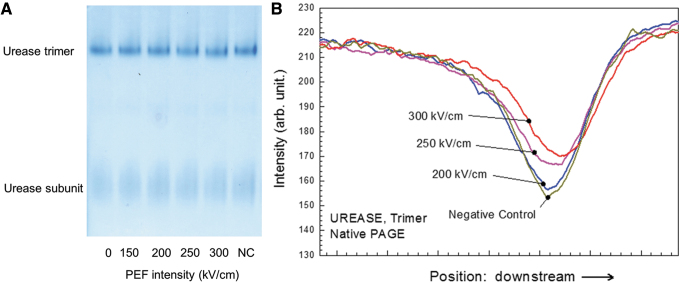
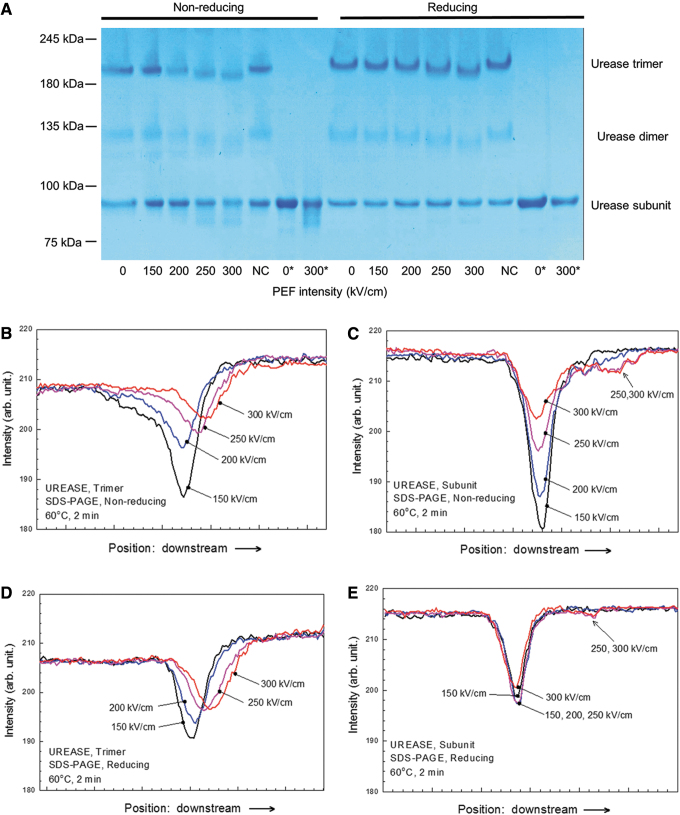
Urease, which has no covalent bonds in the tertiary or quaternary structures, was chosen as a large “soft” protein. Assessing tertiary and quaternary structures of urease, we chose Native PAGE, which has little impact on noncovalent bonds and hydrogen bonds and is often utilized to detect rough change of tertiary and quaternary structures. In native PAGE, the urease subunit bands were not sufficiently clear to assess any tertiary structure deformation; however, the trimer bands shifted downward under electric fields greater than 250 kV/cm (Fig. 3A, B). We did native PAGE for three times and the band patterns for each protein were quite reproducible. We chose the best looking SDS-PAGE photo with less distorted shape, less noise, and higher contrast. A negative control (NC) was utilized to determine whether electrode lysis or chemical reactions in the PBS solution, such as reactive oxygen species generation, affect the protein structure.21 On the basis of the small changes observed for the NC, it appeared that these effects were weaker than that of the electric field (Fig. 3A, B). To clarify these changes, we modified standard SDS-PAGE protocol because SDS-PAGE bands tend to be clearer than those of native PAGE. In the typical SDS-PAGE protocol, proteins are preheated at 95°C for 5 min with SDS (surfactant) and 2ME to destroy the tertiary and secondary structures by digesting disulfide and noncovalent bonds. Thus, it is impossible to investigate the tertiary and quaternary structures using the typical protocol. To solve these problems, previous articles already proposed modified SDS-PAGE and in the same way, we lowered the preheating temperature and shortened the duration to prevent the high-order structures in urease from being completely destroyed.22–24 Preheating at 60°C for 2 min was applied to ensure that the trimer bands and subunit bands emerge simultaneously with the same intensity. Although the primary structure of urease is a hexamer, only the trimer, dimer, and subunit bands were visible because the hexamer was too large for the electrophoresis performed in this study (Fig. 3A). Under nonreducing conditions, the trimer and dimer bands shifted downward, and smears appeared below the subunit bands when the applied electric field amplitude was 250 kV/cm or higher (Fig. 4A–C). The trimer and dimer band also shifted under reducing conditions (Fig. 4A, D). These results suggested that nsPEFs exerted an effect on the tertiary and quaternary structures. We did SDS-PAGE for 12 times and the band patterns for each protein were quite reproducible. We chose the best looking SDS-PAGE photo with less distorted shape, less noise, and higher contrast.
FIG. 3.
Native PAGE results for urease exposed to nsPEFs. (A) Electrophoresis of the urease trimer and subunit. The numbers below the gel indicate the strength of the nsPEF. NC denotes the sample in which normal urease is dissolved in 300 kV/cm-nsPEF-treated PBS. (B) Urease trimer band spectra. The peak position shifted slightly downstream upon exposure to electric fields stronger than 250 kV/cm. NC, negative control; PBS, phosphate-buffered saline.
FIG. 4.
(A) SDS-PAGE results for urease treated at 60°C for 2 min under nonreducing or reducing conditions. The bands between 180 and 245 kDa correspond to the trimer, those between 100 and 135 kDa correspond to the dimer and those between 75 and 100 kDa correspond to the subunits. The numbers below the gel indicate the strength of the nsPEF. NC denotes the sample in which normal urease is dissolved in nsPEF-treated PBS. 0* and 300* denote samples that were exposed to nsPEF strengths of 0 and 300 kV/cm, respectively, and boiled at 95°C for 5 min. (B–E) Band intensity distributions from SDS-PAGE: trimer bands under nonreducing conditions (B), subunit bands under nonreducing conditions (C), trimer bands under reducing conditions (D), and subunit bands under reducing conditions (E). Since the dimer bands signals were too weak, there were no band intensity distributions of the dimer.
Protein structures are important in determining a protein's function. We analyzed the enzyme activity of urease exposed to nsPEFs using the QuantiChrom Urease Assay Kit (BAS, DURE-100). At electric field strengths of 250 kV/cm or higher, the activity significantly decreased (Fig. 5). This trend coincided with the structure changes determined by SDS-PAGE (Fig. 4A).
Conclusion
While 5 ns nsPEFs for 500 times at 3 Hz could not digest the peptide bonds and disulfide bonds (Fig. 2A–C), the trimer and dimer bands shifted downward, and smears appeared below the subunit bands for intensities of 250 kV/cm or higher under nonreducing conditions (Figs. 4A–C). The former results proved that covalent bonds were too strong for nsPEFs to influence. However, the latter data suggested that nsPEFs had a potential to affect protein tertiary and quaternary structures. Previous articles say aluminum stabilizes β-sheet structures, promoting aggregation of amyloid β-protein and inhibits several protein activities.25–31 Although aluminum ions from the electrode due to the electrolysis might have an influence on urease protein, only a little change in the SDS-PAGE pattern of the NC sample suggested that the effect of aluminum ions on urease protein was less than that of electric fields.
So far, numerous articles have proposed several effects of electric fields to proteins: conformational effects and chemical effects.21,32–34 The main cause of the tertiary and quaternary structures deformation of urease might be one of those effects. However, it is necessary to collect enormous data to determine the main factor. This time, we just showed 5-ns-long electrical pulses, which reduced thermal effects as less as possible, had an ability to affect tertiary and quaternary structures and decided to analyze detailed phenomena on proteins, such as fluorescence analysis of endogenous TYR and TRP residues in the proteins and CD spectra analysis to assess structural changes in proteins, as a future work.
Acknowledgment
The authors thank Enago for the English language review.
Authors' Contribution
S.K. designed the research. T.K. built and operated the pulse generator and performed voltage measurements. G.U. analyzed the protein results and wrote the article. All authors have reviewed and agreed with this article. This article is not submitted elsewhere, except the preprint server, BioRxiv.
Author Disclosure Statement
No competing financial interests exist.
Funding Information
This study was partially supported by a Grant-in-Aid for Scientific Research (17H03220).
References
- 1.Gianulis EC, Lee J, Jiang C, et al. Electroporation of mammalian cells by nanosecond electric field oscillations and its inhibition by the electric field reversal. Sci Rep 2015;5:13818. [DOI] [PMC free article] [PubMed] [Google Scholar]
- 2.Bertino G, Sersa G, De Terlizzi F, et al. European Research on Electrochemotherapy in Head and Neck Cancer (EURECA) project: Results of the treatment of skin cancer. Eur J Cancer 2016;63:41–52 [DOI] [PubMed] [Google Scholar]
- 3.Pérez-Andrés JM, Charoux CMG, Cullen PJ, et al. Chemical modifications of lipids and proteins by nonthermal food processing technologies. J Agric Food Chem 2018;66:5041–5054 [DOI] [PubMed] [Google Scholar]
- 4.Rems L, Miklavčič D. Tutorial: Electroporation of cells in complex materials and tissue. J Appl Phys 2016;119:201101 [Google Scholar]
- 5.Miklavcic D, Rols M-P, Haberl Meglic S, et al. Gene electrotransfer: A mechanistic perspective. Curr Gene Ther 2016;16:98–129 [DOI] [PMC free article] [PubMed] [Google Scholar]
- 6.He L, Xiao D, Feng J, et al. Induction of apoptosis of liver cancer cells by nanosecond pulsed electric fields (nsPEFs). Med Oncol 2017;34:1–11 [DOI] [PubMed] [Google Scholar]
- 7.Hanna H, Denzi A, Liberti M, et al. Electropermeabilization of inner and outer cell membranes with microsecond pulsed electric fields: Quantitative study with calcium ions. Sci Rep 2017;7:1–14 [DOI] [PMC free article] [PubMed] [Google Scholar]
- 8.Havelka D, Cifra M, Kučera O. Multi-mode electro-mechanical vibrations of a microtubule: In silico demonstration of electric pulse moving along a microtubule. Appl Phys Lett 2014;104:243702 [Google Scholar]
- 9.Kučera O, Havelka D. Mechano-electrical vibrations of microtubules—Link to subcellular morphology. Biosystems 2012;109:346–355 [DOI] [PubMed] [Google Scholar]
- 10. D. Havelka MC. Calculation of the electromagnetic field around a microtubule. Acta Polytech 2009;49:58–63 [Google Scholar]
- 11.Cifra M, Havelka D, Kučera O, et al. Electric field generated by higher vibration modes of microtubule. In: Proceedings of 15th Conference Microwave Techniques, COMITE 2010. Czech Republic: IEE, 2010: 205–208
- 12.Hekstra DR, White KI, Socolich MA, et al. Electric-field-stimulated protein mechanics. Nature 2016;540:400–405 [DOI] [PMC free article] [PubMed] [Google Scholar]
- 13.Havelka D, Cifra M, Kučera O, et al. High-frequency electric field and radiation characteristics of cellular microtubule network. J Theor Biol 2011;286:31–40 [DOI] [PubMed] [Google Scholar]
- 14.Carr L, Bardet SM, Burke RC, et al. Calcium-independent disruption of microtubule dynamics by nanosecond pulsed electric fields in U87 human glioblastoma cells. Sci Rep 2017;7:41267. [DOI] [PMC free article] [PubMed] [Google Scholar]
- 15.Zhao Y, Zhan Q. Electric fields generated by synchronized oscillations of microtubules, centrosomes and chromosomes regulate the dynamics of mitosis and meiosis. Theor Biol Med Model 2012;9:26. [DOI] [PMC free article] [PubMed] [Google Scholar]
- 16.English NJ, Waldron CJ. Perspectives on external electric fields in molecular simulation: Progress, prospects and challenges. Phys Chem Chem Phys 2015;17:12407–12440 [DOI] [PubMed] [Google Scholar]
- 17.Marracino P, Havelka D, Průša J, et al. Tubulin response to intense nanosecond-scale electric field in molecular dynamics simulation. Sci Rep 2019;9:10477. [DOI] [PMC free article] [PubMed] [Google Scholar]
- 18.Pokorný J, Pokorný J, Kobilková J. Postulates on electromagnetic activity in biological systems and cancer. Integr Biol (Camb) 2013;5:1439–1446 [DOI] [PubMed] [Google Scholar]
- 19.Pillet F, Formosa-Dague C, Baaziz H, et al. Cell wall as a target for bacteria inactivation by pulsed electric fields. Sci Rep 2016;6:19778. [DOI] [PMC free article] [PubMed] [Google Scholar]
- 20.Adachi R, Hatayama S, Ohnishi N, et al. Cell death induced by nanosecond pulsed electric fields and its dependence on pulse duration. Electron Commun Japan 2018;101:38–48 [Google Scholar]
- 21.Pakhomova ON, Xiao S, Saulis G, et al. Oxidative effects of nanosecond pulsed electric field exposure in cells and cell-free media. Arch Biochem Biophys 2012;527:55–64 [DOI] [PMC free article] [PubMed] [Google Scholar]
- 22.Drew D, Lerch M, Kunji E, et al. Optimization of membrane protein overexpression and purification using GFP fusions. Nat Methods 2006;3:303–313 [DOI] [PubMed] [Google Scholar]
- 23.Nakatani T, Yasui N, Issei T, et al. Specific modification at the C-terminal lysine residue of the green fluorescent protein variant, GFPuv, expressed in Escherichia coli. Sci Rep 2019;9:1–13 [DOI] [PMC free article] [PubMed] [Google Scholar]
- 24.Drew D, Newstead S, Sonoda Y, et al. GFP-based optimization scheme for the overexpression and purification of eukaryotic membrane proteins in Saccharomyces cerevisiae. Nat Protoc 2008;3:784–798 [DOI] [PMC free article] [PubMed] [Google Scholar]
- 25.Yamamoto H, Saitoh Y, Yasugawa S, et al. Dephosphorylation of r factor by protein phosphatase 2A in synaptosomal cytosol fractions, and inhibition by aluminum. J Neurochem 1990;55:683–690 [DOI] [PubMed] [Google Scholar]
- 26.Vyas SB, Duffy LK. Stabilization of secondary structure of Alzheimer β-protein by aluminum(III) ions and D-Asp substitutions. Biochem Biophys Res Commun 1995;206:718–723 [DOI] [PubMed] [Google Scholar]
- 27.Shea TB, Balikian P, Beermann M Lou. Aluminum inhibits neurofilament protein degradation by multiple cytoskeleton-associated proteases. FEBS Lett 1992;307:195–198 [DOI] [PubMed] [Google Scholar]
- 28.Scott CW, Fieles A, Sygowski LA, et al. Aggregation of tau protein by aluminum. Brain Res 1993;628:77–84 [DOI] [PubMed] [Google Scholar]
- 29.Nayak P. Aluminum: Impacts and disease. Environ Res 2002;89:101–115 [DOI] [PubMed] [Google Scholar]
- 30.Kawahara M, Muramoto K, Kobayashi K, et al. Aluminum promotes the aggregation of Alzheimer's amyloid β-protein in vitro. Biochem Biophys Res Commun 1994;198:531–535 [DOI] [PubMed] [Google Scholar]
- 31.Arispe N, Rojas E, Pollard HB. Alzheimer disease amyloid beta protein forms calcium channels in bilayer membranes: Blockade by tromethamine and aluminum. Proc Natl Acad Sci 1993;90:567–571 [DOI] [PMC free article] [PubMed] [Google Scholar]
- 32.Zhao W, Tang Y, Lu L, et al. Review: Pulsed electric fields processing of protein-based foods. Food Bioprocess Technol 2014;7:114–125 [Google Scholar]
- 33.Bekard I, Dunstan DE. Electric field induced changes in protein conformation. Soft Matter 2014;10:431–437 [DOI] [PubMed] [Google Scholar]
- 34.Timmons JJ, Preto J, Tuszynski JA, et al. Tubulin's response to external electric fields by molecular dynamics simulations. PLoS One 2018;13:e0202141. [DOI] [PMC free article] [PubMed] [Google Scholar]


