

Abstract
The primary aim of the study was to estimate the effect of sleep duration on prospective type 2 diabetes (T2D) risk across demographic characteristics and follow-up periods, and test BMI as a mediator and moderator. Data included adults (Mage = 39.0 ± 12.7y) born in the US or Mexico recruited from 2001-2012 in a Mexican American cohort study conducted in Houston, Texas (n=15,779). Participants completed self-reported questionnaires at baseline related to health, health behaviors (sleep duration, physical activity, smoking, drinking) and sociocultural factors, and were followed up annually. Cox proportional hazard models estimated hazard ratios (HR) for the effect of sleep duration on T2D diagnosis at follow-up. Of the participants, 10.3% were diagnosed with T2D. Self-reported ≤5 hours of sleep, compared to 7-8 hours, at baseline predicted greater risk for T2D (HR=1.32, p=.001), yet was no longer significant after adjusting for sociodemographic characteristics and BMI. Notably, those with BMI < 25 kg/m2 reporting ≤5 hours of sleep were at significant risk for T2D at 3 (HR=4.13, p=.024) and 5 year follow-up (HR=3.73, p=.008) compared to 7-8 hours. Obesity status accounted for 31.6% and 27.3% of the variance in the association between ≤5 and 6 hours of sleep and increased T2D risk, respectively. Results highlighted the mediating and moderating role of BMI, and its effect on T2D risk at earlier follow-up among those without obesity. T2D prevention and control for Mexican American adults should consider the role of chronic sleep loss.
Keywords: Type 2 diabetes risk, obesity, health behaviors, sleep, Mexican Americans
Introduction
The last few decades have seen an upward trend in type 2 diabetes (T2D) incidence, which is beginning to level off in the general population.1 However, Hispanic/Latinx (heretofore Hispanic, the preferred term in Texas) adults disproportionately experience increasing rates of T2D2 with rates greater than non-Hispanic white adults.3 In addition to increasing vulnerability to cardiovascular diseases and cancers,4,5 T2D can economically burden patients given the costly comorbidities and T2D-related complications.6,7 It is likely that the T2D disparities among Hispanic individuals is due in part to high rates of obesity in this group compared to non-Hispanic White individuals.8,9 Excessive bodyweight is an important and mutable predictor of T2D,10 and is partly responsible for its rise.11 Indeed, excessive fat can decrease insulin sensitivity and impair pancreatic beta cells to increase risk for T2D.12,13 Thus, understanding the behavioral risk factors for T2D in this population can inform community health promotion efforts.
While poor diet and physical inactivity are well-known risk factors for T2D,10 a wealth of evidence also highlights insufficient sleep as an important,14-16 if not more important,17 contributor. The American Academy of Sleep Medicine and Sleep Research Society recommend adults (18-60 years) obtain at least 7 hours of sleep a night,18 and evidence suggests that short sleep (≤ 6 hours/night) can increase obesity risk among diverse racial/ethnic minority adults.19-22 According to the energy allocation theory of sleep functioning,23 insufficient sleep upregulates energy requirements during the day to compensate for waking hour activation of biological processes that normally occur during nighttime sleep. That is, short sleep encourages a positive energy balance by increasing the energy intake required to maintain homeostasis during waking hours. Thus, short sleep can dysregulate metabolic processes by increasing insulin resistance and daily levels of ghrelin, and dampening daily levels of leptin—altogether increasing risk for obesity and T2D.24-26
The question of how obesity modifies (i.e., moderates) the link between short sleep and T2D among Mexican American adults remains unknown and an important area of inquiry. First, understanding the potential modifying nature of BMI can provide conceptual clarity in the role of obesity in the sleep duration and T2D risk link. Drawing upon an exposure and reactivity model,27 conceptualizing BMI as a mediator highlights an exposure process by which short sleep increases exposure to T2D risk factors such as elevated BMI, whereas conceptualizing BMI as a moderator suggests that reactivity to short sleep varies across levels of BMI. A majority of theory23,26,28 and epidemiological research29-35 in this area focus on the exposure model (i.e., BMI as a mediator) leaving open opportunities to test alternative conceptualizations such as the reactivity model (i.e., BMI as a moderator). Studying the reactivity model furthers our theoretical understanding of BMI, but also provides helpful insight into T2D screening efforts by identifying for which groups short sleep increases T2D risk. Although no known study has stratified the effect of sleep duration on T2D risk across BMI among Mexican American adults, studies in other countries do not find a modifying effect of BMI.36,37 However, results may not generalize to the US context given the high rates of obesity. The reactivity model is indirectly supported in one study, which found that short sleep was more strongly related to hypertension risk among those with normal weight statuses.38 Thus, we seek to test both the exposure and reactivity model by examining BMI as both an intermediary factor (i.e., mediator) and modifying factor (i.e., moderator) in the link between short sleep and T2D risk.
Second, there are few large-scale epidemiological studies examining the link between short sleep, obesity, and T2D among Hispanic adults—a fast growing ethnic group in the US. The mixed evidence has suggested both significant39 and non-significant40,41 relationships between short sleep and T2D among this group. Differences in study characteristics such as ethnic composition of the sample, acculturation level, and use of covariates likely account for the mixed findings. For example, samples likely included multiple ethnic groups varying in acculturation level, which was only identified one study,40 and studies used different health behaviors (e.g., diet, physical activity, smoking) and demographic characteristics (e.g., income, shift work) as covariates. The heterogeneity within samples of Hispanic individuals is particularly important as one study found that sleep duration was related to body size only among Mexican American individuals.42 Our study contributes to the literature by clarifying the sleep duration and T2D risk relationship among Mexican American adults born in the US or Mexico. Given that Mexican American adults have the highest prevalence of T2D compared to other Hispanic groups,43 greater research is needed to understand how other behavioral risk factors in addition to physical activity and diet impact T2D risk in this population.
Previous studies highlight modifying effects of other important sociodemographic characteristics in the sleep duration and T2D link. For example, subgroups of Hispanic individuals are disproportionately impacted by inadequate sleep. Large-scale epidemiological studies suggest that the health consequences of sleep duration can vary by country of origin among Hispanic individuals,40,44 likely reflecting different sociocultural and immigration histories. While Hispanic individuals who acculturate to the US culture experience worsened sleep habits,45,46 it remains unclear if inadequate sleep increases risk of T2D among more acculturated individuals. Furthermore, past studies also suggest the link between sleep duration and T2D may differ across sex (i.e., null findings among women,34,41,47 in contrast to significant effects found among men30), and age (i.e., significant effects of short sleep on T2D among those under 65 years48, and variable effects of sleep timing on HbA1c levels among Hispanic individuals younger than 35 years44).
The current study builds upon previous research limited by cross-sectional study designs, racially/ethnically aggregated samples, and shorter follow-up periods to examine the prospective effect of sleep duration on self-reported T2D diagnosis among Mexican-origin adults. The primary aim of our study was to examine the baseline effect of sleep duration on T2D risk among Mexican-origin adults. We proposed the following hypotheses: (1) sleep duration will be inversely related to T2D risk; (2) obesity will moderate the relationship between sleep duration and T2D risk such that the effect of sleep duration on T2D risk will be stronger among those without obesity; (3) obesity will mediate the relationship between sleep duration and T2D risk; and (4) the association between sleep duration and T2D risk will be stronger among individuals who reported greater acculturation, being born in the US, being male, or being younger.
Methods
Study cohort
Data were from the Mexican American Cohort Study conducted in Houston, TX. Details of study data collection are described elsewhere.49 Briefly, participants completed an in-person interview related to current and past health, health behaviors, anthopometry, work history, and demographic and psychosocial characteristics. Participants were followed-up annually with a short telephone interview to update contact information and diagnoses for chronic diseases. When a new diagnosis of T2D was present, participants provided a date of diagnosis, type of diabetes and treatment, and names of the physician and hospital/clinic for diagnosis/treatment.
The final sample (n = 15,779) included Mexican-origin adults (≥21 years) born in the US or Mexico recruited between 2001-2012 with complete data for self-report sleep, BMI, and demographics at baseline, a follow-up interview prior to November 2018, and no reported history of T2D at study enrollment. There were 415 (2.6%) deaths at follow-up with 386 (2.4%) without T2D. Figure 1 displays the inclusion/exclusion flowchart for the current study resulting in no missing data for 15,779 participants. Overall, the distribution of responses to study variables were largely similar between the complete and final sample based on descriptive statistics.
Figure 1.
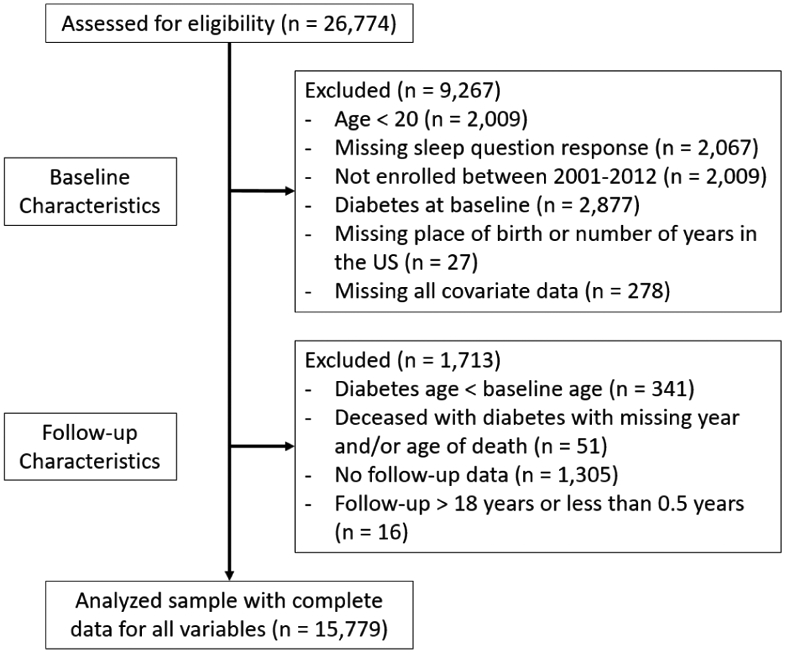
Study inclusion/exclusion flow chart.
The Mexican American Cohort study is conducted under the University of Texas MD Anderson Cancer Center Institutional Review Board approved protocols 2009-0379 and CPN00-367.
Measures
Diabetes.
Self-reported T2D was previously validated by reviewing medical records for a subset of participants (n = 235) and showed 98% agreement.
Sleep duration.
Sleep duration was based on one item related to number of hours slept including naps in the past year (i.e., “On the average, during the last year, how many hours in a day did you usually sleep including naps?”). Participants were asked to choose from 6 response options: ≤5, 6, 7, 8, 9, or ≥10 hours. The current study collapsed the 7 and 8 hour responses together based on a recent meta-analysis suggesting that the lowest T2D risk was between 7-8 hours of sleep per day.50 Thus, sleep duration as categorized as: ≤5, 6, 7-8 [reference], 9, or ≥10 hours.
Acculturation.
Acculturation was measured using four items from the Bidimensional Acculturation Scale for Hispanics (BAS),51 which assesses the frequency and ability to speak, read, and consume media in English and Spanish (e.g., How often do you watch television programs in English?). Participants rated each item on a 4-point Likert scale (1 = “almost always”/ “very well”; 2 = “often”/ “well”; 3 = “sometimes”/ “poorly”; 4 = “almost never”/ “very poorly”). Items were reversed scored such that higher scores represented greater English or Spanish speaking, reading, or media use, and composite scores were calculated by averaging the 4 items for English and Spanish separately. Participants with mean scores greater than 2.5 on English or Spanish were classified as English or Spanish dominant, respectively. Participants with scores greater than 2.5 on both English and Spanish subscales were classified as bilingual.
Physical activity.
We measured physical activity using items from the California Teachers Study (CTS) survey.52 Participants were asked to estimate the average hours per week (“Never,” “0.5,” “1,” “1.5,” “2,” “3,” “4–6,” “7–10,” or “11+ hours”) and the average number of months (“1–3,” “4–6,” “7–9,” and “10–12 months”) during the past year spent in strenuous, moderate or light exercise, sport or work activities. Average number of minutes per week spent doing strenuous and moderate physical activity was calculated by multiplying average hours per week and proportion of the year. The resulting time was then compared to national physical activity recommendations (i.e., 75 minutes of vigorous physical activity or 150 minutes of moderate activity) to create a dichotomous variable reflecting meeting/not meeting the physical activity guideline.
Substance use.
Alcohol consumption was measured using one item assessing frequency of drinking any alcohol beverages (“Do you now or did you ever drink any alcoholic beverages, at least once per month for 1 year or more?”) with three options (“Yes, currently,” “Yes, but I quit,” or “No, never.”) Similarly, smoking was measured using one item assessing frequency of cigarette use (“Have you smoked at least 100 cigarettes (5 packs) in your entire life?”) with three options (“Yes, currently,” “Yes, but I quit,” or “No, never smoked.”)
Body mass index (BMI).
BMI was based on measured height and weight data. When objective measures were not available, self-reported height and weight data were used to calculate BMI. Participants were classified as normal/underweight (BMI < 25.0), overweight (25 ≤ BMI < 30.0), or obese (BMI ≥ 30.0). Normal and underweight was combined given the few underweight cases (n = 108). 71.6% of the BMI data were based on measured height and weight by trained staff.
Demographic characteristics.
Demographic information included self-reported age (median split), sex (Male or Female), marital status, education, and birth country (US, Mexico). Marital status was recoded as “Married” (“Married/living as married”) or “Not married” (combined “Widowed”, “Separated”, “Divorced”, and “Never married”). Education was recoded as “<High school” (combined “No formal schooling”, “Elementary”, “Middle school/junior high”), “High school grad” (combined “High school”, “High school graduate”, “GED”, “Technical/vocational training”, “Associate degree/some college”), or “College” (combined “Bachelor's degree”, “Post-graduate degree”).
Statistical analyses
Preliminary analyses included descriptive statistics to characterize T2D progression, and t-tests and Chi-square tests to compare T2D risk across demographic characteristics. To test the first hypothesis (i.e., sleep duration will be inversely related to T2D risk), Cox proportional hazard models were used to estimate the adjusted and unadjusted hazard ratio (HR) for T2D at follow-up associated with baseline predictors including sleep duration, health behaviors, and demographic characteristics. Participants free of T2D diagnosis were censored at their last follow-up interview or date of death (n = 13,765). Follow-up time was defined as the difference between diagnosis date and enrollment date for those who self-reported T2D at follow-up. Participants who did not self-report T2D diagnosis and died during the annual follow-up (n = 386) were censored at time of death. The median follow-up time was 9.67 years.
To test the second hypothesis (i.e., the sleep duration and obesity risk link will be stronger among those without obesity, who were more acculturated, who were males, and who were younger) was first tested by conducting independent moderated regressions for each potential modifier. Cox proportional hazard models included sleep duration, demographic characteristics, and their interaction. For statistically significant interactions, we then stratified the effect of sleep duration and T2D by demographic characteristic.
We also conducted a sensitivity analysis that stratified the effect of sleep on T2D across BMI (< 25, 25 to < 30, <30, and ≥ 30) by follow-up duration. Recent meta-analyses suggested a stronger effect of sleep duration on T2D risk among studies with longer follow-up durations16 up to 10 years.48 Based on the cumulative incidence of T2D risk across follow-up period (Figure 2), we censored at 3, 5, and > 5 year follow-up, which was 25%, 42%, and 58%, respectively. Further, we aggregated participants with BMI < 30 to explore the impact of sleep duration among those without obesity.
Figure 2.
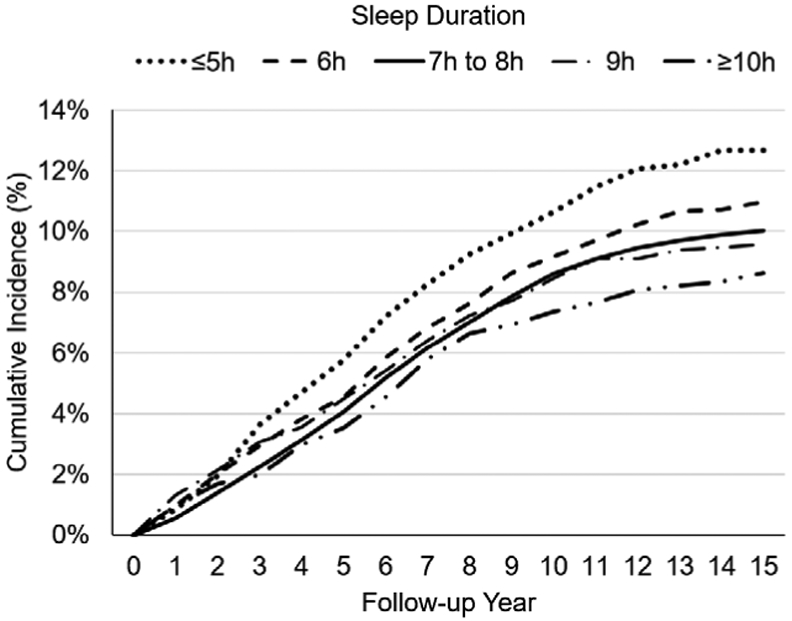
Cumulative type 2 diabetes incidence by follow-up duration and sleep duration.
Lastly, we tested the third hypothesis (i.e., obesity will mediate the association between short sleep and T2D risk) using mediation analyses. A SAS macro was used to estimate total, direct, and indirect effects and potential mediator interactions in a Cox proportional hazard model.53 The macro was specified to conduct a Cox proportional hazard model with a logit link function that allowed censoring and mediator interactions. Indirect effects were calculated using the delta method. Mediation was determined to be present if the value “1” did not fall within the 95% confidence intervals. We also explored the potential mediation of baseline physical activity (meet/does not meet physical activity guidelines).
Covariates included in main analyses included age, sex, education, marital status, birth country, acculturation, alcohol use, smoking, and physical activity. SAS version 9.4 (Cary, NC) was used to perform all analyses. Vital status (living/deceased) was not associated with greater T2D risk for the overall follow-up, but was related to greater T2D risk at the 3- and 5-year follow-up (Table S1). Including vital status as an additional covariate did not impact the pattern of results, and was thus not included as a covariate in the models. All statistical tests were 2-sided, and p-values <0.05 were considered statistically significant.
Results
Table 1 provides descriptive statistics for baseline characteristics of the sample stratified by T2D diagnosis. On average, the sample was 39.0 years old (SD = 12.7), predominantly female (79.2%), married (80.0%), less than high school educated (58.1%), born in Mexico (76.1%), and Spanish-speaking dominant (58.6%). Participants were predominantly obese (47.6%), never smokers (74.8%), never drinkers (67.5%), did not meet physical activity guidelines (78.9%), and reported a daily average of 7-8 hours of sleep in the past year (62.3%). Risk of T2D at follow-up across sociodemographic and health behaviors was associated with being older, female, having less than a high school education, obese, not meeting physical activity guidelines, and reporting less sleep duration.
Table 1.
Baseline demographic characteristics by self-reported incident type 2 diabetes at follow-up.
| Total | Type 2 diabetes (N = 1,628) |
No Type 2 diabetes (N = 14,151) |
||
|---|---|---|---|---|
| Characteristic | N (%)/Mean (SD) | N (%)/Mean (SD) | N (%)/Mean (SD) | p |
| Age | 38.98 (12.7) | 42.8 (11.2) | 38.5 (12.7) | <.0001 |
| ≤ 36 years | 8012 (50.8%) | 535 (32.9) | 7477 (52.8) | |
| > 36 years | 7767 (49.2%) | 1093 (67.1) | 6674 (47.2) | <.0001 |
| Sex | ||||
| Male | 3287 (20.8%) | 292 (17.94) | 2995 (21.16) | |
| Female | 12492 (79.2%) | 1336 (82.06) | 11156 (78.84) | 0.002 |
| Marital status | ||||
| Married | 12618 (80.0%) | 1311 (80.53) | 11307 (79.90) | |
| Not married | 3161 (20.0%) | 317 (19.47) | 2844 (20.10) | 0.550 |
| Education | ||||
| <High school | 9177 (58.2%) | 1070 (65.72) | 8107 (57.29) | |
| High school grad | 6176 (39.1%) | 523 (32.13) | 5653 (39.95) | |
| College | 426 (2.7%) | 35 (2.15) | 391 (2.76) | <.0001 |
| Place of birth | ||||
| Mexico | 12008 (76.1%) | 1236 (75.92) | 10772 (76.12) | |
| US | 3771 (23.9%) | 392 (24.08) | 3379 (23.88) | 0.858 |
| Acculturation | ||||
| Spanish dominant | 9251 (58.6%) | 999 (61.74) | 8252 (58.75) | |
| English dominant | 1553 (9.8%) | 168 (10.38) | 1385 (9.86) | |
| Bilingual | 4861 (30.8%) | 451 (27.87) | 4410 (31.39) | 0.015 |
| Body mass index (kg/m2) | ||||
| <25 | 2777 (17.6%) | 71 (4.36) | 2706 (19.12) | |
| 25 to <30 | 5502 (34.9%) | 379 (23.28) | 5123 (36.20) | |
| ≥30 | 7500 (47.5%) | 1181 (72.36) | 6322 (44.68) | <.0001 |
| Cigarette smoking | ||||
| Never | 11803 (74.8%) | 1205 (74.02) | 10598 (74.89) | |
| Former | 2052 (13.0%) | 232 (14.25) | 1820 (12.86) | |
| Current | 1924 (12.2%) | 191 (11.73) | 1733 (12.25) | 0.268 |
| Alcohol drinking | ||||
| Never | 10653 (67.5%) | 1122 (68.92) | 9531 (67.35) | |
| Former | 1341 (8.5%) | 149 (9.15) | 1192 (8.42) | |
| Current | 3785 (24.0%) | 357 (21.93) | 3428 (24.22) | 0.098 |
| Physical activity guidelines | ||||
| Not meeting | 12442 (78.9%) | 1321 (81.14) | 11121 (78.59) | |
| Meeting | 3337 (21.2%) | 307 (18.86) | 3030 (21.41) | 0.017 |
| Sleep duration (h) | ||||
| ≤5 | 1318 (8.4%) | 167 (10.26) | 1151 (8.13) | |
| 6 | 2844 (18.0%) | 312 (19.16) | 2532 (17.89) | |
| 7-8 | 9636 (62.3%) | 985 (60.50) | 8851 (62.55) | |
| 9 | 1075 (6.8%) | 103 (6.33) | 872 (6.87) | |
| ≥10 | 706 (4.5%) | 61 (3.75) | 645 (4.56) | 0.012 |
Note. SD = standard deviation; h = hours.
Results partially supported the hypothesis that short sleep would be related to increase T2D risk. To examine the association between sleep duration and T2D risk after controlling for covariates, Table 2 displays the results from Cox-proportional hazard models with the overall sample and stratified by sociodemographic and lifestyle behaviors. Results showed that the unadjusted effect of self-reported ≤ 5 hours of sleep, compared to 7-8 hours, on T2D at follow-up (HR = 1.315, p = .001) was no longer significant after adjusting for sociodemographic factors, BMI, and lifestyle behaviors (HR = 1.153, p = .092).
Table 2.
Sleep duration predicting type 2 diabetes (T2D) risk across sociodemographic and lifestyle factors.
| Model | Sleep (Hours)* | T2D/ No T2D | HR | 95% CI | p | |
|---|---|---|---|---|---|---|
| Overall Unadjusted | ≤5 | 167/1151 | 1.315 | 1.116 | 1.550 | 0.001 |
| 6 | 312/2532 | 1.104 | 0.972 | 1.254 | 0.127 | |
| 7-8 | 985/8851 | 1 [Ref] | -- | -- | -- | |
| 9 | 103/972 | 0.975 | 0.796 | 1.195 | 0.810 | |
| ≥10 | 61/645 | 0.914 | 0.706 | 1.183 | 0.494 | |
| Adj HR | 95% CI | p | ||||
| Overall Adjusted | ≤5 | 167/1151 | 1.153 | 0.977 | 1.360 | 0.092 |
| 6 | 312/2532 | 1.067 | 0.938 | 1.212 | 0.324 | |
| 7-8 | 985/8851 | 1 [Ref] | -- | -- | -- | |
| 9 | 103/972 | 0.980 | 0.800 | 1.201 | 0.846 | |
| ≥10 | 61/645 | 0.954 | 0.736 | 1.236 | 0.720 | |
| BMI (kg/m2) | ||||||
| < 25 | ≤5 | 9/165 | 2.034 | 0.968 | 4.274 | 0.061 |
| 6 | 16/472 | 1.521 | 0.846 | 2.732 | 0.161 | |
| 7-8 | 39/1732 | 1 [Ref] | -- | -- | -- | |
| 9 | 5/193 | 1.35 | 0.528 | 3.451 | 0.530 | |
| ≥10 | 2/144 | 0.697 | 0.168 | 2.893 | 0.619 | |
| 25 to < 30 | ≤5 | 35/382 | 1.159 | 0.811 | 1.657 | 0.418 |
| 6 | 69/892 | 1.041 | 0.795 | 1.363 | 0.772 | |
| 7-8 | 238/3313 | 1 [Ref] | -- | -- | -- | |
| 9 | 25/340 | 1.038 | 0.687 | 1.570 | 0.858 | |
| ≥10 | 12/196 | 1.002 | 0.558 | 1.800 | 0.994 | |
| ≥ 30 | ≤5 | 123/604 | 1.109 | 0.915 | 1.345 | 0.291 |
| 6 | 227/1168 | 1.052 | 0.905 | 1.223 | 0.510 | |
| 7-8 | 708/3806 | 1 [Ref] | -- | -- | -- | |
| 9 | 73/439 | 0.956 | 0.751 | 1.217 | 0.717 | |
| ≥10 | 47/305 | 0.956 | 0.711 | 1.286 | 0.767 | |
| Sex | ||||||
| Male | ≤5 | 30/278 | 1.041 | 0.706 | 1.536 | 0.839 |
| 6 | 48/605 | 0.822 | 0.597 | 1.131 | 0.229 | |
| 7-8 | 185/1887 | 1 [Ref] | -- | -- | -- | |
| 9 | 15/147 | 0.942 | 0.556 | 1.596 | 0.823 | |
| ≥10 | 14/78 | 1.970 | 1.133 | 3.424 | 0.016 | |
| Female | ≤5 | 137/873 | 1.174 | 0.978 | 1.409 | 0.086 |
| 6 | 264/1927 | 1.125 | 0.978 | 1.294 | 0.100 | |
| 7-8 | 800/6964 | 1 [Ref] | -- | -- | -- | |
| 9 | 88/825 | 0.987 | 0.791 | 1.230 | 0.904 | |
| ≥10 | 47/567 | 0.826 | 0.615 | 1.110 | 0.205 | |
Note. Adjusted model includes age, sex, education, marital status, birth country, BMI, acculturation, alcohol, smoking, and physical activity as covariates. HR = hazard ratio; CI = confidence interval.
Reference group is 7-8 hours. Bolded highlights statistically significant effects.
Results did not support the hypothesis that short sleep would be differentially related to T2D risk across age, sex, acculturation, or birth country (Table S2). However, results partially supported the hypothesis for BMI. In overall follow-up, the effect of short sleep on T2D risk did not differ across BMI, but censoring at different follow-up periods (3, 5, and >5 year follow-up) revealed significant effects (Table 3). Specifically, among those with BMI < 25 kg/m2 (underweight + normal weight), ≤ 5 hours of sleep, compared to 7-8 hours, was related to increased T2D risk at 3 year (HR = 4.131, p = .024) and 5 year (HR = 3.733, p = .008) follow-up. Among those with BMI 25 to < 30 kg/m2 (overweight), 6 hours of sleep, compared to 7-8 hours, was related to an increased risk of T2D at 3 year follow-up (HR = 1.827, p = .039). Among those with BMI < 30 kg/m2 (non-obese), ≤ 5 hours of sleep, compared to 7-8 hours, was related to an increased risk of T2D at 3 year (HR = 2.209, p = .016) and 5 year follow-up (HR = 1.689, p = .034); and 6 hours of sleep compared to 7-8 hours was related to an increased risk of T2D at 3 year follow-up (HR = 1.781, p = .028).
Table 3.
Sleep duration on type 2 diabetes risk across BMI at 3, 5, and >5 year follow up.
| Characteristic | Sleep (Hours)* | Adj. HR | 95% CI | p | |
|---|---|---|---|---|---|
| 3 Year Follow-Up | |||||
| BMI group (kg/m2) | |||||
| < 25 | ≤5 | 4.131 | 1.202 | 14.201 | 0.024 |
| 6 | 1.798 | 0.538 | 6.015 | 0.341 | |
| 7-8 | 1 [Ref] | -- | -- | -- | |
| 9 | 2.733 | 0.569 | 13.128 | 0.209 | |
| ≥10 | 0.000 | 0.000 | 0.000 | 0.993 | |
| 25 to < 30 | ≤5 | 1.709 | 0.789 | 3.703 | 0.174 |
| 6 | 1.827 | 1.031 | 3.237 | 0.039 | |
| 7-8 | 1 [Ref] | -- | -- | -- | |
| 9 | 1.757 | 0.737 | 4.188 | 0.204 | |
| ≥10 | 1.173 | 0.279 | 4.932 | 0.828 | |
| < 30 | ≤5 | 2.209 | 1.160 | 4.210 | 0.016 |
| 6 | 1.781 | 1.063 | 2.984 | 0.028 | |
| 7-8 | 1 [Ref] | -- | -- | -- | |
| 9 | 1.900 | 0.891 | 4.051 | 0.097 | |
| ≥10 | 0.819 | 0.197 | 3.400 | 0.784 | |
| ≥ 30 | ≤5 | 1.173 | 0.818 | 1.682 | 0.387 |
| 6 | 1.118 | 0.836 | 1.495 | 0.452 | |
| 7-8 | 1 [Ref] | -- | -- | -- | |
| 9 | 1.265 | 0.832 | 1.924 | 0.271 | |
| ≥10 | 0.892 | 0.496 | 1.602 | 0.701 | |
| 5 Year Follow-Up | |||||
| BMI group (kg/m2) | |||||
| < 25 | ≤5 | 3.733 | 1.413 | 9.867 | 0.008 |
| 6 | 1.434 | 0.554 | 3.710 | 0.458 | |
| 7-8 | 1 [ref] | -- | -- | -- | |
| 9 | 1.944 | 0.558 | 6.770 | 0.296 | |
| ≥10 | 0.909 | 0.120 | 6.891 | 0.927 | |
| 25 to < 30 | ≤5 | 1.302 | 0.736 | 2.303 | 0.364 |
| 6 | 1.194 | 0.775 | 1.839 | 0.421 | |
| 7-8 | 1 [ref] | -- | -- | -- | |
| 9 | 1.232 | 0.638 | 2.380 | 0.535 | |
| ≥10 | 1.186 | 0.477 | 2.954 | 0.713 | |
| < 30 | ≤5 | 1.689 | 1.040 | 2.744 | 0.034 |
| 6 | 1.220 | 0.824 | 1.806 | 0.321 | |
| 7-8 | 1 [Ref] | -- | -- | -- | |
| 9 | 1.341 | 0.750 | 2.395 | 0.322 | |
| ≥10 | 1.079 | 0.471 | 2.469 | 0.858 | |
| ≥ 30 | ≤5 | 1.119 | 0.839 | 1.491 | 0.444 |
| 6 | 1.033 | 0.819 | 1.303 | 0.782 | |
| 7-8 | 1 [ref] | -- | -- | -- | |
| 9 | 1.076 | 0.758 | 1.527 | 0.684 | |
| ≥10 | 0.870 | 0.547 | 1.385 | 0.558 | |
| >5 Year Follow-Up | |||||
| BMI group (kg/m2) | |||||
| < 25 | ≤5 | 2.034 | 0.968 | 4.274 | 0.061 |
| 6 | 1.521 | 0.846 | 2.732 | 0.161 | |
| 7-8 | 1 [Ref] | -- | -- | -- | |
| 9 | 1.350 | 0.528 | 3.451 | 0.530 | |
| ≥10 | 0.697 | 0.168 | 2.893 | 0.619 | |
| 25 to < 30 | ≤5 | 1.159 | 0.811 | 1.657 | 0.418 |
| 6 | 1.041 | 0.795 | 1.363 | 0.772 | |
| 7-8 | 1 [Ref] | -- | -- | -- | |
| 9 | 1.038 | 0.687 | 1.570 | 0.858 | |
| ≥10 | 1.002 | 0.558 | 1.800 | 0.994 | |
| < 30 | ≤5 | 1.331 | 0.966 | 1.835 | 0.080 |
| 6 | 1.089 | 0.853 | 1.391 | 0.492 | |
| 7-8 | 1 [Ref] | -- | -- | -- | |
| 9 | 1.073 | 0.736 | 1.565 | 0.715 | |
| ≥10 | 0.869 | 0.507 | 1.491 | 0.611 | |
| ≥ 30 | ≤5 | 1.109 | 0.915 | 1.345 | 0.291 |
| 6 | 1.052 | 0.905 | 1.223 | 0.510 | |
| 7-8 | 1 [Ref] | -- | -- | -- | |
| 9 | 0.956 | 0.751 | 1.217 | 0.717 | |
| ≥10 | 0.956 | 0.711 | 1.286 | 0.767 | |
Note. Models adjusted for age, sex, education, marital status, birth country, acculturation, alcohol, smoking, and physical activity. HR = hazard ratio; CI = confidence interval. Bolded highlights statistically significant effects.
Mediation results supported the hypothesis that the indirect effect of short sleep on T2D through obesity would be significant. Results from Cox proportional hazard models in Table 4 suggested that obesity accounted for a significant proportion of the variance in the association of ≤ 5 (31.6%) and 6 hours (27.3%) of sleep and increased T2D risk. Specifically, results showed that baseline short sleep (≤ 5 and 6 hours), compared to 7-8 hours, was related to greater likelihood of obesity, and obesity was related to a greater likelihood of T2D.
Table 4.
Total, direct, and indirect effects of baseline sleep duration on prospective type 2 diabetes risk through baseline obesity.
| Sleep Duration | Total effectТ | Obesity independent* | Obesity mediated* | Interaction | Proportion |
|---|---|---|---|---|---|
| Hours | HR [95% CI] | HR [95% CI] | HR [95% CI] | b (SE) | % |
| ≤ 5 | 1.274 [1.078, 1.507] | 1.188 [1.006, 1.402] | 1.073 [1.038, 1.109] | −0.217 (0.185)ns | 31.60 |
| 6 | 0.160 [0.964, 1.251] | 1.071 [0.942, 1.218] | 1.025 [1.002, 1.048] | −0.010 (0.142)ns | 27.30 |
| 7-8 (ref) | -- | -- | -- | -- | -- |
| 9 | 0.988 [0.812, 1.227] | 0.988 [0.806, 1.211] | 1.010 [.979, 1.043] | −0.081 (0.225)ns | -- |
| ≥ 10 | 0.952 [0.762, 1.290] | 0.954 [0.736, 1.237] | 1.039 [.993, 1.088] | 0.128 (0.310)ns | -- |
Note. Effect estimates represent the effect of sleep duration relative to 7-8 hours on type 2 diabetes including covariates with (“Total Effect”) and without (“Obesity independent”) obesity, and the indirect effect through obesity including covariates (“Obesity mediated”). Interaction = estimate for sleep duration X obesity predictor. Proportion = percent of variance explained by obesity status. HR = hazard ratio. CI = confidence interval. SE = standard error. NS = not significant at p < .05 level.
Adjusted for age, sex, education, marital status, birth country, acculturation, alcohol and smoking, and physical activity.
Adjusted for above including obesity.
Exploratory analyses.
Table S3 displays results examining the association of sleep duration on T2D across non-significant interactions with sociodemographic factors. There was a significant effect of ≤ 5 hours of sleep compared to 7-8 hours of sleep among those aged ≤ 36 years (HR = 1.371, p = .038), and English dominant or bilingual (HR = 1.342, p = .017). Further, 6 hours of sleep compared to 7-8 hours was related to increased T2D risk among those born in the US (HR = 1.336, p = .019). Lastly, ≥ 10 hours compared to 7-8 hours was related to increased T2D risk among males (HR = 1.970, p = .016). Exploratory mediation analyses testing physical activity as a mediator were not significant (Table S4).
Discussion
The current study is the largest prospective cohort study to examine the impact of self-reported sleep duration on T2D risk among Mexican American adults. Based on Cox proportional hazard models, the adjusted estimate of sleep duration on T2D risk was not significant. However, results revealed selective effects across multiple demographic characteristics and different follow-up periods. Further, mediation analyses suggested that baseline BMI significantly mediated the association between ≤ 5 hours of sleep and T2D risk.
The health profile of the sample suggested a population at-risk for chronic health conditions. While most of the sample reported sufficient sleep (73.6%) similar to Hispanic adults nationally (68.6%),54 many reported not meeting physical activity guidelines (78.9%) and had BMI within the obesity range (47.6%). The elevated rates of physical inactivity and obesity likely contribute to the high rates of T2D at follow-up (10.3%).
Consistent with our hypotheses, sleep duration was related to future T2D risk and baseline BMI mediated this relationship. First, the modest unadjusted effect observed in our study for ≤ 5 hours of sleep was similar to adjusted pooled estimates in previous meta-analyses,16,17,48,50 and consistent with epidemiological studies29-35 demonstrating that the addition of BMI removed the significant effect of sleep duration. Thus, highlighting the important link between sleep duration, obesity, and T2D risk.
Second, results from mediation models supported theories highlighting excessive weight as an explanatory factor linking short sleep and T2D risk.23,26,28 Specifically, baseline short sleep duration (≤ 5 and 6 hours compared to 7-8 hours) was related to increased baseline obesity risk, which was related to increased T2D risk. Notably, baseline obesity explained 31.6% and 27.3% of the variance in the effect of ≤ 5 and 6 hours of sleep on T2D risk, respectively. Because obesity is a major risk factor for dysregulated glycemic control and a host of comorbid health conditions, it is likely that an accumulation of multiple risk factors combine to impact T2D risk. Indeed, short sleep is linked to greater insulin resistance55-57 and lower inhibitory responses to foods high in fat and carbohydrate content.58 Chronic short sleep may increase unhealthy food intake thereby increasing risk for T2D. It is also possible that short sleep may increase T2D risk by interfering with pre-T2D management. Although this remains to be studied among adults, a recent study showed that shorter sleep duration was related to less engagement in T2D management behavior in youth with type 1 diabetes.59 Chronic short sleep may increase forgetfulness to engage in glucose monitoring and decrease motivation to engage in self-regulatory behavior. While our study did not find physical activity as a significant mediator explaining the sleep duration and T2D relationship, this is an area deserving greater attention given the putative links between insufficient sleep and sedentary behavior.60
A notable finding was that reporting ≤ 5 hours of sleep at baseline was related to a 4.1 and 3.7 times increase in T2D risk among normal and underweight individuals at the 3 and > 5 year follow-up, respectively. These results suggest that sleep duration may be a stronger predictor of T2D at shorter follow-up durations and among non-obese individuals. First, it is possible that sleep duration is a better proximal rather than distal predictor of T2D risk. One study found that T2D risk was greater among those who slept ≤ 7 hours per night, compared to ≥ 8 hours, at the 6 year follow-up, yet this effect was not observed at the 11-year follow-up.61 A meta-analysis also found a non-significant effect of sleep duration on T2D risk among studies with > 10 year follow-up.16 It is possible that the predictive ability of sleep duration for T2D decreases with additional follow-up time due to changes in health conditions or health behaviors. Thus, insufficient sleep may be useful for early T2D detection among individuals without obesity. Indeed, a recent study in China found that short sleep improved the predictive ability of a T2D risk factor score,62 highlighting the promise of considering short sleep as a screening factor.
Second, sleep duration may be a better predictor of future T2D among specific BMI ranges. In particular, we found that individuals with BMI < 25 who reported ≤ 5 hours of sleep per night were at the highest risk for T2D at short-term follow-up. These results are consistent with studies of other health behaviors and outcomes showing that short sleep was related to greater hypertension risk among individuals with normal and obese BMI only,38 modestly stronger association between sleep duration and self-rated health among individuals without obesity,63 and improving diet and exercise may prevent more cases of T2D among women with normal body weight.64 Another study found a significant effect of sleep duration on T2D risk among those with BMI < 26.1, but not those with BMI ≥ 26.1 although the sleep and BMI interaction was not significant.36
Our results theoretically replicate and extend previous research by highlighting the dual role of BMI as a moderator and mediator in the sleep duration and T2D risk association. In addition to supporting the exposure model largely focused by previous research (i.e., BMI as a mediator),29-35 results also supported the reactivity model (i.e., BMI as a moderator) contrary to international studies.36,37 It is possible that as the cumulative effects of short sleep increase weight gain and prospective T2D risk, the hazards of short sleep diminish over time as other health conditions arise. Thus, for those without obesity, short sleep may be a particularly strong risk factor given the greater potential for weight gain and development of problematic health conditions.
Inconsistent with our hypotheses, demographic characteristics largely did not modify the effect of short sleep on T2D risk. Although there were no significant sleep by acculturation or birth country interactions, exploration of stratified effects showed a pattern of results suggesting that insufficient sleep may be particularly deleterious for more acculturated Mexican American adults. Immigration scholars find that among Hispanic adults residing in the US, health and health behaviors deteriorate with subsequent generations—a phenomenon known as the immigrant paradox.65 Thus, it is possible that there may be fewer protective factors such as healthy eating to buffer the deleterious effects of insufficient sleep among Hispanic adults. However, results stratified by acculturation must be interpreted with caution given the non-significant interactions. Future research should further explore and empirically test these assertions. Lastly, stratified analyses did not reveal sex differences in the effect of short sleep duration and T2D risk, which is consistent with previous studies among women34,41,47 and men only.30
The study results are interpreted within the context of the following limitations. First, only one aspect of sleep was examined, namely, sleep duration. Recent studies suggest that later bedtimes predict greater insulin resistance,44 and frequent night awakenings predict increased T2D risk41 among Hispanic adults. Further, a Finnish study found that poor sleep quality, rather than short sleep, was related to increased risk of cardiovascular disease.66 Thus, future large-scale cohort studies with Mexican American adults should consider including objective measures of sleep such as those obtained using electronic wearables that track sleep, in addition to measuring subjective reports of sleep quality, bed times, and chronotype. Second, the results did not consider other important prospective risk factors for T2D. For example, we did not include socioeconomic status in our models due to the low response rate in the sample (60% of participants had available income data). We also did not have data on pre-diabetic status or dieting behavior at baseline. Third, data were self-reported and vulnerable to recall biases. Although we cross-validated T2D diagnosis with medical records, participants may not have accurately reported the date of diagnosis. Further, sleep duration and physical activity were measured at a low temporal resolution (i.e., within the past year). Future research should consider using objective measures of sleep duration and physical activity via actigraphy. Fourth, we were unable to test change in BMI as a mediator due to substantial missing data at follow-up (41% without weight data). Thus, future prospective studies should consider the role of weight change in the sleep and T2D risk link. Fifth, sleep duration and BMI were measured at the same time point precluding us from disentangling longitudinal relationships between sleep duration and BMI. Consequently, in such a model described as a “half-longitudinal” design,67 inability to control for prior levels of X and M can bias estimates of the X → M relationship and the indirect effects. Further, while statistical justifications allow for the dual role of BMI as both a mediator and moderator,68 our models must be interpreted with caution as lack of temporal precedence limits our ability to determine the true direction and nature of the relationships between sleep duration, BMI, and T2D risk. While the timing of the sleep and BMI measures were concurrent, the timing of the constructs were past year sleep and BMI at the day of assessment. Further, substantial theory23,26,28 guided the hypothesized mediation model. Lastly, we did not have data related to fatigue. Fatigue is prevalent among individuals with T2D69 and linked to sleep disturbances.70 Thus, it is possible chronic short sleep, fatigue, and T2D may demonstrate a feedback loop that can undermine treatment efforts. However, additional future research is needed to disentangle these relationships.
Conclusions
In summary, selective effects of sleep duration on T2D risk were identified, and the results highlighted the potential mediating and moderating effects of BMI. Our findings suggest that T2D prevention and control should consider the important role of insufficient sleep among non-obese Mexican American adults. Health practitioners and researchers should consider Hispanic-focused explanatory models of T2D which highlight the role of self-care with regards to being physically active, obtaining sufficient sleep, and eating a healthy diet as behaviors that help manage and decrease risk for T2D.71,72
Supplementary Material
Acknowledgments
We thank Dr. Gary Deyter for editing the manuscript, Dr. Kristen Knutson for reviewing early drafts of the manuscript, and Dr. Kplola Y. Elhor Gbito for assisting with data analysis for the revision.
Ivan H.C. Wu, Ph.D. and the research activities were supported in part, by the Cancer Prevention and Research Institute of Texas (CPRIT) award ID RP170259, Shine Chang, Ph.D. and Sanjay Shete, Ph.D., Principal Investigators), the MD Anderson's Cancer Center Support Grant (CA016672, Ron DePinho, M.D., Principal Investigator) funded by the National Cancer Institute, and the UHAND Partnership funded by the National Cancer Institute (P20CA221696 and P20CA221697).
The Mexican American Cohort receives funds collected pursuant to the Comprehensive Tobacco Settlement of 1998 and appropriated by the 76th legislature to The University of Texas MD Anderson Cancer Center, also, from the Caroline W. Law Fund for Cancer Prevention, and the Dan Duncan Family Institute for Risk Assessment and Cancer Prevention. Its content are solely the responsibility of the authors and do not necessarily represent the official views of the project supporters.
This study would not have been possible without the generous support and cooperation of the Mexican American Cohort Study participants; nor without the dedication of the Mexican American Cohort Study team.
No financial disclosures were reported by the authors of this paper.
Footnotes
Disclosures: There are no financial disclosures from any authors. The views expressed in the submitted article are his or her own and not an official position of the institution or funder.
Publisher's Disclaimer: This is a PDF file of an unedited manuscript that has been accepted for publication. As a service to our customers we are providing this early version of the manuscript. The manuscript will undergo copyediting, typesetting, and review of the resulting proof before it is published in its final form. Please note that during the production process errors may be discovered which could affect the content, and all legal disclaimers that apply to the journal pertain.
References
- 1.Magliano DJ, Islam RM, Barr EL, et al. Trends in incidence of total or type 2 diabetes: systematic review. BMJ. 2019;366:15003. [DOI] [PMC free article] [PubMed] [Google Scholar]
- 2.Geiss LS, Wang J, Cheng YJ, et al. Prevalence and incidence trends for diagnosed diabetes among adults aged 20 to 79 years, United States, 1980-2012. JAMA. 2014;312(12):1218–1226. [DOI] [PubMed] [Google Scholar]
- 3.Bullard KM, Cowie CC, Lessem SE, et al. Prevalence of diagnosed diabetes in adults by diabetes type—United States, 2016. Morbidity and Mortality Weekly Report. 2018;67(12):359. [DOI] [PMC free article] [PubMed] [Google Scholar]
- 4.Shah AD, Langenberg C, Rapsomaniki E, et al. Type 2 diabetes and incidence of cardiovascular diseases: a cohort study in 1· 9 million people. The lancet Diabetes & endocrinology. 2015;3(2):105–113. [DOI] [PMC free article] [PubMed] [Google Scholar]
- 5.Tsilidis KK, Kasimis JC, Lopez DS, Ntzani EE, Ioannidis JP. Type 2 diabetes and cancer: umbrella review of meta-analyses of observational studies. BMJ. 2015;350:g7607. [DOI] [PubMed] [Google Scholar]
- 6.Smyth S, Heron A. Diabetes and obesity: the twin epidemics. Nat Med. 2006;12(1):75–80. [DOI] [PubMed] [Google Scholar]
- 7.Caro JJ, Ward AJ, O’Brien JA. Lifetime costs of complications resulting from type 2 diabetes in the US. Diabetes Care. 2002;25(3):476–481. [DOI] [PubMed] [Google Scholar]
- 8.Ogden CL, Carroll MD, Fryar CD, Flegal KM. Prevalence of obesity among adults and youth: United States, 2011–2014. NCHS data brief. 2015;219(219):1–8. [PubMed] [Google Scholar]
- 9.Centers for Disease Control & Prevention. National diabetes statistics report, 2017. Atlanta, GA: Centers for Disease Control and Prevention. 2017. [Google Scholar]
- 10.Hu FB, Manson JE, Stampfer MJ, et al. Diet, lifestyle, and the risk of type 2 diabetes mellitus in women. N Engl J Med. 2001;345(11):790–797. [DOI] [PubMed] [Google Scholar]
- 11.Hardoon SL, Morris RW, Thomas MC, Wannamethee SG, Lennon LT, Whincup PH. Is the recent rise in type 2 diabetes incidence from 1984 to 2007 explained by the trend in increasing BMI?: evidence from a prospective study of British men. Diabetes Care. 2010;33(7):1494–1496. [DOI] [PMC free article] [PubMed] [Google Scholar]
- 12.Eckel RH, Kahn SE, Ferrannini E, et al. Obesity and type 2 diabetes: what can be unified and what needs to be individualized? The Journal of Clinical Endocrinology & Metabolism. 2011;96(6): 1654–1663. [DOI] [PMC free article] [PubMed] [Google Scholar]
- 13.Kahn SE, Hull RL, Utzschneider KM. Mechanisms linking obesity to insulin resistance and type 2 diabetes. Nature. 2006;444(7121):840. [DOI] [PubMed] [Google Scholar]
- 14.Luyster FS, Strollo PJ, Zee PC, Walsh JK. Sleep: a health imperative. Sleep. 2012;35(6):727–734. [DOI] [PMC free article] [PubMed] [Google Scholar]
- 15.Perry GS, Patil SP, Presley-Cantrell LR. Raising awareness of sleep as a healthy behavior. Prev Chronic Dis. 2013;10. [DOI] [PMC free article] [PubMed] [Google Scholar]
- 16.Cappuccio FP, D'Elia L, Strazzullo P, Miller MA. Quantity and quality of sleep and incidence of type 2 diabetes: a systematic review and meta-analysis. Diabetes Care. 2010;33(2):414–420. [DOI] [PMC free article] [PubMed] [Google Scholar]
- 17.Anothaisintawee T, Reutrakul S, Van Cauter E, Thakkinstian A. Sleep disturbances compared to traditional risk factors for diabetes development: Systematic review and meta-analysis. Sleep Med Rev. 2016;30:11–24. [DOI] [PubMed] [Google Scholar]
- 18.Consensus Conference P. Recommended Amount of Sleep for a Healthy Adult: A Joint Consensus Statement of the American Academy of Sleep Medicine and Sleep Research Society. Sleep. 2015;38(6):843–844. [DOI] [PMC free article] [PubMed] [Google Scholar]
- 19.Nielsen L, Danielsen K, Sørensen T. Short sleep duration as a possible cause of obesity: critical analysis of the epidemiological evidence. Obes Rev. 2011;12(2):78–92. [DOI] [PubMed] [Google Scholar]
- 20.Buxton OM, Marcelli E. Short and long sleep are positively associated with obesity, diabetes, hypertension, and cardiovascular disease among adults in the United States. Soc Sci Med. 2010;71(5): 1027–1036. [DOI] [PubMed] [Google Scholar]
- 21.Wu Y, Zhai L, Zhang D. Sleep duration and obesity among adults: a meta-analysis of prospective studies. Sleep Med. 2014;15(12):1456–1462. [DOI] [PubMed] [Google Scholar]
- 22.Jean-Louis G, Williams NJ, Sarpong D, et al. Associations between inadequate sleep and obesity in the US adult population: analysis of the national health interview survey (1977–2009). BMC Public Health. 2014;14(1):290. [DOI] [PMC free article] [PubMed] [Google Scholar]
- 23.Schmidt MH. The energy allocation function of sleep: A unifying theory of sleep, torpor, and continuous wakefulness. Neurosci Biobehav Rev. 2014;47:122–153. [DOI] [PubMed] [Google Scholar]
- 24.Van Cauter E, Holmback U, Knutson K, et al. Impact of sleep and sleep loss on neuroendocrine and metabolic function. Horm Res. 2007;67Suppl 1:2–9. [DOI] [PubMed] [Google Scholar]
- 25.Knutson KL, Spiegel K, Penev P, Van Cauter E. The metabolic consequences of sleep deprivation. Sleep Med Rev. 2007;11(3):163–178. [DOI] [PMC free article] [PubMed] [Google Scholar]
- 26.Spiegel K, Knutson K, Leproult R, Tasali E, Van Cauter E. Sleep loss: a novel risk factor for insulin resistance and Type 2 diabetes. Journal of applied physiology (Bethesda, Md : 1985). 2005;99(5):2008–2019. [DOI] [PubMed] [Google Scholar]
- 27.Bolger N, Zuckerman A. A framework for studying personality in the stress process. J Pers Soc Psychol. 1995;69(5):890–902. [DOI] [PubMed] [Google Scholar]
- 28.Chaput JP, Tremblay A. The glucostatic theory of appetite control and the risk of obesity and diabetes. Int J Obes. 2009;33:46+. [DOI] [PubMed] [Google Scholar]
- 29.Beihl DA, Liese AD, Haffner SM. Sleep duration as a risk factor for incident type 2 diabetes in a multiethnic cohort. Ann Epidemiol. 2009;19(5):351–357. [DOI] [PubMed] [Google Scholar]
- 30.Yaggi HK, Araujo AB, McKinlay JB. Sleep Duration as a Risk Factor for the Development of Type 2 Diabetes. Diabetes Care. 2006;29(3):657–661. [DOI] [PubMed] [Google Scholar]
- 31.Piccolo RS, Yang M, Bliwise DL, Yaggi HK, Araujo AB. Racial and socioeconomic disparities in sleep and chronic disease: results of a longitudinal investigation. Ethn Dis. 2013;23(4):499–507. [PMC free article] [PubMed] [Google Scholar]
- 32.Gangwisch JE, Heymsfield SB, Boden-Albala B, et al. Sleep duration as a risk factor for diabetes incidence in a large U.S. sample. Sleep. 2007;30(12):1667–1673. [DOI] [PMC free article] [PubMed] [Google Scholar]
- 33.Xu Q, Song Y, Hollenbeck A, Blair A, Schatzkin A, Chen H. Day napping and short night sleeping are associated with higher risk of diabetes in older adults. Diabetes Care. 2010;33(1):78–83. [DOI] [PMC free article] [PubMed] [Google Scholar]
- 34.Ayas NT, White DP, Al-Delaimy WK, et al. A prospective study of self-reported sleep duration and incident diabetes in women. Diabetes Care. 2003;26(2):380–384. [DOI] [PubMed] [Google Scholar]
- 35.Zizi F, Pandey A, Murrray-Bachmann R, et al. Race/ethnicity, sleep duration, and diabetes mellitus: analysis of the National Health Interview Survey. The American journal of medicine. 2012; 125(2): 162–167. [DOI] [PMC free article] [PubMed] [Google Scholar]
- 36.Leng Y, Cappuccio FP, Surtees PG, Luben R, Brayne C, Khaw KT. Daytime napping, sleep duration and increased 8-year risk of type 2 diabetes in a British population. Nutrition, Metabolism and Cardiovascular Diseases. 2016;26(11):996–1003. [DOI] [PMC free article] [PubMed] [Google Scholar]
- 37.Ohkuma T, Fujii H, Iwase M, et al. Impact of sleep duration on obesity and the glycemic level in patients with type 2 diabetes: the Fukuoka Diabetes Registry. Diabetes Care. 2013;36(3):611–617. [DOI] [PMC free article] [PubMed] [Google Scholar]
- 38.Okunowo O, Orimoloye HT, Bakre SA, Njesada NS, Solomon A. Age- and body weight-dependent association between sleep duration and hypertension in US adults: findings from the 2014-2017 National Health Interview Survey. Sleep health. 2019;5(5):509–513. [DOI] [PubMed] [Google Scholar]
- 39.Beihl DA, Liese AD, Haffner SM. Sleep duration as a risk factor for incident type 2 diabetes in a multiethnic cohort. Ann Epidemiol. 2009;19(5):351–357. [DOI] [PubMed] [Google Scholar]
- 40.Patel SR, Sotres-Alvarez D, Castaneda SF, et al. Social and Health Correlates of Sleep Duration in a US Hispanic Population: Results from the Hispanic Community Health Study/Study of Latinos. Sleep. 2015;38(10): 1515–1522. [DOI] [PMC free article] [PubMed] [Google Scholar]
- 41.McWhorter KL, Park Y-M, Gaston SA, Fang KB, Sandler DP, Jackson CL. Multiple sleep dimensions and type 2 diabetes risk among women in the Sister Study: differences by race/ethnicity. BMJ Open Diabetes Research & Care. 2019;7(1):e000652. [DOI] [PMC free article] [PubMed] [Google Scholar]
- 42.Knutson KL. Association between sleep duration and body size differs among three Hispanic groups. Am J Hum Biol. 2011;23(1):138–141. [DOI] [PubMed] [Google Scholar]
- 43.Schneiderman N, Llabre M, Cowie CC, et al. Prevalence of diabetes among Hispanics/Latinos from diverse backgrounds: the Hispanic community health study/study of Latinos (HCHS/SOL). Diabetes Care. 2014;37(8):2233–2239. [DOI] [PMC free article] [PubMed] [Google Scholar]
- 44.Knutson KL, Wu D, Patel SR, et al. Association Between Sleep Timing, Obesity, Diabetes: The Hispanic Community Health Study/Study of Latinos (HCHS/SOL) Cohort Study. Sleep. 2017;40(4). [DOI] [PMC free article] [PubMed] [Google Scholar]
- 45.Seicean S, Neuhauser D, Strohl K, Redline S. An exploration of differences in sleep characteristics between Mexico-born US immigrants and other Americans to address the Hispanic Paradox. Sleep. 2011;34(8): 1021–1031. [DOI] [PMC free article] [PubMed] [Google Scholar]
- 46.Hale L, Troxel WM, Kravitz HM, Hall MH, Matthews KA. Acculturation and sleep among a multiethnic sample of women: the Study of Women's Health Across the Nation (SWAN). Sleep. 2014;37(2):309–317. [DOI] [PMC free article] [PubMed] [Google Scholar]
- 47.Bjorkelund C, Bondyr-Carlsson D, Lapidus L, et al. Sleep disturbances in midlife unrelated to 32-year diabetes incidence: the prospective population study of women in Gothenburg. Diabetes Care. 2005;28(11):2739–2744. [DOI] [PubMed] [Google Scholar]
- 48.Itani O, Jike M, Watanabe N, Kaneita Y. Short sleep duration and health outcomes: a systematic review, meta-analysis, and meta-regression. Sleep Med. 2017;32:246–256. [DOI] [PubMed] [Google Scholar]
- 49.Chow WH, Chrisman M, Daniel CR, et al. Cohort Profile: The Mexican American Mano a Mano Cohort. Int J Epidemiol. 2017;46(2):e3. [DOI] [PMC free article] [PubMed] [Google Scholar]
- 50.Shan Z, Ma H, Xie M, et al. Sleep duration and risk of type 2 diabetes: a meta-analysis of prospective studies. Diabetes Care. 2015;38(3):529–537. [DOI] [PubMed] [Google Scholar]
- 51.Marin G, Gamba RJ. A New Measurement of Acculturation for Hispanics: The Bidimensional Acculturation Scale for Hispanics (BAS). Hispanic Journal of Behavioral Sciences. 1996;18(3):297–316. [Google Scholar]
- 52.Mai PL, Sullivan-Halley J, Ursin G, et al. Physical Activity and Colon Cancer Risk among Women in the California Teachers Study. Cancer Epidemiology Biomarkers & Prevention. 2007;16(3):517–525. [DOI] [PubMed] [Google Scholar]
- 53.Valeri L, VanderWeele TJ. Mediation analysis allowing for exposure–mediator interactions and causal interpretation: Theoretical assumptions and implementation with SAS and SPSS macros. Psychol Methods. 2013;18(2):137–150. [DOI] [PMC free article] [PubMed] [Google Scholar]
- 54.Department of Health and Human Services. Healthy People 2020. https://www.healthypeople.gov/2020/data/disparities/detail/Chart/5261/3/2016.
- 55.Tasali E, Leproult R, Spiegel K. Reduced sleep duration or quality: relationships with insulin resistance and type 2 diabetes. Prog Cardiovasc Dis. 2009;51(5):381–391. [DOI] [PubMed] [Google Scholar]
- 56.Lee SWH, Ng KY, Chin WK. The impact of sleep amount and sleep quality on glycemic control in type 2 diabetes: A systematic review and meta-analysis. Sleep Med Rev. 2017;31:91–101. [DOI] [PubMed] [Google Scholar]
- 57.van Dijk D, Balkau B, Segrestin B, et al. Associations between sleep duration and sleep debt with insulin sensitivity and insulin secretion in the EGIR-RISC Study. Diabetes Metab. 2019;45(4):375–381. [DOI] [PubMed] [Google Scholar]
- 58.St-Onge MP, Roberts AL, Chen J, et al. Short sleep duration increases energy intakes but does not change energy expenditure in normal-weight individuals. Am J Clin Nutr. 2011;94(2):410–416. [DOI] [PMC free article] [PubMed] [Google Scholar]
- 59.Frye SS, Perfect MM, Silva GE. Diabetes management mediates the association between sleep duration and glycemic control in youth with type 1 diabetes mellitus. Sleep Med. 2019;60:132–138. [DOI] [PubMed] [Google Scholar]
- 60.Liao Y, Robertson MC, Winne A, et al. Investigating the within-person relationships between activity levels and sleep duration using Fitbit data. Transl Behav Med. 2020. [DOI] [PMC free article] [PubMed] [Google Scholar]
- 61.Gutiérrez-Repiso C, Soriguer F, Rubio-Martín E, et al. Night-time sleep duration and the incidence of obesity and type 2 diabetes. Findings from the prospective Pizarra study. Sleep Med. 2014; 15(11): 1398–1404. [DOI] [PubMed] [Google Scholar]
- 62.Liu X, Li Z, Zhang J, et al. A novel risk score for type 2 diabetes containing sleep duration: a 7-year prospective cohort study among chinese participants. J Diabetes Res 2020; 2969105. 10.1155/2020/2969105. [DOI] [PMC free article] [PubMed] [Google Scholar]
- 63.Shankar A, Charumathi S, Kalidindi S. Sleep Duration and Self-Rated Health: the National Health Interview Survey 2008. Sleep. 2011;34(9):1173–1177. [DOI] [PMC free article] [PubMed] [Google Scholar]
- 64.Hu FB, Manson JE, Stampfer MJ, et al. Diet, lifestyle, and the risk of type 2 diabetes mellitus in women. N Engl J Med. 2001;345(11):790–797. [DOI] [PubMed] [Google Scholar]
- 65.Alarcón RD, Parekh A, Wainberg ML, Duarte CS, Araya R, Oquendo MA. Hispanic immigrants in the USA: social and mental health perspectives. The Lancet Psychiatry. 2016;3(9):860–870. [DOI] [PubMed] [Google Scholar]
- 66.Clark AJ, Salo P, Lange T, et al. Onset of impaired sleep as a predictor of change in health-related behaviours; analysing observational data as a series of non-randomized pseudo-trials. Int J Epidemiol. 2015;44(3):1027–1037. [DOI] [PubMed] [Google Scholar]
- 67.Cole DA, Maxwell SE. Testing Mediational Models With Longitudinal Data: Questions and Tips in the Use of Structural Equation Modeling. J Abnorm Psychol. 2003;112(4):558–577. [DOI] [PubMed] [Google Scholar]
- 68.James LR, Brett JM. Mediators, moderators, and tests for mediation. J Appl Psychol. 1984;69(2):307–321. [Google Scholar]
- 69.Kalra S, Sahay R. Diabetes Fatigue Syndrome. Diabetes Ther. 2018;9(4):1421–1429. [DOI] [PMC free article] [PubMed] [Google Scholar]
- 70.Roscoe JA, Kaufman ME, Matteson-Rusby SE, et al. Cancer-related fatigue and sleep disorders. Oncologist. 2007;12Suppl 1:35–42. [DOI] [PubMed] [Google Scholar]
- 71.Hatcher E, Whittemore R. Hispanic adults’ beliefs about type 2 diabetes: Clinical implications. J Am Acad Nurse Pract. 2007;19(10):536–545. [DOI] [PubMed] [Google Scholar]
- 72.Jezewski MA, Poss J. Mexican Americans’ Explanatory Model of Type 2 Diabetes. West J Nurs Res. 2002;24(8):840–858. [DOI] [PubMed] [Google Scholar]
Associated Data
This section collects any data citations, data availability statements, or supplementary materials included in this article.