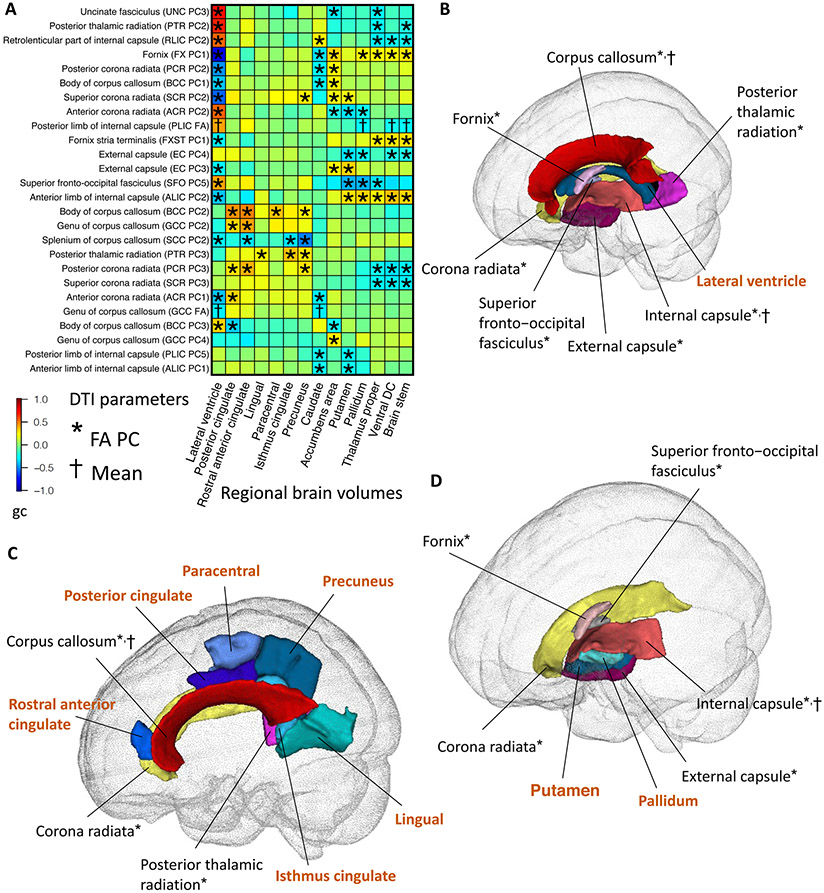
Fig. 5. Selected pairwise genetic correlations between fractional anisotropy (FA) of white matter tracts and regional brain volumes.
(A) The asterisks (for FA PCs) and daggers (for mean parameters) highlight significant genetic correlations after Bonferroni adjustment for multiple testing. The y-axis lists the DTI parameters of white matter tracts and the x-axis provides the name of regional brain volumes. The colors represent genetic correlations (gc). PC, principal component of FA. (B) Location of the lateral ventricle region and its neighboring white matter tracts whose FA parameters were genetically correlated with the volume of lateral ventricle. The colors describe different brain regions (names highlighted in brown color) and white matter tracts. (C) Location of the cortex regions and their neighboring white matter tracts whose FA parameters were genetically correlated with the volume of these regions. (D) Location of the putamen and pallidum regions and their neighboring white matter tracts whose FA parameters were genetically correlated with the volume of these regions.

