Abstract
Background
Laminin alpha 4 (LAMA4) is widely distributed in the basement membranes of various tissues. It can regulate cancer cell proliferation and migration. We investigated the effects of LAMA4 in gastric cancer (GC).
Methods
LAMA4 expression patterns were analyzed in GC using the Gene Expression Omnibus (GEO), Gene Expression Profiling Interactive Analysis (GEPIA), and UALCAN. Correlations between LAMA4 expression and clinicopathological characteristics were evaluated using data from The Cancer Genome Atlas (TCGA). The survival analysis was examined using the Kaplan-Meier plotter and GEPIA and ascertained by multivariate Cox analysis. Genetic alterations and DNA methylation of LAMA4 were analyzed using cBioPortal and MethSurv. LinkedOmics was applied to identify coexpressed genes of LAMA4. The association between LAMA4 and infiltration of immune cells was explored using Tumor Immune Estimation Resource (TIMER) and GEPIA.
Results
LAMA4 was highly expressed in GC, and its upregulation significantly correlated with T classification (P = 0.040). LAMA4 expression was an independent risk factor for overall survival (OS, P = 0.033). Patients with genetic alterations of LAMA4 showed a significantly better disease-free survival (DFS, P = 0.022). Ten CpG sites of LAMA4 were significantly associated with prognosis in GC. The functions of LAMA4 and coexpression genes were mainly involved in extracellular matrix (ECM) receptor interaction. LAMA4 expression significantly correlated with infiltration of macrophages (P < 0.001), CD4+ T cells (P < 0.001), and dendritic cells (P < 0.001). Furthermore, LAMA4 expression was significantly associated with markers of M2 and tumor-associated macrophages (TAMs).
Conclusion
LAMA4 expression was linked to GC prognosis and immune cell infiltration, indicating its potential use as a prognostic biomarker and therapeutic target.
1. Introduction
Gastric cancer (GC) is one of the most aggressive and deadliest types of cancers. The relatively late detection and high recurrence potential of GC contribute to its high mortality rate. The development of targeted therapy and immunotherapy facilitated individualized treatment and improved prognosis for GC patients [1]. However, existing treatment results remain disappointing due to the heterogeneity of tumors. Little is known about the carcinogenic and host factors that drive tumor progression or induce drug resistance. Therefore, identification of effective diagnostic and prognostic factors could be instrumental in improving current therapy strategies for GC patients, thus extending survival.
Laminin alpha 4 (LAMA4), a component of the laminin family, is mainly distributed in endothelial and some epithelial basement membranes [2]. It plays a significant role in mediating cell adhesion and migration, as well as organizing cells into tissues during embryonic development by interacting with other extracellular matrix (ECM) components [3]. Over recent decades, the effects of LAMA4 on cancers have attracted wide attention. LAMA4 was shown to be specifically upregulated in hepatocellular carcinoma and was significantly correlated with tumor invasion and metastasis [4]. LAMA4 expression was found to be increased in breast cancer cells and associated with cancer initiation and progression [5]. High expression levels of LAMA4 were also shown to predict poor survival in renal cell carcinoma [6]. On the contrary, LAMA4 was markedly downregulated in ovarian cancer, and overexpression of LAMA4 significantly impaired ovarian cancer cell proliferation, invasion, and migration [7]. In GC, LAMA4 was reported to be associated with enhanced cisplatin resistance and poor overall survival (OS) [8, 9]. However, the mechanisms and functions of LAMA4 are not fully understood in GC.
The present study analyzed the expression levels of LAMA4 in GC using data available in public databases. The associations between LAMA4 expression and clinicopathologic features and OS were evaluated. The molecular changes of LAMA4, including genetic alterations and DNA methylation, and their impacts on survival were explored. Coexpression genes that may be involved in GC progression were screened using LinkedOmics analysis. Finally, the relationship between LAMA4 expression and tumor immune infiltration was investigated. Our results provide evidence for the role of LAMA4 in GC carcinogenesis and prognosis and may help to identify a potential biomarker for GC prognosis and therapy.
2. Materials and Methods
2.1. Data Acquisition
The four gene expression profiles GSE13911, GSE54129, GSE79973, and GSE19826 were obtained from the Gene Expression Omnibus (GEO). GSE13911 contained 38 GC tumor samples and 31 normal gastric samples. GSE54129 contained 111 GC tumor samples and 21 normal gastric samples. GSE79973 contained 10 paired GC and adjacent normal gastric samples. GSE19826 contained 12 paired GC and adjacent normal gastric samples. The raw data were normalized using the affy package in R language [10]. The clinicopathological and survival data of GC from The Cancer Genome Atlas (TCGA) were downloaded using the UCSC Xena browser [11].
2.2. Expression and Survival Analysis
The expression differences from two groups included in each of the four profiles from GEO were displayed in plots through GraphPad Prism 8. The expression levels of LAMA4 between GC and normal gastric tissues in TCGA were analyzed in the Gene Expression Profiling Interactive Analysis (GEPIA) and UALCAN databases [12, 13]. The Kaplan-Meier plotter and GEPIA database were used to compare the survival differences between high and low LAMA4 expression groups in GC.
2.3. Genetic Alterations and DNA Methylation Analysis
The cBioPortal database was applied to analyze the genetic alterations of LAMA4 in GC [14]. A MethSurv web tool was applied to analyze the DNA methylation data of LAMA4 and evaluate the prognostic value of each CpG site in GC [15].
2.4. Coexpression Genes of LAMA4
The genes coexpressed with LAMA4 in GC were screened using the LinkFinder module of the LinkedOmics database [16]. The results were displayed in the form of volcano and heat plots. Through Gene Set Enrichment Analysis (GSEA) of the LinkInterpreter module, Gene Ontology (biological process) and Kyoto Encyclopedia of Genes and Genomes (KEGG) pathways were identified. GEPIA was applied to plot survival heatmaps of the top 50 coexpression genes.
2.5. Immune Infiltrate Correlation Analysis
Associations between LAMA4 expression and six infiltrating immune cells (B cells, CD4+ T cells, CD8+ T cells, neutrophils, macrophages, and dendritic cells) were explored using the Tumor Immune Estimation Resource (TIMER) platform [17]. The purity-corrected partial Spearman's correlation (partial-cor) and P value were displayed in scatter plots. Multivariate Cox analysis was used to evaluate the effect of LAMA4 and immune cells on survival. Moreover, the associations between LAMA4 expression and gene markers of tumor-associated macrophages (TAMs) and M1 and M2 macrophages were analyzed in TIMER and GEPIA. The gene markers were obtained from related references [18–22].
2.6. Statistics
SPSS 25.0 was used for statistical analyses. An independent sample t-test and a paired sample t-test were used to compare the differential expression levels of LAMA4 between the GC tissues and nontumor tissues. The Pearson chi-squared test was used to assess the association between LAMA4 expression and clinicopathological variables. Univariate and multivariate Cox proportional hazards regression models were used to calculate the hazard ratio (HR), 95% confidence interval (CI), and the correlation between LAMA4 expression level and OS. P < 0.05 was considered statistically significant.
3. Results
3.1. LAMA4 Expression Levels in GC
LAMA4 expression levels were assessed in GC tissues and normal gastric tissues from four GEO dataset profiles. Unpaired and paired groups consistently showed that LAMA4 mRNA expression levels were significantly upregulated in tumor samples compared with nontumor tissues (all P < 0.05, Figures 1(a) – 1(d)). This tendency was also found in TCGA cohorts using GEPIA and UALCAN databases, although the differences were not statistically significant (Figures 1(e) and 1(f)).
Figure 1.
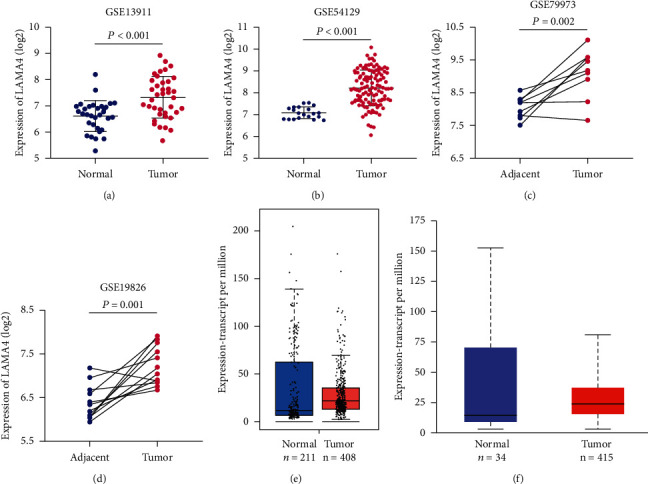
The expression levels of LAMA4 in gastric cancer (GC). (a–d) LAMA4 expression comparisons between GC and nontumor tissues from 4 GEO profiles. (e, f) LAMA4 expression comparisons between GC and nontumor tissues from TCGA samples evaluated by GEPIA (P > 0.05) (e) and UALCAN (P > 0.05) (f). GEO: Gene Expression Omnibus; TCGA: The Cancer Genome Atlas.
3.2. Correlations between LAMA4 Expression and Clinicopathological Characteristics
Correlations between LAMA4 expression and clinical variables of GC in TCGA were evaluated using 319 GC samples with LAMA4 expression and clinical information. A total of 160 samples were classified as high, and 159 were low based on the median values of LAMA4 expression levels. These results indicated that LAMA4 expression was significantly different among different cancer grades (P = 0.031, Table 1). Moreover, high levels of LAMA4 expression were observed as T classification increased (P = 0.040, Table 1). However, no significant association was found between LAMA4 expression and age, gender, stage, and N and M classification.
Table 1.
Relationship between LAMA4 expression level and clinicopathological variables in gastric cancer.
| Classification | Total | LAMA4 expression | χ 2 | P value | |
|---|---|---|---|---|---|
| High | Low | ||||
| Age | |||||
| 60 | 218 | 111 | 107 | 0.159 | 0.690 |
| <60 | 101 | 49 | 52 | ||
| Gender | |||||
| Female | 120 | 56 | 64 | 0.937 | 0.333 |
| Male | 199 | 104 | 95 | ||
| Grade | |||||
| G1 | 7 | 4 | 3 | 6.936 | 0.031 |
| G2 | 110 | 44 | 66 | ||
| G3 | 202 | 112 | 90 | ||
| TNM stage | |||||
| I | 44 | 17 | 27 | 2.710 | 0.100 |
| II-IV | 275 | 143 | 132 | ||
| T classification | |||||
| T1 | 16 | 4 | 12 | 8.319 | 0.040 |
| T2 | 64 | 28 | 36 | ||
| T3 | 152 | 76 | 76 | ||
| T4 | 87 | 52 | 35 | ||
| N classification | |||||
| N0 | 101 | 48 | 53 | 2.075 | 0.557 |
| N1 | 83 | 39 | 44 | ||
| N2 | 69 | 35 | 34 | ||
| N3 | 66 | 38 | 28 | ||
| M classification | |||||
| M0 | 297 | 149 | 148 | 0.000 | 0.988 |
| M1 | 22 | 11 | 11 | ||
3.3. LAMA4 Is an Independent Predictor of Worse OS in GC
Differences in OS were compared between the high and low LAMA4 expression groups in GC using the Kaplan-Meier plotter with GEO data and the GEPIA platform with TCGA data to assess the value of LAMA4 as a prognostic biomarker. The high LAMA4 expression group showed a significantly shorter OS than the low expression group in both GEO data (P < 0.001, Figure 2(a)) and TCGA data (P = 0.003, Figure 2(b)). Univariate Cox analysis of TCGA data indicated that age, gender, TNM stage, N classification, and LAMA4 expression were significant risk factors for survival (all P < 0.05, Table 2). Multivariate Cox analysis confirmed the critical role of age (P = 0.003) and LAMA4 expression (P = 0.033) as independent predictors of unfavorable OS for GC (Figure 2(c)). Therefore, LAMA4 may be a potential independent prognostic factor in GC.
Figure 2.
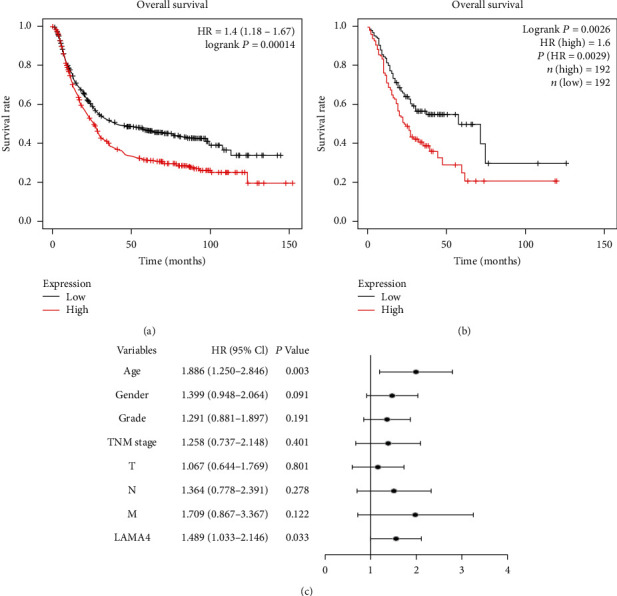
High expression of LAMA4 is associated with worse survival in GC. (a) Survival analysis of LAMA4 in the GEO dataset using the Kaplan-Meier plotter. (b) Survival analysis of LAMA4 in the TCGA samples using GEPIA. (c) Multivariate Cox analysis of the correlation between LAMA4 expression and survival. HR: hazard ratio; CI: confidence interval.
Table 2.
Univariate analysis of the prognostic factors in gastric cancer patients using a Cox regression model.
| Variables | Univariate analysis | ||
|---|---|---|---|
| HR | 95% CI | P value | |
| Age, year (≥60, <60) | 1.665 | 1.114-2.489 | 0.013 |
| Gender (male vs. female) | 1.469 | 1.001-2.154 | 0.049 |
| Grade (G3 vs. G1-G2) | 1.282 | 0.887-1.854 | 0.186 |
| TNM stage (III-IV vs. I-II) | 1.718 | 1.189-2.481 | 0.004 |
| T classification (T3-T4 vs. T1-T2) | 1.455 | 0.936-2.263 | 0.096 |
| N classification (N1-N3 vs. N0) | 1.704 | 1.114-2.608 | 0.014 |
| M classification (M1 vs. M0) | 1.626 | 0.851-3.108 | 0.141 |
| LAMA4 expression (high vs. low) | 1.624 | 1.138-2.316 | 0.008 |
3.4. Genetic Alterations and DNA Methylation of LAMA4
Genetic alterations and DNA methylation were analyzed to gain a deeper understanding of the molecular mechanism of LAMA4. Genetic alterations were seen in 8% of the 393 samples, with mutation, deletion, and amplification as the most common events (Figure 3(a)). Patients with genetic alterations of LAMA4 showed a significantly better disease-free survival (DFS) than those without alterations (P = 0.022, Figure 3(b)). However, there was no difference in OS between the two groups (Figure 3(c)). The DNA methylation heatmap of LAMA4 is shown in Figure 4(a). Among the 20 CpG sites, cg16044777 showed the highest levels of methylation. The prognostic value of each CpG site was evaluated. High levels of DNA methylation in 10 CpGs were significantly associated with better OS in GC (Table 3). As shown in Figures 4(b) – 4(k), the survival difference between the higher and lower DNA methylation levels of cg11934419 was the most pronounced (P = 4.9e − 05).
Figure 3.
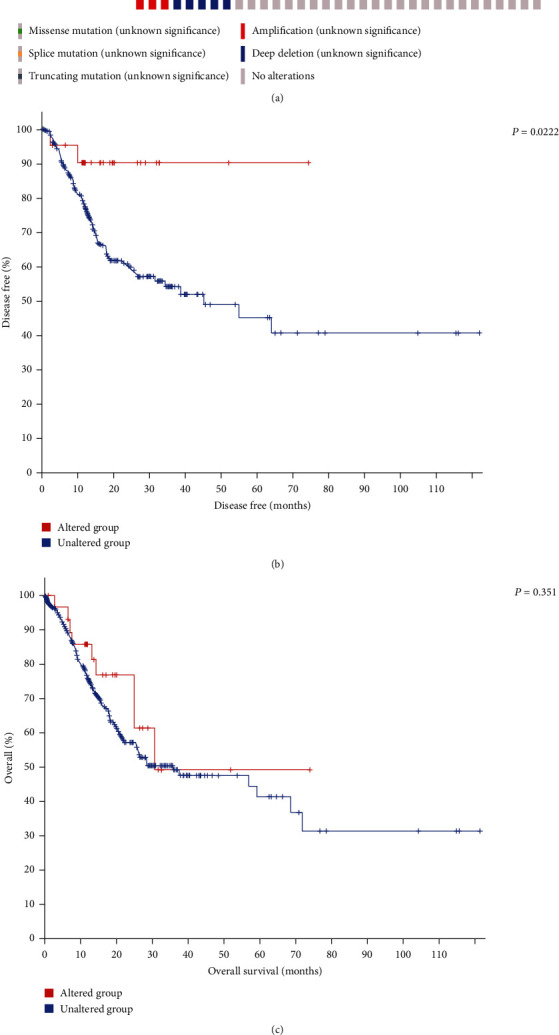
Genetic alterations of LAMA4 and the association between alterations and survival. (a) Genetic alterations of LAMA4 in GC using cBioPortal. (b) GC patients with LAMA4 genetic alterations showed a better DFS than those without (P = 0.0222). (c) Genetic alterations of LAMA4 did not have an impact on OS in GC (P = 0.351). DFS: disease-free survival; OS: overall survival.
Figure 4.
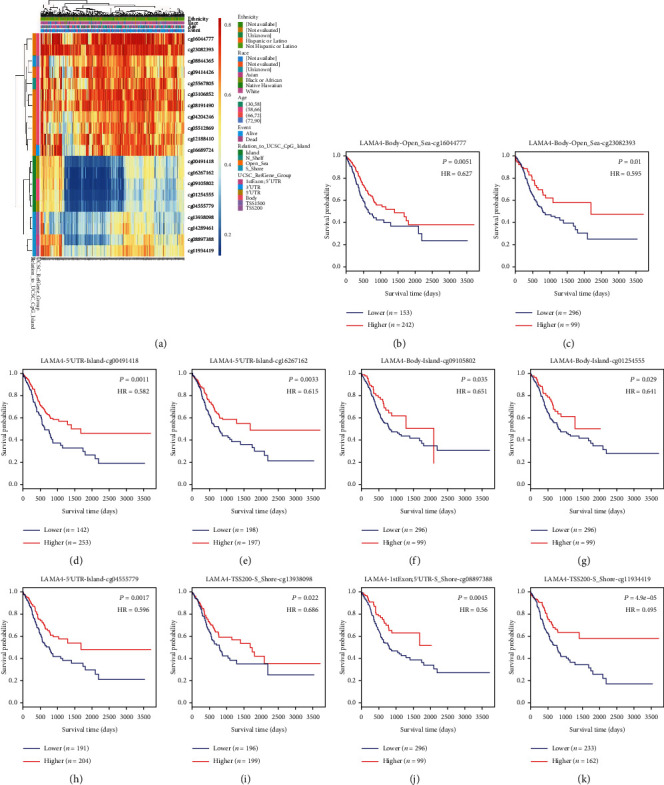
The heatmap of LAMA4 DNA methylation and the prognostic value of DNA methylation. (a) The heatmap of CpG methylation levels of LAMA4. Red to blue: high levels of DNA methylation to low levels. (b–k) High methylation level of cg16044777 (b), cg23082393 (c), cg00491418 (d), cg16267162 (e), cg09105802 (f), cg01254555 (g), cg04555779 (h), cg13938098 (i), cg08897388 (j), and cg11934419 (k) correlated with better OS.
Table 3.
The prognostic values of CpG sites in LAMA4.
| CpG | Relation to CpG island | RefGene group | HR | P value |
|---|---|---|---|---|
| cg00491418 | Island | 5′UTR | 0.582 | 0.0011 |
| cg04555779 | Island | 5′UTR | 0.596 | 0.0017 |
| cg16267162 | Island | 5′UTR | 0.615 | 0.0033 |
| cg01254555 | Island | Body | 0.641 | 0.029 |
| cg09105802 | Island | Body | 0.651 | 0.035 |
| cg25567805 | N_Shelf | Body | 0.699 | 0.072 |
| cg16044777 | Open_Sea | Body | 0.627 | 0.0051 |
| cg23082393 | Open_Sea | Body | 0.595 | 0.01 |
| cg12188410 | Open_Sea | Body | 0.737 | 0.094 |
| cg16689724 | Open_Sea | 3′UTR | 0.771 | 0.11 |
| cg08191490 | Open_Sea | Body | 0.763 | 0.16 |
| cg09414426 | Open_Sea | Body | 1.241 | 0.19 |
| cg04204246 | Open_Sea | Body | 0.8 | 0.25 |
| cg03106852 | Open_Sea | Body | 1.149 | 0.47 |
| cg05512869 | Open_Sea | Body | 1.091 | 0.59 |
| cg11934419 | S_Shore | TSS200 | 0.495 | 0.000049 |
| cg08897388 | S_Shore | 1st exon; 5′UTR | 0.56 | 0.0045 |
| cg13938098 | S_Shore | TSS200 | 0.686 | 0.022 |
| cg14289461 | S_Shore | TSS200 | 0.748 | 0.076 |
| cg08844365 | S_Shore | TSS1500 | 0.835 | 0.35 |
3.5. Coexpression Networks of LAMA4
LinkedOmics was used to investigate the coexpression profiles with LAMA4 in GC. A total of 7765 genes and 5711 genes were positively and negatively correlated with LAMA4, respectively (Figure 5(a)). The top 50 genes that were positively and negatively coexpressed with LAMA4 in GC are shown in Figures 5(b) and 5(c), respectively. Gene Ontology analysis carried out by GSEA revealed that the genes coexpressed with LAMA4 were mainly involved in the following biological process: extracellular structure organization, cyclic nucleotide metabolic process, and vasculogenesis (Figure 5(d)). KEGG pathway analysis showed that the genes were primarily enriched in ECM-receptor interaction, hypertrophic cardiomyopathy, and Hedgehog signaling pathway (Figure 5(e)). Notably, 25 of the top 50 positively correlated genes and 8 of the top 50 negatively correlated genes showed remarkable high and low hazard ratios, respectively, for GC survival (Figures 5(f) and 5(g)).
Figure 5.
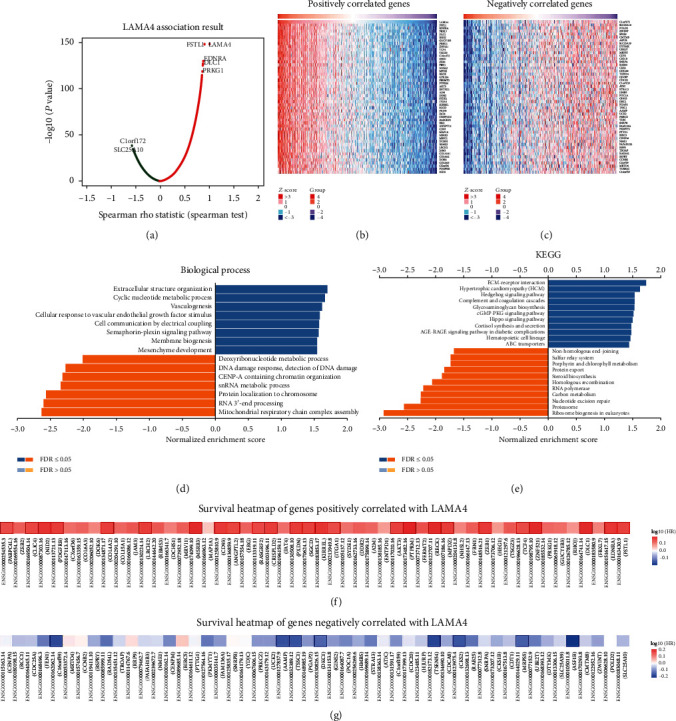
Coexpression genes of LAMA4 in GC. (a) Volcano plot of genes highly correlated with LAMA4 identified by the Spearman test in GC. Red and green dots represent genes significantly positively and negatively correlated with LAMA4, respectively. (b, c) Heatmaps of the top 50 genes positively (b) and negatively (c) correlated with LAMA4. (d, e) Significantly enriched GO: biological process annotations and KEGG pathways of LAMA4. (f, g) Survival heatmaps of the top 50 genes positively (f) and negatively (g) correlated with LAMA4 using GEPIA. The survival heatmaps are presented in the form of a logarithmic scale (log10) of hazard ratios. The red and blue squares indicate higher and lower risks for survival, respectively. The bordered squares indicate the significant unfavorable and favorable survival (P < 0.05). GO: Gene Ontology; KEGG: Kyoto Encyclopedia of Genes and Genomes.
3.6. Association of LAMA4 Expression with Immune Cell Infiltration
We further analyzed whether LAMA4 expression was correlated with the infiltration of six major types of immune cells. Our results showed that LAMA4 expression was significantly positively correlated with infiltration of macrophages (r = 0.636, P = 2.07e − 43), CD4+ T cells (r = 0.448, P = 1.70e − 19), and dendritic cells (r = 0.422, P = 2.03e − 17) in GC (Figure 6(a)). The multivariate Cox hazards model was used to assess the impact of LAMA4 expression and the six types of immune cells on the OS of GC. Overall, macrophages (P = 0.003) were significantly related to OS (Table 4).
Figure 6.
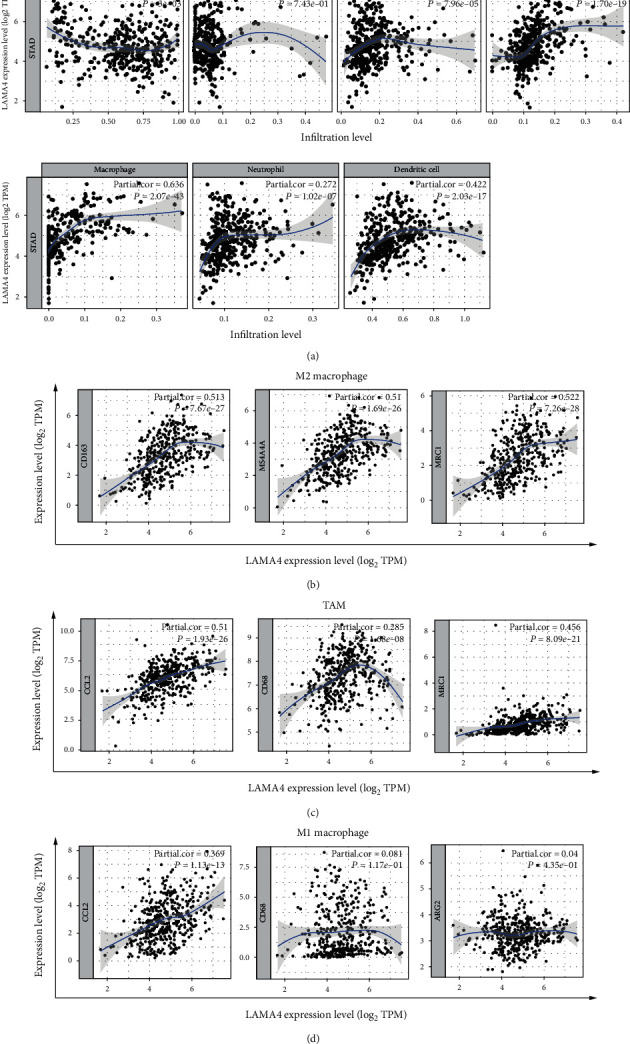
Correlations between LAMA4 expression and six infiltrating immune cells and subtypes of macrophage in GC. (a) LAMA4 expression was significantly positively correlated with infiltration of CD4+ T cells, macrophages, and dendritic cells. (b) Correlations of LAMA4 expression with marker genes of the M2 macrophage (CD163, MS4A4A, and MRC1). (c) Correlations of LAMA4 expression with marker genes of TAM (CCL2, CD68, and IL10). (d) Correlations of LAMA4 expression with marker genes of the M1 macrophage (PTGS2, NOS2, and ARG2). TAM: tumor-associated macrophage; TPM: transcript per million.
Table 4.
The multivariate Cox proportional hazards model of LAMA4 and six tumor-infiltrating immune cells in GC (TIMER).
| Coefficient | HR | 95% CI | P value | |
|---|---|---|---|---|
| Purity | -0.485 | 0.616 | 0.303-1.251 | 0.180 |
| B cell | 3.404 | 30.094 | 0.373-2427.743 | 0.129 |
| CD8+ T cell | -1.387 | 0.250 | 0.015-4.067 | 0.330 |
| CD4+ T cell | -4.270 | 0.014 | 0.000-1.464 | 0.072 |
| Macrophage | 5.201 | 181.393 | 5.932-5546.629 | 0.003 |
| Neutrophil | 1.175 | 3.237 | 0.008-1324.515 | 0.702 |
| Dendritic | 0.254 | 1.289 | 0.083-19.967 | 0.856 |
| LAMA4 | 0.138 | 1.148 | 0.930-1.416 | 0.198 |
3.7. Correlation Analysis between LAMA4 Expression and Macrophage Immune Marker Genes
Since LAMA4 expression showed a strong positive association with macrophage infiltration, we focused on the correlation between LAMA4 expression and marker genes of different macrophage subtypes. After adjustment for tumor purity, we found a significant correlation between LAMA4 expression and markers of M2 macrophages and TAMs. Expression of CD163, MS4A4A, and MRC1 of M2 macrophages and CCL2, CD68, and IL10 of TAMs showed a significantly positive correlation with LAMA4 expression (all P < 0.001, Figures 6(b) and 6(c)). M1 macrophage markers, such as PTGS2, NOS2, and ARG2, showed a weak or no correlation with LAMA4 expression (Figure 6(d)). In addition, we assessed the relationship between these markers and LAMA4 expression in the GEPIA database and consistently found the same positive trend in M2 macrophages and TAMs (Table 5).
Table 5.
Correlation analysis between LAMA4 expression and maker genes of macrophage subtypes (GEPIA).
| Marker | R | P value | |
|---|---|---|---|
| M2 macrophage | CD163 | 0.48 | 1.30E − 24 |
| MS4A4A | 0.53 | 5.50E − 31 | |
| MRC1 | 0.54 | 1.10E − 32 | |
|
| |||
| TAM | CCL2 | 0.54 | 9.60E − 32 |
| CD68 | 0.31 | 2.50E − 10 | |
| IL10 | 0.49 | 3.60E − 26 | |
|
| |||
| M1 macrophage | PTGS2 | 0.4 | 1.90E − 17 |
| NOS2 | 0.067 | 0.18 | |
| ARG2 | -0.064 | 0.2 | |
4. Discussion
Despite great advances in the treatment strategies of GC, long-term survival remains poor. Delayed diagnosis, frequent drug resistance, and rapid recurrence account for the limited benefits of treatment. The molecular characteristics of GC remain to be fully elucidated. Probing valuable prognostic and therapeutic targets is urgently required to optimize individualized treatment and improve prognosis. The present study analyzed differences in LAMA4 expression between GC and normal gastric groups in multiple datasets. LAMA4 was upregulated in GC tissues, and high levels of LAMA4 expression were significantly correlated with tumor invasion. Univariate and multivariate Cox analysis indicated that age and LAMA4 upexpression were independent predictors of unfavorable OS in GC.
LAMA4, known as a basement membrane glycoprotein, promotes the migration, proliferation, and survival of endothelial, blood, and cancer cells [23–25]. LAMA4 mRNA and protein expression was shown to be elevated in triple-negative breast cancer [26]. Pancreatic cancer patients with higher levels of LAMA4 expression were more likely to have liver metastasis and worse survival [27]. Knockdown of LAMA4 suppressed glioma cell adhesion and migration and reduced cell invasiveness [28]. It has been suggested that miR-539 and miRNA-200b could negatively regulate LAMA4 expression by directly targeting its 3′-untranslated regions [26, 29]. In the present study, evaluation of the differential expression in GC revealed that LAMA4 was highly expressed in tumor samples. Higher expression levels of LAMA4 were found more frequently with higher T classification. Survival analysis in GEO and TCGA samples indicated that high LAMA4 expression was associated with worse OS. Further multivariate Cox analysis confirmed LAMA4 as an independent risk factor for prognosis in GC. Hence, LAMA4 may be a valuable diagnostic and prognostic biomarker that should be studied further in detail.
We next explored the possible genetic and epigenetic alterations of LAMA4 in GC. According to the cBioPortal, genetic alterations of LAMA4 were found in 8% of the GC samples. The mutation was the most frequent phenomenon. DNA methylation analysis indicated that CpGs with higher methylation levels were mainly focused in Open_Sea and N_Shelf of LAMA4, whereas CpGs with lower methylation levels were common in Island and S_Shore. Interestingly, patients with genetic alterations exhibited a better DFS than those without. CpG sites located in the LAMA4 Island were all significantly associated with prognosis. Taken together with the survival advantage in the low expression group, we propose that genetic or epigenetic alterations may induce LAMA4 disorders as GC progresses. It was reported that low methylation of LAMA4 was associated with a significantly poor progression-free survival in ovarian cancer [30]. LAMA4 DNA methylation levels were negatively correlated with the tumor histologic grade in pancreatic cancer patients [27]. Further studies are needed to elucidate the mechanisms underlying genetic and epigenetic modifications of LAMA4 and their associations with expression in GC.
Coexpression analysis was performed to determine the biological functions of LAMA4. Our results revealed that LAMA4 and related coexpression genes were primarily enriched in extracellular structure organization and ECM-receptor interaction pathway. As a member of ECM glycoproteins, LAMA4 is ubiquitously localized in endothelial basement membranes. Disruption of LAMA4 expression inhibited endothelial sprouting and tubulogenesis [31]. It was reported that LAMA4 could impact the behavior of endothelial cells via complex interactions with integrin receptors on the surface of endothelial cells [32]. LAMA4 secreted from pancreatic cancer cells was shown to have a positive influence on the migration of fibroblasts in the tumor microenvironment [27]. LAMA4 overexpression induced cell migration in renal cell carcinoma via activation of the ILK/FAK/ERK pathway [29]. In GC cells, LAMA4 knockdown led to a reduced tumor invasive capability via inhibiting the expression of MMP2, a critical enzyme that degrades ECM [9]. Taken together, these findings indicate that LAMA4 plays an important role in regulating GC tumorigenesis via cell-matrix interactions.
Cumulative evidence indicates that immune cell infiltration can affect the progression and prognosis of GC [33, 34]. We evaluated the correlation between LAMA4 expression and immune cell infiltration in GC. LAMA4 expression was strongly and favorably associated with infiltration of macrophages. Cox analyses showed that macrophage was a significantly independent risk factor among all variables. In addition, LAMA4 expression also correlated with most molecular markers of macrophage subtypes in GC. The analysis based on the TIMER database showed that gene markers of the M2 macrophage strongly correlated with LAMA4 expression, whereas TAM markers exhibited moderate and M1 macrophage markers exhibited weak correlations. The correlations above were checked in the GEPIA database. Together, the results suggested a potential function of LAMA4 in TAM polarization. TAM infiltration in GC is closely related to tumorigenesis and metastasis and affects the survival rate of GC patients [35–37]. TAM may polarize into M1 or M2 macrophages in response to microenvironmental signals [38]. M2 macrophages play an important role in promoting metastasis via epithelial mesenchymal transition promotion in GC cells and facilitating gastric tumor proliferation and progression [39, 40]. The results above suggested the hypothesis that high expression of LAMA4 may accelerate GC progression and affect prognosis via regulation of TAMs.
At present, how LAMA4 affects the prognosis of GC and the function of LAMA4 in GC has not been fully elaborated. Our study provided new insights into the possible role of LAMA4 in GC. However, there are some limitations. All the data analyzed were retrospective and from multiple public datasets, which were not verified by our own experiments. More effort is needed to explore the detailed mechanisms of LAMA4 in GC.
5. Conclusions
In conclusion, we identified that increased LAMA4 expression in GC predicted adverse prognosis. Genetic and methylation alterations of LAMA4 affected DFS and OS in GC, respectively. LAMA4 expression was closely associated with infiltration of immune cells, particularly macrophages. LAMA4 might be a potential prognostic biomarker and therapeutic target in GC.
Acknowledgments
This work was supported by the Shandong Provincial Natural Science Foundation (grant no. BS2014YY059).
Data Availability
All the data used in the current study are available from the public database, and they can be found in the Gene Expression Omnibus (https://www.ncbi.nlm.nih.gov/geo/), The Cancer Genome Atlas (https://xenabrowser.net/datapages/), the cBioPortal (https://www.cbioportal.org/), the MethSurv (https://biit.cs.ut.ee/methsurv/), the LinkedOmics (http://www.linkedomics.org/), and the Tumor Immune Estimation Resource (https://cistrome.shinyapps.io/timer/).
Conflicts of Interest
The authors declare that they have no conflict of interest.
References
- 1.Joshi S. S., Badgwell B. D. Current treatment and recent progress in gastric cancer. CA: A Cancer Journal for Clinicians. 2021;71(3):264–279. doi: 10.3322/caac.21657. [DOI] [PMC free article] [PubMed] [Google Scholar]
- 2.Shan N., Zhang X., Xiao X., et al. Laminin α4 (LAMA4) expression promotes trophoblast cell invasion, migration, and angiogenesis, and is lowered in preeclamptic placentas. Placenta. 2015;36(8):809–820. doi: 10.1016/j.placenta.2015.04.008. [DOI] [PubMed] [Google Scholar]
- 3.Jaluria P., Chu C., Betenbaugh M., Shiloach J. Cells by design: a mini-review of targeting cell engineering using DNA microarrays. Molecular Biotechnology. 2008;39(2):105–111. doi: 10.1007/s12033-008-9048-5. [DOI] [PubMed] [Google Scholar]
- 4.Huang X., Ji G., Wu Y., Wan B., Yu L. LAMA4, highly expressed in human hepatocellular carcinoma from Chinese patients, is a novel marker of tumor invasion and metastasis. Journal of Cancer Research and Clinical Oncology. 2008;134(6):705–714. doi: 10.1007/s00432-007-0342-6. [DOI] [PubMed] [Google Scholar]
- 5.Ross J. B., Huh D., Noble L. B., Tavazoie S. F. Identification of molecular determinants of primary and metastatic tumour re-initiation in breast cancer. Nature Cell Biology. 2015;17(5):651–664. doi: 10.1038/ncb3148. [DOI] [PMC free article] [PubMed] [Google Scholar]
- 6.Wragg J. W., Finnity J. P., Anderson J. A., et al. MCAM and LAMA4 are highly enriched in tumor blood vessels of renal cell carcinoma and predict patient outcome. Cancer Research. 2016;76(8):2314–2326. doi: 10.1158/0008-5472.CAN-15-1364. [DOI] [PMC free article] [PubMed] [Google Scholar]
- 7.Liu Y., Xu Y., Ding L., Yu L., Zhang B., Wei D. LncRNA MEG3 suppressed the progression of ovarian cancer via sponging miR-30e-3p and regulating LAMA4 expression. Cancer Cell International. 2020;20(1) doi: 10.1186/s12935-020-01259-y. [DOI] [PMC free article] [PubMed] [Google Scholar]
- 8.Peng L., Li Y., Wei S., et al. LAMA4 activated by androgen receptor induces the cisplatin resistance in gastric cancer. Biomedicine & Pharmacotherapy. 2020;124:p. 109667. doi: 10.1016/j.biopha.2019.109667. [DOI] [PubMed] [Google Scholar]
- 9.Wang X., Hou Q., Zhou X. LAMA4 expression is activated by zinc finger E‑box‑binding homeobox 1 and independently predicts poor overall survival in gastric cancer. Oncology Reports. 2018;40(3):1725–1733. doi: 10.3892/or.2018.6564. [DOI] [PubMed] [Google Scholar]
- 10.Gautier L., Cope L., Bolstad B. M., Irizarry R. A. affy--analysis of Affymetrix GeneChip data at the probe level. Bioinformatics. 2004;20(3):307–315. doi: 10.1093/bioinformatics/btg405. [DOI] [PubMed] [Google Scholar]
- 11.Caicedo H. H., Hashimoto D. A., Caicedo J. C., Pentland A., Pisano G. P. Overcoming barriers to early disease intervention. Nature Biotechnology. 2020;38(6):669–673. doi: 10.1038/s41587-020-0550-z. [DOI] [PubMed] [Google Scholar]
- 12.Tang Z., Li C., Kang B., Gao G., Li C., Zhang Z. GEPIA: a web server for cancer and normal gene expression profiling and interactive analyses. Nucleic Acids Research. 2017;45(W1):W98–W102. doi: 10.1093/nar/gkx247. [DOI] [PMC free article] [PubMed] [Google Scholar]
- 13.Chandrashekar D. S., Bashel B., Balasubramanya S. A. H., et al. UALCAN: a portal for facilitating tumor subgroup gene expression and survival analyses. Neoplasia. 2017;19(8):649–658. doi: 10.1016/j.neo.2017.05.002. [DOI] [PMC free article] [PubMed] [Google Scholar]
- 14.Cerami E., Gao J., Dogrusoz U., et al. The cBio Cancer Genomics Portal: an open platform for exploring multidimensional cancer genomics data. Cancer Discovery. 2012;2(5):401–404. doi: 10.1158/2159-8290.CD-12-0095. [DOI] [PMC free article] [PubMed] [Google Scholar]
- 15.Modhukur V. I. T., Iljasenko T., Metsalu T., Lokk K., Laisk-Podar T., Vilo J. MethSurv: a web tool to perform multivariable survival analysis using DNA methylation data. Epigenomics. 2018;10(3):277–288. doi: 10.2217/epi-2017-0118. [DOI] [PubMed] [Google Scholar]
- 16.Vasaikar S. V., Straub P., Wang J., Zhang B. LinkedOmics: analyzing multi-omics data within and across 32 cancer types. Nucleic Acids Research. 2018;46(D1):D956–D963. doi: 10.1093/nar/gkx1090. [DOI] [PMC free article] [PubMed] [Google Scholar]
- 17.Li T., Fan J., Wang B., et al. TIMER: a web server for comprehensive analysis of tumor-infiltrating immune cells. Cancer Research. 2017;77(21):e108–e110. doi: 10.1158/0008-5472.CAN-17-0307. [DOI] [PMC free article] [PubMed] [Google Scholar]
- 18.Roszer T. Understanding the mysterious M2 macrophage through activation markers and effector mechanisms. Mediators of Inflammation. 2015;2015:16. doi: 10.1155/2015/816460.816460 [DOI] [PMC free article] [PubMed] [Google Scholar]
- 19.Wu K., Lin K., Li X., et al. Redefining tumor-associated macrophage subpopulations and functions in the tumor microenvironment. Frontiers in Immunology. 2020;11:p. 1731. doi: 10.3389/fimmu.2020.01731. [DOI] [PMC free article] [PubMed] [Google Scholar]
- 20.Wang L. X., Zhang S. X., Wu H. J., Rong X. L., Guo J. M2b macrophage polarization and its roles in diseases. Journal of Leukocyte Biology. 2019;106(2):345–358. doi: 10.1002/JLB.3RU1018-378RR. [DOI] [PMC free article] [PubMed] [Google Scholar]
- 21.Li X., Liu R., Su X., et al. Harnessing tumor-associated macrophages as aids for cancer immunotherapy. Molecular Cancer. 2019;18(1):p. 177. doi: 10.1186/s12943-019-1102-3. [DOI] [PMC free article] [PubMed] [Google Scholar]
- 22.Zhao R., Peng C., Song C., et al. BICC1 as a novel prognostic biomarker in gastric cancer correlating with immune infiltrates. International Immunopharmacology. 2020;87:p. 106828. doi: 10.1016/j.intimp.2020.106828. [DOI] [PubMed] [Google Scholar]
- 23.DeHahn K. C., Gonzales M., Gonzalez A. M., et al. The α4 laminin subunit regulates endothelial cell survival. Experimental Cell Research. 2004;294(1):281–289. doi: 10.1016/j.yexcr.2003.11.006. [DOI] [PubMed] [Google Scholar]
- 24.Thyboll J., Kortesmaa J., Cao R., et al. Deletion of the laminin alpha4 chain leads to impaired microvessel maturation. Molecular and Cellular Biology. 2002;22(4):1194–1202. doi: 10.1128/MCB.22.4.1194-1202.2002. [DOI] [PMC free article] [PubMed] [Google Scholar]
- 25.Vainionpaa N., Lehto V. P., Tryggvason K., Virtanen I. Alpha4 chain laminins are widely expressed in renal cell carcinomas and have a de-adhesive function. Laboratory Investigation. 2007;87(8):780–791. doi: 10.1038/labinvest.3700592. [DOI] [PubMed] [Google Scholar]
- 26.Yang Z. X., Zhang B., Wei J., et al. MiR-539 inhibits proliferation and migration of triple-negative breast cancer cells by down-regulating LAMA4 expression. Cancer Cell International. 2018;18(1) doi: 10.1186/s12935-018-0512-4. [DOI] [PMC free article] [PubMed] [Google Scholar]
- 27.Zheng B., Qu J., Ohuchida K., et al. LAMA4 upregulation is associated with high liver metastasis potential and poor survival outcome of pancreatic cancer. Theranostics. 2020;10(22):10274–10289. doi: 10.7150/thno.47001. [DOI] [PMC free article] [PubMed] [Google Scholar]
- 28.Nagato S., Nakagawa K., Harada H., et al. Downregulation of laminin alpha4 chain expression inhibits glioma invasion in vitro and in vivo. International Journal of Cancer. 2005;117(1):41–50. doi: 10.1002/ijc.21102. [DOI] [PubMed] [Google Scholar]
- 29.Li Y., Guan B., Liu J., et al. MicroRNA-200b is downregulated and suppresses metastasis by targeting LAMA4 in renal cell carcinoma. eBioMedicine. 2019;44:439–451. doi: 10.1016/j.ebiom.2019.05.041. [DOI] [PMC free article] [PubMed] [Google Scholar]
- 30.Chang P. Y., Liao Y.-P., Wang H.-C., et al. An epigenetic signature of adhesion molecules predicts poor prognosis of ovarian cancer patients. Oncotarget. 2017;8(32):53432–53449. doi: 10.18632/oncotarget.18515. [DOI] [PMC free article] [PubMed] [Google Scholar]
- 31.Hao Xu K. P., LaFlamme S. E. Laminin-511 and α6 integrins regulate the expression of CXCR4 to promote endothelial morphogenesis. Journal of Cell Science. 2020;133(11):p. 246595. doi: 10.1242/jcs.246595. [DOI] [PubMed] [Google Scholar]
- 32.Annette M., Gonzalez M. G., Herron G. S., et al. Complex interactions between the laminin α 4 subunit and integrins regulate endothelial cell behavior in vitro and angiogenesis in vivo. Proceedings of the National Academy of Sciences of the United States of America. 2002;99(25):16075–16080. doi: 10.1073/pnas.252649399. [DOI] [PMC free article] [PubMed] [Google Scholar]
- 33.Wang M., Li Z., Peng Y., et al. Identification of immune cells and mRNA associated with prognosis of gastric cancer. BMC Cancer. 2020;20(1):p. 206. doi: 10.1186/s12885-020-6702-1. [DOI] [PMC free article] [PubMed] [Google Scholar]
- 34.Wu M., Wang Y., Liu H., Song J., Ding J. Genomic analysis and clinical implications of immune cell infiltration in gastric cancer. Bioscience Reports. 2020;40(5) doi: 10.1042/BSR20193308. [DOI] [PMC free article] [PubMed] [Google Scholar]
- 35.Ju X., Zhang H., Zhou Z., Chen M., Wang Q. Tumor-associated macrophages induce PD-L1 expression in gastric cancer cells through IL-6 and TNF-ɑ signaling. Experimental Cell Research. 2020;396(2):p. 112315. doi: 10.1016/j.yexcr.2020.112315. [DOI] [PubMed] [Google Scholar]
- 36.Gambardella V., Castillo J., Tarazona N., et al. The role of tumor-associated macrophages in gastric cancer development and their potential as a therapeutic target. Cancer Treatment Reviews. 2020;86:p. 102015. doi: 10.1016/j.ctrv.2020.102015. [DOI] [PubMed] [Google Scholar]
- 37.Raiha M. R., Puolakkainen P. A. Tumor-associated macrophages (TAMs) as biomarkers for gastric cancer: a review. Chronic Dis Transl Med. 2018;4(3):156–163. doi: 10.1016/j.cdtm.2018.07.001. [DOI] [PMC free article] [PubMed] [Google Scholar]
- 38.Oya Y., Hayakawa Y., Koike K. Tumor microenvironment in gastric cancers. Cancer Science. 2020;111(8):2696–2707. doi: 10.1111/cas.14521. [DOI] [PMC free article] [PubMed] [Google Scholar]
- 39.Li W., Zhang X., Wu F., et al. Gastric cancer-derived mesenchymal stromal cells trigger M2 macrophage polarization that promotes metastasis and EMT in gastric cancer. Cell Death & Disease. 2019;10(12):p. 918. doi: 10.1038/s41419-019-2131-y. [DOI] [PMC free article] [PubMed] [Google Scholar]
- 40.Yamaguchi T., Fushida S., Yamamoto Y., et al. Tumor-associated macrophages of the M2 phenotype contribute to progression in gastric cancer with peritoneal dissemination. Gastric Cancer. 2016;19(4):1052–1065. doi: 10.1007/s10120-015-0579-8. [DOI] [PMC free article] [PubMed] [Google Scholar]
Associated Data
This section collects any data citations, data availability statements, or supplementary materials included in this article.
Data Availability Statement
All the data used in the current study are available from the public database, and they can be found in the Gene Expression Omnibus (https://www.ncbi.nlm.nih.gov/geo/), The Cancer Genome Atlas (https://xenabrowser.net/datapages/), the cBioPortal (https://www.cbioportal.org/), the MethSurv (https://biit.cs.ut.ee/methsurv/), the LinkedOmics (http://www.linkedomics.org/), and the Tumor Immune Estimation Resource (https://cistrome.shinyapps.io/timer/).


