

Key Points
Question
How have racial and ethnic differences in self-reported health status, access, and affordability among US adults changed between 1999 and 2018?
Findings
In this serial cross-sectional study that included 596 355 adults, there were marked racial and ethnic differences in measures of health status, access, and affordability, with evidence of improvement in some subgroups but persistence overall. In 2018, Black individuals with low income had the highest estimated prevalence of poor or fair health (24.9%), while White individuals with middle or high income had the lowest (6.3%).
Meaning
Between 1999 and 2018, some estimated racial and ethnic differences in measures of self-reported health status and health care access improved, but many differences persisted.
Abstract
Importance
The elimination of racial and ethnic differences in health status and health care access is a US goal, but it is unclear whether the country has made progress over the last 2 decades.
Objective
To determine 20-year trends in the racial and ethnic differences in self-reported measures of health status and health care access and affordability among adults in the US.
Design, Setting, and Participants
Serial cross-sectional study of National Health Interview Survey data, 1999-2018, that included 596 355 adults.
Exposures
Self-reported race, ethnicity, and income level.
Main Outcomes and Measures
Rates and racial and ethnic differences in self-reported health status and health care access and affordability.
Results
The study included 596 355 adults (mean [SE] age, 46.2 [0.07] years, 51.8% [SE, 0.10] women), of whom 4.7% were Asian, 11.8% were Black, 13.8% were Latino/Hispanic, and 69.7% were White. The estimated percentages of people with low income were 28.2%, 46.1%, 51.5%, and 23.9% among Asian, Black, Latino/Hispanic, and White individuals, respectively. Black individuals with low income had the highest estimated prevalence of poor or fair health status (29.1% [95% CI, 26.5%-31.7%] in 1999 and 24.9% [95% CI, 21.8%-28.3%] in 2018), while White individuals with middle and high income had the lowest (6.4% [95% CI, 5.9%-6.8%] in 1999 and 6.3% [95% CI, 5.8%-6.7%] in 2018). Black individuals had a significantly higher estimated prevalence of poor or fair health status than White individuals in 1999, regardless of income strata (P < .001 for the overall and low-income groups; P = .03 for middle and high–income group). From 1999 to 2018, racial and ethnic gaps in poor or fair health status did not change significantly, with or without income stratification, except for a significant decrease in the difference between White and Black individuals with low income (−6.7 percentage points [95% CI, −11.3 to −2.0]; P = .005); the difference in 2018 was no longer statistically significant (P = .13). Black and White individuals had the highest levels of self-reported functional limitations, which increased significantly among all groups over time. There were significant reductions in the racial and ethnic differences in some self-reported measures of health care access, but not affordability, with and without income stratification.
Conclusions and Relevance
In a serial cross-sectional survey study of US adults from 1999 to 2018, racial and ethnic differences in self-reported health status, access, and affordability improved in some subgroups, but largely persisted.
This cross-sectional survey study examines 20-year trends in the racial and ethnic differences in self-reported measures of health status and health care access and affordability among US adults.
Introduction
In 1985, the US Department of Health and Human Services published a landmark report on Black and minority health, commonly known as the Heckler Report, highlighting the racial and ethnic differences in health.1 Since then, the US has implemented many public health policies and programs to address these racial and ethnic differences.2,3,4 Age-adjusted death rates by race and ethnicity between Black individuals and White individuals narrowed from 1993 to 2015, but since 2016 the gap began widening.5,6,7
It is not clear whether the US has made progress in eliminating racial and ethnic differences in self-reported health status and health care access. Prior studies have not evaluated national, long-term trends from the individual’s perspective. This study used the National Health Interview Survey (NHIS),8 the principal federal source of health information on the US civilian, noninstitutionalized population, to study 20-year trends in self-reported health status and health care access and affordability by race and ethnicity. Considering that income can influence health and health care access in the US,9 this study also evaluated how racial and ethnic differences varied by income.
Methods
Data Source
We used data from the serial cross-sectional surveys of the NHIS for the years 1999 to 2018. The survey uses a complex multistage area probability design that accounts for nonresponse and allows for nationally representative estimates, including among underrepresented groups.8 We obtained the data from the Integrated Public Use Microdata Series Health Surveys website (https://nhis.ipums.org/).10 The codes used to analyze these data are available on reasonable request. The institutional review board at Yale University exempted the study from review.
Demographic Variables
Race and Ethnicity
Latino/Hispanic ethnicity was defined as answering “yes” to the question, “Do you consider yourself Latino/Hispanic?” Race was ascertained by the question, “What race do you consider yourself to be?” and, if more than 1 was reported, “Which one of these groups would you say best represents your race?” Participants were divided into 4 mutually exclusive subgroups based on their race and ethnicity combination: non-Hispanic Asian (Asian), non-Hispanic Black/African American (Black), Latino/Hispanic, and non-Hispanic White (White).
Income Level
Annual family income was categorized relative to the respective year’s federal poverty limit from the US Census Bureau11: middle and high income (≥200%) and low income (<200%)—a method consistent with prior NHIS studies.9,12
Respondent Characteristics
Respondent characteristics included in the models were age (in years), sex, and region (Northeast, North Central/Midwest, South, West). Other sociodemographic and clinical variables were used only to describe the characteristics of the population.
Study Population
We included individuals 18 years and older from years 1999 to 2018 of the Sample Adult Core file, which contains the responses from 1 adult who is randomly selected from each family for an in-depth questionnaire. The mean conditional response rate of the Sample Adult Core survey during the study period was 81%. The mean final response rate of the Sample Adult Core survey, which accounts for household and family nonresponse,13 was 64.8% (eMethods 1 in the Supplement).
Study Outcomes
The study outcomes are defined below, with details in eMethods 2 in the Supplement. “Don’t know,” “refused,” or no response values were set to missing for each outcome. Additionally, a description of how the study met recommendations for publishing on racial health inequities is provided in eMethods 3 in the Supplement.14
Health Status Outcomes
Self-rated health status was assessed on a 5-point scale (excellent, very good, good, fair, or poor) based on an individual’s self-perceived general health.15 Responses were dichotomized into a binary variable: poor or fair health status (yes vs no).
Functional limitation was assessed by asking respondents about their ability to perform 9 routine physical tasks (derived from the work of Nagi16 and Nagi and Marsh17) and 3 social and leisure activities without special equipment. We identified individuals as having a functional limitation if they reported any limitation in any of the 12 tasks.18 We also assessed limitations in physical tasks and social and leisure activities separately.
Severe psychological distress was assessed using the Kessler-6 Scale, which asks about 6 manifestations of nonspecific psychological distress over a 30-day recall period.19 Responses are rated on a 5-point scale (ranging from 0 to 4) based on the frequency of the feelings, and a summed score of 13 or greater was defined as having severe psychological distress.
Health Care Access, Utilization, and Affordability Outcomes
Health care access was assessed by ascertaining whether individuals had health insurance coverage and a usual source of care.12 Individuals were classified as “uninsured” if at the time of interview, they reported not having any private health insurance, Medicare, Medicaid, military plan, other government- or state-sponsored health plan, or if they had only Indian Health Service coverage.20 Individuals were identified as not having a usual source of care if they did not have a usual place to go whenever they were sick or needed health advice.21
Health care utilization was based on whether individuals had seen or talked to a health professional in the past 12 months.21
Health care affordability was assessed by determining whether individuals, in the past 12 months, had foregone or delayed medical care because of cost or had not gotten needed prescription medicines because they were unable to afford them.22
Statistical Analysis
All analyses incorporated strata and weights to produce nationally representative estimates using the Stata -svy- command for structured survey data. All person weights were pooled and divided by the number of years studied, in accordance with guidance from the NHIS.13 We summarized general characteristics of respondents by race and ethnicity. We then estimated annual outcome rates for each race and ethnicity subgroup, overall and by income level, using multivariable logistic regression models, with each outcome as the dependent variable, and age, sex, a dummy variable for each region, and an indicator for each year of interview as independent variables. Age, sex, and region were centered on their overall mean for the study sample; the coefficients for each year, when combined with the intercept, then represented the logit of the annual outcome rates adjusted for age, sex, and region. A separate model was estimated for each racial and ethnic subgroup, and the results were used to generate estimated rates for each year, using the inverse logit of each year effect as the annual rate and applying the method of parametric bootstrapping to calculate the standard error (SE) and the confidence interval (CI) for the transformed coefficients.23 To show alignment with prior work by the National Center for Health Statistics (NCHS), we also estimated the results for 1 of our study outcomes (poor or fair health status) using the same methodology as per the NCHS (ie, by standardizing only for age using direct standardization). For each regression, observations with missing outcome data were excluded from the model (ie, complete case analysis). Missing rates of each outcome are presented in the Results section. Due to high rates of missing income information from nonresponse, the publicly available NHIS data include multiply imputed income variables for respondents who do not report income. Thus, following NCHS recommendations for multiply imputed data analysis,24 to estimate the annual low-income prevalence by race and ethnicity, we used the mean annual estimate obtained by separate regressions using a similar approach as above but with each of the multiply imputed income variables as the dependent variable and an indicator for each year as the independent variables. Similarly, for the income-stratified analysis, we used the mean prevalence estimate of each outcome obtained by separate regressions for each of the imputed income values.
To quantify the racial and ethnic gap for each outcome, we used White individuals as the reference group and subtracted the annual rate for White individuals from the annual rate among Asian, Black, and Latino/Hispanic individuals for that year (eg, percentage of Latino/Hispanic individuals uninsured in 2010 − percentage of White individuals uninsured in 2010), also constructing SEs for the differences. Using these annual rates and differences, we then estimated trends over the study period by fitting weighted linear regression models where the dependent variable was the adjusted annual prevalence of each outcome or difference (calculated as described earlier), and the independent variable was time in years. To account for varying precision of each estimated rate or the difference over time, each observation was weighted by the inverse square of the SE.
For health care access and affordability indicators, rather than assuming a monotonic relationship between time and outcome rates, we graphically assessed the relationship of foregone or delayed medical care due to cost and health insurance coverage first. Based on this assessment, we modeled time as a linear spline with knots at 2010 and 2016 to reflect the observed inflection points. We then used the coefficient of the time variables to evaluate the slope of each outcome’s prevalence during each period. For all outcomes, we also performed a sensitivity analysis to account for the serial correlation of annual outcome rates, incorporating an autoregressive error term with 1-year correlation.
In a separate analysis, we tested for an absolute difference in the prevalence of each outcome and the racial and ethnic difference between 1999 and 2018 using a z test. For all analyses, a 2-sided P value less than .05 was used to determine statistical significance. All analyses were performed using Stata SE version 16.1 (StataCorp). Because of the potential for type I error due to multiple comparisons, findings of the analyses should be interpreted as exploratory.
Results
The study population included 603 140 adults, from which we excluded 112 individuals with unknown race or ethnicity information and 6673 individuals who identified their primary race as Alaska Native or American Indian (n = 4355), did not identify as Latino/Hispanic and did not select a primary race (n = 2114), or identified their primary race as other (n = 204) because of small numbers (Figure 1). The final study population included 596 355 adults (mean [SE] age, 46.2 [0.07] years; 51.8% [SE, 0.10] women) of whom 4.7% (SE, 0.07) were Asian, 11.8% (SE, 0.20) were Black, 13.8% (SE, 0.17) were Latino/Hispanic, and 69.7% (SE, 0.23) were White. The study population is described in Table 1; eTable 1 and eFigures 1 and 2 in the Supplement. The estimated prevalence of people with low income was 28.2% (SE, 1.80) among Asian individuals, 46.1% (SE, 1.18) among Black individuals, 51.5% (SE, 1.08) among Latino/Hispanic individuals, and 23.9% (SE, 0.50) among White individuals. Over the study period, there were no significant changes in the difference of the proportion of people with low income between White individuals and the other race and ethnicity groups (eFigure 2 in the Supplement). The overall rates of each outcome are shown in eFigure 3 in the Supplement, and the rate of missingness was less than 2.5% for each (eTable 2 in the Supplement).
Figure 1. Study Population.
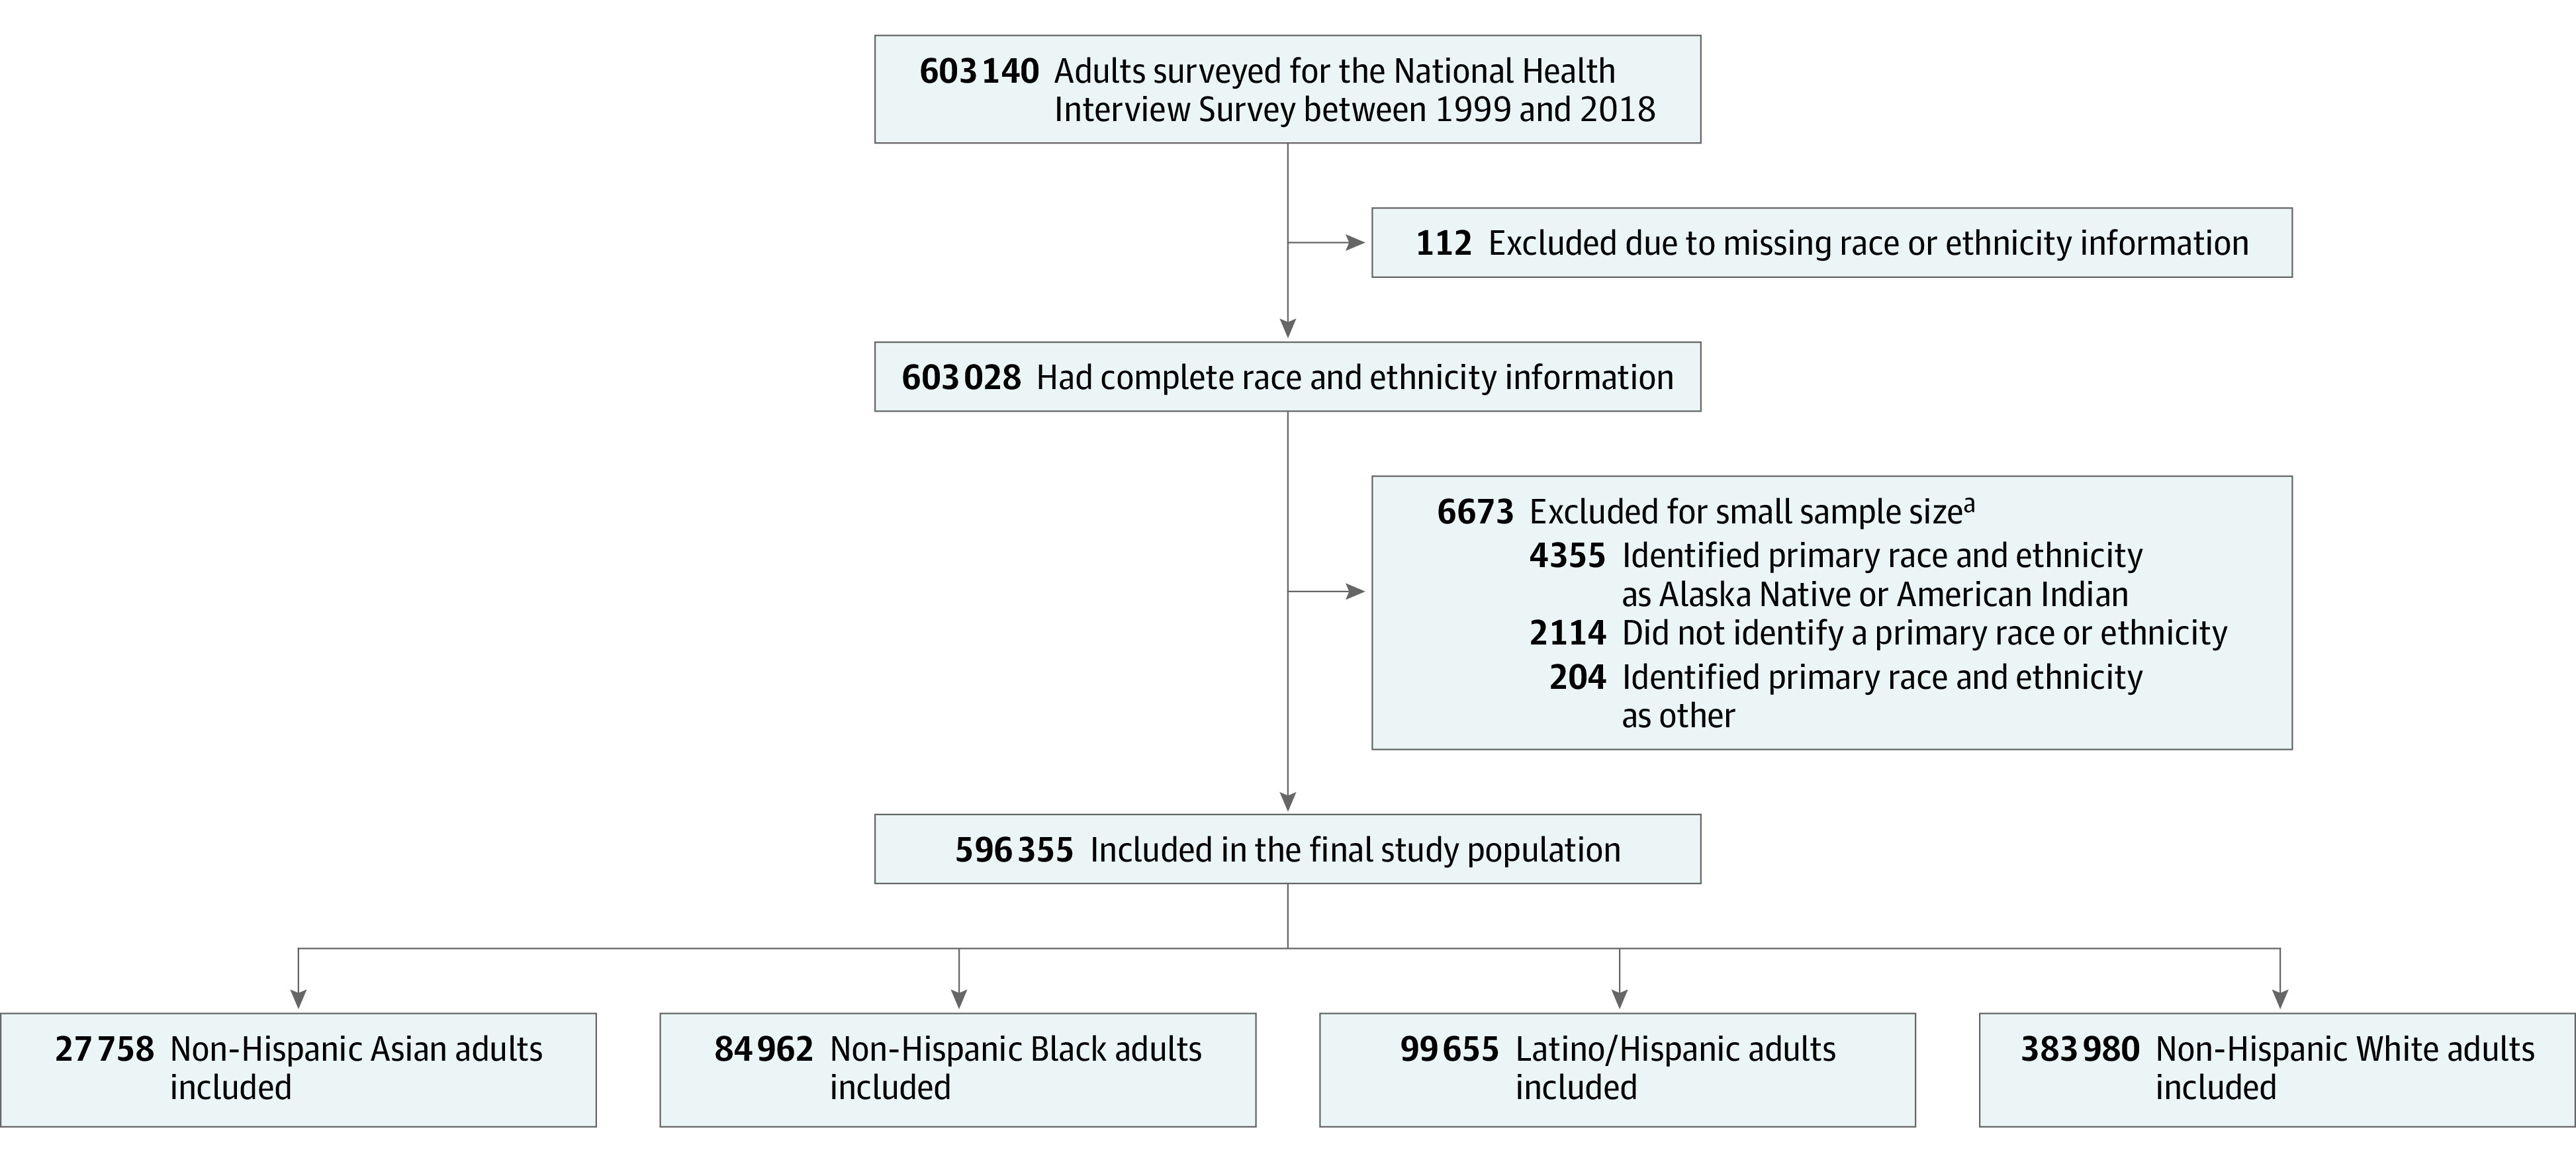
The 4 mutually exclusive racial and ethnic subgroups were created based on the primary race and ethnicity combinations.
aSmall sample size defined as less than 1% of the surveyed population. Individuals in these categories did not identify as Latino/Hispanic.
Table 1. General Characteristics of the Study Population by Race and Ethnicitya.
| Characteristic | % (95% CI) | |||
|---|---|---|---|---|
| Asian individuals | Black individuals | Latino/Hispanic individuals | White individuals | |
| Sample size, No. (N = 596 355) | 27 758 | 84 962 | 99 655 | 383 980 |
| Age, median (IQR), y | 41 (30-55) | 42 (29-55) | 38 (28-50) | 47 (33-61) |
| Age category, y | ||||
| 18-39 | 45.7 (44.7-46.6) | 45.4 (44.8-46.0) | 54.2 (53.7-54.8) | 35.3 (35.0-35.7) |
| 40-64 | 41.5 (40.7-42.4) | 41.8 (41.3-42.3) | 36.7 (36.2-37.1) | 44.4 (44.1-44.7) |
| ≥65 | 12.8 (12.3-13.5) | 12.8 (12.4-13.2) | 9.1 (8.8-9.4) | 20.3 (20.0-20.6) |
| Sex | ||||
| Men | 47.7 (46.9-48.4) | 44.8 (44.3-45.3) | 50.5 (50.0-50.9) | 48.3 (48.1-48.5) |
| Women | 52.3 (51.6-53.1) | 55.2 (54.7-55.7) | 49.6 (49.1-50.0) | 51.7 (51.5-51.9) |
| US citizenship (n = 594 976) | 68.1 (67.0-69.1) | 95.3 (95.0-95.7) | 64.4 (63.6-65.2) | 98.4 (98.3-98.5) |
| Education level (n = 591 769) | ||||
| <High school | 9.9 (9.3-10.5) | 18.3 (17.8-18.9) | 36.9 (36.2-37.6) | 10.3 (10.1-10.5) |
| High school diploma/GED | 16.4 (15.7-17.1) | 30.6 (30.1-31.1) | 26.2 (25.8-26.7) | 27.9 (27.6-28.2) |
| Some college | 22.4 (21.7-23.2) | 32.7 (32.2-33.3) | 24.3 (23.8-24.8) | 31.0 (30.7-31.3) |
| ≥Bachelor degree | 51.3 (50.1-52.5) | 18.4 (17.9-18.9) | 12.6 (12.2-13.0) | 30.8 (30.4-31.2) |
| Annual income <200% federal poverty limitb | 28.2 (24.9-31.7) | 46.1 (43.9-48.3) | 51.5 (50.2-52.7) | 23.9 (23.0-24.9) |
| Uninsured at the time of interview (n = 594 122) | 12.9 (12.3-13.5) | 18.5 (18.1-18.9) | 34.1 (33.4-34.8) | 10.5 (10.4-10.7) |
| US regionc | ||||
| Northeast | 20.1 (18.9-21.4) | 16.3 (15.5-17.0) | 14.0 (13.3-14.8) | 19.3 (18.8-19.8) |
| Midwest | 13.3 (12.3-14.3) | 17.8 (17.0-18.7) | 9.0 (8.3-9.8) | 28.2 (27.6-28.8) |
| South | 21.7 (20.4-23.0) | 57.8 (56.6-59.1) | 36.3 (35.0-37.6) | 33.9 (33.3-34.6) |
| West | 44.9 (43.3-46.6) | 8.1 (7.7-8.5) | 40.7 (39.3-42.1) | 18.6 (18.2-19.1) |
| Married or living with partner (n = 593 917) | 64.5 (63.6-65.3) | 35.1 (34.6-35.7) | 53.9 (53.4-54.4) | 58.5 (58.1-58.9) |
| Employment status (n = 595 593) | ||||
| With a job/working | 65.3 (64.5-66.2) | 60.5 (59.9-61.0) | 65.4 (64.9-65.9) | 62.9 (62.6-63.2) |
| Not in labor force | 30.8 (29.9-31.6) | 32.0 (31.4-32.5) | 29.3 (28.8-29.8) | 34.0 (33.7-34.3) |
| Unemployed | 3.9 (3.7-4.2) | 7.6 (7.3-7.9) | 5.3 (5.1-5.5) | 3.2 (3.1-3.2) |
| Comorbidities | ||||
| Hypertension | 21.0 (20.3-21.7) | 35.0 (34.5-35.6) | 20.0 (19.6-20.4) | 28.9 (28.7-29.2) |
| Diabetes | 7.2 (6.8-7.6) | 11.0 (10.7-11.2) | 8.6 (8.3-8.9) | 7.7 (7.5-7.8) |
| Prior stroke/myocardial infarction | 2.7 (2.4-2.9) | 5.3 (5.1-5.5) | 3.0 (2.9-3.2) | 5.9 (5.8-6.0) |
| Cancer | 2.9 (2.7-3.2) | 4.0 (3.8-4.1) | 2.8 (2.7-2.9) | 10.0 (9.9-10.1) |
| Emphysema/chronic bronchitis | 1.8 (1.6-2.0) | 4.7 (4.5-4.9) | 2.8 (2.7-2.9) | 5.9 (5.8-6.0) |
| Current smoker | 10.2 (9.7-10.7) | 19.7 (19.3-20.2) | 13.4 (13.1-13.7) | 20.6 (20.4-20.9) |
| Flu vaccine in past 12 mo | 36.8 (35.9-37.6) | 27.1 (26.7-27.6) | 24.6 (24.1-25.0) | 37.2 (36.9-37.5) |
| Obese (BMI ≥30) | 9.1 (8.7-9.6) | 36.3 (35.8-36.8) | 29.6 (29.1-30.1) | 25.6 (25.4-25.9) |
Abbreviations: BMI, body mass index (calculated as weight in kilograms divided by height in meters squared); GED, general equivalency diploma.
All percentages presented here are weighted percentages. Population characteristics of all racial and ethnic groups varied over the study period, as shown in eTable 1 in the Supplement. The outcomes prevalence estimates in this study were adjusted for age, sex, and US region.
Annual family income was categorized relative to the respective year’s federal poverty limit from the US Census Bureau into middle and high income (≥200%) and low income (<200%). The weighted proportion of individuals with annual income <200% federal poverty limit was estimated using multiple imputation.
Based on where the housing unit of the survey participant was located. The 4 regions correspond to the regions recognized by the US Census Bureau (https://www2.census.gov/geo/pdfs/maps-data/maps/reference/us_regdiv.pdf).
Health Status
Poor or Fair Health Status
In 1999, the estimated percentage of people who reported poor or fair health status was 10.0% (95% CI, 7.9%-12.6%) among Asian individuals, 17.7% (95% CI, 16.1%-19.4%) among Black individuals, 14.3% (95% CI, 13.0%-15.8%) among Latino/Hispanic individuals, and 9.4% (95% CI, 8.9%-9.8%) among White individuals (Figure 2A; eTable 3A in the Supplement). Between 1999 and 2018, there was no significant change in the estimated prevalence of poor health across all 4 race and ethnic groups (Table 2) and no significant change in the estimated gap between White and Black or Latino/Hispanic individuals (P = .08 and P = .88, respectively) (Table 3). Between 1999 and 2018, Black individuals with low income had the highest estimated prevalence of poor or fair health (29.1% [95% CI, 26.5%-31.7%] in 1999 and 24.9% [95% CI, 21.8%-28.3%] in 2018), while White individuals with middle and high income had the lowest (6.4% [95% CI, 5.9%-6.8%] in 1999 and 6.3% [95% CI, 5.8%-6.7%] in 2018) (eFigure 4A and eTable 3B in the Supplement). When stratified by income, in the low-income strata, the estimated prevalence of poor or fair health among White individuals increased significantly (P = .01), significantly narrowing their gap with Black individuals (P = .005), and the difference between Black and White individuals with low income was no longer significant in 2018 (P = .13) (Table 3). The difference between the estimated prevalence of poor or fair health with the prevalence estimated using the NCHS methodology was minimal (eTable 4 in the Supplement).
Figure 2. Trends of Self-reported Poor or Fair Health Status, Functional Limitation, and Severe Psychological Distress by Race and Ethnicity, 1999-2018.

Data source is the National Health Interview Survey from years 1999 to 2018. Rates are adjusted for age, sex, and US region using logistic regression, with 95% CIs shown with error bars. Definitions of each outcome are shown in Study Outcomes in the Methods section. The median annual number of adults included in the study by race and ethnicity were 1301 (IQR, 911-1815) non-Hispanic Asian, 4355 (IQR, 3843-4589) non-Hispanic Black, 5325 (IQR, 4212-5603) Latino/Hispanic, and 20 290 (IQR, 16919-20961) non-Hispanic White. The annual number and weighted proportion of individuals included in the study population are shown in eFigure 1 in the Supplement. The income-stratified results for these measures are presented in eFigure 4 in the Supplement.
Table 2. Change in the Adjusted Prevalence of Health Status and Health Care Access, Utilization, and Affordability Measures from 1999 to 2018, by Race and Ethnicitya.
| Asian individuals | Black individuals | Latino/Hispanic individuals | White individuals | |||||
|---|---|---|---|---|---|---|---|---|
| Percentage points (95% CI) | P value | Percentage points (95% CI) | P value | Percentage points (95% CI) | P value | Percentage points (95% CI) | P value | |
| Poor or fair health status | ||||||||
| Overall | −1.94 (−4.78 to +0.90) | .18 | −2.06 (−4.45 to +0.34) | .09 | +0.39 (−1.73 to +2.50) | .72 | +0.21 (−0.50 to +0.91) | .56 |
| Low income | −5.03 (−13.96 to +3.90) | .27 | −4.12 (−8.32 to +0.07) | .05 | +1.07 (−2.51 to +4.66) | .56 | +2.54 (+0.51 to +4.58) | .01 |
| Middle and high income | −0.44 (−4.15 to +3.26) | .82 | +0.47 (−1.98 to +2.91) | .71 | +0.25 (−2.10 to +2.61) | .83 | −0.09 (−0.72 to +0.54) | .77 |
| Functional limitation | ||||||||
| Overall | +4.85 (+0.51 to +9.19) | .03 | +9.30 (+5.91 to +12.69) | <.001 | +10.33 (+7.29 to +13.36) | <.001 | +8.69 (+7.26 to +10.11) | <.001 |
| Low income | +11.05 (+1.18 to +20.92) | .03 | +8.80 (+3.54 to +14.07) | .001 | +12.59 (+8.22 to +16.97) | <.001 | +15.37 (+12.41 to +18.33) | <.001 |
| Middle and high income | +3.34 (−1.68 to +8.36) | .19 | +10.47 (+6.32 to +14.62) | <.001 | +8.61 (+4.51 to +12.71) | <.001 | +7.22 (+5.76 to +8.69) | <.001 |
| Severe psychological distress | ||||||||
| Overall | +1.14 (−0.01 to +2.30) | .05 | +1.29 (+0.04 to +2.53) | .04 | +1.54 (+0.43 to +2.65) | .007 | +1.51 (+1.04 to +1.97) | <.001 |
| Low income | +1.53 (−1.23 to +4.29) | .28 | +2.10 (−0.22 to +4.41) | .08 | +2.12 (+0.47 to +3.77) | .01 | +3.67 (+2.37 to +4.98) | <.001 |
| Middle and high income | +1.06 (−0.37 to +2.48) | .15 | +0.78 (−0.46 to +2.02) | .22 | +1.12 (−0.36 to +2.59) | .14 | +0.99 (+0.55 to +1.43) | <.001 |
| Lack of health insurance at the time of interview | ||||||||
| Overall | −8.51 (−11.95 to −5.07) | <.001 | −5.01 (−6.86 to −3.15) | <.001 | −8.16 (−10.89 to −5.44) | <.001 | −2.83 (−3.44 to −2.22) | <.001 |
| Low income | −22.95 (−31.22 to −14.68) | <.001 | −9.96 (−13.07 to −6.84) | <.001 | −13.13 (−17.59 to −8.67) | <.001 | −9.09 (−11.05 to −7.14) | <.001 |
| Middle and high income | −3.56 (−6.84 to −0.29) | .03 | −1.42 (−3.41 to +0.57) | .16 | −3.40 (−5.86 to −0.93) | .007 | −1.27 (−1.85 to −0.68) | <.001 |
| No usual source of care at the time of interview | ||||||||
| Overall | −5.86 (−9.40 to −2.31) | .001 | +0.12 (−2.12 to +2.35) | .92 | −3.70 (−6.02 to −1.37) | .002 | −0.52 (−1.30 to +0.27) | .20 |
| Low income | −15.72 (−24.56 to −6.89) | <.001 | +1.36 (−2.05 to +4.78) | .43 | −5.64 (−9.32 to −1.96) | .003 | +0.03 (−1.93 to +1.98) | .98 |
| Middle and high income | −2.55 (−6.08 to +0.97) | .16 | −0.66 (−3.31 to +1.99) | .62 | −1.51 (−4.00 to +0.99) | .24 | −0.61 (−1.44 to +0.21) | .15 |
| Not seen or talked to a health professional in the past 12 mo | ||||||||
| Overall | −2.37 (−6.39 to +1.66) | .25 | −2.00 (−4.05 to +0.05) | .06 | −2.96 (−5.31 to −0.62) | .01 | −2.46 (−3.24 to −1.68) | <.001 |
| Low income | −7.72 (−17.36 to +1.92) | .12 | −0.67 (−3.97 to +2.64) | .69 | −4.28 (−7.89 to −0.67) | .02 | −1.60 (−3.53 to +0.33) | .10 |
| Middle and high income | −0.29 (−4.90 to +4.31) | .90 | −2.91 (−5.55 to −0.27) | .03 | −1.37 (−4.25 to +1.50) | .35 | −2.59 (−3.42 to −1.76) | <.001 |
| Foregone or delayed medical care due to cost in the past 12 mo | ||||||||
| Overall | +0.46 (−2.04 to +2.97) | .72 | +3.23 (+1.04 to +5.43) | .004 | +2.30 (+0.51 to +4.09) | .01 | +3.07 (+2.25 to +3.88) | <.001 |
| Low income | −2.06 (−8.08 to +3.97) | .50 | +0.70 (−2.85 to +4.24) | .70 | +2.84 (−0.09 to +5.77) | .06 | +3.52 (+1.43 to +5.61) | <.001 |
| Middle and high income | +1.43 (−0.95 to +3.81) | .24 | +5.83 (+3.10 to +8.56) | <.001 | +2.20 (−0.08 to +4.47) | .06 | +3.11 (+2.25 to +3.96) | <.001 |
Data source is the National Health Interview Survey from years 1999 to 2018. Definitions of each outcome are shown in Study Outcomes in the Methods section. For change in prevalence: a positive sign (+) means the prevalence of such a measure increased and a negative sign (−) means it decreased. For all measures, a decrease in prevalence (negative sign) is a socially positive result (ie, increased percentage of people with insurance coverage, increased percentage of people with a usual source of care, increased percentage of people with recent health care utilization, reduced percentage of people with unmet medical needs due to cost, reduced percentage of people with poor or fair health status, reduced percentage of people with severe psychological distress, and reduced percentage of people with functional limitations). Of note, the Affordable Care Act was enacted in March 2010. Rates of each measure were adjusted for age, sex, and US region.
Table 3. Relative Racial and Ethnic Differences in the Adjusted Prevalence of Health Status and Health Care Access, Utilization, and Affordability Measures in 1999 and 2018a.
| Difference between Asian and White individuals | Difference between Black and White individuals | Difference between Latino/Hispanic and White individuals | ||||||||||
|---|---|---|---|---|---|---|---|---|---|---|---|---|
| Percentage points (95% CI) | Difference in difference | Percentage points (95% CI) | Difference in difference | Percentage points (95% CI) | Difference in difference | |||||||
| 1999 | 2018 | Percentage points (95% CI) | P value | 1999 | 2018 | Percentage points (95% CI) | P value | 1999 | 2018 | Percentage points (95% CI) | P value | |
| Poor or fair health status | ||||||||||||
| Overall | +0.61 (−1.74 to +2.96) | −1.54 (−3.27 to +0.20) | −2.14 (−5.07 to +0.78) | .15 | +8.29 (+6.57 to +10.02) | +6.03 (+4.23 to +7.83) | −2.26 (−4.75 to +0.23) | .08 | +4.95 (+3.46 to +6.45) | +5.13 (+3.48 to +6.79) | +0.18 (−2.05 to +2.41) | .88 |
| Low income | −0.47 (−8.39 to +7.46) | −8.04 (−12.64 to −3.45) | −7.57 (−16.74 to +1.59) | .11 | +9.48 (+6.56 to +12.41) | +2.82 (−0.81 to +6.45) | −6.67 (−11.33 to −2.01) | .005 | −0.24 (−2.75 to +2.27) | −1.71 (−4.98 to +1.56) | −1.47 (−5.59 to +2.66) | .49 |
| Middle and high income | +0.06 (−3.26 to +3.38) | −0.29 (−2.04 to +1.47) | −0.35 (−4.11 to +3.41) | .86 | +2.14 (+0.22 to +4.06) | +2.70 (+1.06 to +4.34) | +0.56 (−1.97 to +3.09) | .67 | +3.24 (+1.54 to +4.95) | +3.59 (+1.84 to +5.34) | +0.34 (−2.09 to +2.78) | .78 |
| Functional limitation | ||||||||||||
| Overall | −10.66 (−13.90 to −7.42) | −14.50 (−17.71 to −11.28) | −3.84 (−8.40 to +0.73) | .10 | −0.26 (−2.49 to +1.97) | +0.35 (−2.57 to +3.28) | +0.61 (−3.07 to +4.29) | .74 | −7.17 (−9.08 to −5.26) | −5.53 (−8.28 to −2.77) | +1.64 (−1.71 to +5.00) | .34 |
| Low income | −17.65 (−24.84 to −10.46) | −21.96 (−29.34 to −14.59) | −4.31 (−14.62 to +5.99) | .41 | −1.55 (−5.14 to +2.05) | −8.11 (−12.96 to −3.26) | −6.56 (−12.60 to −0.52) | .03 | −16.94 (−20.28 to −13.59) | −19.71 (−23.80 to −15.62) | −2.77 (−8.06 to +2.51) | .30 |
| Middle and high income | −9.30 (−13.24 to −5.35) | −13.18 (−16.61 to −9.75) | −3.89 (−9.11 to +1.34) | .15 | −5.05 (−7.64 to −2.46) | −1.81 (−5.37 to +1.75) | +3.24 (−1.16 to +7.64) | .15 | −5.88 (−8.40 to −3.37) | −4.50 (−8.04 to −0.95) | +1.38 (−2.96 to +5.73) | .53 |
| Severe psychological distress | ||||||||||||
| Overall | −1.44 (−2.05 to −0.83) | −1.81 (−2.89 to −0.72) | −0.36 (−1.61 to +0.88) | .57 | +0.77 (+0.15 to +1.39) | +0.55 (−0.63 to +1.72) | −0.22 (−1.55 to +1.11) | .75 | +0.91 (+0.25 to +1.57) | +0.94 (−0.07 to +1.95) | +0.03 (−1.17 to +1.23) | .96 |
| Low income | −3.27 (−5.19 to −1.35) | −5.42 (−7.79 to −3.04) | −2.15 (−5.20 to +0.91) | .17 | +0.11 (−1.15 to +1.38) | −1.46 (−3.80 to +0.88) | −1.58 (−4.24 to +1.08) | .25 | −0.65 (−1.75 to +0.45) | −2.20 (−4.00 to −0.40) | −1.55 (−3.66 to +0.56) | .15 |
| Middle and high income | −1.02 (−1.81 to −0.24) | −0.95 (−2.22 to +0.31) | +0.07 (−1.42 to +1.56) | .93 | −0.07 (−0.82 to +0.68) | −0.28 (−1.35 to +0.80) | −0.21 (−1.52 to +1.10) | .75 | +0.56 (−0.30 to +1.41) | +0.68 (−0.60 to +1.96) | +0.12 (−1.41 to +1.66) | .87 |
| Lack of health insurance at the time of interview | ||||||||||||
| Overall | +5.75 (+2.62 to +8.87) | +0.06 (−1.50 to +1.62) | −5.68 (−9.18 to −2.19) | .001 | +5.21 (+3.75 to +6.67) | +3.03 (+1.73 to +4.33) | −2.18 (−4.13 to −0.23) | .03 | +17.52 (+15.68 to +19.36) | +12.19 (+10.08 to +14.29) | −5.33 (−8.13 to −2.54) | <.001 |
| Low income | +11.93 (+4.38 to +19.48) | −1.93 (−5.83 to +1.97) | −13.86 (−22.36 to −5.36) | .001 | +1.53 (−1.21 to +4.27) | +0.67 (−1.78 to +3.12) | −0.86 (−4.54 to +2.82) | .65 | +19.41 (+16.30 to +22.52) | +15.37 (+11.62 to +19.12) | −4.04 (−8.91 to +0.83) | .10 |
| Middle and high income | +2.52 (−0.38 to +5.42) | +0.22 (−1.41 to +1.86) | −2.30 (−5.63 to +1.03) | .18 | +1.93 (+0.43 to +3.44) | +1.78 (+0.35 to +3.20) | −0.16 (−2.23 to +1.92) | .88 | +8.41 (+6.66 to +10.16) | +6.28 (+4.45 to +8.11) | −2.13 (−4.66 to +0.40) | .10 |
| No usual source of care at the time of interview | ||||||||||||
| Overall | +6.42 (+3.36 to +9.48) | +1.08 (−0.87 to +3.03) | −5.34 (−8.97 to −1.71) | .004 | +2.47 (+0.96 to +3.98) | +3.10 (+1.28 to +4.93) | +0.63 (−1.74 to +3.00) | .60 | +9.76 (+8.13 to +11.40) | +6.58 (+4.75 to +8.41) | −3.18 (−5.63 to −0.73) | .01 |
| Low income | +15.28 (+7.55 to +23.00) | −0.47 (−5.18 to +4.24) | −15.75 (−24.80 to −6.70) | <.001 | −0.06 (−2.49 to +2.38) | +1.28 (−1.82 to +4.37) | +1.34 (−2.60 to +5.28) | .51 | +10.74 (+8.01 to +13.48) | +5.08 (+1.93 to +8.22) | −5.67 (−9.83 to −1.50) | .008 |
| Middle and high income | +3.20 (+0.31 to +6.09) | +1.26 (−0.92 to +3.44) | −1.94 (−5.56 to +1.67) | .29 | +1.25 (−0.53 to +3.03) | +1.20 (−0.92 to +3.32) | −0.05 (−2.82 to +2.72) | .97 | +5.06 (+3.31 to +6.82) | +4.17 (+2.21 to +6.13) | −0.89 (−3.52 to +1.73) | .51 |
| Not seen or talked to a health professional in the past 12 mo | ||||||||||||
| Overall | +7.35 (+4.35 to +10.35) | +7.44 (+4.65 to +10.24) | +0.09 (−4.01 to +4.20) | .97 | +0.80 (−0.67 to +2.27) | +1.26 (−0.37 to +2.89) | +0.46 (−1.74 to +2.65) | .68 | +8.68 (+7.11 to +10.26) | +8.18 (+6.27 to +10.09) | −0.51 (−2.98 to +1.97) | .69 |
| Low income | +11.94 (+3.92 to +19.95) | +5.82 (+0.12 to +11.52) | −6.12 (−15.95 to +3.72) | .22 | −1.11 (−3.67 to +1.46) | −0.17 (−3.02 to +2.67) | +0.93 (−2.89 to +4.76) | .63 | +10.22 (+7.54 to +12.90) | +7.54 (+4.45 to +10.64) | −2.68 (−6.77 to +1.41) | .20 |
| Middle and high income | +5.53 (+2.20 to +8.86) | +7.83 (+4.55 to +11.11) | +2.30 (−2.38 to +6.98) | .34 | +0.67 (−1.17 to +2.52) | +0.36 (−1.70 to +2.42) | −0.31 (−3.08 to +2.45) | .82 | +5.30 (+3.37 to +7.23) | +6.52 (+4.24 to +8.80) | +1.22 (−1.77 to +4.21) | .43 |
| Foregone or delayed medical care due to cost in the past 12 mo | ||||||||||||
| Overall | −3.97 (−6.06 to −1.88) | −6.58 (−8.18 to −4.97) | −2.61 (−5.24 to +0.03) | .05 | +2.94 (+1.48 to +4.41) | +3.10 (+1.28 to +4.93) | +0.16 (−2.18 to +2.50) | .89 | +1.39 (+0.16 to +2.63) | +0.62 (−0.91 to +2.15) | −0.77 (−2.73 to +1.20) | .44 |
| Low income | −8.87 (−13.94 to −3.80) | −14.45 (−18.32 to −10.58) | −5.58 (−11.96 to +0.80) | .09 | −0.19 (−2.91 to +2.54) | −3.01 (−6.10 to +0.07) | −2.83 (−6.94 to +1.29) | .18 | −5.28 (−7.52 to −3.05) | −5.97 (−8.79 to −3.15) | −0.68 (−4.28 to +2.92) | .71 |
| Middle and high income | −3.20 (−5.02 to −1.37) | −4.87 (−6.62 to −3.12) | −1.68 (−4.21 to +0.85) | .19 | −0.09 (−1.63 to +1.45) | +2.63 (+0.22 to +5.04) | +2.72 (−0.14 to +5.58) | .06 | +0.72 (−0.77 to +2.21) | −0.19 (−2.12 to +1.73) | −0.91 (−3.34 to +1.52) | .46 |
Data source is the National Health Interview Survey from years 1999 to 2018. Definitions of each outcome are shown in Study Outcomes in the Methods section. For all measures, a negative sign in any 1 year indicates a more socially positive result in comparison with the White population (ie, increased percentage of people with insurance coverage, increased percentage of people with a usual source of care, increased percentage of people with recent health care utilization, reduced percentage of people with unmet medical needs due to cost, reduced percentage of people with poor or fair health status, reduced percentage of people with severe psychological distress, and reduced percentage of people with functional limitations). Likewise, a difference-in-difference result that is negative indicates a socially positive change in comparison with the White population over the same timeframe. Of note, the Affordable Care Act was enacted in March 2010. Rates of each measure were adjusted for age, sex, and US region.
Functional Limitation
In 1999, the estimated percentage of people reporting functional limitation was 19.0% (95% CI, 16.1%-22.4%) among Asian individuals, 29.4% (95% CI, 27.4%-31.5%) among Black individuals, 22.5% (95% CI, 20.9%-24.3%) among Latino/Hispanic individuals, and 29.7% (95% CI, 28.9%-30.6%) among White individuals (Figure 2B; eTable 5A in the Supplement). Between 1999 and 2018, the estimated prevalence of adults reporting functional limitation increased significantly for Black, Latino/Hispanic, and White individuals regardless of their income level (P < .001 for all) and for Asian individuals with low income (P = .03) (Table 2). Between 1999 and 2018, the estimated gap between White and Asian and Latino/Hispanic individuals did not significantly change (P = .10 and P = .34, respectively) (Table 3); and in 2018, White individuals with low income had the highest estimated prevalence of functional limitation (57.0% [95% CI, 54.8%-59.2%]), whereas Asian people with middle and high income had the lowest (20.4% [95% CI, 17.4%-23.8%]) (eFigure 4B and eTable 5B in the Supplement). Trends in differences by race and ethnicity were similar when physical tasks and social and leisure activities were analyzed separately (eFigure 5 in the Supplement).
Severe Psychological Distress
In 1999, the estimated percentage of people who reported severe psychological distress was 0.8% (95% CI, 0.4%-1.5%) among Asian individuals, 3.0% (95% CI, 2.5%-3.7%) among Black individuals, 3.2% (95% CI, 2.6%-3.8%) among Latino/Hispanic individuals, and 2.3% (95% CI, 2.0%-2.5%) among White individuals (Figure 2C; eTable 6A in the Supplement). Between 1999 and 2018, estimated rates of severe psychological distress significantly increased for Black (+1.3 percentage points [95% CI, 0.04-2.5]; P = .04), Latino/Hispanic (+1.5 percentage points [95% CI, 0.4-2.7]; P = .007), and White individuals (+1.5 percentage points [95% CI, 1.0-2.0]; P < .001) but there was no significant change for Asian individuals (+1.1 percentage points [95% CI, −0.01 to 2.3]; P = .05) (Table 2). The estimated differences between White individuals and the other racial and ethnic groups did not significantly change, either overall or by income level (P > .05 for each group) (Table 3; eFigure 4C and eTable 6B in the Supplement). Findings were consistent in sensitivity analyses using autoregressive models (eTable 7 in the Supplement).
Health Care Access, Utilization, and Affordability
Lack of Health Insurance
In 1999, the estimated percentage of people who reported being uninsured was 14.4% (95% CI, 11.5%-17.7%) among Asian individuals, 13.8% (95% CI, 12.5%-15.3%) among Black individuals, 26.1% (95% CI, 24.4%-28.0%) among Latino/Hispanic individuals, and 8.6% (95% CI, 8.2%-9.0%) among White individuals (Figure 3A; eTable 8A in the Supplement). Between 1999 and 2018, the estimated rates of uninsured people decreased significantly for all racial and ethnic subgroups (P < .001 for each) (Table 2). This decrease occurred mostly between 2010 and 2015 (eTable 9 in the Supplement). In the same period, the estimated difference between White and Asian, Black, and Latino/Hispanic individuals also decreased significantly (P = .001, P = .03, and P < .001 respectively) (Table 3). However, in 2018, there was still a significant difference in the estimated uninsured prevalence between White and Black individuals (3.0 points higher for Black individuals [95% CI, 1.7-4.3]; P < .001) and Latino/Hispanic individuals (12.2 points higher for Latino/Hispanic individuals [95% CI, 10.1-14.3]; P < .001). In 2018, Latino/Hispanic individuals with low income had the highest estimated percentage of uninsurance (27.3% [95% CI, 24.0%-30.8%]), whereas White individuals with middle and high income had the lowest (4.2% [95% CI, 3.8%-4.7%]) (eFigure 6A and eTable 8B in the Supplement).
Figure 3. Trends of Self-reported Health Care Access, Utilization, and Affordability Measures by Race and Ethnicity, 1999-2018.
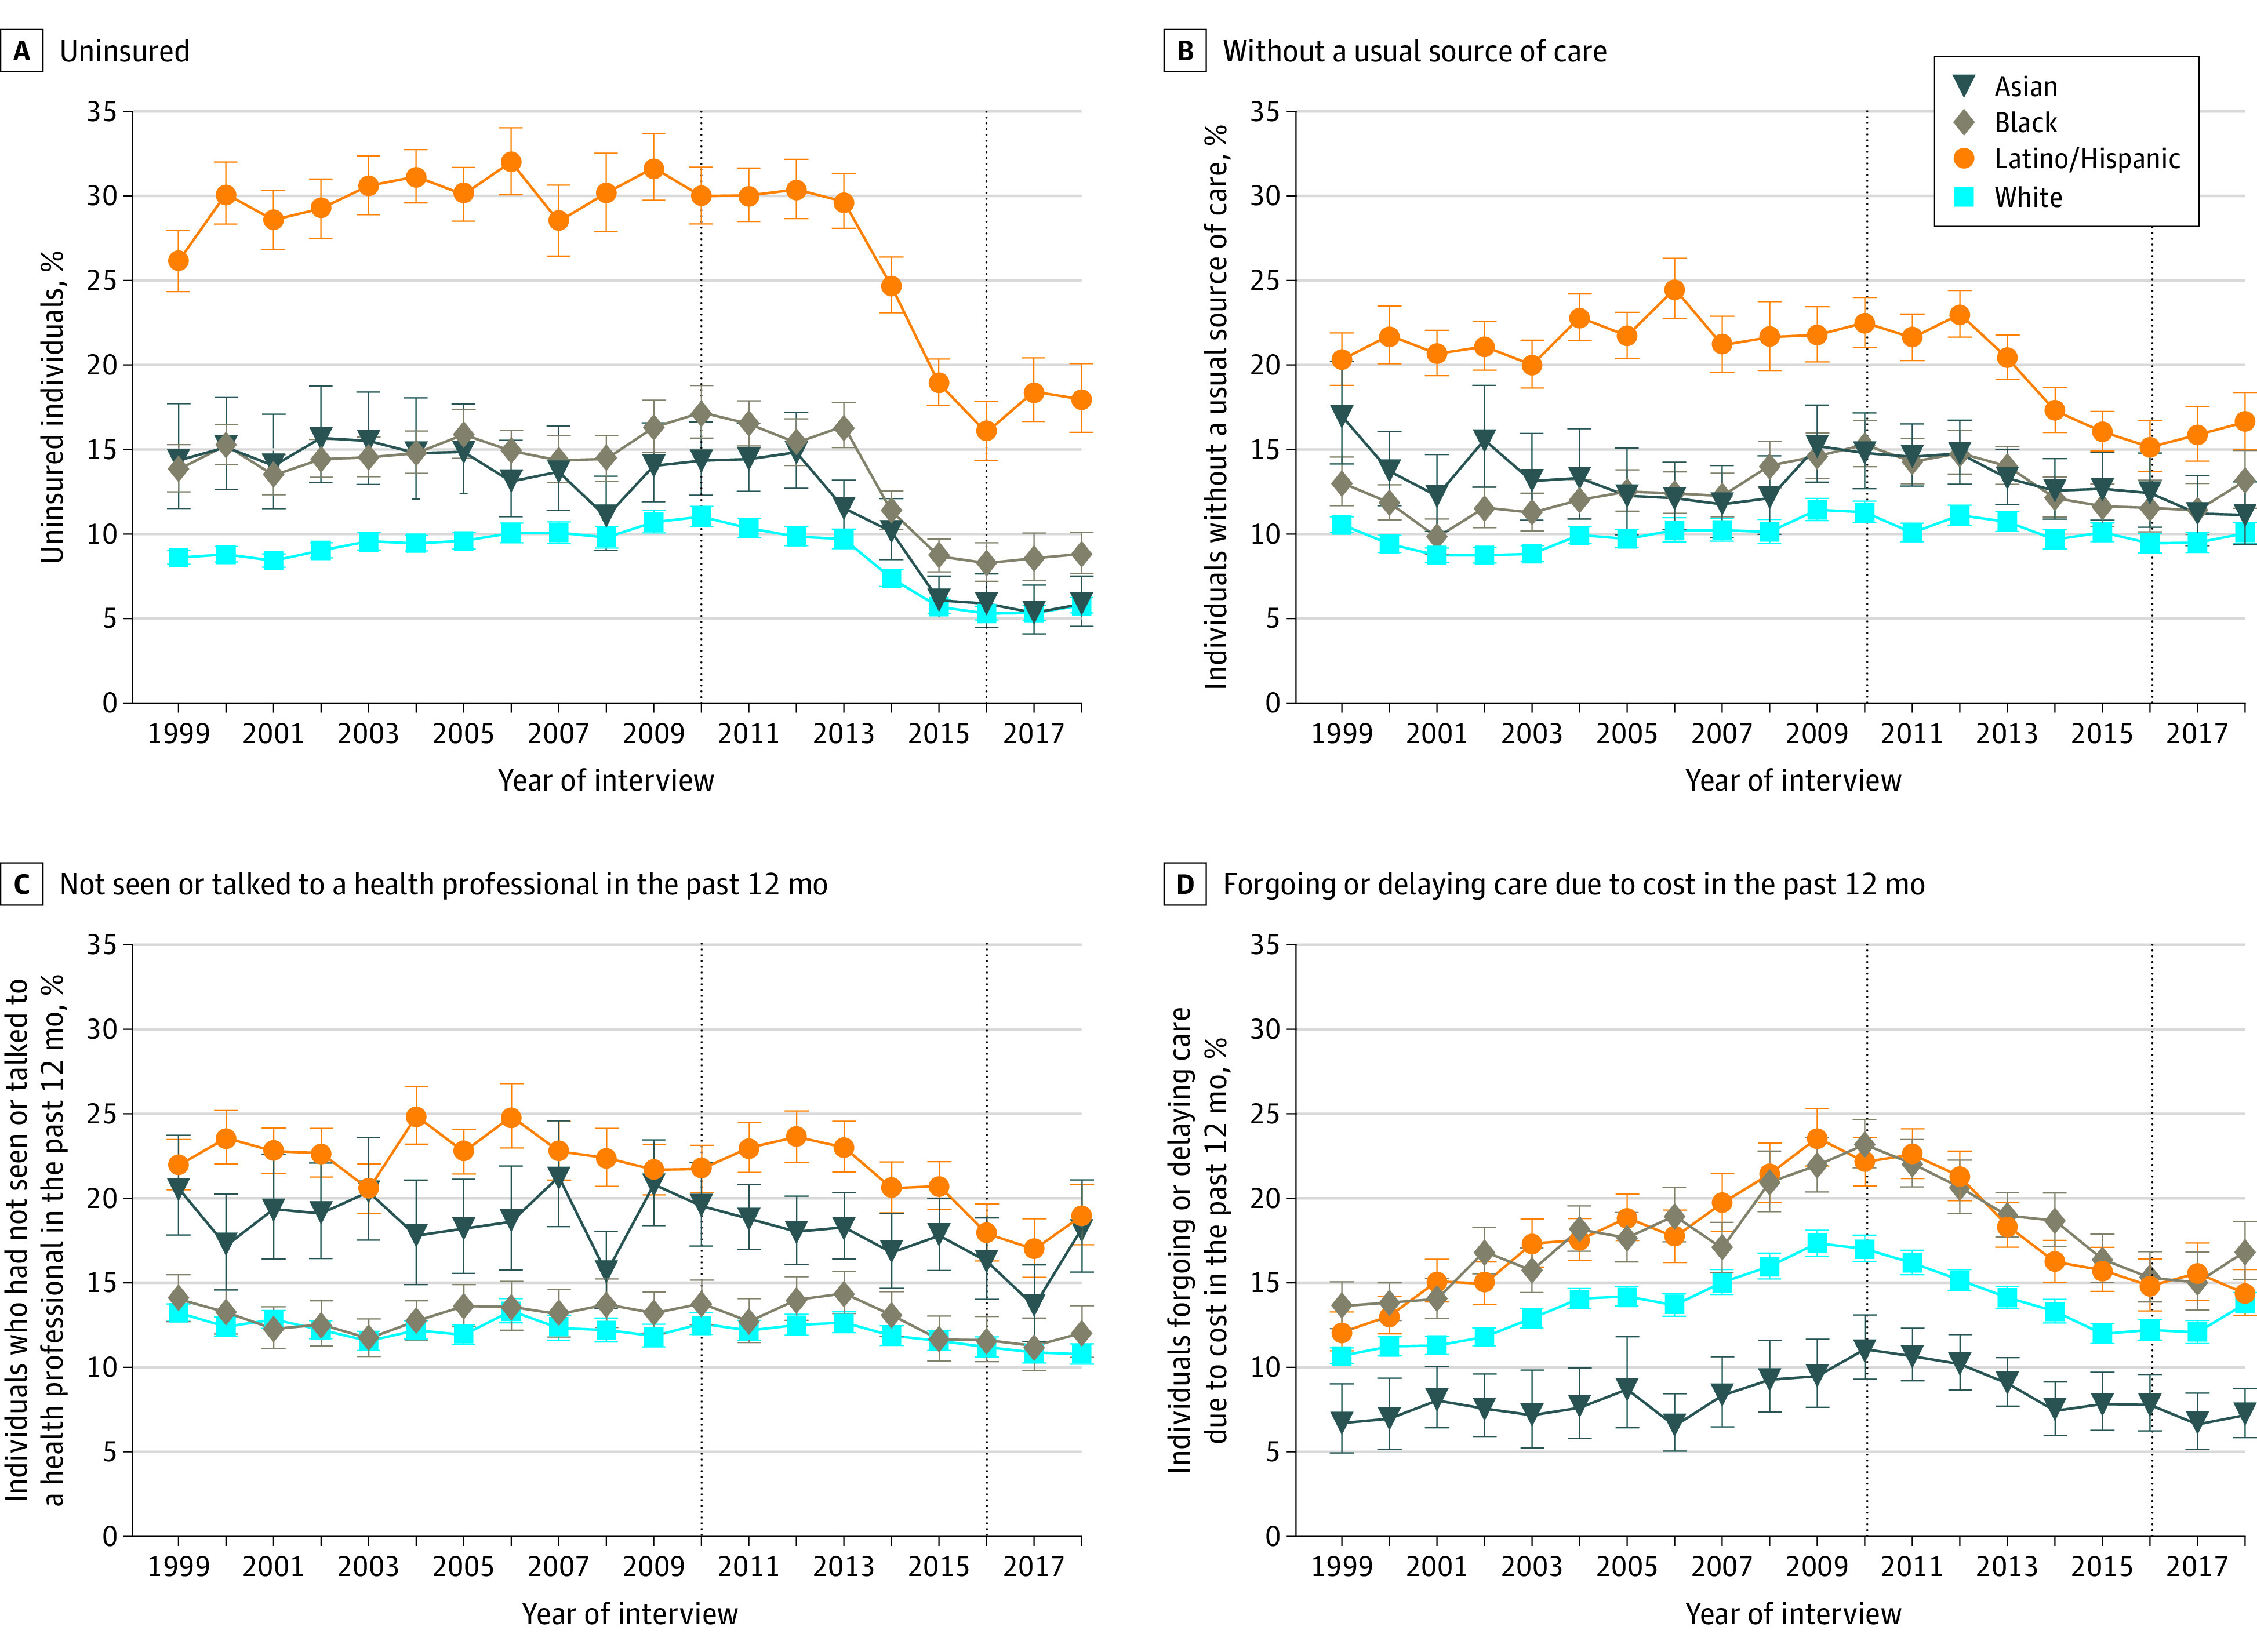
Data source is the National Health Interview Survey from years 1999 to 2018. Rates are adjusted for age, sex, and US region using logistic regression, with 95% CIs shown with error bars. Definitions of each outcome are shown in Study Outcomes in the Methods section. The median annual numbers of adults included in the study by race and ethnicity were 1301 (IQR, 911-1815) non-Hispanic Asian, 4355 (IQR, 3843-4589) non-Hispanic Black, 5325 (IQR, 4212-5603) Latino/Hispanic, and 20 290 (IQR, 16 919-20 961) non-Hispanic White. The annual number and weighted proportion of individuals included in the study population are shown in eFigure 1 in the Supplement. For these measures, rather than assuming a monotonic relationship between time and outcome rates, time was modeled as a linear spline with knots at 2010 and 2016 (dotted vertical lines) to reflect the observed inflection points of foregone or delayed medical care due to cost and health insurance coverage. Of note, the Affordable Care Act was enacted in March 2010. The annualized rate of change of each outcome during each of the 3 time periods is presented in eTable 8 in the Supplement. The income-stratified results for these measures are presented in eFigure 6 in the Supplement.
No Usual Source of Care
The estimated percentage of people reporting being without a usual source of care in 1999 was 17.0% (95% CI, 14.2%-20.2%) among Asian individuals, 13.0% (95% CI, 11.7%-14.6%) among Black individuals, 20.3% (95% CI, 18.8%-21.9%) among Latino/Hispanic individuals, and 10.6% (95% CI, 10.1%-11.0%) among White individuals (Figure 3B; eTable 10A in the Supplement). Between 1999 and 2018, the estimated prevalence of people without a usual source of care decreased significantly for Asian and Latino/Hispanic individuals (P = .001 and P = .002, respectively), but not for Black and White individuals (P = .92 and P = .20, respectively) (Table 2). The estimated difference between White and Asian and Latino/Hispanic individuals significantly decreased (−5.3 points [95% CI, −9.0 to −1.7; P = .004] and −3.2 points [95% CI, −5.6 to −0.7; P = .01], respectively) (Table 3). However, in 2018, a significantly higher estimated proportion of Latino/Hispanic individuals did not have a usual source of care compared with White individuals, both overall and by income level (P < .001 among the overall and middle and high–income groups, and P = .002 among low-income groups) (Table 3; eFigure 6B and eTable 10B in the Supplement).
Not Seen or Talked to a Health Professional in the Past Year
The estimated percentage of people who reported not having seen or talked to a health professional in the past year in 1999 was 20.6% (95% CI, 17.8%-23.7%) among Asian individuals, 14.0% (95% CI, 12.7%-15.5%) among Black individuals, 21.9% (95% CI, 20.5%-23.4%) among Latino/Hispanic individuals, and 13.2% (95% CI, 12.7%-13.7%) among White individuals (Figure 3C; eTable 11A in the Supplement). The differences between White and Asian, Black, and Latino/Hispanic individuals did not significantly change during the study period (P = .97, P = .68, and P = .69, respectively) (Table 3). In 2018, Asian and Latino/Hispanic individuals with low income had the highest estimated percentage of individuals who did not see a health professional in the past year (20.7% [95% CI, 15.8%-26.5%] and 22.4% [95% CI, 19.8%-25.2%], respectively), whereas middle and high–income Black and White individuals had the lowest (10.0% [95% CI, 8.2%-12.1%] and 9.6% [95% CI, 9.0%-10.2%], respectively) (eFigure 6C and eTable 11B in the Supplement).
Foregone or Delayed Medical Care Due to Cost
In 1999, the estimated percentage of people who reported foregone or delayed medical care due to cost was 6.7% (95% CI, 5.0%-9.0%) among Asian individuals, 13.6% (95% CI, 12.3%-15.1%) among Black individuals, 12.1% (95% CI, 11.0%-13.3%) among Latino/Hispanic individuals, and 10.7% (95% CI, 10.2%-11.2%) among White individuals (Figure 3D; eTable 12A in the Supplement). From 1999 to 2018, the estimated prevalence of foregone or delayed care due to cost increased among Black, Latino/Hispanic, and White individuals (P = .004, P = .01, and P < .001, respectively) (Table 2); however, there was no statistically significant change in the estimated differences between racial and ethnic groups (P ≥ .05 for each group) (Table 3). During this time, Black and White individuals with low income had the highest estimated rates of foregone or delayed care due to cost (21.0% [95% CI, 18.7%-23.4%] and 21.1% [95% CI, 19.9%-22.4%] in 1999 and 21.6% [95% CI, 19.2%-24.3%] and 24.7% [95% CI, 23.0%-26.3%] in 2018, respectively), while Asian individuals with middle and high income had the lowest (4.5% [95% CI, 3.1%-6.5%] in 1999 and 5.9% [95% CI, 4.6%-7.7%] in 2018) (eFigure 6D and eTable 12B in the Supplement).
The trends in race and ethnicity differences in these measures of health care access, utilization, and affordability using the autoregressive models were consistent with the main analyses (eTable 13 in the Supplement).
Discussion
In this US nationally representative serial cross-sectional study, from 1999 to 2018, racial and ethnic differences in health status, access, and affordability improved in some subgroups, but largely persisted. The main findings were for health status, which had significant differences between Black and White individuals that persisted over time.
Self-rated health status is associated with comorbidity burden—including physical functional status—and lower self-rated health is associated with increased mortality.25,26 Research has shown that Black, Latino/Hispanic, and American Indian individuals have worse self-rated health.27 The current study found that between 1999 and 2018, there had been no significant decrease in the percentage of people reporting poor or fair health across any racial and ethnic subgroup, and Black individuals consistently had the highest rates. Odlum and colleagues,28 with a different analysis that used the Behavioral Risk Factor Surveillance System from 1999 to 2018, had results that were broadly consistent although they did not examine income. These stagnant trends in self-reported health status prevalence and racial and ethnic differences, especially while health care costs are rising, are of concern.
Over the 20-year study period, functional limitations and severe psychological distress significantly increased for all groups. Though previous studies have described these trends by race and ethnicity, most have focused on shorter time frames, which limits detailed evaluation of the progress made. For example, Mojtabai et al29 found no significant trends in the percentage of people reporting severe psychological distress between 2001 and 2012, whereas Olfson et al30 reported a significant decline in severe psychological distress between 2004 and 2015.
Racial and ethnic differences in health care access and affordability were also noted in 2018, though there were some improvements in the racial and ethnic gaps over time. Even after the Affordable Care Act was implemented, affordability of health care appeared to have not substantially improved from what it was in 1999.
These findings may have important implications. Despite a wide variety of health care and social policies and markedly increased health care spending,31 health inequities persisted with modest evidence of progress. Structural factors in US society, including systemic racism and barriers associated with citizenship status, can contribute to such inequities.32,33,34,35 Other approaches to address historical racial and ethnic segregation and differences in income, education, and other nonmedical determinants of health in the US may be needed.
Limitations
This study has several limitations. First, this study was focused on the perspectives of those surveyed and did not include any other triangulating measures of health status, access, or affordability. Though these self-reported outcomes have been extensively used in previous studies,12,15,18,19,21,22 there are limited data indicating their validity. Second, self-reports of health may be influenced by other factors, such as overall happiness. However, self-rated health has been shown to be a good predictor of morbidity, health care utilization, and mortality.15,36 Third, nonresponse rates could bias the results and the NHIS does not provide data on nonresponse rates stratified by race and ethnicity, though the NHIS has several strategies to mitigate the bias. Fourth, the study primarily focused on large racial and ethnic group categories and did not examine subgroups within the non-Hispanic Asian and the Latino/Hispanic groups, in which patterns could differ and whose distribution could have changed during the study period.37 Fifth, considering the number of statistical comparisons in this study, some of the significant associations may represent type I error.
Conclusions
In a serial cross-sectional survey study of US adults from 1999 to 2018, racial and ethnic differences in self-reported health status, access, and affordability improved in some subgroups, but largely persisted.
eMethods 1. National Health Interview Survey Response Rates, 1999 to 2018
eMethods 2. Details of Assessment of Study Outcomes
eMethods 3. Details Describing How This Study Meets the Standards for Publishing on Racial Health Inequities
eFigure 1. Race and Latino/Hispanic Ethnicity Distribution Among Adults in the US, National Health Interview Survey 1999-2018
eFigure 2. Trends in the Estimated Proportion of Individuals with Low Income Between 1999 and 2018, by Race and Latino/Hispanic Ethnicity
eFigure 3. Adjusted Overall Trends in Self-Reported Health Status, Functional Limitation, and Severe Psychological Distress and in Health Care Access, Utilization, and Affordability Measures, 1999–2018
eFigure 4. Adjusted Trends of Self-Reported Poor/Fair Health Status, Functional Limitation, and Severe Psychological Distress by Race, Latino/Hispanic Ethnicity, and Income, 1999–2018
eFigure 5. Adjusted Trends of Limitations in Physical Tasks and Social/Leisure Activities by Race and Latino/Hispanic Ethnicity, 1999–2018
eFigure 6. Adjusted Trends of Self-Reported Health Care Access, Utilization, and Affordability Measures by Race, Latino/Hispanic Ethnicity, and Income, 1999–2018
eTable 1. General Characteristics of the Study Population by Race and Latino/Hispanic Ethnicity in 1999–2000, 2008-2009, and 2017–2018
eTable 2. Distribution of the Missing Rates for Measures of Health Status and Health Care Access and Affordability Between 1999 and 2018
eTable 3. Adjusted Annual Prevalence of Poor/Fair Health Status by Race and Latino/Hispanic Ethnicity, 1999-2018
eTable 4. Comparison of our Age-Adjusted Trends in Poor/Fair Health Status, Estimated Using Direct Standardization, with Estimates from the National Center for Health Statistics Report
eTable 5. Adjusted Annual Prevalence of Functional Limitation by Race and Latino/Hispanic Ethnicity, 1999-2018
eTable 6. Adjusted Annual Prevalence of Severe Psychological Distress by Race and Latino/Hispanic Ethnicity, 1999-2018
eTable 7. Adjusted Trends in Poor/Fair Health Status, Functional Limitation, and Severe Psychological Distress, by Race and Latino/Hispanic Ethnicity, Using Autoregressive Model, 1999–2018
eTable 8. Adjusted Annual Prevalence of Lack of Health Insurance by Race and Latino/Hispanic Ethnicity, 1999-2018
eTable 9. Adjusted Annualized Rate of Change in the Prevalence of Measures of Health Status and Health Care Access, Utilization, and Affordability by Race, Latino/Hispanic Ethnicity, and Income
eTable 10. Adjusted Annual Prevalence of Lack of a Usual Source of Care by Race and Latino/Hispanic Ethnicity, 1999-2018
eTable 11. Adjusted Annual Prevalence of No Health Care Utilization in the Past Year by Race and Latino/Hispanic Ethnicity, 1999-2018
eTable 12. Adjusted Annual Prevalence of Foregone or Delayed Medical Care Due to Cost by Race and Latino/Hispanic Ethnicity, 1999-2018
eTable 13. Adjusted Trends in the Prevalence and Racial/Ethnic Differences of Health Care Access, Utilization, and Affordability Measures by Race and Latino/Hispanic Ethnicity, Using Autoregressive Model, 1999–2018
eReferences
References
- 1.US Department of Health and Human Services . Report of the Secretary’s Task Force on Black and Minority Health. 1985. Accessed March 30, 2021. https://resource.nlm.nih.gov/8602912
- 2.US Department of Health and Human Services . About the Office of Minority Health. Accessed March 30, 2021. https://www.minorityhealth.hhs.gov/omh/browse.aspx?lvl=1&lvlid=1
- 3.Koh HK, Graham G, Glied SA. Reducing racial and ethnic disparities: the action plan from the department of health and human services. Health Aff (Millwood). 2011;30(10):1822-1829. doi: 10.1377/hlthaff.2011.0673 [DOI] [PubMed] [Google Scholar]
- 4.HealthyPeople.org . Disparities. Accessed March 30, 2021. https://www.healthypeople.gov/2020/about/foundation-health-measures/Disparities
- 5.Arias E, Xu J. United States life tables, 2018. Natl Vital Stat Rep. 2020;69(12):1-45. [PubMed] [Google Scholar]
- 6.Arias E. United States life tables, 2017. Natl Vital Stat Rep. 2019;68(7):1-66. [PubMed] [Google Scholar]
- 7.Cunningham TJ, Croft JB, Liu Y, Lu H, Eke PI, Giles WH. Vital signs: racial disparities in age-specific mortality among Blacks or African Americans—United States, 1999–2015. MMWR Morb Mortal Wkly Rep. 2017;66(17):444-456. doi: 10.15585/mmwr.mm6617e1 [DOI] [PMC free article] [PubMed] [Google Scholar]
- 8.Centers for Disease Control & Prevention . National Center for Health Statistics: about the National Health Interview Survey. Accessed March 30, 2021. https://www.cdc.gov/nchs/nhis/about_nhis.htm
- 9.Dubay LC, Lebrun LA. Health, behavior, and health care disparities: disentangling the effects of income and race in the United States. Int J Health Serv. 2012;42(4):607-625. doi: 10.2190/HS.42.4.c [DOI] [PubMed] [Google Scholar]
- 10.Blewett LA, Rivera Drew JA, King ML, Williams KCW. IPUMS health surveys: National Health Interview Survey, version 6.4. Data set. IPUMS, 2019.
- 11.US Census Bureau . People in primary families by family structure, age, and sex. Accessed March 30, 2021. https://www.census.gov/data/tables/time-series/demo/income-poverty/cps-pov/pov-02.html#par_textimage_30
- 12.Caraballo C, Valero-Elizondo J, Khera R, et al. Burden and consequences of financial hardship from medical bills among nonelderly adults with diabetes mellitus in the United States. Circ Cardiovasc Qual Outcomes. 2020;13(2):e006139. doi: 10.1161/CIRCOUTCOMES.119.006139 [DOI] [PubMed] [Google Scholar]
- 13.Centers for Disease Control and Prevention . National Health Interview Survey, 1997-2018. Accessed March 30, 2021. https://www.cdc.gov/nchs/nhis/1997-2018.htm
- 14.Boyd RW, Lindo EG, Weeks LD, McLemore MR. On racism: a new standard for publishing on racial health inequities. Health Affairs Blog. Published July 2, 2020. Accessed March 30, 2021. https://www.healthaffairs.org/do/10.1377/hblog20200630.939347/full/
- 15.Idler EL, Benyamini Y. Self-rated health and mortality: a review of twenty-seven community studies. J Health Soc Behav. 1997;38(1):21-37. doi: 10.2307/2955359 [DOI] [PubMed] [Google Scholar]
- 16.Nagi SZ. An epidemiology of disability among adults in the United States. Milbank Mem Fund Q Health Soc. 1976;54(4):439-467. doi: 10.2307/3349677 [DOI] [PubMed] [Google Scholar]
- 17.Nagi SZ, Marsh J. Disability, health status, and utilization of health services. Int J Health Serv. 1980;10(4):657-676. doi: 10.2190/81FB-J0X4-R9EY-06PV [DOI] [PubMed] [Google Scholar]
- 18.Ryerson B, Tierney EF, Thompson TJ, et al. Excess physical limitations among adults with diabetes in the US population, 1997-1999. Diabetes Care. 2003;26(1):206-210. doi: 10.2337/diacare.26.1.206 [DOI] [PubMed] [Google Scholar]
- 19.Kessler RC, Barker PR, Colpe LJ, et al. Screening for serious mental illness in the general population. Arch Gen Psychiatry. 2003;60(2):184-189. doi: 10.1001/archpsyc.60.2.184 [DOI] [PubMed] [Google Scholar]
- 20.National Center for Health Statistics, Centers for Disease Control and Prevention . National Health Interview Survey: evaluation and editing of health insurance data. Accessed March 30, 2021. https://www.cdc.gov/nchs/nhis/health_insurance/hi_eval.htm
- 21.Terlizzi EP, Cohen RA. Differences in select measures of health care access, utilization, and financial burden by urbanicity, 2017. Natl Health Stat Report. 2019;(134):1-13. [PubMed] [Google Scholar]
- 22.Cohen RA, Bloom B. Access to and utilization of medical care for young adults ages 20-29 years: United States, 2008. NCHS Data Brief. 2010;(29):1-8. [PubMed] [Google Scholar]
- 23.King G, Tomz M, Wittenberg J. Making the most of statistical analyses: improving interpretation and presentation. Am J Pol Sci. 2000;44(2):347-361. doi: 10.2307/2669316 [DOI] [Google Scholar]
- 24.Division of Health Interview Statistics, National Center for Health Statistics . Multiple imputation of family income and personal earnings in the National Health Interview Survey: methods and examples. August 2019. Accessed March 30, 2021. https://nhis.ipums.org/nhis/resources/tecdoc18.pdf
- 25.Ganna A, Ingelsson E. 5-Year mortality predictors in 498,103 UK Biobank participants: a prospective population-based study. Lancet. 2015;386(9993):533-540. doi: 10.1016/S0140-6736(15)60175-1 [DOI] [PubMed] [Google Scholar]
- 26.Stewart AL, Greenfield S, Hays RD, et al. Functional status and well-being of patients with chronic conditions: results from the Medical Outcomes Study. JAMA. 1989;262(7):907-913. doi: 10.1001/jama.1989.03430070055030 [DOI] [PubMed] [Google Scholar]
- 27.Liao Y, Bang D, Cosgrove S, et al. ; Division of Adult and Community Health, National Center for Chronic Disease Prevention and Health Promotion; Centers for Disease Control and Prevention (CDC) . Surveillance of health status in minority communities: Racial and Ethnic Approaches to Community Health Across the US (REACH US) risk factor survey, United States, 2009. MMWR Surveill Summ. 2011;60(6):1-44. [PubMed] [Google Scholar]
- 28.Odlum M, Moise N, Kronish IM, et al. Trends in poor health indicators among Black and Hispanic middle-aged and older adults in the United States, 1999-2018. JAMA Netw Open. 2020;3(11):e2025134-e2025134. doi: 10.1001/jamanetworkopen.2020.25134 [DOI] [PMC free article] [PubMed] [Google Scholar]
- 29.Mojtabai R, Jorm AF. Trends in psychological distress, depressive episodes and mental health treatment-seeking in the United States: 2001-2012. J Affect Disord. 2015;174:556-561. doi: 10.1016/j.jad.2014.12.039 [DOI] [PubMed] [Google Scholar]
- 30.Olfson M, Wang S, Wall M, Marcus SC, Blanco C. Trends in serious psychological distress and outpatient mental health care of US Adults. JAMA Psychiatry. 2019;76(2):152-161. doi: 10.1001/jamapsychiatry.2018.3550 [DOI] [PMC free article] [PubMed] [Google Scholar]
- 31.Dieleman JL, Cao J, Chapin A, et al. US health care spending by payer and health condition, 1996-2016. JAMA. 2020;323(9):863-884. doi: 10.1001/jama.2020.0734 [DOI] [PMC free article] [PubMed] [Google Scholar]
- 32.Cogburn CD. Culture, race, and health: implications for racial inequities and population health. Milbank Q. 2019;97(3):736-761. doi: 10.1111/1468-0009.12411 [DOI] [PMC free article] [PubMed] [Google Scholar]
- 33.Macintosh T, Desai MM, Lewis TT, Jones BA, Nunez-Smith M. Socially-assigned race, healthcare discrimination and preventive healthcare services. PLoS One. 2013;8(5):e64522. doi: 10.1371/journal.pone.0064522 [DOI] [PMC free article] [PubMed] [Google Scholar]
- 34.Phelan JC, Link BG. Is racism a fundamental cause of inequalities in health? Annu Rev Sociol. 2015;41(1):311-330. doi: 10.1146/annurev-soc-073014-112305 [DOI] [Google Scholar]
- 35.Alcalá HE, Chen J, Langellier BA, Roby DH, Ortega AN. Impact of the Affordable Care Act on health care access and utilization among Latinos. J Am Board Fam Med. 2017;30(1):52-62. doi: 10.3122/jabfm.2017.01.160208 [DOI] [PubMed] [Google Scholar]
- 36.DeSalvo KB, Fan VS, McDonell MB, Fihn SD. Predicting mortality and healthcare utilization with a single question. Health Serv Res. 2005;40(4):1234-1246. doi: 10.1111/j.1475-6773.2005.00404.x [DOI] [PMC free article] [PubMed] [Google Scholar]
- 37.Hoeffel EM, Rastogi S, Kim MO, Hasan S. The Asian population: 2010. US Department of Commerce, Economics and Statistics Administration, US Census Bureau. Published March 2021. Accessed March 30, 2021. https://www.census.gov/history/pdf/2010asian-122016.pdf
Associated Data
This section collects any data citations, data availability statements, or supplementary materials included in this article.
Supplementary Materials
eMethods 1. National Health Interview Survey Response Rates, 1999 to 2018
eMethods 2. Details of Assessment of Study Outcomes
eMethods 3. Details Describing How This Study Meets the Standards for Publishing on Racial Health Inequities
eFigure 1. Race and Latino/Hispanic Ethnicity Distribution Among Adults in the US, National Health Interview Survey 1999-2018
eFigure 2. Trends in the Estimated Proportion of Individuals with Low Income Between 1999 and 2018, by Race and Latino/Hispanic Ethnicity
eFigure 3. Adjusted Overall Trends in Self-Reported Health Status, Functional Limitation, and Severe Psychological Distress and in Health Care Access, Utilization, and Affordability Measures, 1999–2018
eFigure 4. Adjusted Trends of Self-Reported Poor/Fair Health Status, Functional Limitation, and Severe Psychological Distress by Race, Latino/Hispanic Ethnicity, and Income, 1999–2018
eFigure 5. Adjusted Trends of Limitations in Physical Tasks and Social/Leisure Activities by Race and Latino/Hispanic Ethnicity, 1999–2018
eFigure 6. Adjusted Trends of Self-Reported Health Care Access, Utilization, and Affordability Measures by Race, Latino/Hispanic Ethnicity, and Income, 1999–2018
eTable 1. General Characteristics of the Study Population by Race and Latino/Hispanic Ethnicity in 1999–2000, 2008-2009, and 2017–2018
eTable 2. Distribution of the Missing Rates for Measures of Health Status and Health Care Access and Affordability Between 1999 and 2018
eTable 3. Adjusted Annual Prevalence of Poor/Fair Health Status by Race and Latino/Hispanic Ethnicity, 1999-2018
eTable 4. Comparison of our Age-Adjusted Trends in Poor/Fair Health Status, Estimated Using Direct Standardization, with Estimates from the National Center for Health Statistics Report
eTable 5. Adjusted Annual Prevalence of Functional Limitation by Race and Latino/Hispanic Ethnicity, 1999-2018
eTable 6. Adjusted Annual Prevalence of Severe Psychological Distress by Race and Latino/Hispanic Ethnicity, 1999-2018
eTable 7. Adjusted Trends in Poor/Fair Health Status, Functional Limitation, and Severe Psychological Distress, by Race and Latino/Hispanic Ethnicity, Using Autoregressive Model, 1999–2018
eTable 8. Adjusted Annual Prevalence of Lack of Health Insurance by Race and Latino/Hispanic Ethnicity, 1999-2018
eTable 9. Adjusted Annualized Rate of Change in the Prevalence of Measures of Health Status and Health Care Access, Utilization, and Affordability by Race, Latino/Hispanic Ethnicity, and Income
eTable 10. Adjusted Annual Prevalence of Lack of a Usual Source of Care by Race and Latino/Hispanic Ethnicity, 1999-2018
eTable 11. Adjusted Annual Prevalence of No Health Care Utilization in the Past Year by Race and Latino/Hispanic Ethnicity, 1999-2018
eTable 12. Adjusted Annual Prevalence of Foregone or Delayed Medical Care Due to Cost by Race and Latino/Hispanic Ethnicity, 1999-2018
eTable 13. Adjusted Trends in the Prevalence and Racial/Ethnic Differences of Health Care Access, Utilization, and Affordability Measures by Race and Latino/Hispanic Ethnicity, Using Autoregressive Model, 1999–2018
eReferences