

Abstract
The PD-1 immune checkpoint-based therapy has emerged as a promising therapy strategy for treating the malignant brain tumor glioblastoma (GBM). However, patient response varies in clinical trials due in large to the tumor heterogeneity and immunological resistance in the tumor microenvironment. To further understand how mechanistically the niche interplay and competition drive anti-PD-1 resistance, we established an in-silico model to quantitatively describe the biological rationale of critical GBM-immune interactions, such as tumor growth and apoptosis, T cell activation and cytotoxicity, and tumor-associated macrophage (TAM) mediated immunosuppression. Such an in-silico experimentation and predictive model, based on the in vitro microfluidic chip-measured end-point data and patient-specific immunological characteristics, allowed for a comprehensive and dynamic analysis of multiple TAM-associated immunosuppression mechanisms against the anti-PD-1 immunotherapy. Our computational model demonstrated that the TAM-associated immunosuppression varied in severity across different GBM subtypes, which resulted in distinct tumor responses. Our prediction results indicated that a combination therapy co-targeting of PD-1 checkpoint and TAM-associated CSF-1R signaling could enhance the immune responses of GBM patients, especially those patients with mesenchymal GBM who are irresponsive to the single anti-PD-1 therapy. The development of a patient-specific in silico-in vitro GBM model would help navigate and personalize immunotherapies for GBM patients.
Keywords: Glioblastoma, Organ-on-a-Chip, computational biology, tumor microenvironment, immunotherapy
Graphical Abstract

Summary
A computational glioblastoma immuno-oncology model was established to systematically and quantitatively dissect the immunological mechanisms of resistance in the tumor microenvironment to PD-1 checkpoint blockade immunotherapy. Such an in-silico experimentation and predictive model, based on the in vitro microfluidic chip-measured end-point data and patient-specific immunological characteristics, would help navigate and personalize immunotherapies for glioblastoma patients.
1. Introduction
Programmed cell death protein-1 (PD-1) checkpoint blockade has been remarked as an emerging immunotherapy for glioblastoma (GBM), yet the therapeutic outcomes of this new therapy varied largely among patients in clinical trials.[1] The resistance to PD-1 blockade remains a significant challenge hindering its application in a broad range of malignancies.[2] Although mountains of researches have revealed distinct PD-1/Program death ligand-1 (PD-L1) expression,[3] molecular and immune-related profiles,[4] genetic mutations,[5] and epigenetic signatures,[6] among GBM patients, up to date, there is a lack of reliable biomarkers and an accurate methodology to predict patient response and uncover mechanisms underlying therapy resistance.[7] This difficulty stems from not only the limitations of conventional in vivo and in vitro systems in modeling human immune system, but also the intrinsic immune phenotypic “plasticity” and microenvironmental “heterogeneity” of the GBM brain tumor niche.[8]
GBM resistance to immunotherapy is governed by a heterogeneous immunosuppressive cellular hierarchy in the tumor microenvironment (TME) with high number of tumor-associated macrophages (TAMs)[9] but few infiltrating cytotoxic T lymphocytes (CTLs).[8c, 8d] The GBM-immune interactions facilitate multiple immunosuppression mechanisms, including presenting immune checkpoint molecules (e.g. PD-L1), secreting anti-inflammatory cytokines and consuming pro-inflammatory cytokines to suppress CTL function and immunotherapy efficacy.[8a–c] For example, a myriad of immunomodulatory cytokines, such as transforming growth factor beta (TGF-β) and colony-stimulating factor-1 (CSF-1) secreted by GBM tumors, were demonstrated to drive TAM polarization toward an immunosuppressive ‘M2-like’ phenotype, which thus suppressed CTL infiltration and as well the PD-1 monoclonal antibody affinity of CTLs.[9f, 10] Therefore, a systematic analysis of the cellular and molecular tumor-immune interactions and immunosuppression mechanisms in the GBM TME is of great significance to tackle the resistance of anti-PD-1 immunotherapy.
Clinical observations indicated that the outcome of anti-PD-1 immunotherapy is largely dependent on patients’ inherent TME which varies in different molecular subtypes of GBMs.[11] Animal models and patient explant cultures have been commonly used for study of cancer treatments,[12] yet they are not ideal for studying the complex and interactive TME in real time and modeling patient-specific immune responses to given immunotherapy. The recent development of cancer-on-a-chip microphysiological systems provides a new in vitro experimentation tool to recreate the complex microenvironment that governs tumor dynamics and test patient responses to the immunotherapies.[10b, 13] Despite these microfluidics-based in vitro models can provide biomimetic TMEs with better control over the variables involved, the predictive power of currently available in vitro models remains insufficient. To overcome these limitations, a possible solution is to combine experimental approaches especially these in vitro biomimetic models with quantitative mathematical modeling and computational techniques.[14]
Up to date, various in silico models have been developed to describe tumor-immune interactions using a system of differential equations and predict patient responses to emerging cancer therapies. Among these models, ordinary differential equations (ODEs) and partial differential equations (PDEs) are two commonly used computational modules, where the former focuses on time-dependent change of components in a spatially homogeneous system, while the latter is able to describe the spatial gradient of the components in the biological system with a spatial heterogeneity. For example, a least-squares method combined with a numerical differential equation solver was reported to model and compare the cellular killing dynamics between CD8+ T-cell-tumor and NK (Natural Killer) cell-tumor.[15] Similarly, a quantitative system pharmacology model achieved to predict that the number of effector T cells and regulatory T cells in the tumor and blood is a response predictor within non-small cell lung cancer (NSCLC) patients under treatment of neoadjuvant anti-PD-1 therapy.[16] Comparatively, Lai and Friedman developed a model consists of PDEs to test the effectiveness of combination therapy with GM-CSF-secreting cancer vaccine and anti-PD-1,[17] whereas Papadogiorgaki et al. modeled spatiotemporal evolution of avascular GBM regulated by microenvironmental components such as extracellular matrix and oxygen.[18] However, most of these computational modeling approaches examined only selected pathways in each study, thus they are incapable to systematically dissect the highly dynamic and coupled interactions among different cellular components and biological signals in TME underlying tumor resistance and the discrepancies between different genomic subtypes in response to immunotherapies. Moreover, the identification of potential responders, and the optimal combination and sequence for combination therapy for each patient remain a challenging work, thus necessitating a new framework to quantitatively predict patient responses to target therapies based on patient relevant biological information from in vivo and in vitro characterizations. Therefore, a hybrid “in silico-in vitro” modeling system built on the new immuno-oncology knowledge and patient-specific experimental data from rapid and personalized GBM-on-a-Chip testing can be implemented into clinical practice to improve immunotherapy outcomes significantly.
Herein, we established a new in silico immuno-oncology model of GBM tumor immune environment to understand how mechanistically the interplay between the tumor, CTL, and TAM drives the anti-PD-1 therapy resistance, by receiving parametric input from patient-specific immunological characteristics and measurements from in vitro GBM-on-a-Chip microphysiological system.[13a] In particular, microfluidic GBM-on-a-Chip study offers an alternative and rapid way to measure patient TME characteristics and dynamic tumor-immune interactions in vitro that are largely unavailable from the existing clinical diagnostics. The mathematical model was structured with a matrix of numerical differential equations to quantitatively describe the biological rationale of critical GBM-immune interactions, such as tumor growth and apoptosis, TAM phenotype plasticity and associated immunosuppression, T cell activation and cytotoxic efficiency, and regulatory or inhibitory mechanisms through different signal pathways in the TME. Such an in-silico experimentation and predictive model expanded the spectrum of in vitro chip studies to systematically analyze the TAM-associated immunosuppression mechanisms against CTL function, and quantitatively predict immunotherapy efficacy in different subtypes of GBMs. As a result, our model further indicated that a combination therapy co-targeting of PD-1 checkpoint and TAM-associated CSF-1R signaling enhanced the immune responses of GBM patients, especially those patients with mesenchymal GBM who are irresponsive to the single anti-PD-1 therapy. Thus, the patient-specific computational GBM model may enable an in-silico screening of new therapeutic targets and potential responders in a clinically relevant setting to help navigate the treatment for GBM patients.
2. Results
2.1. A mathematical model of anti-PD-1 immunotherapy in the GBM tumor immune niche
The GBM TME is an orchestration of cellular interactions between multiple cell types, such as GBM tumor, CTL, and TAM through associated PD-(L)1 checkpoint pathway, and immunosuppressive and immunoactive cytokine molecules.[8c] We herein established a computational model with a matrix of numerical differential equations as follows to in silico and quantitatively simulate these pathophysiological processes and immunological interactions underlying GBM therapy resistance (Figure 1A).
Figure 1. Establishing a computational GBM TME model for in silico modeling of anti-PD-1 immunotherapy.

(A) A schematic showing the key molecular and cellular components and their dynamic interactions in the computational GBM TME model. (B&C) Calibration of the computational model and comparison with experimental results for a proneural patient (GS7–11), in terms of CD154+CD8+ T cell activation (B) and GBM cell apoptosis rates (C). (D) The CD154+CD8+ T cell activation and (E) GBM cell apoptosis rates vary with the ratio of CD163+ M2 TAM, highlighting the critical regulatory role of M2 TAM in therapy resistance to PD-1 blockade. (F) VTME varies with the ratio of CD163+ M2 TAM in TME. (G) The T cell activation and (H) GBM cell apoptosis rates vary with VTME in anti-PD-1 therapy, and comparisons with experimental data. In B-F, simulation data represent the mean ± standard error of the mean (s.e.m.).
Tumor and T cell proliferation and apoptosis
The GBM tumor cell density nG in the system within a defined volume v is temporally regulated by the natural proliferation rate r1 and apoptosis rate l1 of tumor, as well as the tumor clearance via T cell killing. The natural tumor cell proliferation and apoptosis can be expressed as
| (1) |
It is assumed that CD8+ effector T cell only acquires the ability to killing tumor cell after being activated (CD154+CD8+) from the non-activated status. The densities of activated and non-activated CD8+ T cells in the TME are defined as na and nn, respectively. The natural proliferation rate of non-activated CD8+ T cell is extremely low and neglectable,[19] while T cell has an elevated proliferation rate after being activated.[20] Thus, the proliferation and apoptosis processes of activated and non-activated CD8+ T cells are expressed as follow
| (2) |
| (3) |
| (4) |
where the natural proliferation rate of activated T cell is r2, the apoptosis rates of activated and non-activated CD8+ T cells are l2 and l3, respectively.
Thus, the T cell-mediated cytotoxic process of GBM tumor can be expressed as
| (5) |
where e denotes the efficiency of elimination of each activated T cell in a unit of time and ncell is the total density all types of cells in TME. Here, we adopt a Michaelis-Menten elimination kinetics to describe the dynamics of T cell-mediated cytotoxicity,[16, 21] whereas the tumor cell killing rate increases as the densities of activated T cells na and of tumor cells nG increases in TME but will get saturated when nG is predominant in ncell.
T cell extravasation
T cell first extravasate from the blood vessel and then migrate into the TME to exert cytotoxic function to eliminate tumor cell. The influx of extravasated T cells into the TME nin is influenced by the TME immunosuppression that be expressed as
| (6) |
where VTME is the factor (0–1) representing the systematic immunosuppression from TME with an expression as described at the end of this section, mmax is the maximal mobility of T cell in the TME, Pmax is the maximal probability that a T cell extravasates without microenvironmental immunosuppression, nv is the T cell density in the vessel at specific time. We assume an exponential decay along time for T cell extravasation, with characteristic time τ representing the decay rate.
T cell activation
The activation of T cell can be compromised by the tumor-mediated PD-(L)1 pathway and immunosuppression in TME.[22] Taking into consideration the T cell activation from non-activated to activated status, the densities of activated and non-activated CD8+ T cells change as
| (7) |
| (8) |
| (9) |
where VPD(L)1 is the suppression function determined by the PD-(L)1 pathway (see below), kmax represents the maximal T cell activation rate with saturated antigen stimulation and immunoactivation, kTCR represents the extent of the interactions of between the T-cell and tumor cell though the T-cell receptor (TCR)–peptide-major histocompatibility complex (MHC).[23] The kTCR follows a Hill’s equation[24] with a Michaelis constant Katg (the tumor cell density to achieve half maximal interaction).
PD-(L)1 checkpoint pathway regulates T cell activation and cytotoxic function
A crucial mechanism by which cancer limits the host immune response is upregulating PD-L1 ligands on tumor cell and their ligation to PD-1 on tumor-specific CD8+ T cell,[25] where PD-1 or PD-L1 inhibitors can be adopted to modulate PD-(L)1 pathway to enhance CTL function. Therefore, the function level of PD-(L)1 pathway UPD(L)1 can be described as follow based on a Hill’s equation for basic mechanics of ligand-receptor binding:
| (10) |
| (11) |
where sPD1 is the expression level of PD-1 on each T cell, sPD1-ref is the saturated expression level of engaged PD-1 for the T cell to be completely suppressed, sPDL1 is the expression level of PD-L1 on each GBM cell, KD-PD(L)1 is the dissociation constant of PD-1/PD-L1 complex. PD-1 inhibitor, such as nivolumab, an antibody targeting PD-1 that exerts noncompetitive inhibition, can inhibit the PD-(L)1 pathway by reducing the PD-1 expression on T cell with a treatment effect of Tinh-PD1,[26] whereas cinh-PD1 is the concentration of PD-1 inhibitor, and KD-inh-PD1 is the dissociation constant of PD-1/PD-1 inhibitor complex.
Thus, VPD(L)1, the T cell suppression function determined by the function level of PD-(L)1 pathway can be expressed as
| (12) |
TAM polarization dynamics
TAM is a critical immunosuppressive cellular component in GBM TME regulating CTL function and tumor apoptosis. Generally, naïve macrophage (M0) can be polarized into two functional groups: M1 macrophages that are classically activated to a pro-inflammatory state to promote host immune defense, and M2 macrophages that are alternatively activated to a more regulatory and anti-inflammatory state to dampen immune response.[27] Such a lineage plasticity of macrophage by adaption to microenvironmental cues is the key regulator of immunological response during immunotherapy.[28] For example, the presence of CD163+ M2 TAM is known to induce immunosuppression in the GBM niche, which is related to poor prognosis and therapy resistance.[9a].
The natural proliferation and apoptosis rates of macrophage is extremely low,[29] thus the densities of M1 macrophage nm1 and M2 macrophage nm2 in the TME are assumed to be only determined by the extent of macrophage polarization. GBM tumor is known to secrete CSF-1 to drive TAM polarization toward an immunosuppressive M2 phenotype in the TME.[10b, 30] The administration of CSF-1R inhibitor, such as BLZ945, can reduce the functional level of CSF-1R on TAM and convert macrophages from M2 to M1 status.[31] The function level of CSF-1(R) pathway UCSF1(R) is modeled using a Hill’s equation as
| (13) |
| (14) |
where sCSF1R is the expression level of CSF-1R on each TAM cell, sCSF1R-ref is the saturated expression level of CSF-1R on a TAM cell, cCSF1 is the concentration of CSF-1 in TME, KCSF1(R) is the concentration of CSF-1 to activate the CSF-1(R) pathway to half-maximal level. The administration of CSF-1R noncompetitive inhibitor BLZ945 reduces functional level of CSF-1R on TAM with the treatment effect of Tinh-CSF1R, whereas cinh-CSF1R is the concentration of CSF-1R inhibitor, and KD-inh-CSF1R is the dissociation constant of CSF1/CSF1R inhibitor complex. So, the variation of M1 and M2 TAMs can be expressed as
| (15) |
| (16) |
where nm0 is the density of M0 macrophage, k0–1 and k0–2 are the constant conversion rates from M0 to M1 and M2 macrophage respectively, k1–2 is the constant conversion rate from M1 to M2 macrophage, and k2–1 is the constant conversion rate from M2 to M1 macrophage.
It is presumed that the TAMs have fully polarized to M1 or M2 macrophages and the conversion between M1/M2 polarizations in the TME have already achieved equilibrium at the time of administration of immunotherapy, we thus keep UCSF1(R) a constant to suggest a static correspondence between M1/M2 polarization ratio and CSF-1 concentration. So nm1 and nm2 are expressed as
| (17) |
| (18) |
| (19) |
where nmtotal is the total density of M1 and M2 macrophages in TME.
TAM-mediated immunosuppression in TME affects T cell cytotoxic function
The immunosuppression level in the GBM TME is orchestrated by density and phenotype of TAM and its associated cytokine environments, which in turn affects the CTL function.[32] Immunosuppressive cytokines like TGF-β and interleukin 10 (IL-10) are mainly secreted by M2 TAMs and GBM cells, while the immunoactive cytokines like tumor necrosis factor alpha (TNF-α) and interferon gamma (IFN-γ) come from activated T cells and/or M1 TAMs.[33] In particular, TGF-β would suppress T-cell function while CSF-1 can promote M2-like polarization of TAM. Similarly, cytotoxic related cytokines, TNF-α and INF-γ secreted by T-cell to kill tumor cells were chosen as the immunoactive cytokines.[10b, 13a–c] Thus, the concentrations of TGF-β, IL-10, TNF-α, and IFN-γ are modeled as
| (20) |
| (21) |
| (22) |
| (23) |
where k3 and k4 are basic secretion coefficients of TGF-β from M2 TAM and tumor cell, respectively. As well, k5 and k6 are correspondingly secretion coefficients of IL-10. In addition, k7 and k8 are secretion coefficients of TNF-α from M1 TAM and activated T cell, respectively. Finally, k9 is defined as the secretion coefficient of IFN-γ from activated T cell.
Based on above discussion and taking the overall effects of M2 TAM and cytokines into consideration, we hence define the immunosuppression factor of TME VTME as
| (24) |
where ci and cj are the concentrations of immunosuppressive (TGF-β and IL-10) and immunoactive (TNF-α and IFN-γ) cytokines, respectively; wm2, wi, wm1, wj are weights of M2 macrophages, immunosuppressive cytokines, M1 macrophages, and immunoactive cytokines; Km2, Ki, Km1 and Kj are Michaelis constants representing the half-saturation suppression number density of corresponding macrophages and cytokines.
2.2. In silico modeling of anti-PD-1 therapy based on an in vitro GBM TME model
We first fitted the mathematical model with experimental data from our recent GBM-on-a-Chip study[13a] to determine the values of parameters in the above equations (see details in Methods). The GBM-on-a-Chip study dissected the immunological resistance mechanisms underlying anti-PD-1 therapy using GBM cells derived from three different molecular subtypes (proneural, classical, and mesenchymal) characterized by genomic, transcriptomic, and DNA methylation data.[13a] In the in vitro study, biomimetic TMEs including the vascular network, patient-derived GBM tumor cells and TAMs were first constructed and cultured for 3 days, then CD8+ T cells and PD-1 inhibitor (nivolumab) were added and the endpoint data of tumor response to the therapy were collected 6 days after experiments. Along this in vitro protocol, the on-chip experimental data of 6 patients of these three GBM subtypes (2 patients for each subtype) were used to calibrate the mathematical model. The parameters in the model were obtained from references or by fitting procedure with the least square method to minimize the residual (see details in Methods). Because of the heterogeneity across different GBM subtypes, parameters related to tumor cell were considered distinct among three GBM subtypes and specifically fitted for each subtype.
We adopted the computational model to simulate the time-dependent behaviors of T cell activation characterized by increased CD154 expression and disease remission by T cell induced tumor apoptosis with and without treatment of PD-1 blockade for a representative patient (GS7–11, proneural) at a time course of 7 days in line with the on-chip study. The simulation results showed that both the T cell activation and the GBM cell apoptosis rates were significantly enhanced with the PD-1 inhibition, which were consistent with the experimental data (Figure 1B–C). In addition, based on the simulation results obtained from all three GBM subtypes, we found that with anti-PD-1 therapy, the T cell activation and GBM cell apoptosis rates were strongly influenced by the presence of TAM, which were decreased as M2 TAM increases, which were consistent with our on-chip study (Figure 1D–E). Notably, the three GBM subtypes demonstrated heterogeneous responses to anti-PD-1 therapy, where proneural GBM had a low ratio of M2 TAM, high ratios of CD154+CD8+ T cell activation and GBM cell apoptosis, classical GBM had intermediate ratios of M2 TAM, T cell activation and GBM cell apoptosis, and mesenchymal GBM had a high ratio of M2 TAM, low ratios of T cell activation and GBM cell apoptosis. These results together indicated that the immunosuppression induced by M2 TAM may be the critical factor regulating tumor resistance to anti-PD-1 therapy.
To better understand the TAM-associated resistance mechanisms, we studied the correlations between the systematic TME immunosuppression factor VTME as defined in Eqn. (24) and the ratio CD163+ M2 TAM in TME and found that VTME increased with the ratio CD163+ M2 TAM (Figure 1F). As a result, both the T cell activation and GBM cell apoptosis rates decreased as VTME increased (Figure 1G–H). Notably, the three GBM subtypes demonstrated heterogeneous responses to anti-PD-1 therapy, where proneural GBM had a relatively lower VTME and higher T cell activation and GBM apoptosis rates, classical GBM had an intermediate VTME and T cell activation and GBM apoptosis rates, and mesenchymal GBM had a higher VTME and lower T cell activation and GBM apoptosis rates, confirming the different extent of immunosuppression across these three GBM subtypes that were responsible for their varied therapeutic responses. Altogether, it indicates that the level of immunosuppression in TME, defined as VTME in our model, can be used as a general factor to describe the overall effect of TME on immunotherapies and determine the treatment outcomes for specific GBM patients.
2.3. In silico experimentation to reveal mechanisms of resistance to PD-1 therapy
In order to study the effects of different cellular and molecular regulatory factors in the GBM TME on anti-PD-1 therapy, we first performed a parameter sensitivity analysis for our model (Figure 2A). To this end, we in-silico tuned the individual variables by +/− 1% around a median value and quantify the level of changes in GBM cell apoptosis to determine their impact on the treatment outcome. Among all the parameters (Supplemental Figure S1), some most sensitive factors were selected (Figure 2A). The parameter sensitivity analysis showed that the therapy is mostly sensitive to the T cell properties such as the killing rate e, the growth rate of T cells r2, and the density of T cell added in the system nT, and GBM tumor associated-factors including the intrinsic GBM growth rate r1 and the relative expression level of PD-L1 on tumor cell sPDL1, as well as the TAM immunosuppression factors such as CSF1R, TGF-β and IL-10 cytokines. Such factors will be analyzed to determine their effects on the heterogeneity of tumor responses and resistance to the PD-1 checkpoint blockade.
Figure 2. In silico experimentation to evaluate the roles of key TME components in regulating anti-PD-1 therapy response.
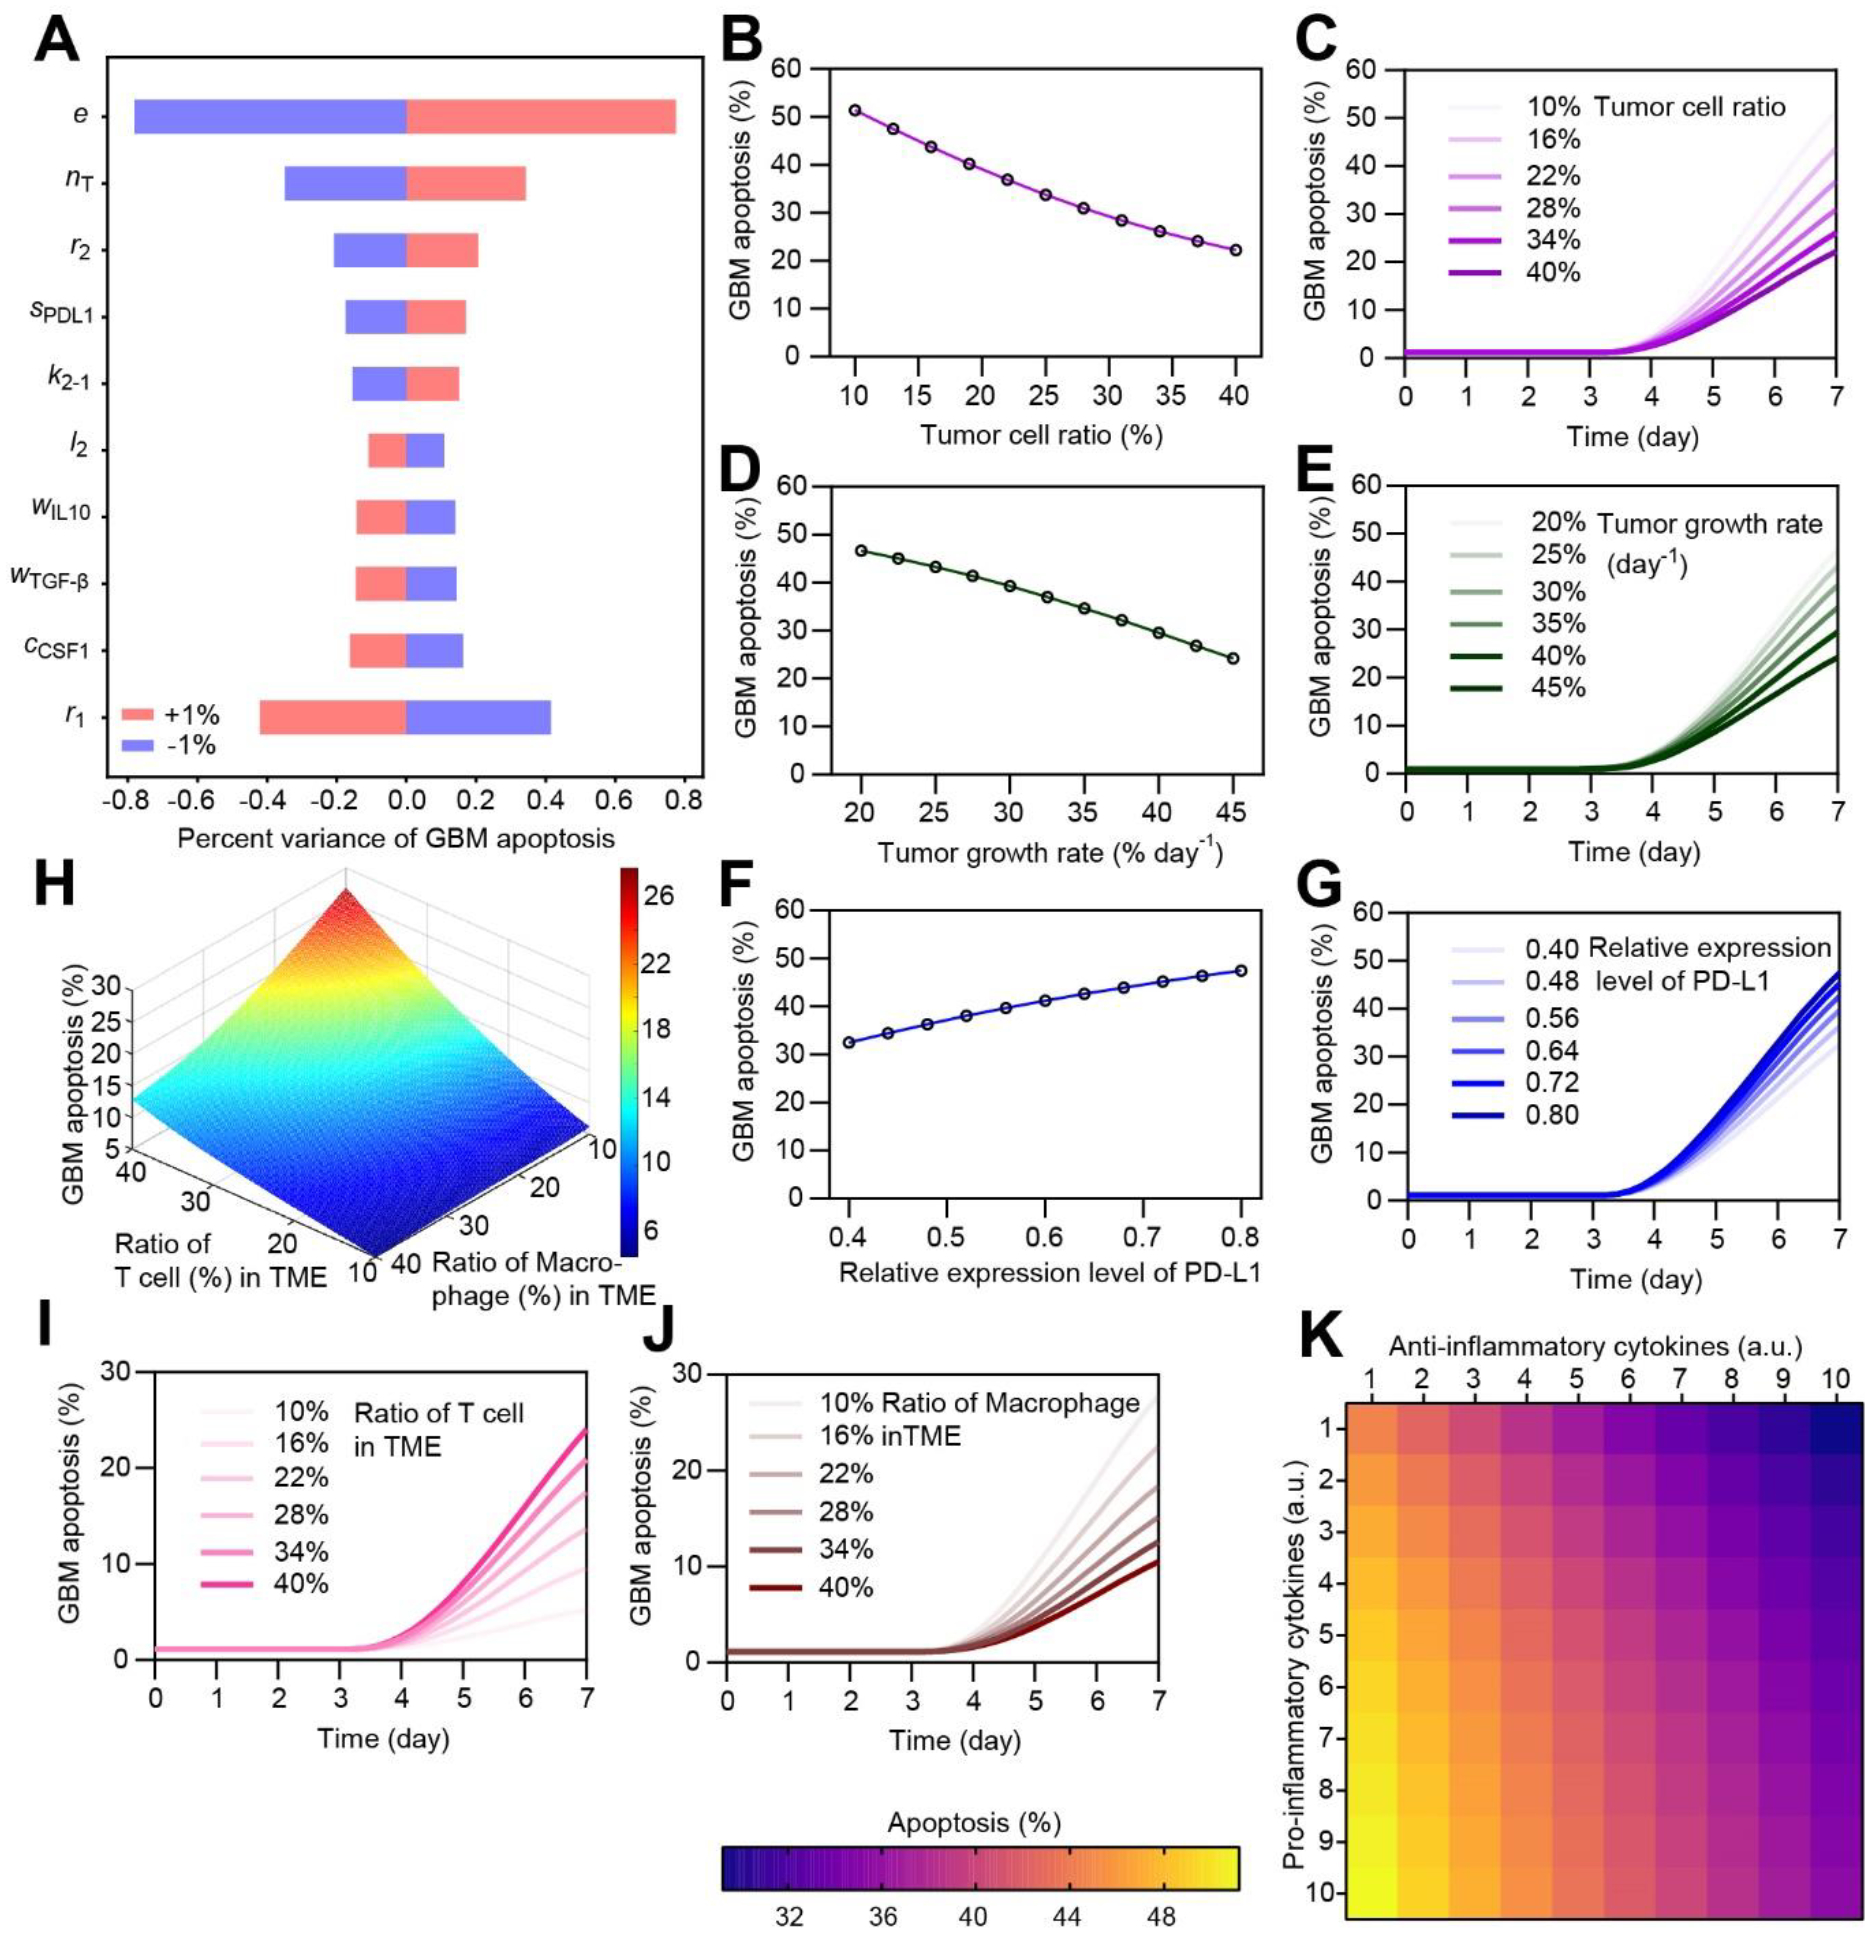
(A) Sensitivity analysis of key model parameters in regulating anti-PD-1 response. (B&C) Variation of GBM cell apoptosis rate as the initial ratio of T cell in TME (among tumor cell, T cell and macrophage) changes. (D&E) Variation of GBM cell apoptosis rate as the growth rate of tumor cell changes. (F&G) Variation of GBM cell apoptosis rate as the relative expression level of PD-L1 on GBM changes, with a same control level. (H-J) Variation of GBM cell apoptosis rate as the ratio of T cell and macrophage in TME changes. (K) Variation of GBM cell apoptosis rate as the amount of anti- and pro-inflammatory cytokines in TME changes (1–10 fold change).
In general, the efficacy of anti-PD-1 therapy is significantly influenced by the properties of GBM tumor. With the proposed model, different GBM-associated factors concerning the mechanisms of resistance to PD-1 blockade were thus systematically investigated in silico (Figure 2B–K). We varied the initial density and the growth rate of tumor cell in the TME, reproducing the various severity of GBM patient. The simulation results showed that as the initial ratio of tumor cell in TME (among tumor cell, T cell and macrophage) increased from 10% to 40%, GBM cell apoptosis rate decreased from 51.4% to 22.3% (Figure 2B&C). Similarly, GBM cell apoptosis rate declined from 46.7% to 24.2% when the GBM tumor switched from a quiescent status to an aggressive rapid proliferating status, such as the relative tumor growth rate increased from 20% to 45% day−1 (Figure 2D&E). Recent clinical studies indicate that the expression level of PD-L1 on GBM differs in different molecular subtypes of GBMs and influences the efficacy of anti-PD-1 therapy.[11b] Our modeling suggested that as the relative expression level of PD-1 increased from 0.4 to 0.8, the apoptosis rate of GBM cell increased from 32.5% to 47.5% during anti-PD-1 therapy (Figure 2F&G).
Clinical evidence has suggested that the failure of anti-PD-1 therapy is largely due to the lack of extravasated CTLs from the blood vessel to the TME and a high number of TAM in the TME that suppress CTL function.[8a, 8c, 9c–e] In order to study the effects of infiltrating T cell and TAM on anti-PD-1 therapy, we tuned the initial seeding density of T cell and TAM individually in TME. The simulation results showed that as the initial ratio of T cell in TME (among tumor cell, T cell and macrophage) increased from 10% to 40%, the GBM cell apoptosis rate increased from 5.2% to 24.0% (Figure 2H&I). By contrast, as the ratio of TAM in TME increased from 10% to 40%, the GBM cell apoptosis rate decreased from 27.8% to 10.5% (Figure 2J) and the systematic TME immunosuppression factor VTME increased from 0.50 to 0.84 (Supplemental Figure S2A&B). From a systematic point of view, the tumor responses are affected by the systematic immunosuppression from TME (VTME) and the suppression function of PD-(L)1 pathway (VPD(L)1) together (Supplemental Figure S2C). Other factors, such as the killing rate, growth rate, and the PD-1 expression level which are related to T cell functions, affect the efficacy of anti-PD-1 therapy as expected (Supplemental Figure S3). Moreover, we found that the cytokine environment critically regulated the TME immunosuppression (Supplemental Figure S2D), and then the response of the GBM tumor niche to anti-PD-1 therapy (Figure 2K and Supplemental Figure S4). For instance, as the TME became more inflammatory with anti-inflammatory TGF-β and IL-10 decreased and pro-inflammatory TNF-α and IFN-γ increased, the GBM cell apoptosis rate increased from 29.2% to 51.2%. Together, the in-silico analysis showed that the different niche cell population and the profiles of pro- and anti-inflammatory cytokines determined the specificities of immunosuppression in the GBM TME, which present varied therapy outcomes from the anti-PD-1 therapy.
2.4. In-silico analysis of GBM heterogeneity and differential therapeutic responses to anti-PD-1 therapy
GBM is a genetically heterogeneous disease classified as three main transcriptionally defined subtypes, proneural, classical and mesenchymal, of which mesenchymal GBM is associated with particularly poor response to therapy, while proneural and classical GBM are associated with a somewhat better prognosis (Figure 3A).[13a] To validate this heterogeneity in silico, we herein studied the immune responses of patients of different subtypes to anti-PD-1 immunotherapy. For each subtype, the mean values of simulation results from 2 individual patients with error bars were obtained (Figure 3B–D).
Figure 3. Molecularly distinct subtypes of GBMs show varied responses to anti-PD-1 therapy.

(A) A schematic showing molecularly distinct GBM subtypes (proneural, classical, and mesenchymal) would show varied responses to anti-PD-1 therapy, due to the varied immunosuppressive signals in TME. (B-D) Simulation results showing the pro- and anti-inflammatory cytokine profiles in TME (B), CD154+CD8+ T cell activation rate (C), and GBM cell apoptosis rate (D) of three subtypes of GBMs under anti-PD-1 treatment, and comparisons with experimental results (dots). In B-D, data represent the mean ± s.e.m. No significant difference was observed between simulation and experimental results (Mann-Whitney test).
We first profiled the cytokine milieu of the patients and confirmed its consistency with our on-chip findings (Figure 3B). Simulation results showed that pro-inflammatory cytokines TNF-α and IFN-γ were of highest level but anti-inflammatory cytokines TGF-β and IL-10 were of lowest level in proneural subtype, which partially explains the relatively good prognosis with such subtype. We further tested the effect of PD-1 inhibition on T-cell activation and GBM cell apoptosis by virtual administration of anti-PD-1 therapy to different subtypes of GBMs (Figure 3C). The simulation results demonstrated that T-cells in the proneural GBM niches were significantly activated after administration of PD-1 inhibitor, while for mesenchymal and classical GBMs the activation rates were lower, due to the different extent of immunosuppression across these three GBM subtypes. Next, we investigated the GBM cell apoptosis before and after administration of PD-1 inhibitor (Figure 3D). When anti-PD-1 inhibition was adopted, the mesenchymal GBM demonstrated relatively lower tumor apoptosis rate at day 6 comparing to the proneural GBM subtype. By contrast, the CD154+CD8+ T cell activation and GBM cell apoptosis rates remained in a lower range (less than 5%) for all three GBM subtypes in control experiments without anti-PD-1 inhibition. As a result, we found that for the proneural GBM subtype, the GBM cell density showed a trend to decrease since T cell and PD-1 inhibitor were added (Supplemental Figure S5). For the mesenchymal GBM subtype, the GBM cell density remained constantly increasing, suggesting an insufficient eradication of tumor by the anti-PD-1 treatment. Overall, most of the simulated results were consistent with experimental data, confirming the effectiveness of the proposed computational model.
2.5. Anti-PD-1 and anti-CSF-1R combination therapy shows potential to overcome GBM therapeutic resistance
From the above in silico analysis, we found that single anti-PD-1 therapy is not effective to all the patients, in particular of patients with mesenchymal GBM subtype. Our and others’ studies have recently demonstrated anti-CSF-1R inhibition blocks the CSF-1(R) signal pathway and prohibit the conversion of M1 to M2 macrophage.[13a, 31] Thus, a combination therapy co-targeting both the PD-1 immune checkpoint and TAM CSF-1R signaling may have a great potential to improve immunotherapy outcomes (Figure 4A).[34] We first tested the anti-PD-1 and anti-CSF-1R dual inhibition on all three subtypes of GBMs in silico (Figure 4B). Under anti-PD-1 therapy, different GBM subtype varied in the M2 ratio, such as mesenchymal GBM subtype demonstrated 16.5±7.9% in the M2 ratio, while proneural and classical subtypes showed 9.0±0.8% and 14.9±3.5% respectively, indicating the heterogeneity of resistance among different GBM subtypes. With dual inhibition, the mean ratios of M2 TAMs decreased 84.5%, 88.0% and 91.6% for proneural, classical and mesenchymal subtypes respectively, which confirmed the effect of dual inhibition on promoting M2 conversion to M1, possibly by reducing CSF-1R expression on TAM. Moreover, the simulation results were consistent with our previous on-chip experimental data. Next, we in silico studied the effect of TAM-associated CSF-1R signaling on the extravasation of T cell from the blood vessel into the GBM TME. The simulation results showed that T cell extravasation decreased as the relative expression level of CSF-1R on TAM increased from 0.65 to 0.95 (Figure 4C), leading to a reduced tumor apoptosis (Figure 4D). Moreover, anti-CSF-1R and dual inhibitions significantly increased the amount of extravasated T cells in all three subtypes of GBMs, as compared to the anti-PD-1 monotherapy and control experiments without drug treatment (Figure 4E). As a result, the mean GBM cell apoptosis rate increased by more than 50% under dual inhibition therapy (proneural: 34.8%, classical: 27.2%, and mesenchymal: 27.9%) as compared to the single anti-PD-1 therapy (proneural: 21.7%, classical: 15.0%, and mesenchymal: 18.5%) for all three GBM subtype (Figure 4F), indicating the in-silico effectiveness of the combination therapy.
Figure 4. Anti-PD-1 and anti-CSF-1R combination therapy overcomes GBM resistance.

(A) A schematic showing the mechanisms of anti-PD-1 and anti-CSF-1R dual inhibition therapy. (B) Simulation determined ratios of M2 TAMs in different subtypes of GBMs after anti-PD-1 and dual inhibition treatments, and comparisons with experimental data. (C) Simulation results showing that the number of extravasated CD8+ T cells into TME and (D) the GBM cell apoptosis rate varied with the relative expression level of CSF-1R. Data represent the mean ± s.e.m. (E) Simulation results comparing the normalized number of extravasated CD8+ T cells into TME under control, anti-PD-1, anti CSF-1R and dual inhibition conditions. P-values were calculated using one-way ANOVA. *, p<0.05. (F) The GBM cell apoptosis rate varied during anti-PD-1 and dual therapies in different subtypes of GBMs, and comparisons with experimental data. In B, E, and F, error bars represent the mean ± s.e.m. No significant difference was observed between simulation and experimental results (Mann-Whitney test).
2.6. An in-silico prediction of patient responses to anti-PD-1 and combination therapies
Built on our computational model and patient-specific input information, we next conducted in silico prediction of three patients with distinct GBM subtypes to the anti-PD-1 therapy and dual inhibition combined with an anti-CSF-1R inhibitor BLZ945 (Figure 5). We first determined how the systematic TME immunosuppression factor VTME changes during different therapies (Figure 5A). Our simulation results showed that anti-PD-1 inhibition reduced VTME more in the proneural GBM than in the classical and mesenchymal GBMs, suggesting heterogeneous tumor resistance to anti-PD-1 therapy in these patients. When dual inhibition was adopted, VTME decreased for all three GBM subtypes comparing to the anti-PD-1 mono-therapy (Figure 5A), indicating a better efficacy of dual inhibition in reducing immunosuppression (Supplemental Figure S6A) and enhancing immune activation (Supplemental Figure S6B).
Figure 5. In silico prediction of therapeutic effects of anti-PD-1 and dual inhibition therapies in individual patients.

(A) The dynamics of the immunosuppression factor VTME in different GBM subtypes during control experiments without drug treatment, anti-PD-1 and dual inhibitions. (B-C) Predictive results showing changing ratios of activated T cell (B) and GBM cell apoptosis (C) during anti-PD-1 and dual inhibition therapies, and comparisons with experimental results. (D) Fold changes of VTME, T-cell activation and apoptosis between dual inhibition and anti-PD-1 therapies for all three GBM subtypes. Results are based on mean values of patients of different subtypes, of which the ranges came from error bars of experimental data (proneural: ±3.0%, classical: ±2.2%, mesenchymal: ±2.5%).
Next, we predicted the patient responses to the anti-PD-1 and dual inhibition therapies using our established model and compared with experimentally measured results (Figure 5B&C). The simulation predicted that the patient with proneural GBM would show a better response to the anti-PD-1 therapy with higher CD154+CD8+ T cell activation (Figure 5B) and tumor apoptosis rates (Figure 5C), comparing to these patients with classical and mesenchymal GBMs. In addition, the proneural GBM patient showed a trend of remission after anti-PD-1 inhibition, while the patient of mesenchymal subtype showed a strong resistance to the anti-PD-1 therapy as the GBM cell density continued to increase after the treatment (Supplemental Figure S7) due largely to the strong immunosuppression in TME. By contrast, the dual inhibition combination therapy resulted in improved treatment outcomes in all three patients with higher ratios of CD154+CD8+ T cells in TME (Figure 5B) and tumor apoptosis (Figure 5C) comparing to the anti-PD-1 therapy. Based on the predictive results, we studied the relative efficacy of dual inhibition therapy comparing with single anti-PD-1 therapy for all three subtypes (Figure 5D). The results showed that the dual inhibition therapy had more significant effect on the patients of mesenchymal subtype who had poor therapy under single anti-PD-1 therapy.
Overall, our predicted results were consistent with the experimental data in terms of T cell activation and cytotoxic efficiency during the anti-PD-1 and dual inhibition therapies, validating the predictive power of the in-silico model. Importantly, our simulation results suggested that the anti-PD-1 and anti-CSF-1R dual inhibition therapy might help alleviate the TAM-mediated immunosuppression in TME, thus overcome the therapeutic resistance especially in mesenchymal patient as evidenced with a continuous decrease in tumor cell density after administration of the treatment (Supplemental Figure S7).
3. Conclusion
Preclinical prediction of patient response to given therapies is critically valuable for clinical treatment of cancer, especially this would enable physician to identify which patients responded well to the treatments and to evaluate the potential effectiveness of new immunotherapy protocols.[35] Recently, many computational methods have been developed for guiding the GBM treatments. For example, statistical models integrated with molecular data (such as lncRNA[36] and microRNA[37]) achieved to predict the survival and recurrence time of chemotherapy-treated GBM patients in an end-point manner. Some other types of computational models, based on machine learning and image analysis, are able to provide patient-specific prediction on prognosis.[38] There are also computational models providing a general basis to study various components either cellular or molecular in the TME, such as vessel structure,[39] spatial patterns of various molecules,[18] interaction between tumor and TAM with multiple molecular pathways,[40] and multiple cellular interaction between tumor, macrophages, and T cells.[41] However, there is a lack of computational framework featuring how the tumor immune microenvironment influences patient responses to the emerging immunotherapies. Complementary analysis of patient-specific TME characteristics and patient response to given immunotherapy with new in silico models would help to predict and improve the therapeutic outcomes.
In this study, we established an in silico GBM immuno-oncology model to systematically and quantitatively dissect the immunological mechanisms in the TME underlying the tumor resistance to anti-PD-1 therapy with input of our previous in vitro GBM-on-a-Chip study.[13a] The computational framework is based on a matrix of mathematic equations to describe various biological processes and cellular interactions among GBM, CTL, and TAM in the heterogeneous GBM TMEs during anti-PD-1 immunotherapy, including tumor growth and apoptosis, T cell activation and cytotoxicity, TAM phenotype and associated immunosuppression, and PD-1, CSF-1, pro-inflammatory, and anti-inflammatory cytokine signal pathways. Through a parameter sensitivity analysis, we revealed a myriad of parameters related to the tumor, T cell, and TAM, as well as immunoregulatory cytokines in TME critically involved in regulating tumor response to anti-PD-1 treatment. After fitting our model with experimental data from different GBM patient-derived chips, we were able to validate that the consistency between in silico computational and on-chip experimental models to anti-PD-1 immunotherapy, in terms of T cell activation, tumor apoptosis, and the immunosuppressive milieu.
Using this computational model, we were able to realize in silico experimentations to separately analyze the effects of given mechanism or parameter on the heterogeneous tumor responses and resistance to the PD-1 checkpoint blockade. By tuning the input values of these parameters, we confirmed that the TAM-associated immunosuppression is one of the main suppression mechanisms. Of note, the heterogeneous TME characteristics and immunosuppression in different subtypes of GBMs resulted in varied responses to the anti-PD-1 immunotherapy, where mesenchymal GBM demonstrated an inferior prognosis than the other types.[13a] Therefore, how to accurately compare and reveal the underlying heterogeneous mechanisms remains a critical question. In this study, we built our computational model upon the patient-derived chip study and analyzed the predictive power of our model by simulating the anti-PD-1 and combination therapies in silico for three representative patients, suggesting a potential of our model for navigating the clinical treatment and personalizing the immunotherapies for GBM patients. More importantly, our study showed that a combination therapy co-targeting PD-1 and TAM-associated CSF-1R would significantly enhance the immune response of all the three subtypes of GBMs to overcome tumor resistance to anti-PD-1 immunotherapy. This observation is consistent with various cancer models, either experimental or computational, showing that a combination of CSF-1R targeting therapy with other therapies such as T cell checkpoint immunotherapy (including anti-PD1 therapy)[28b] and radiotherapy[42] can help enhance treatment response.
Despite the positive aspects of this model, we acknowledged that the integration of our quantitative framework with a larger dataset, such as clinical observation with survival probability, will further increase the accuracy of the model and thus the reliability for preclinical and even clinical applications. It is notable that unifying the data from different sources such as in vitro studies, preclinical or clinical settings and formats such clinical images, serum tests, and histological analysis, remains to be better defined for in silico models. Experimental data from different patients or different sets of studies might have a large variance, which makes it challenge to fit the model with one set of parameters that would work for all patients and all treatment conditions. In addition to TAM, other immunosuppressive cells, such as regulatory T cells (Tregs), myeloid cells, and MDSCs in the TME may also affect immune response to PD-1 therapy.[43] Though is not included in the current model, we believed that the inclusion of these niche cells and related pathways to expand the TME immunosuppression factor VTME can make the model more precisely reflect the in vivo GBM niche. Besides, the tumor stromal environment, such as aberrant angiogenesis, hypoxia, and interstitial fluid pressure in the brain, as well as the effect of blood-brain barrier (BBB) on T cell extravasation and drug delivery might also be considered and included in the in-silico model. Another possible improvement is to use partial differential equations, to capture the spatial heterogeneity of the tumor and other cells, which is obvious in the experiment where tumor cells aggregate in a limited volume on the device.
In conclusion, our in-silico GBM model, framed with new immuno-oncology knowledge and driven by patient-specific experimental data from a rapid and personalized GBM-on-a-Chip study, can serve as a novel hybrid “in silico-in vitro” precision medicine tool to analyze patient-specific response to different immunotherapies prior to clinical treatments in an economical but accurate and fast way, highlighting its potential role in guiding clinical therapeutic regimens and practices.
Methods
Algorithm
The mathematical model consists of a set of governing equations aforementioned (Eqs. (1)–(24)). These equations are solved numerically by the 4th order Runge-Kutta method with a certain set of parameters. The parameters to be calibrated are categorized into two groups based on their nature: Global parameters, which are same across all patients; Subtype-specific parameters, which are specific to the patient subtype. In the experiment, T cell and macrophage are considered homogeneous and have same properties, thus parameters depicting those properties are considered global. On the contrary, the tumor cells are obtained from distinct patients, and their properties are considered to be characteristic for different subtypes, thus each subtype with its own set of parameters pertaining to tumor cells. The categorization of parameters is listed below (Table 1). The code and data for mathematic fitting and prediction is available on Github (https://github.com/ZZY-NYU/GBM_ODE_MODEL.git).
Table 1.
A list of parameters in different groups.
| Group | Parameters |
|---|---|
| Global | τ, e, r1, r2, l1, k1–2, k2–1, l2, l3, k5, k7, k8, k9, kmax, Km1, Km2 |
| Subtype | sPDL1, Katg, k4, k6 |
Experimental conditions for model fitting and validation
Experimental data used for fitting the model was taken from our previous GBM-on-a-Chip study [13a], which consist of results from 9 patients (3 patients for each of the proneural, classical, and mesenchymal subtype respectively). The in-silico experimentations were conducted according to the following experimental procedures: 1) Tumor cell, TAM and vascular cell were first loaded to the microfluidic chip and cultured for 3 days to reconstitute an biomimetic GBM TME in vitro; 2) Following the establishment, CD8+ T-cells were loaded into the vascular channel of the chip and extravasated into the TME; 3) After loading CD8+ T-cell, PD-1 and/or CSF-1R inhibitors were added to TME and replenished every 24 hr for 3 days. CSF-1R inhibitor BLZ945 and PD-1 blockade nivolumab were used in the single or dual inhibition treatments. At the end of day 6, GBM cell apoptosis rate, ratios of CD154+CD8+ T cell and CD163+ M2 TAM, and cytokine concentrations (TNF-α, IFN-γ, TGF-β, and IL-10) in TME were quantified.
The ratio of initial density of tumor cell, TAM and T cell in the chip was 1:2:30, which determined the initial values of in silico experimentations (Table 2). The initial tumor cell density was set as 2×10⁴ cell·mm−3 within a 2-mm3 volume culture chamber on a chip. The total amount of CD8+ T-cells initially loaded in the vascular vessel converted to density in TME is nT,total. Only partial of the initial loaded T cells would extravasated from the vessel into the TME through the 3-day period of therapy experiments, which is denoted as nT and calculated as a time integral of nin from Eq. (6). T cell extravasation is regulated by the immunosuppression factor VTME in TME and varies as anti-CSF-1R and dual inhibition therapies alleviate the TAM-mediated immunosuppression in TME. For simplicity, in our calculation, nT was computed with constant nv and VTME with fixed T cell and tumor cell density.
Table 2.
A list of initial values.
| Parameter | Description | Value | Source |
|---|---|---|---|
| nG(0) | *Initial density of tumor cell (2×10⁴ cell·mm−3) | 1 | Set as normalization unit |
| nm1(0)+nm2(0) | *Initial density of TAM | 2 | Experimental |
| n T,total | *Amount of T cell added to blood vessel converted to density in TME | 30 | Experimental |
| n T | *Estimated density of extravasated CD8+ T cell into TME by integral of Eq. (6) (clinically, the density of CTLs in TME) | Dual/CSF-1R inhibition for all patients: 8 PD-1 inhibition/Control: Patient 1: 5.101 Patient 2: 5.646 Patient 3: 5.723 Patient 4: 3.718 Patient 5: 4.213 Patient 6: 5.864 Patient 7: 6.054 Patient 8: 2.507 Patient 9: 5.486 |
Fitted with experimental data |
| *The concentration of CSF-1 secreted by tumor, normalized with cell density and the CSF-1 concentration for half-maximal activation of CSF-1(R) pathway. Deduced from the patient-various M2 TAM | Patient 1: 7.375 Patient 2: 5.453 Patient 3: 5.210 Patient 4: 16.746 Patient 5: 13.069 Patient 6: 5.359 Patient 7: 4.736 Patient 8: 32.717 Patient 9: 6.716 |
Experimental |
Fitting methods and error analysis
The calibration of the computational model was conducted by a fitting process that adjusts the parameters to minimize the cost function (see below) which was defined from the residual, on the two patients of each subtype (Patient 1,3 for proneural; 5,6 for classical; 7,9 for mesenchymal). Specifically, the fitting was conducted with a trust region reflective algorithm in the Scipy package adopting a least square method, a standard approach in regression analysis and optimization. Generally, the method determines the parameters in the model by minimizing the sum of the squares of the residuals between the observed and fitted values with reciprocals of variances in experiments as the weighting factors. To reduce the degree of freedom of the fitting process, some parameters were reduced by division without breaking the mathematical structure of the model.
In our model, for each patient, the cost function is defined as
| (25) |
where F is the calculated value and E is the experimental value of the key variables, and b is the standard deviation of the experimental data averaged in different data fields, used as a weighting factor, m is the kinds of treatments (in this model, we used anti-PD1–1 therapy, anti-CSF-1R and dual therapy for fitting, thus m=3), and the subscript 0 indicates the value without therapy. n is the number of variables (in this model there are ratios of CD163+ M2 TAM, CD154+CD8+ T cell, and GBM cell apoptosis, n=3). The parameters adopted in the model are shown in Table 3.
Table 3.
A detailed list of parameters used in the model.
| Parameter | Description | Reference/Fitted Value | Source |
|---|---|---|---|
| r 1 | *Growth rate of tumor | 0.347 d−1 | Experimental |
| l 1 | *Natural apoptosis rate of tumor | 0.006 d−1 | Assumed |
| r 2 | *Growth rate of activated T cell | 0.381 d−1 | Experimental |
| l 2 | Natural apoptosis rate of activated T cell | 0.2 d−1 | [20] |
| l 3 | Overall apoptosis rate of non-activated T cell | 0.004 d−1 | Assumed |
| e | *Killing rate of activated T cell | 0.94 d−1 | |
| k max | Maximal T cell activation rate | 1 d−1 | Assumed |
| k 2–1 | Maximal conversion rate from M2 to M1 macrophages | 6.96 d−1 | |
| k 1–2 | Conversion rate from M1 to M2 macrophages | 0.098 d−1 | |
| k3/KTGF-β | *Secretion coefficient of TGF-β by M2 TAM, normalized to half suppression concentration of TGF-β cytokine | 1.614 | |
| k4/KTGF-β | *Secretion coefficient of TGF-β by tumor cells, normalized. | PN: 0.06 CL: 0.12 MES: 0.12 |
|
| k5/KIL-10 | *Secretion coefficient of IL-10 by M2 TAM, normalized to half suppression concentration of IL-10 cytokine | 1.564 | |
| k6/KIL-10 | *Secretion coefficient of IL-10 by tumor cells, normalized | PN: 0.06 CL: 0.12 MES: 0.12 |
|
| k7/KTNF-α | *Secretion coefficient of TNF-α by M1 TAM, normalized to half activation concentration of TNF-α cytokine | 99.985 | |
| k8/KTNF-α | *Secretion coefficient of TNF-α by activated T cell, normalized | 9.89 | |
| k9/KIFN-γ | *Secretion coefficient of IFN-γ by activated T cells, normalized | 9.55 | |
| K D-inh-CSF1R | Inhibitor dissociation constant (IC50) of BLZ945 | 1 nM | (47) |
| K D-inh-PD1 | Antibody dissociation constant of nivolumab | 1.45 nM | (54) |
| K D-PD(L)1 | Dissociation constant of PD1-PDL1 | 8 μM | (55) |
| Km2/nG(0) | Half suppression number density of M2 TAM (normalized) | 1.48 | |
| Km1/nG(0) | Half suppression number density of M1 TAM (normalized) | 0.0163 | |
| w TGF-β | Weight in VTME of TGF-β cytokine | 0.9533 | |
| w IL-10 | Weight in VTME of IL-10 cytokine | 0.9525 | |
| w TNF-α | Weight in VTME of TNF-α cytokine | 0.0005 | |
| w IFN-γ | Weight in VTME of IFN-γ cytokine | 0.8678 | |
| w m2 | Weight in VTME of M2 TAM | 0.9642 | |
| w m1 | Weight in VTME of M1 TAM | 0.0001 | |
| Katg/nG(0) | Tumor cell density to achieving half maximal interaction between TCR and tumor cells (normalized) | 0.001 | |
| K D-PD(L)1 /s PDL1 | *Ratio of dissociation constant of PD1-PDL1 to available number of PDL1 on each GBM cell | PN: 0.436 CL: 0.408 MES: 0.394 |
|
| sPD1/sPD1-ref | Available number of PD1 on each T cell/reference number of PD1 | 1 | Assumed |
| sCSF1R/sCSF1R-ref | Available number of CSF-1R on each TAM/reference number of CSF-1R | 1 | Assumed |
| r a | Ratio of activated T cells in the migrated T cell influx | 0 | Assumed |
| τ | Characteristic time for the exponential decay of T cell extravasation | 1 d | Assumed |
Abbreviations: PN, proneural; CL, classical; MES, mesenchymal.
In silico prediction of patient responses to immunotherapies
After calibration, this computational model can be used for predict patient responses to different immunotherapies, where experimentally collected and clinically available characteristic data serve as the input to the model for each patient. These initial values of patient-specific parameters are asterisked in Table 2 and Table 3. Notably, patient-various CD163+ M2 TAM data is a driving factor of the heterogeneity of the patients’ TME immunosuppression and therefore critically regulates the therapeutic outcomes. Together with the calibrated global and subtype-specific parameters, the ODE is solved to give the results to predict responses for representative proneural (patient 2), classical (patient 4), mesenchymal (patient 6) patients.
Supplementary Material
Acknowledgments
This work was supported in part by the US National Institutes of Health (R35GM133646, R21EB025406) and the National Science Foundation (CBET1701322).
Footnotes
Conflict of Interest
The authors declare no conflict of interest.
Contributor Information
Chao Ma, Department of Mechanical and Aerospace Engineering, New York University, Brooklyn, NY, 11201, USA; Department of Biomedical Engineering, New York University, Brooklyn, NY 11201, USA.
Xin Cui, Department of Biomedical Engineering, Jinan University, Guangzhou, China.
Raymond H. W. Lam, Department of Biomedical Engineering, City University of Hong Kong, Hong Kong, China
Weiqiang Chen, Department of Mechanical and Aerospace Engineering, New York University, Brooklyn, NY,; Department of Biomedical Engineering, New York University, Brooklyn, NY 11201, USA Laura and Isaac Perlmutter Cancer Center, New York University, New York, NY 10016, USA.
References
- [1].a Cloughesy TF, Mochizuki AY, Orpilla JR, Hugo W, Lee AH, Davidson TB, Wang AC, Ellingson BM, Rytlewski JA, Sanders CM, Kawaguchi ES, Du L, Li G, Yong WH, Gaffey SC, Cohen AL, Mellinghoff IK, Lee EQ, Reardon DA, O’Brien BJ, Butowski NA, Nghiemphu PL, Clarke JL, Arrillaga-Romany IC, Colman H, Kaley TJ, de Groot JF, Liau LM, Wen PY, Prins RM, Nature Medicine 2019, 25, 477–486; [DOI] [PMC free article] [PubMed] [Google Scholar]; b Agrawal NS, Miller R Jr, Lal R, Mahanti H, Dixon-Mah YN, DeCandio ML, Vandergrift III WA, Varma AK, Patel SJ, Banik NL, Journal of neurology and neurosurgery 2014, 1. [PMC free article] [PubMed] [Google Scholar]
- [2].Reardon DA, Omuro A, Brandes AA, Rieger J, Wick A, Sepulveda J, Phuphanich S, de Souza P, Ahluwalia MS, Lim M, Vlahovic G, Sampson J, Neuro-Oncology 2017, 19, iii21–iii21. [Google Scholar]
- [3].a Hao C, Chen G, Zhao H, Li Y, Chen J, Zhang H, Li S, Zhao Y, Chen F, Li W, Jiang WG, Front Oncol 2020, 10, 1015; [DOI] [PMC free article] [PubMed] [Google Scholar]; b Liu S, Wang Z, Wang Y, Fan X, Zhang C, Ma W, Qiu X, Jiang T, Oncoimmunology 2018, 7, e1382792. [DOI] [PMC free article] [PubMed] [Google Scholar]
- [4].Rahman M, Kresak J, Yang C, Huang J, Hiser W, Kubilis P, Mitchell D, J Neurooncol 2018, 137, 249–257. [DOI] [PMC free article] [PubMed] [Google Scholar]
- [5].Zhao J, Chen AX, Gartrell RD, Silverman AM, Aparicio L, Chu T, Bordbar D, Shan D, Samanamud J, Mahajan A, Filip I, Orenbuch R, Goetz M, Yamaguchi JT, Cloney M, Horbinski C, Lukas RV, Raizer J, Rae AI, Yuan J, Canoll P, Bruce JN, Saenger YM, Sims P, Iwamoto FM, Sonabend AM, Rabadan R, Nat Med 2019, 25, 462–469. [DOI] [PMC free article] [PubMed] [Google Scholar]
- [6].Capper D, Jones DTW, Sill M, Hovestadt V, Schrimpf D, Sturm D, Koelsche C, Sahm F, Chavez L, Reuss DE, Kratz A, Wefers AK, Huang K, Pajtler KW, Schweizer L, Stichel D, Olar A, Engel NW, Lindenberg K, Harter PN, Braczynski AK, Plate KH, Dohmen H, Garvalov BK, Coras R, Holsken A, Hewer E, Bewerunge-Hudler M, Schick M, Fischer R, Beschorner R, Schittenhelm J, Staszewski O, Wani K, Varlet P, Pages M, Temming P, Lohmann D, Selt F, Witt H, Milde T, Witt O, Aronica E, Giangaspero F, Rushing E, Scheurlen W, Geisenberger C, Rodriguez FJ, Becker A, Preusser M, Haberler C, Bjerkvig R, Cryan J, Farrell M, Deckert M, Hench J, Frank S, Serrano J, Kannan K, Tsirigos A, Bruck W, Hofer S, Brehmer S, Seiz-Rosenhagen M, Hanggi D, Hans V, Rozsnoki S, Hansford JR, Kohlhof P, Kristensen BW, Lechner M, Lopes B, Mawrin C, Ketter R, Kulozik A, Khatib Z, Heppner F, Koch A, Jouvet A, Keohane C, Muhleisen H, Mueller W, Pohl U, Prinz M, Benner A, Zapatka M, Gottardo NG, Driever PH, Kramm CM, Muller HL, Rutkowski S, von Hoff K, Fruhwald MC, Gnekow A, Fleischhack G, Tippelt S, Calaminus G, Monoranu CM, Perry A, Jones C, et al. , Nature 2018, 555, 469–474. [DOI] [PMC free article] [PubMed] [Google Scholar]
- [7].Lynes JP, Nwankwo AK, Sur HP, Sanchez VE, Sarpong KA, Ariyo OI, Dominah GA, Nduom EK, J Immunother Cancer 2020, 8. [DOI] [PMC free article] [PubMed] [Google Scholar]
- [8].a Razavi S-M, Lee KE, Jin BE, Aujla PS, Gholamin S, Li G, Frontiers in Surgery 2016, 3; [DOI] [PMC free article] [PubMed] [Google Scholar]; b Avril T, Saikali S, Vauleon E, Jary A, Hamlat A, De Tayrac M, Mosser J, Quillien V, J Neuroimmunol 2010, 225, 22–33; [DOI] [PubMed] [Google Scholar]; c Nduom EK, Weller M, Heimberger AB, Neuro-oncology 2015, 17Suppl 7, vii9–vii14; [DOI] [PMC free article] [PubMed] [Google Scholar]; d Kmiecik J, Poli A, Brons NHC, Waha A, Eide GE, Enger PO, Zimmer J, Chekenya M, Journal of Neuroimmunology 2013, 264, 71–83. [DOI] [PubMed] [Google Scholar]
- [9].a Hambardzumyan D, Gutmann DH, Kettenmann H, Nature neuroscience 2016, 19, 20–27; [DOI] [PMC free article] [PubMed] [Google Scholar]; b Chen Z, Feng X, Herting CJ, Garcia VA, Nie K, Pong WW, Rasmussen R, Dwivedi B, Seby S, Wolf SA, Gutmann DH, Hambardzumyan D, Cancer Res 2017, 77, 2266–2278; [DOI] [PMC free article] [PubMed] [Google Scholar]; c Komohara Y, Ohnishi K, Kuratsu J, Takeya M, J Pathol 2008, 216, 15–24; [DOI] [PubMed] [Google Scholar]; d Bingle L, Brown NJ, Lewis CE, J Pathol 2002, 196, 254–265; [DOI] [PubMed] [Google Scholar]; e Hussain SF, Yang D, Suki D, Aldape K, Grimm E, Heimberger AB, Neuro Oncol 2006, 8, 261–279; [DOI] [PMC free article] [PubMed] [Google Scholar]; f Lu-Emerson C, Snuderl M, Kirkpatrick ND, Goveia J, Davidson C, Huang YH, Riedemann L, Taylor J, Ivy P, Duda DG, Ancukiewicz M, Plotkin SR, Chi AS, Gerstner ER, Eichler AF, Dietrich J, Stemmer-Rachamimov AO, Batchelor TT, Jain RK, Neuro-Oncology 2013, 15, 1079–1087. [DOI] [PMC free article] [PubMed] [Google Scholar]
- [10].a Arlauckas SP, Garris CS, Kohler RH, Kitaoka M, Cuccarese MF, Yang KS, Miller MA, Carlson JC, Freeman GJ, Anthony RM, Weissleder R, Pittet MJ, Sci Transl Med 2017, 9; [DOI] [PMC free article] [PubMed] [Google Scholar]; b Cui X, Morales R-TT, Qian W, Wang H, Gagner J-P, Dolgalev I, Placantonakis D, Zagzag D, Cimmino L, Snuderl M, Biomaterials 2018, 161, 164–178. [DOI] [PMC free article] [PubMed] [Google Scholar]
- [11].a Doucette T, Rao G, Rao A, Shen L, Aldape K, Wei J, Dziurzynski K, Gilbert M, Heimberger AB, Cancer Immunol Res 2013, 1, 112–122; [DOI] [PMC free article] [PubMed] [Google Scholar]; b Wang X, Guo G, Guan H, Yu Y, Lu J, Yu J, J Exp Clin Cancer Res 2019, 38, 87; [DOI] [PMC free article] [PubMed] [Google Scholar]; c Wang Q, Hu B, Hu X, Kim H, Squatrito M, Scarpace L, deCarvalho AC, Lyu S, Li P, Li Y, Barthel F, Cho HJ, Lin YH, Satani N, Martinez-Ledesma E, Zheng S, Chang E, Sauve CG, Olar A, Lan ZD, Finocchiaro G, Phillips JJ, Berger MS, Gabrusiewicz KR, Wang G, Eskilsson E, Hu J, Mikkelsen T, DePinho RA, Muller F, Heimberger AB, Sulman EP, Nam DH, Verhaak RGW, Cancer Cell 2017, 32, 42–56 e46. [DOI] [PMC free article] [PubMed] [Google Scholar]
- [12].a Xu Z, Kader M, Sen R, Placantonakis DG, Methods in molecular biology (Clifton, N.J.) 2018, 1741, 183–190; [DOI] [PubMed] [Google Scholar]; b Bayin NS, Ma L, Thomas C, Baitalmal R, Sure A, Fansiwala K, Bustoros M, Golfinos JG, Pacione D, Snuderl M, Zagzag D, Barcellos-Hoff MH, Placantonakis D, Neoplasia (New York, N.Y.) 2016, 18, 795–805. [DOI] [PMC free article] [PubMed] [Google Scholar]
- [13].a Cui X, Ma C, Vasudevaraja V, Serrano J, Tong J, Peng Y, Delorenzo M, Shen G, Frenster J, Morales R-TT, Qian W, Tsirigos A, Chi AS, Jain R, Kurz SC, Sulman EP, Placantonakis DG, Snuderl M, Chen W, eLife 2020, 9, e52253; [DOI] [PMC free article] [PubMed] [Google Scholar]; b Akins EA, Aghi MK, Kumar S, iScience 2020, 23, 101770; [DOI] [PMC free article] [PubMed] [Google Scholar]; c Jenkins RW, Aref AR, Lizotte PH, Ivanova E, Stinson S, Zhou CW, Bowden M, Deng J, Liu H, Miao D, He MX, Walker W, Zhang G, Tian T, Cheng C, Wei Z, Palakurthi S, Bittinger M, Vitzthum H, Kim JW, Merlino A, Quinn M, Venkataramani C, Kaplan JA, Portell A, Gokhale PC, Phillips B, Smart A, Rotem A, Jones RE, Keogh L, Anguiano M, Stapleton L, Jia Z, Barzily-Rokni M, Canadas I, Thai TC, Hammond MR, Vlahos R, Wang ES, Zhang H, Li S, Hanna GJ, Huang W, Hoang MP, Piris A, Eliane JP, Stemmer-Rachamimov AO, Cameron L, Su MJ, Shah P, Izar B, Thakuria M, LeBoeuf NR, Rabinowits G, Gunda V, Parangi S, Cleary JM, Miller BC, Kitajima S, Thummalapalli R, Miao B, Barbie TU, Sivathanu V, Wong J, Richards WG, Bueno R, Yoon CH, Miret J, Herlyn M, Garraway LA, Van Allen EM, Freeman GJ, Kirschmeier PT, Lorch JH, Ott PA, Hodi FS, Flaherty KT, Kamm RD, Boland GM, Wong KK, Dornan D, Paweletz CP, Barbie DA, Cancer Discov 2018, 8, 196–215; [DOI] [PMC free article] [PubMed] [Google Scholar]; d Ma C, Peng Y, Li H, Chen W, Trends Pharmacol Sci 2020. [DOI] [PMC free article] [PubMed] [Google Scholar]
- [14].a Ayensa-Jimenez J, Perez-Aliacar M, Randelovic T, Olivan S, Fernandez L, Sanz-Herrera JA, Ochoa I, Doweidar MH, Doblare M, Sci Rep 2020, 10, 21193; [DOI] [PMC free article] [PubMed] [Google Scholar]; b Herland A, Maoz BM, Das D, Somayaji MR, Prantil-Baun R, Novak R, Cronce M, Huffstater T, Jeanty SSF, Ingram M, Chalkiadaki A, Benson Chou D, Marquez S, Delahanty A, Jalili-Firoozinezhad S, Milton Y, Sontheimer-Phelps A, Swenor B, Levy O, Parker KK, Przekwas A, Ingber DE, Nat Biomed Eng 2020, 4, 421–436. [DOI] [PMC free article] [PubMed] [Google Scholar]
- [15].de Pillis LG, Radunskaya AE, Wiseman CL, Cancer Res 2005, 65, 7950–7958. [DOI] [PubMed] [Google Scholar]
- [16].Jafarnejad M, Gong C, Gabrielson E, Bartelink IH, Vicini P, Wang B, Narwal R, Roskos L, Popel AS, AAPS J 2019, 21, 79. [DOI] [PMC free article] [PubMed] [Google Scholar]
- [17].Lai X, Friedman A, PLoS One 2017, 12, e0178479. [DOI] [PMC free article] [PubMed] [Google Scholar]
- [18].Papadogiorgaki M, Koliou P, Kotsiakis X, Zervakis ME, Theoretical biology & medical modelling 2013, 10, 47. [DOI] [PMC free article] [PubMed] [Google Scholar]
- [19].Macallan DC, Busch R, Asquith B, Curr Opin Syst Biol 2019, 18, 77–86. [DOI] [PMC free article] [PubMed] [Google Scholar]
- [20].Kim PS, Lee PP, Levy D, Journal of Theoretical Biology 2007, 246, 33–69. [DOI] [PubMed] [Google Scholar]
- [21].Michaelis L, Menten ML, Johnson KA, Goody RS, Biochemistry 2011, 50, 8264–8269. [DOI] [PMC free article] [PubMed] [Google Scholar]
- [22].Kosinsky Y, Dovedi SJ, Peskov K, Voronova V, Chu L, Tomkinson H, Al-Huniti N, Stanski DR, Helmlinger G, J Immunother Cancer 2018, 6, 17. [DOI] [PMC free article] [PubMed] [Google Scholar]
- [23].Sewell AK, Nat Rev Immunol 2012, 12, 669–677. [DOI] [PMC free article] [PubMed] [Google Scholar]
- [24].a Kronik N, Kogan Y, Vainstein V, Agur Z, Cancer Immunology, Immunotherapy 2008, 57, 425–439; [DOI] [PMC free article] [PubMed] [Google Scholar]; b Bidot C, Gruy F, Haudin CS, El Hentati F, Guy B, Lambert C, Journal of Computational Biology 2008, 15, 105–128. [DOI] [PubMed] [Google Scholar]
- [25].Boussiotis VA, N Engl J Med 2016, 375, 1767–1778. [DOI] [PMC free article] [PubMed] [Google Scholar]
- [26].Radunskaya A, Kim R, Woods Ii T, SPORA: A Journal of Biomathematics 2018, 4. [Google Scholar]
- [27].Jones CV, Ricardo SD, Organogenesis 2013, 9, 249–260. [DOI] [PMC free article] [PubMed] [Google Scholar]
- [28].a Malyshev I, Malyshev Y, Biomed Res Int 2015, 2015, 341308; [DOI] [PMC free article] [PubMed] [Google Scholar]; b Zhu Y, Knolhoff BL, Meyer MA, Nywening TM, West BL, Luo J, Wang-Gillam A, Goedegebuure SP, Linehan DC, DeNardo DG, Cancer Res 2014, 74, 5057–5069; [DOI] [PMC free article] [PubMed] [Google Scholar]; c DeNardo DG, Ruffell B, Nat Rev Immunol 2019, 19, 369–382. [DOI] [PMC free article] [PubMed] [Google Scholar]
- [29].Parihar A, Eubank TD, Doseff AI, J Innate Immun 2010, 2, 204–215. [DOI] [PMC free article] [PubMed] [Google Scholar]
- [30].a Martinez FO, Gordon S, Locati M, Mantovani A, J Immunol 2006, 177, 7303–7311; [DOI] [PubMed] [Google Scholar]; b Svensson J, Jenmalm MC, Matussek A, Geffers R, Berg G, Ernerudh J, J Immunol 2011, 187, 3671–3682. [DOI] [PubMed] [Google Scholar]
- [31].Pyonteck SM, Akkari L, Schuhmacher AJ, Bowman RL, Sevenich L, Quail DF, Olson OC, Quick ML, Huse JT, Teijeiro V, Setty M, Leslie CS, Oei Y, Pedraza A, Zhang J, Brennan CW, Sutton JC, Holland EC, Daniel D, Joyce JA, Nat Med 2013, 19, 1264–1272. [DOI] [PMC free article] [PubMed] [Google Scholar]
- [32].a Peranzoni E, Lemoine J, Vimeux L, Feuillet V, Barrin S, Kantari-Mimoun C, Bercovici N, Guerin M, Biton J, Ouakrim H, Regnier F, Lupo A, Alifano M, Damotte D, Donnadieu E, Proc Natl Acad Sci U S A 2018, 115, E4041–E4050; [DOI] [PMC free article] [PubMed] [Google Scholar]; b Barberis M, Helikar T, Verbruggen P, Front Physiol 2018, 9, 879. [DOI] [PMC free article] [PubMed] [Google Scholar]
- [33].a Arango Duque G, Descoteaux A, Frontiers in immunology 2014, 5, 491–491; [DOI] [PMC free article] [PubMed] [Google Scholar]; b Allie N, Grivennikov SI, Keeton R, Hsu NJ, Bourigault ML, Court N, Fremond C, Yeremeev V, Shebzukhov Y, Ryffel B, Nedospasov SA, Quesniaux VF, Jacobs M, Sci Rep 2013, 3, 1809; [DOI] [PMC free article] [PubMed] [Google Scholar]; c Castro F, Cardoso AP, Gonçalves RM, Serre K, Oliveira MJ, Frontiers in immunology 2018, 9, 847–847; [DOI] [PMC free article] [PubMed] [Google Scholar]; d Bryukhovetskiy I, Shevchenko V, Oncol Lett 2016, 12, 1581–1590; [DOI] [PMC free article] [PubMed] [Google Scholar]; e Qiu B, Zhang D, Wang C, Tao J, Tie X, Qiao Y, Xu K, Wang Y, Wu A, Molecular Biology Reports 2011, 38, 3585–3591. [DOI] [PubMed] [Google Scholar]
- [34].Cannarile MA, Weisser M, Jacob W, Jegg AM, Ries CH, Ruttinger D, J Immunother Cancer 2017, 5, 53. [DOI] [PMC free article] [PubMed] [Google Scholar]
- [35].a Kim E, Rebecca VW, Smalley KS, Anderson AR, Eur J Cancer 2016, 67, 213–222; [DOI] [PMC free article] [PubMed] [Google Scholar]; b Adam G, Rampasek L, Safikhani Z, Smirnov P, Haibe-Kains B, Goldenberg A, NPJ Precis Oncol 2020, 4, 19. [DOI] [PMC free article] [PubMed] [Google Scholar]
- [36].Liu Q, Qi C, Li G, Su W, Biomed Res Int 2019, 2019, 5076467. [DOI] [PMC free article] [PubMed] [Google Scholar]
- [37].Hayes J, Thygesen H, Tumilson C, Droop A, Boissinot M, Hughes TA, Westhead D, Alder JE, Shaw L, Short SC, Lawler SE, Molecular oncology 2015, 9, 704–714. [DOI] [PMC free article] [PubMed] [Google Scholar]
- [38].a Crawford L, Monod A, Chen AX, Mukherjee S, Rabadán R, Journal of the American Statistical Association 2019, 115, 1139–1150; [Google Scholar]; b Liu L, Zhang H, Rekik I, Chen X, Wang Q, Shen D, Med Image Comput Comput Assist Interv 2016, 9901, 26–34. [DOI] [PMC free article] [PubMed] [Google Scholar]
- [39].Cai Y, Wu J, Li Z, Long Q, PloS one 2016, 11, e0150296. [DOI] [PMC free article] [PubMed] [Google Scholar]
- [40].Kim Y, Jeon H, Othmer H, IEEE Trans Biomed Eng 2017, 64, 519–527. [DOI] [PMC free article] [PubMed] [Google Scholar]
- [41].Banerjee S, Khajanchi S, Chaudhuri S, PloS one 2015, 10, e0123611. [DOI] [PMC free article] [PubMed] [Google Scholar]
- [42].Akkari L, Bowman RL, Tessier J, Klemm F, Handgraaf SM, de Groot M, Quail DF, Tillard L, Gadiot J, Huse JT, Brandsma D, Westerga J, Watts C, Joyce JA, Sci Transl Med 2020, 12. [DOI] [PubMed] [Google Scholar]
- [43].a Yoshida K, Okamoto M, Sasaki J, Kuroda C, Ishida H, Ueda K, Ideta H, Kamanaka T, Sobajima A, Takizawa T, Tanaka M, Aoki K, Uemura T, Kato H, Haniu H, Saito N, BMC Cancer 2020, 20, 25; [DOI] [PMC free article] [PubMed] [Google Scholar]; b Strauss L, Mahmoud MAA, Weaver JD, Tijaro-Ovalle NM, Christofides A, Wang Q, Pal R, Yuan M, Asara J, Patsoukis N, Boussiotis VA, Science Immunology 2020, 5, eaay1863; [DOI] [PMC free article] [PubMed] [Google Scholar]; c Holtzhausen A, Harris W, Ubil E, Hunter DM, Zhao J, Zhang Y, Zhang D, Liu Q, Wang X, Graham DK, Frye SV, Earp HS, Cancer Immunol Res 2019, 7, 1672–1686. [DOI] [PMC free article] [PubMed] [Google Scholar]
Associated Data
This section collects any data citations, data availability statements, or supplementary materials included in this article.