Abstract
Accurate segmentation of corneal layers depicted on optical coherence tomography (OCT) images is very helpful for quantitatively assessing and diagnosing corneal diseases (e.g., keratoconus and dry eye). In this study, we presented a novel boundary-guided convolutional neural network (CNN) architecture (BG-CNN) to simultaneously extract different corneal layers and delineate their boundaries. The developed BG-CNN architecture used three convolutional blocks to construct two network modules on the basis of the classical U-Net network. We trained and validated the network on a dataset consisting of 1,712 OCT images acquired on 121 subjects using a 10-fold cross-validation method. Our experiments showed an average dice similarity coefficient (DSC) of 0.9691, an intersection over union (IOU) of 0.9411, and a Hausdorff distance (HD) of 7.4423 pixels. Compared with several other classical networks, namely U-Net, Attention U-Net, Asymmetric U-Net, BiO-Net, CE-Net, CPFnte, M-Net, and Deeplabv3, on the same dataset, the developed network demonstrated a promising performance, suggesting its unique strength in segmenting corneal layers depicted on OCT images.
Keywords: Corneal layers, OCT images, Segmentation, Convolutional neural networks
1. Introduction
As the clear outer layer at the front of the eye, the cornea plays a critical role in vision by focusing light so that an object can be seen clearly [1]. Any morphological changes of the cornea tissue (e.g., bending angle, thickness, and volume) can lead to vision problems [2,3]. Hence, quantitative analysis of the cornea tissue, especially its morphological characteristics, may facilitate the detection and diagnosis of various corneal diseases [4], such as keratoconus [5], corneal graft rejection [6], and dry eye. To accurately assess the morphological changes, a necessary step is the segmentation of the corneal layers [7]. In clinical practice, optical coherence tomography (OCT) is widely used to visualize corneal tissue [8]. However, on OCT images, adjacent corneal layers appear very similar in density and texture, as demonstrated by the example in Fig. 1, making it very challenging to accurately delineate individual layers. Manually segmenting these layers is time-consuming and associated with the higher inter- and intra-reader variability [9,10]. Therefore, it is extremely desirable to develop computerized methods that can automatically and accurately segment the corneal layers.
Fig. 1.
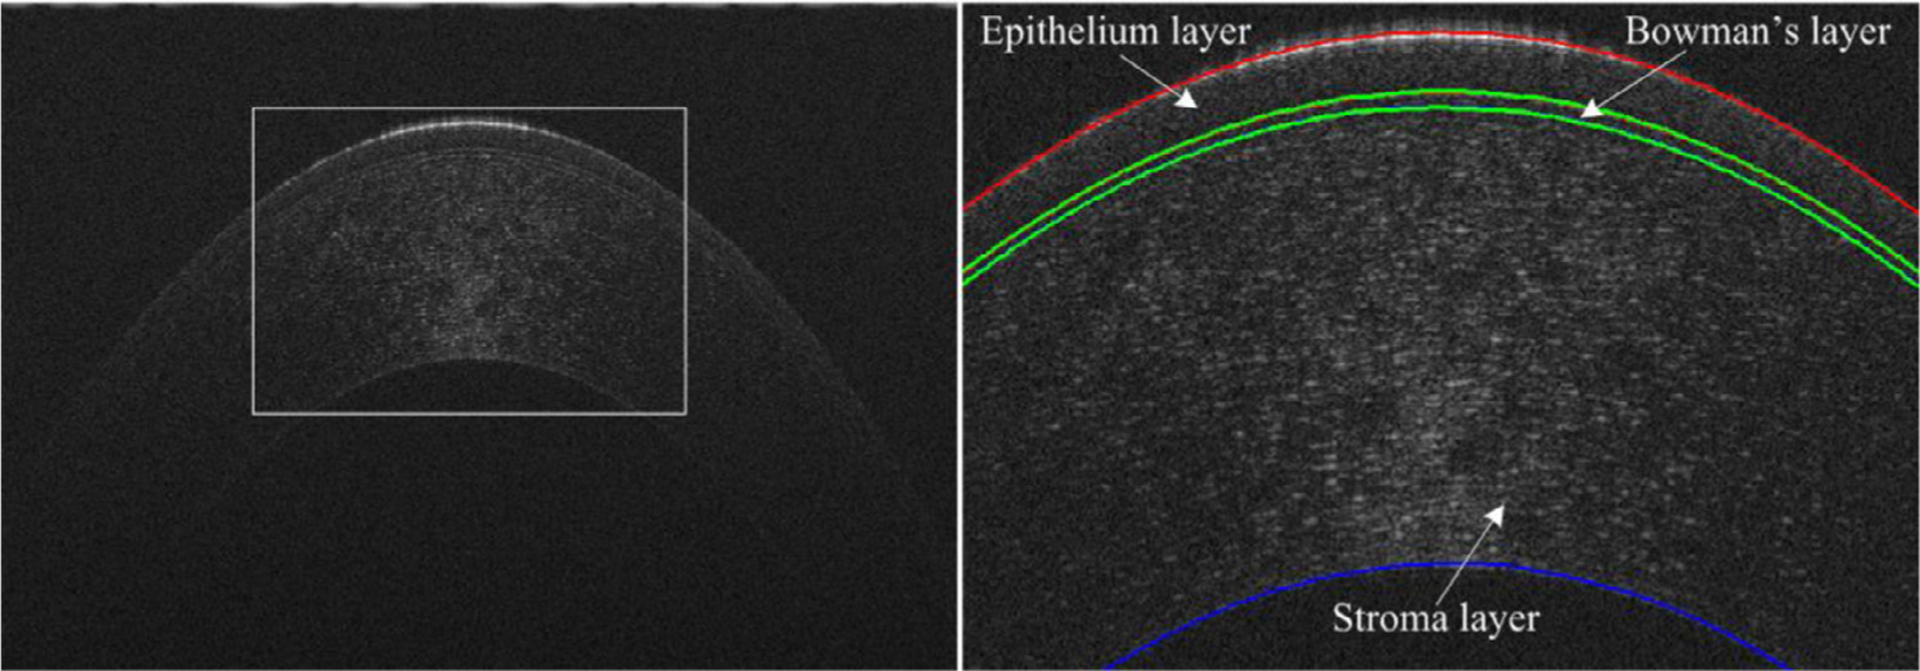
An example showing the corneal tissue on an OCT image (left) and its local enlargement (right), where three different corneal layers are labeled.
There have been investigative efforts made to develop various computerized methods in an attempt to accurately segment corneal layers depicted on OCT images [11,12]. Larocca et al. [13] extracted corneal layers from OCT images using graph theory and dynamic programming. Eichel et al. [14] used a semi-automatic approach to detect the boundaries of corneal layers using morphological operations. Elsawy et al. [15] developed a graph-based method to segment multiple corneal layers. These approaches typically used traditional computer vision technologies and pre-defined image features [16,17] to identify the corneal layers. There are limitations with these methods. First, they are sensitive to the image quality and especially the contrast of the corneal layers with surrounding tissues [18]. Second, there are many empirical parameters involved in these methods that may affect the segmentation performance. All these limit their applications to clinical practice.
In the past years, deep learning technology, namely the convolutional neural network (CNN), is emerging and drawing significant attention in the area of medical image analysis due to its remarkable performance [19–21]. The strength of the deep learning approach lies in its capability of automatically learning a large number of image features and optimally combine them via a sequence of convolutional [22–24] and activation [25–27] operations. The widely used CNN architectures include the U-Net [28], Attention U-Net [29], Asymmetric U-Net [20], BiO-Net [30], CE-Net [31], CPFnet [32], M-Net [33], and Deeplabv3 [34]. Santos et al. [35] proposed a segmentation network termed CorneaNet, which is a variant of the U-Net, for segmenting cornea tissues on OCT images. Similarly, Fabijanska et al. [36] used another variant of the U-Net to extract endothelial cells from specular microscopy images and assess the health status of the corneal endothelium. The deep learning approaches demonstrated higher performance, especially along with extensive data augmentation [19] or adversarial training strategies [37], than the traditional computer vision approaches. They, however, obtained unsmooth object boundaries, which were primarily caused by the involved multiple down-sampling operations. These down-sampling operations largely reduced the amount of features associated with target objects that cannot be recovered in the subsequent procedures [38,39]. This limitation may affect the accurate identification of small corneal layers depicted on OCT images.
In this study, we described a novel boundary-guided CNN architecture (termed BG-CNN) to automatically and accurately extract different corneal layers on OCT images. The developed architecture was formed by three different convolutional blocks, all of which used element-wise subtraction to detect image features associated with object boundaries. We expected that this characteristic could alleviate the problem caused by the aforementioned down-sampling operations to some extent and thereby enable an accurate segmentation. A detailed description of the methods and the experimental results follows.
2. Method
2.1. Scheme overview
Fig. 2 showed the developed BG-CNN architecture for simultaneously extracting corneal layers and their boundaries depicted on OCT images. This architecture was formed by an object extraction module (OEM) and an edge detection module (EDM). The former was used to encode the input image by learning image features and decode these features to determine whether each pixel belongs to the object of interest or background. The latter was used to guide the segmentation by extracting the boundaries of the objects. The intermediate convolutional features in the two modules were integrated to facilitate accurate image segmentation. (The source codes of the developed network can be found at https://github.com/wmuLei/CornealSegmentation).
Fig. 2.
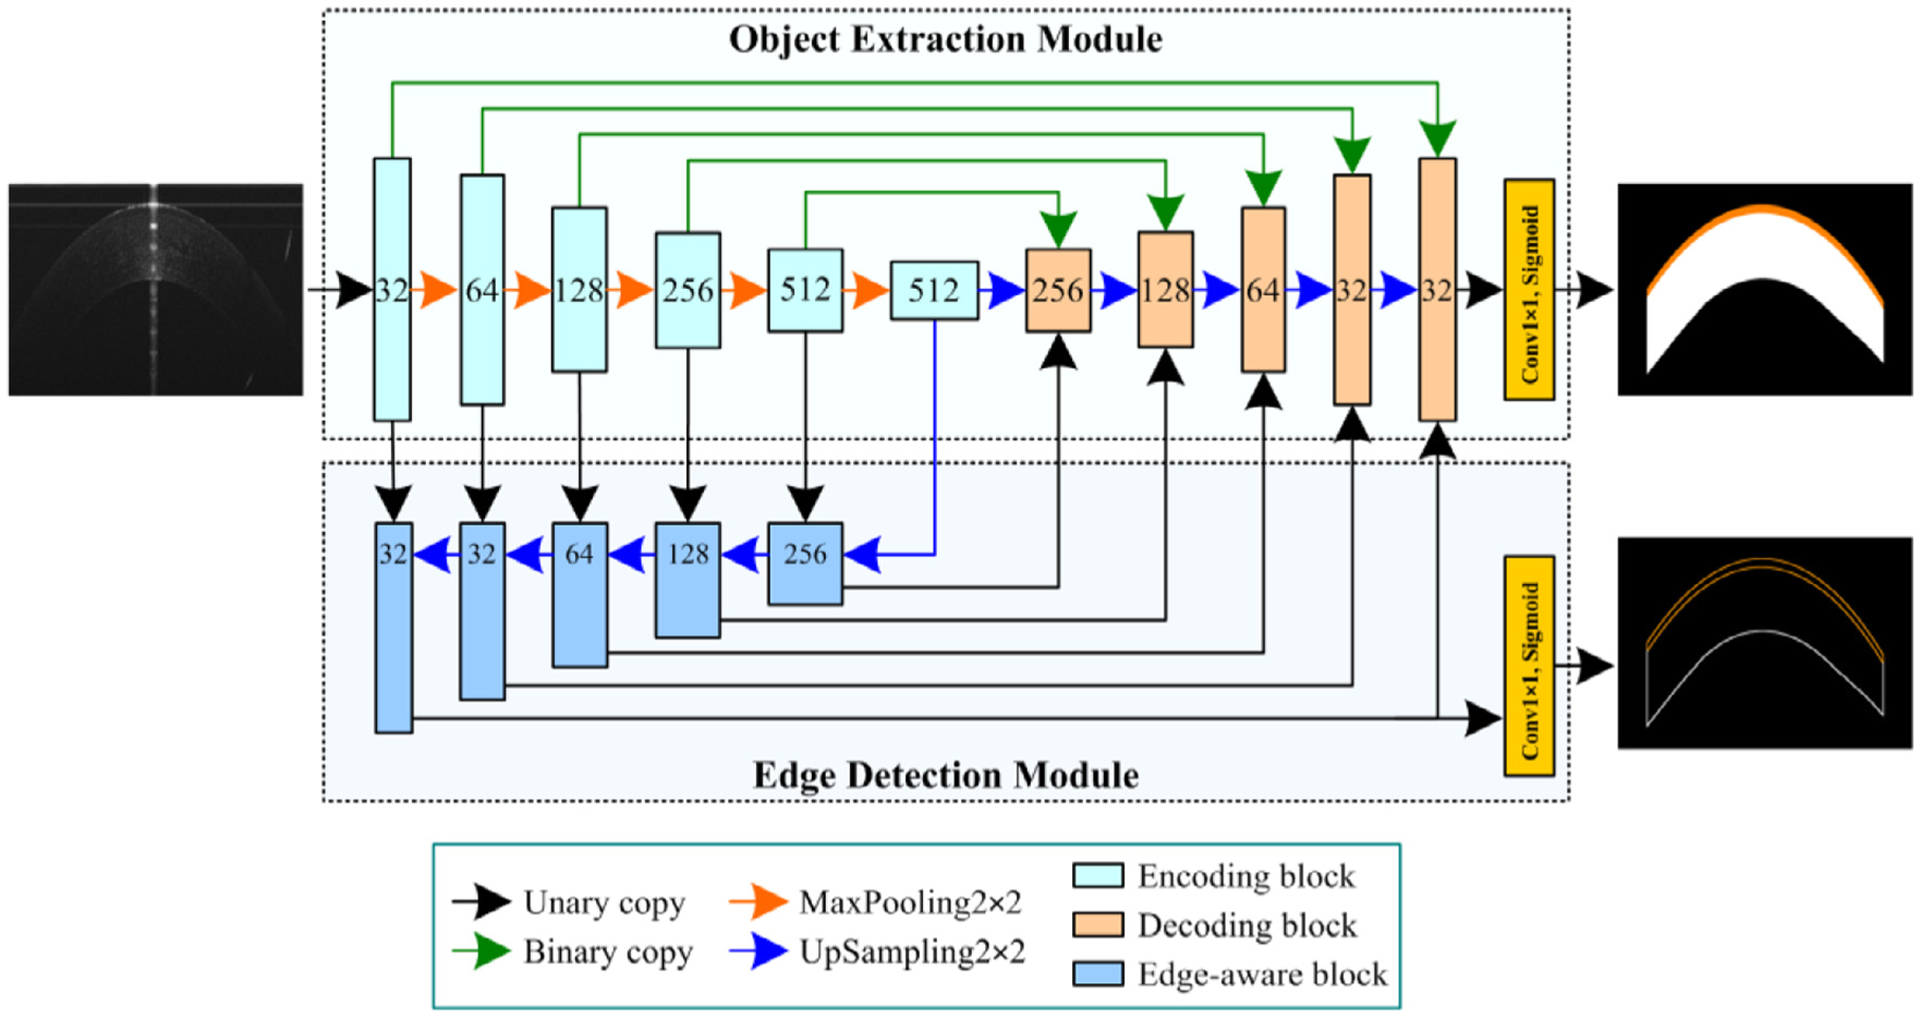
The developed BG-CNN architecture for extracting corneal layers and their boundaries from OCT images. This architecture was formed by an object extraction module and an edge detection module, which were defined by three convolutional blocks.
2.2. Object extraction module (OEM)
The OEM improved the classical U-Net network by introducing two different convolutional blocks (i.e., the encoding and decoding blocks), as shown in Fig. 2. The encoding block utilized three convolutional layers to convert the input images or features to two different outputs, namely the edge and object convolutional features, respectively. Each layer included a 3×3 convolutional operation (Conv3×3), a batch normalization (BN) [26], and an element-wise rectified linear unit (ReLU) activation [25]. The convolutional layers had the same number of convolutional kernels or filters, and their convolutional features were processed using the element-wise subtraction and concatenation operations, along with the image depth dimension, to capture the edge and object convolutional features, respectively (see Fig. 3a). The captured object convolutional features were down-sampled by using a 2×2 MaxPooling layer (MaxPooling2×2) to reduce redundant image information. After alternating the encoding and down-sampling operations, the input images were converted to object and edge convolutional features with varying dimensions and hierarchies, which were applied for the object segmentation and its boundary delineation, respectively. The object convolutional features were processed using a 2×2 UpSampling layer (UpSampling2×2) and fed into a decoding block, together with another three features (two from the OEM and one from EDM) via the binary and unary copy operations, respectively. All these features were concatenated in the decoding block and processed using a similar scheme to the encoding block (in Fig. 3b). The last decoding features were fed into a 1×1 convolution layer (Conv1×1) with a sigmoid activation function to achieve a probability map for the segmented objects in the entire image regions.
Fig. 3.
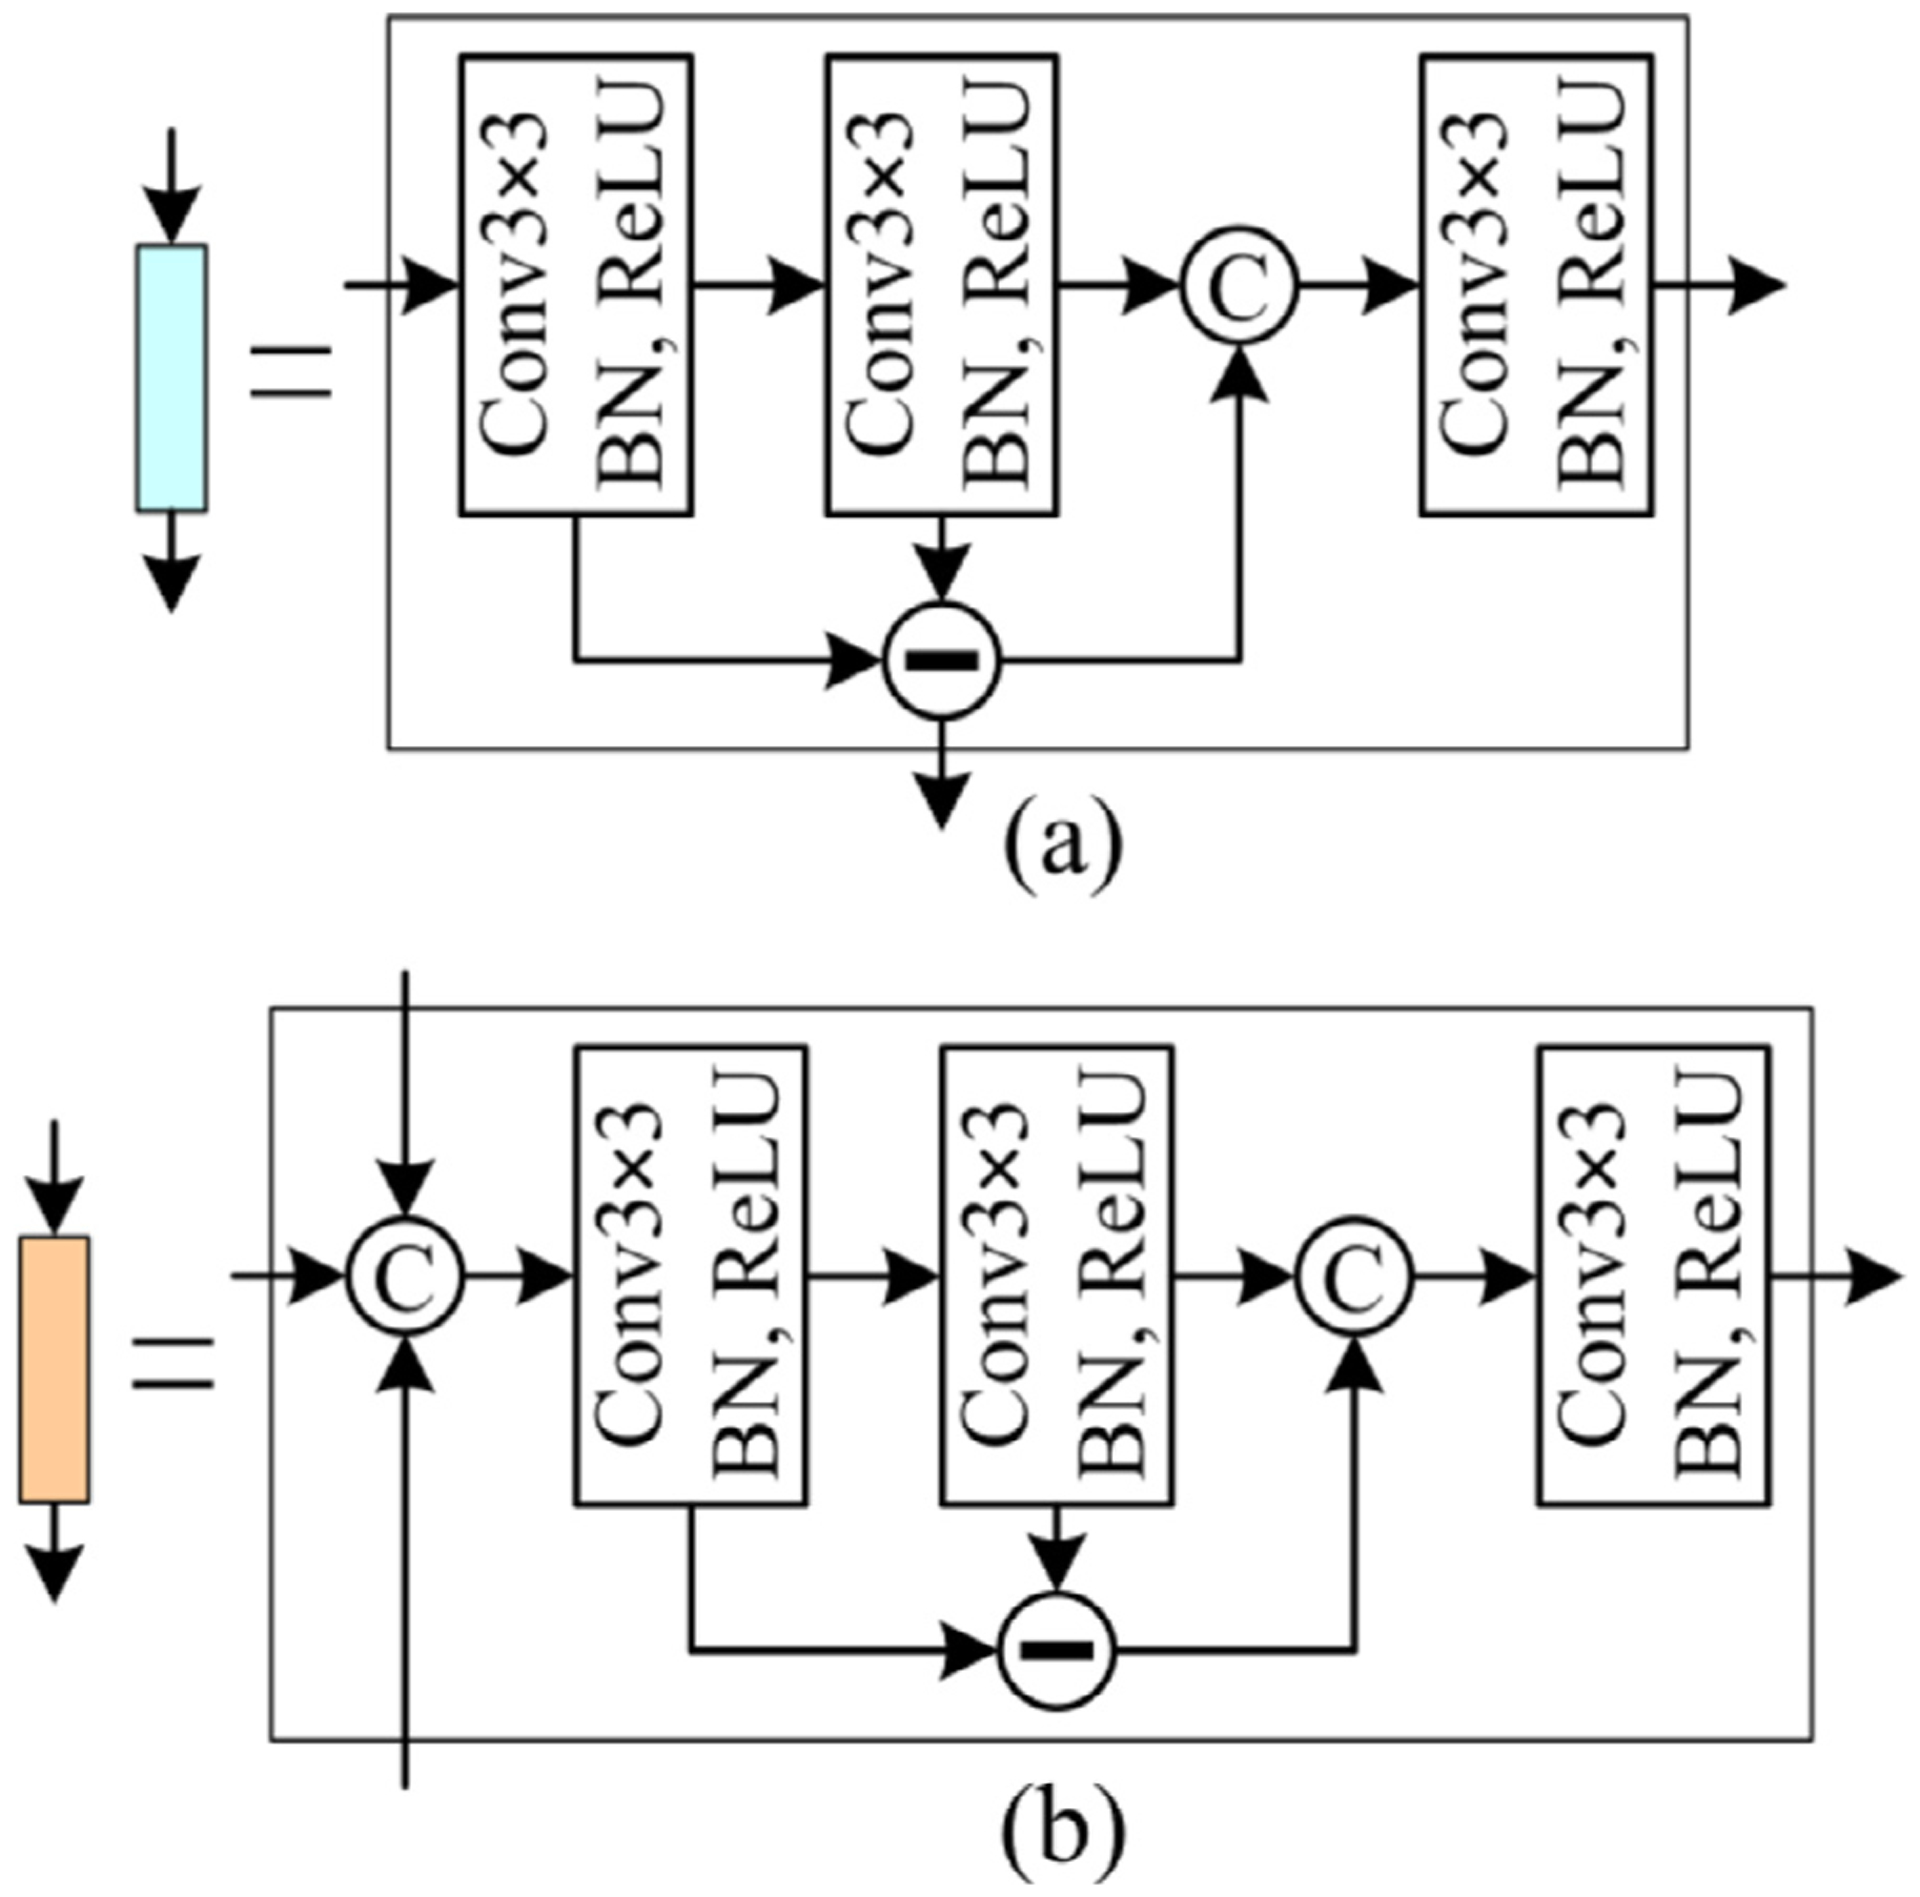
The introduced encoding (a) and decoding (b) blocks in the developed BG-CNN architecture, both of which included three convolutional layers, the element-wise subtraction, and concatenation operations to obtain the image features.
2.3. Edge detection module (EDM)
The EDM was developed to detect the object boundaries and meanwhile largely alleviate the problem caused by the multiple down-sampling operations. It decoded the obtained edge convolutional features using a novel convolutional block (termed the edge-aware block). In this block, two different edge convolutional features were concatenated and processed by a sequence of two convolutional layers and an element-wise subtraction operation (in Fig. 4). The processed results were then up-sampled and fed into the subsequent edge-aware and decoding blocks, respectively. After repeating the operations, object boundaries were located using the Conv1×1 with a sigmoid activation function.
Fig. 4.
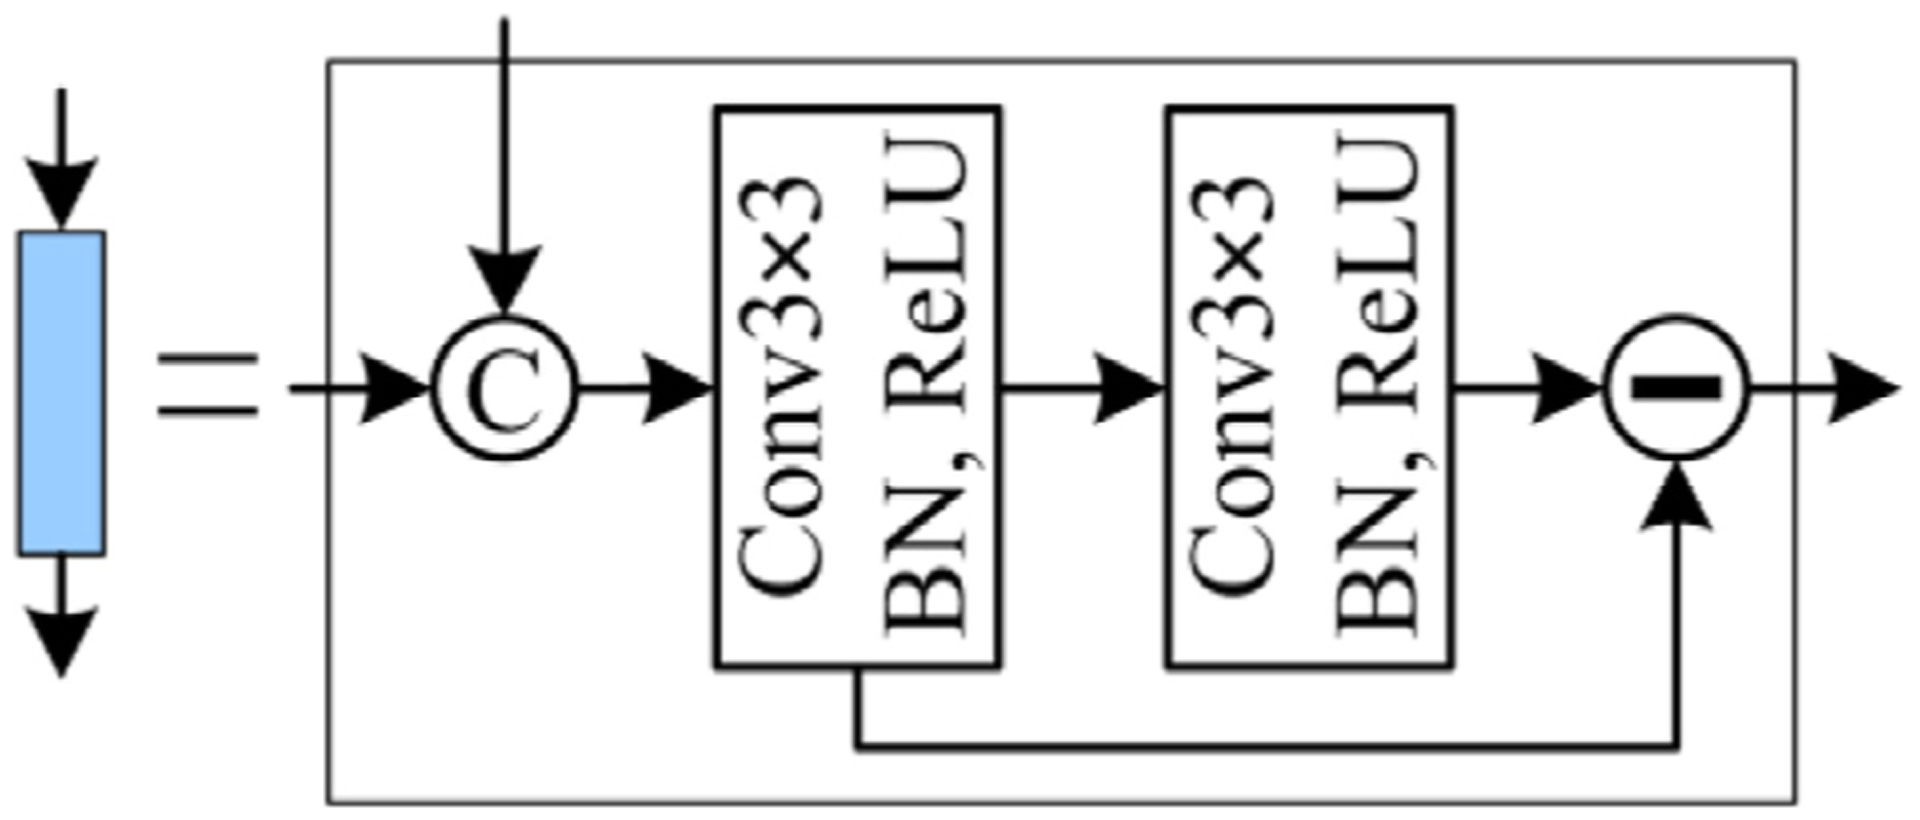
The developed edge-aware convolutional block in the EDM module.
In the developed BG-CNN architecture, the subtraction operation was used to capture a variety of edge information and detect object morphological changes. Its introduction was inspired by a traditional edge detection method [40], where the element-wise intensity differences between a given image and its Gaussian filtered version can highlight a variety of edge information, as shown by the example in Fig. 5. This characteristic can improve the sensitivity of the three convolutional blocks to the object boundaries and thus improved the segmentation accuracy.
Fig. 5.
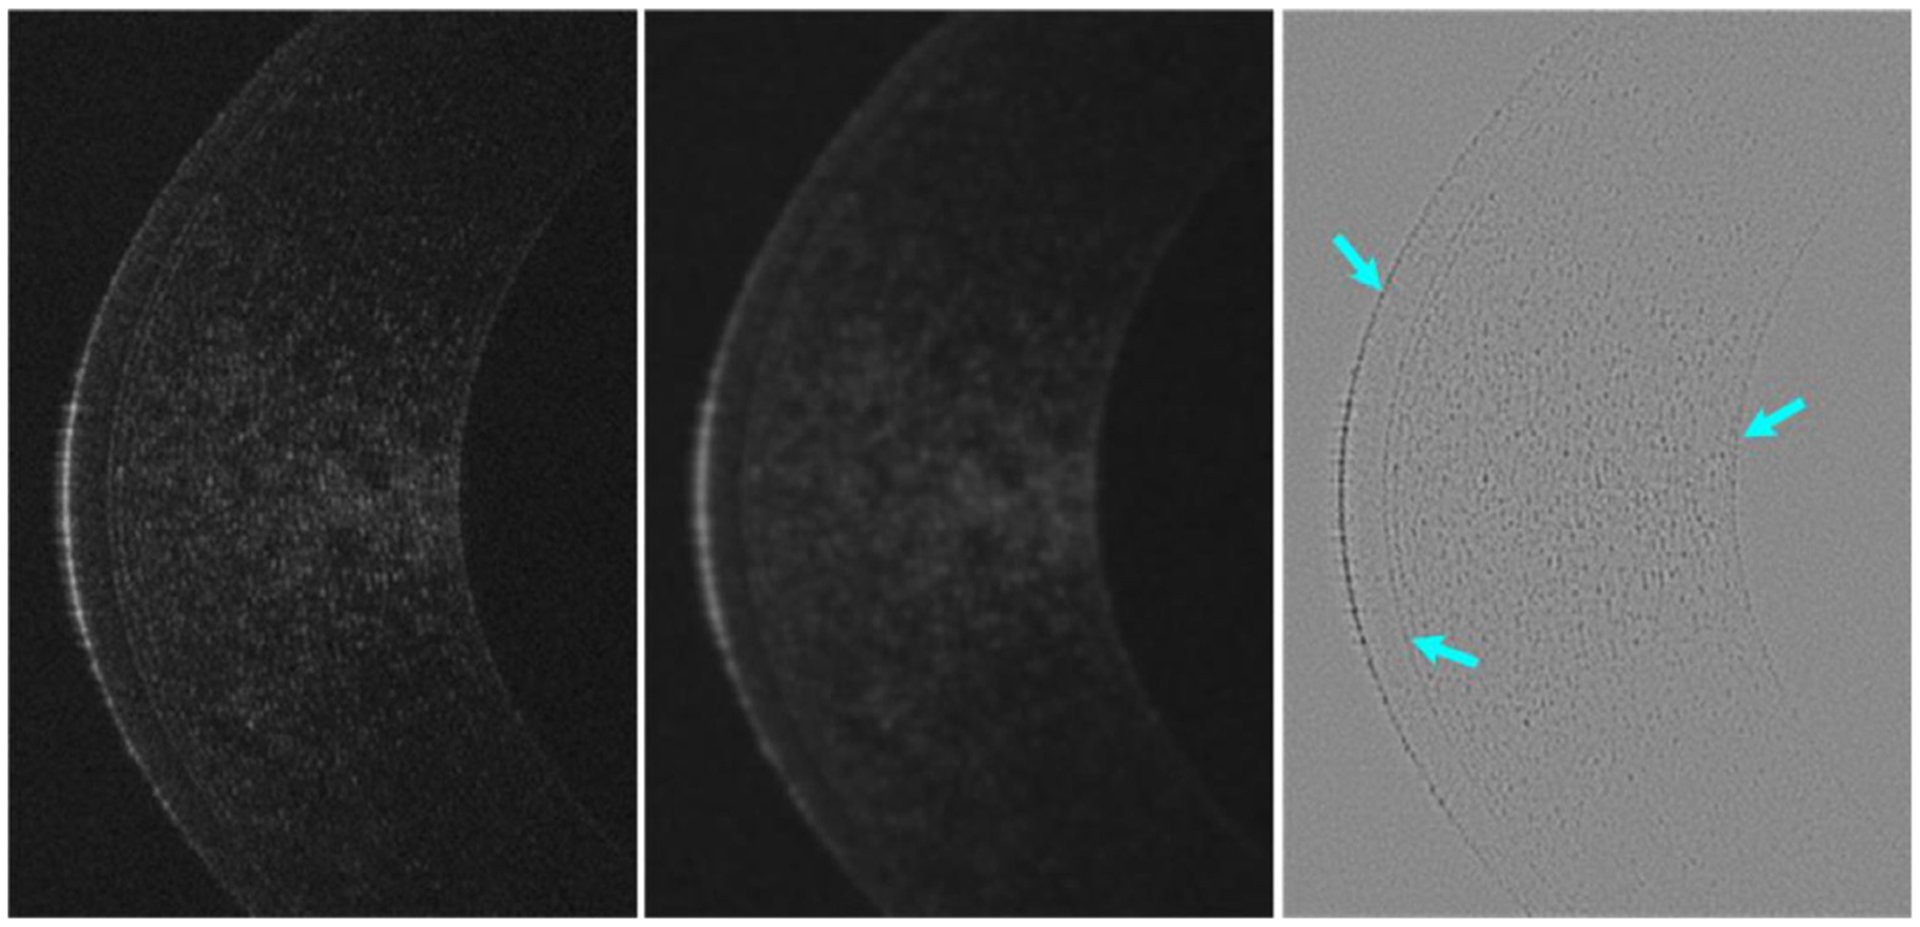
An example showing the intensity differences (right) between a given image (left) and its Gaussian filtered version (middle). On the difference image (right), the subtle features can be effectively highlighted, as indicated by the arrows.
2.4. The training of the BG-CNN
The developed BG-CNN architecture was implemented through the Keras library, and trained on a PC with a 2.20 GHz 2.19 GHz Intel(R) Xeon(R) Gold 5120 CPU, 64 GB RAM and NVIDIA GeForce GTX 2080Ti. The dice similarity coefficient (DSC) [41] was used as the loss function for the target objects and their boundaries (termed DSCo and DSCb, respectively) since it can effectively alleviate the data imbalance problem across the classes and reduce the impact of the irrelevant image background. The loss function Ltotal was given by:
| (1) |
| (2) |
where λ is a non-negative weighting factor and set at 0.5 by default, ai and bi denote the segmentation results of pixel i obtained by a given method and manual annotation, respectively. Ω is the image domain. Ltotal was optimized by the stochastic gradient descent (SGD) algorithm with an initial learning rate (LR) of 0.01 and a momentum of 0.9. The LR was reduced by a factor of 0.1 every 20 epochs. A total of 100 epochs were used for the network training, and the batch size was assigned to 8 with consideration of the capability of the graphics processing unit (GPU). An early stopping scheme was applied to avoid unnecessary optimization if the DSC did not improve for continuous 20 epochs. During the training, we augmented the images to improve the robustness of the trained models. The augmentation operations included randomly flip along the vertical axis, translation by −10 to 10 percent per axis, rotation from −10 to 10 in degree, and scaling from 0.9 to 1.1.
2.5. The dataset for development and validation
To develop and validate the GB-CNN architecture, we collected a corneal dataset consisting of OCT images acquired on 121 patients at the Wenzhou Medical University (WMU) Eye Hospital. These images were obtained using a three-module superluminescent diode (SLD) light source (Broadlighter, T840-HP, Superlumdiodes Ltd, Moscow, Russia) with a center wavelength of 840 nm. A full-width-at-half-maximum bandwidth of 100 nm, had approximately 3 μm of axial resolution in corneal tissue with a scan speed of 24k A-lines per second. The acquirement of the dataset was approved by the Ethical Review Board of the Wenzhou Medical University, together with the patients’ informed consent (No. Y-2015032). This dataset contained a total of 1,712 two-dimensional OCT images with a dimension of 2,048 × 1,365 pixels. The epithelium and stroma layers depicted on these images were manually annotated as the ground truths for machine learning and performance validation (in Fig. 6). Notably, due to the very weak contrast, the Bowman’s layer located between the epithelium and stroma layers was not annotated but contained in the stroma layer (see Fig. 1). In addition, only central regions of the images were processed to reduce the variability of the subjective annotations. The collected images and their annotated results were resized to a dimension of 256×256 pixels and randomly divided into three independent parts at the patient level by a ratio of 0.75, 0.15, and 0.1 for training (n = 1285), interval validation (n = 255), and independent testing (n = 172), respectively.
Fig. 6.
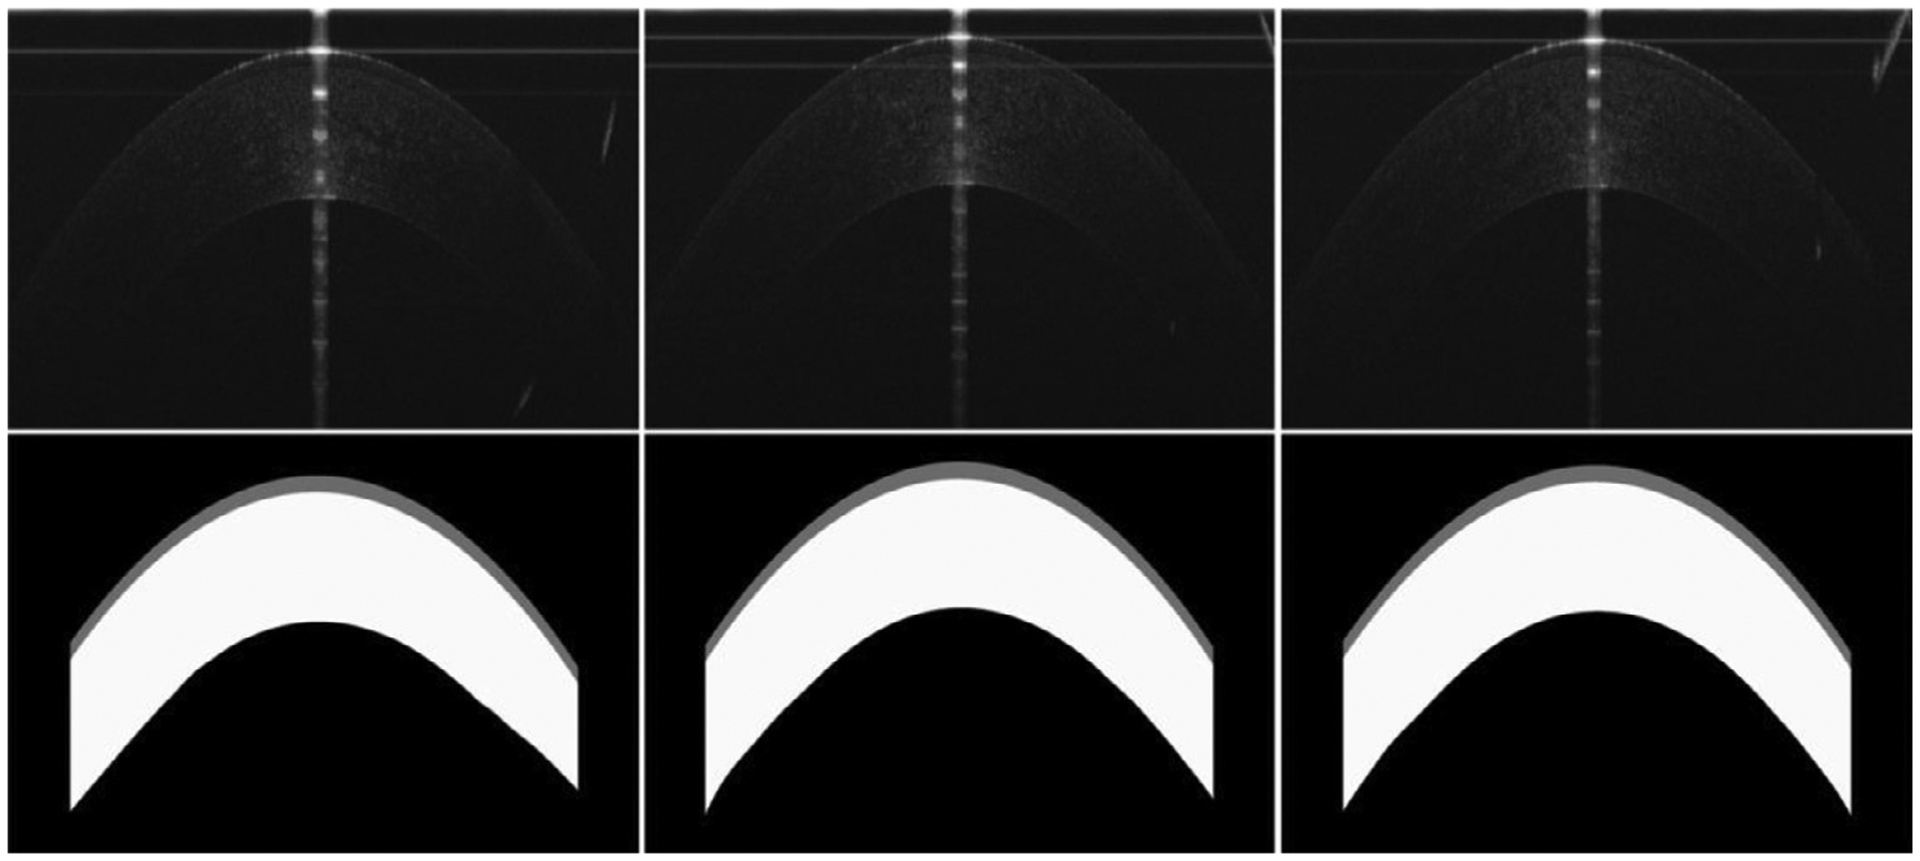
Examples showing the OCT images from our collected dataset (the top row) and their manual annotations (the bottom row).
2.6. Performance validation
We validated the performance of the developed CNN architecture on the independent testing dataset. The agreement between the computerized results and the manual results was quantitatively assessed using the DSC, intersection over union (IOU) [42], balanced accuracy (BAC), and Hausdorff distance (HD) [21]. The IOU, BAC, and HD can be given, respectively, by:
| (3) |
| (4) |
| (5) |
where Se = T p / (T p + F n) and Sp = T n / (T n + F p) are the sensitivity and specificity for a segmentation method. Tp, Tn, Fp, and Fn denote true positive, true negative, false positive, and false negative, respectively. is the directed Hausdorff distance from point set A to point set B. A larger value for the DSC, IOU and BAC and a smaller one for the HD mean a better segmentation result. We compared the segmentation performance of the developed algorithm with other classical CNN methods, including the U-Net, Attention U-Net (AT-Net), Asymmetric U-Net (AS-Net), BiO-Net, CE-Net, CPFnet with the pre-trained ‘ResNet34’ [32], M-Net, and Deeplabv3 with the backbone network ‘xception’ [34], on the same dataset and configuration. Note that (1) the training dimension of 448×448 was used for the CE-Net, (2) the LR of the SGD was set to 0.1 and 1 for the M-Net and CPFnet, respectively, (3) the CPFnet was not activated by the softmax function but by the sigmoid function, through the Pytorch library, for two different corneal layers. To statistically assess the performance differences of these segmentation methods, the paired t-test was performed based on the IOU and HD metrics. A p-value less than 0.05 was considered statistically significant.
3. Results
3.1. Segmentation of the cornea tissues
Table 1 summarized the segmentation results of the developed BG-CNN on the collected OCT images using the 10-fold cross-validation method. As demonstrated by these results, the developed network achieved the average DSC, IOU, BAC, Se and HD of 0.9691, 0.9411, 0.9834, 0.9703, and 7.4423, respectively for both the epithelium and stroma layers. This suggested that our developed BG-CNN had promising potential to extract the corneal layers from OCT images, as compared with the manual annotations. Fig. 7 visually displayed the performance of the BG-CNN on several OCT images.
Table 1.
The performance of the developed CNN model using the 10-fold cross-validation method on the OCT dataset in terms of the mean and standard deviation (SD) of DSC, IOU, BAC, Se, and HD (in pixel).
| DSC | IOU | BAC | Se | HD | ||
|---|---|---|---|---|---|---|
| Dataset | Fold | Mean±SD | Mean±SD | Mean±SD | Mean±SD | Mean±SD |
| Epithelium | Fold01 | 0.9533±0.0125 | 0.9111±0.0226 | 0.9640±0.01l3 | 0.9285±0.0227 | 7.2427±1.0268 |
| Fold02 | 0.9554±0.0191 | 0.9153±0.0343 | 0.9745±0.0073 | 0.9501±0.0147 | 7.2622±1.6278 | |
| Fold03 | 0.9605±0.0350 | 0.9257±0.0519 | 0.9841±0.0173 | 0.9697±0.0336 | 7.3487±1.2093 | |
| Fold04 | 0.9512±0.0158 | 0.9073±0.0281 | 0.9805±0.0164 | 0.9628±0.0330 | 7.6464±1.2022 | |
| Fold05 | 0.9507±0.0228 | 0.9069±0.0388 | 0.9707±0.0195 | 0.9425±0.0392 | 7.4321±1.4794 | |
| Fold06 | 0.9590±0.0231 | 0.9221±0.0414 | 0.9803±0.0134 | 0.9618±0.0266 | 6.9596±1.4924 | |
| Fold07 | 0.9571±0.0136 | 0.9181±0.0247 | 0.9842±0.0100 | 0.9702±0.0201 | 7.0195±1.1435 | |
| Fold08 | 0.9516±0.0215 | 0.9084±0.0377 | 0.9829±0.0154 | 0.9677±0.0308 | 7.9504±1.7703 | |
| Fold09 | 0.9534±0.0168 | 0.9115±0.0302 | 0.9784±0.0125 | 0.9584±0.0249 | 6.9930±1.3420 | |
| Fold10 | 0.9349±0.0466 | 0.8811±0.0757 | 0.9690±0.0262 | 0.9400±0.0516 | 7.5807±1.7206 | |
| Overall | 0.9528±0.0255 | 0.9109±0.0426 | 0.9769±0.0171 | 0.9552±0.0340 | 7.3424±1.4527 | |
| Stroma | Fold01 | 0.9858±0.0066 | 0.9720±0.0126 | 0.9902±0.0133 | 0.9858±0.0133 | 7.4458±1.5199 |
| Fold02 | 0.9861±0.0094 | 0.9727±0.0170 | 0.9911±0.0042 | 0.9886±0.0079 | 7.4337±1.4690 | |
| Fold03 | 0.9876±0.0076 | 0.9755±0.0145 | 0.9913±0.0049 | 0.9873±0.0094 | 7.5831±1.2703 | |
| Fold04 | 0.9862±0.0054 | 0.9728±0.0105 | 0.9893±0.0051 | 0.9821±0.0108 | 7.6922±1.2955 | |
| Fold05 | 0.9832±0.0078 | 0.9670±0.0148 | 0.9889±0.0064 | 0.9845±0.0140 | 7.8239±1.5560 | |
| Fold06 | 0.9888±0.0048 | 0.9779±0.0093 | 0.9911±0.0042 | 0.9851±0.0090 | 7.4410±1.3946 | |
| Fold07 | 0.9873±0.0047 | 0.9749±0.0091 | 0.9921±0.0033 | 0.9901±0.0066 | 7.1439±1.0482 | |
| Fold08 | 0.9868±0.0054 | 0.9739±0.0104 | 0.9905±0.0041 | 0.9856±0.0085 | 7.3316±1.0133 | |
| Fold09 | 0.9826±0.0085 | 0.9660±0.0162 | 0.9896±0.0055 | 0.9860±0.0117 | 7.4164±1.2426 | |
| Fold10 | 0.9798±0.0150 | 0.9607±0.0276 | 0.9852±0.0134 | 0.9770±0.0259 | 8.1377±2.2932 | |
| Overall | 0.9854±0.0084 | 0.9714±0.0158 | 0.9899±0.0066 | 0.9853±0.0132 | 7.5422±1.4698 |
Fig. 7.
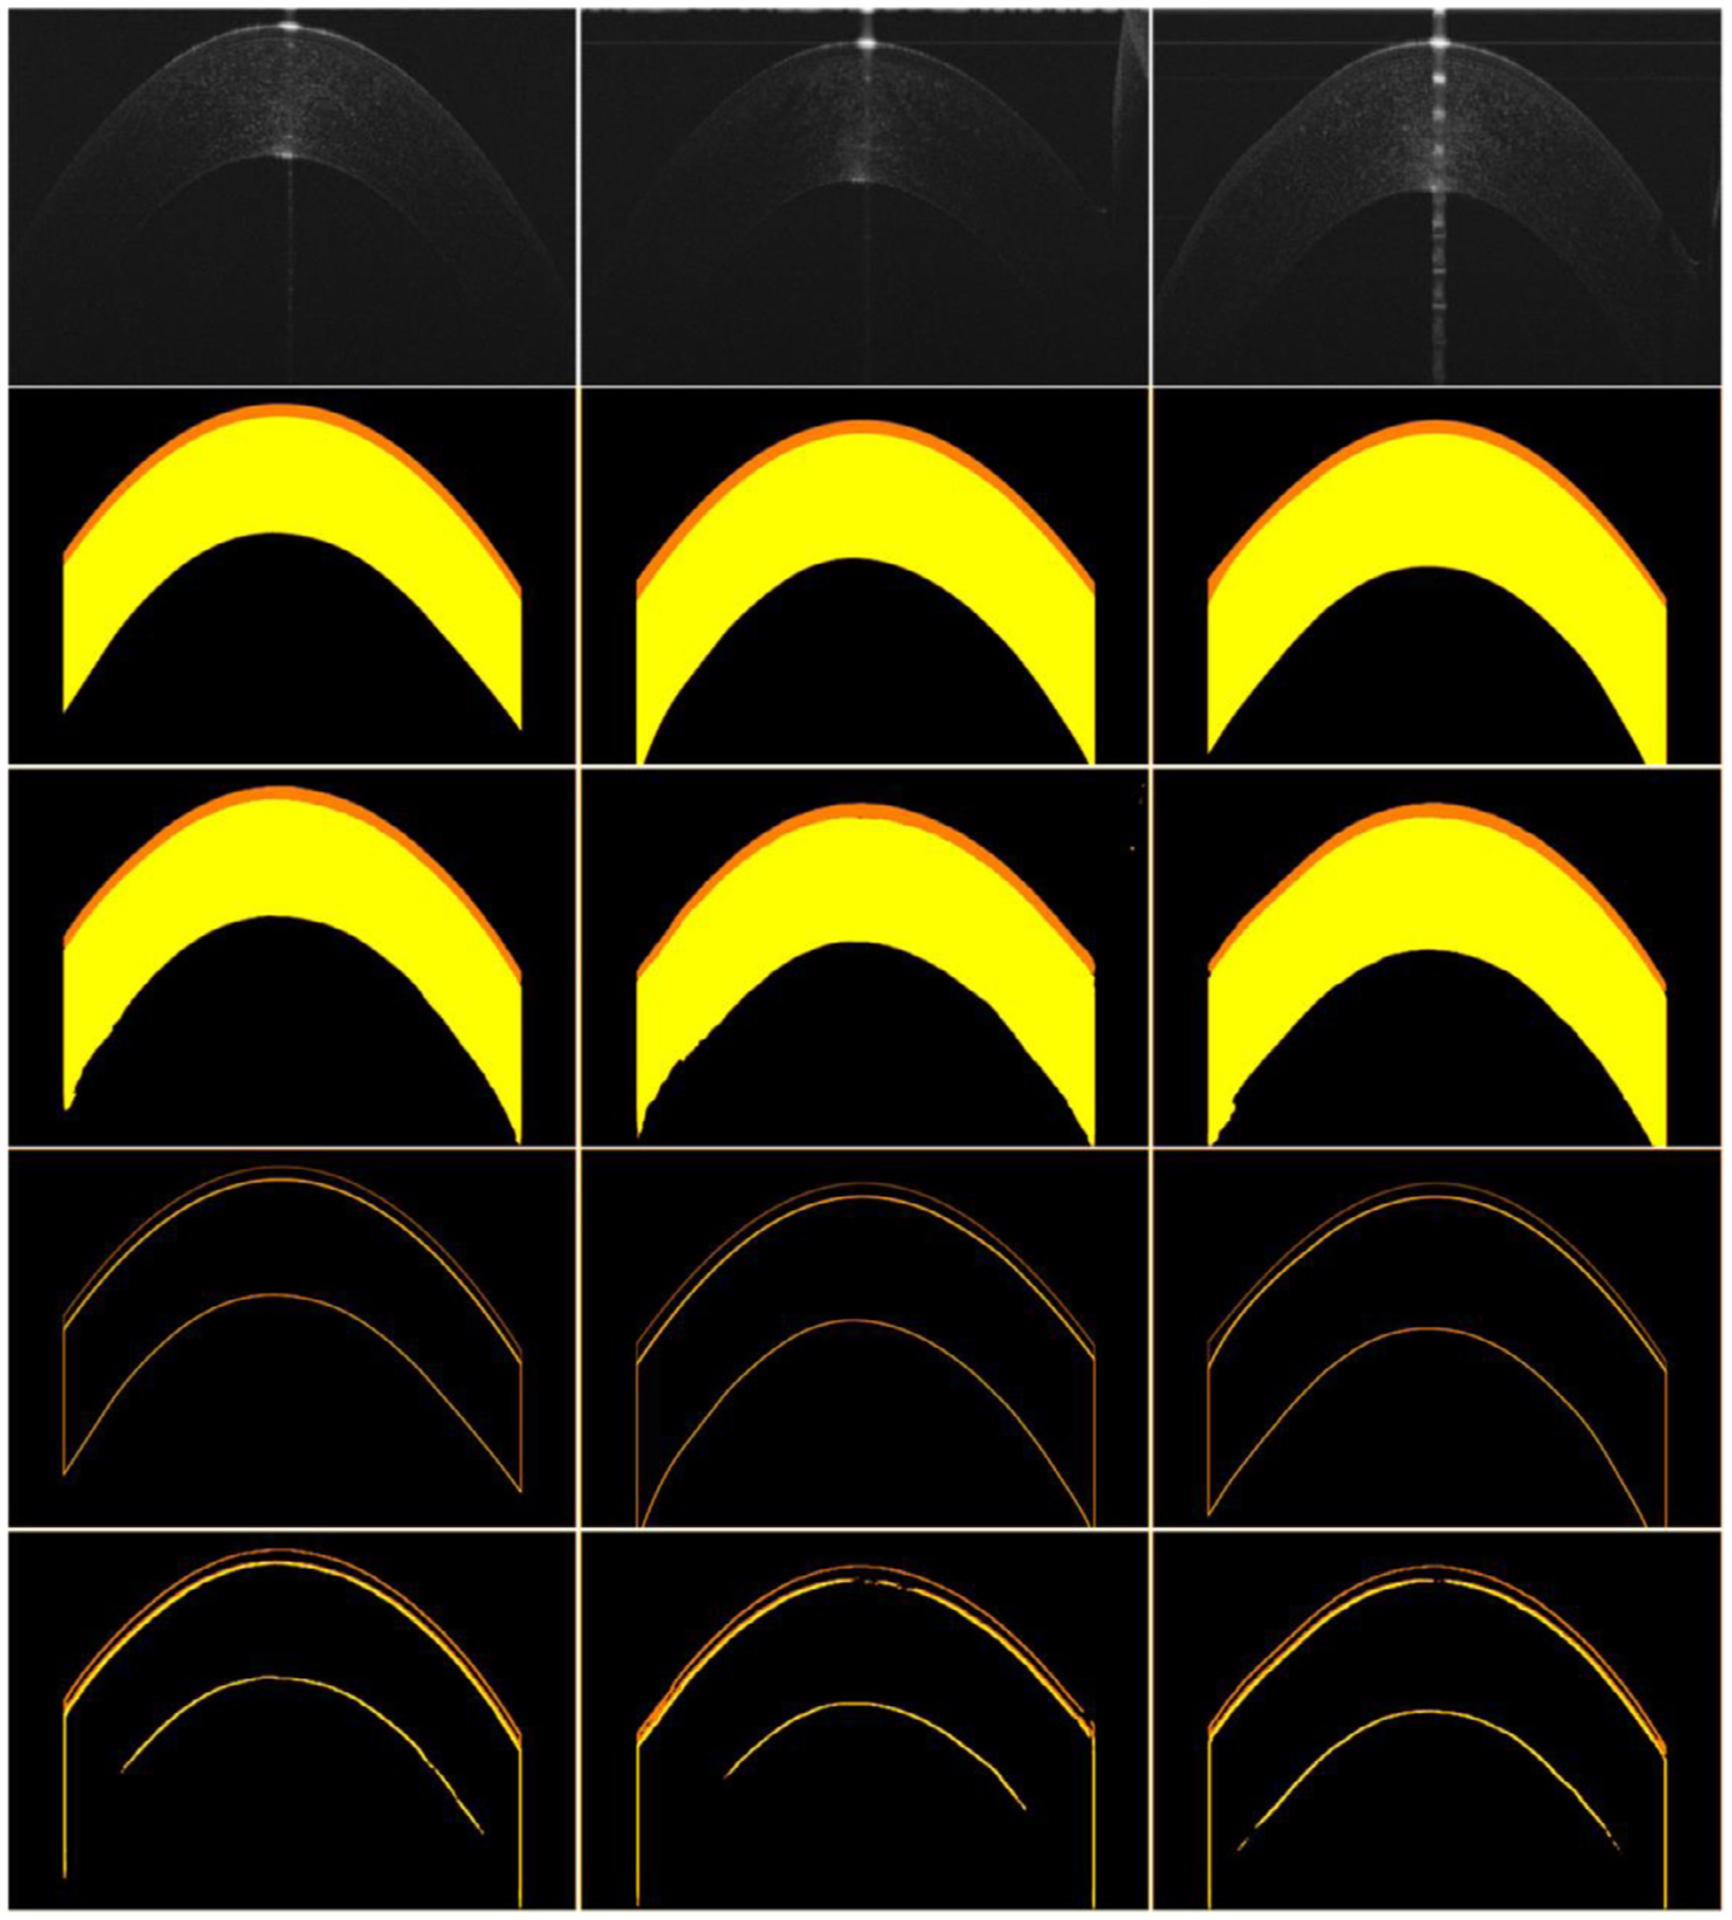
Illustration of the performance of the developed BG-CNN network. The first three rows are the OCT images and their segmentation results by manual annotations and the BG-CNN, respectively. The last two rows are the boundaries of different corneal layers obtained by manual annotations and the BG-CNN, respectively.
3.2. Performance comparison
Tables 2–4 presented the performance differences among the U-Net, AT-Net, AS-Net, BiO-Net, CE-Net, CPFnet, M-Net, Deeplabv3 and BG-CNN in identifying the epithelium and stroma layers depicted on the collected OCT images using the 10-fold cross-validation method. It can be seen from their segmentation results that the U-Net, AT-Net, AS-Net, BiO-Net, CE-Net, and BG-CNN had very similar performance, all of which outperformed the CPFnet, M-Net and Deeplabv3 significantly. Specifically, the BG-CNN achieved the average DSC, IOU and HD of 0.9691, 0.9411, and 7.4423 respectively for two different corneal layers. It was very slightly inferior to the BiO-Net (0.9690, 0.9410, and 7.1981), but superior to the U-Net (0.9684, 0.9397, and 7.3044), AT-Net (0.9682, 0.9395, and 7.1852), AS-Net (0.9685, 0.9402, and 7.395), CE-Net (0.9682, 0.9395, and 7.4599), CPFnet (0.9586, 0.9227, and 7.5743), M-Net (0.9599, 0.9243, and 7.4672) and Deeplabv3 (0.9605, 0.9254, and 7.5064). The examples in Fig. 8 showed the computerized results by the developed algorithm, the U-Net, AT-Net, AS-Net, BiO-Net, CE-Net, CPFnet, M-Net, and Deeplabv3 in identifying the epithelium and stroma layers depicted on OCT images.
Table 2.
The performance of the developed CNN model and other available classical CNN models using the 10-fold cross-validation method on the OCT dataset in terms of the mean and standard deviation (SD) of DSC, IOU, BAC, Se, and HD (in pixel).
| DSC | IOU | BAC | Se | HD | ||
|---|---|---|---|---|---|---|
| Dataset | Method | Mean±SD | Mean±SD | Mean±SD | Mean±SD | Mean±SD |
| Epithelium | U-Net | 0.9523±0.0261 | 0.9100±0.0435 | 0.9788±0.0174 | 0.9593±0.0348 | 7.1493±1.2917 |
| AT-Net | 0.9521±0.0282 | 0.9097±0.0470 | 0.9756±0.0181 | 0.9526±0.0362 | 6.9795±1.2267 | |
| AS-Net | 0.9524±0.0272 | 0.9103±0.0454 | 0.9765±0.0179 | 0.9544±0.0358 | 7.1218±1.3123 | |
| BiO-Net | 0.9532±0.0266 | 0.9118±0.0445 | 0.9767±0.0172 | 0.9548±0.0344 | 7.0271±1.2218 | |
| CE-Net | 0.9526±0.0276 | 0.9108±0.0461 | 0.9761±0.0177 | 0.9537±0.0352 | 7.1246±1.3125 | |
| CPFnet | 0.9367±0.03676 | 0.8829±0.05961 | 0.9571±0.03077 | 0.9152±0.06162 | 7.2889±1.32995 | |
| M-Net | 0.9380±0.0241 | 0.8841±0.0394 | 0.9756±0.0166 | 0.9536±0.0334 | 7.0925±1.1857 | |
| Deeplabv3 | 0.9399±0.02S2 | 0.8879±0.0466 | 0.9726±0.0201 | 0.9472±0.0404 | 7.1015±1.3589 | |
| BG-CNN | 0.9528±0.0255 | 0.9109±0.0426 | 0.9769±0.0171 | 0.9552±0.0340 | 7.3424±1.4527 | |
| Stroma | U-Net | 0.9844±0.0082 | 0.9695±0.0154 | 0.9889±0.0065 | 0.9831±0.0137 | 7.4594±1.3611 |
| AT-Net | 0.9843±0.0088 | 0.9693±0.0166 | 0.9892±0.0067 | 0.9842±0.0140 | 7.3909±1.3649 | |
| AS-Net | 0.9847±0.0088 | 0.9700±0.0166 | 0.9893±0.0071 | 0.9839±0.0146 | 7.5372±1.4061 | |
| BiO-Net | 0.9848±0.0082 | 0.9702±0.0155 | 0.9895±0.0065 | 0.9845±0.0135 | 7.3691±1.3555 | |
| CE-Net | 0.9838±0.0085 | 0.9682±0.0161 | 0.9886±0.0065 | 0.9830±0.0135 | 7.7952±1.4268 | |
| CPFnet | 0.9805±0.0213 | 0.9625±0.0343 | 0.9878±0.0162 | 0.9842±0.0326 | 7.8597±2.0742 | |
| M-Net | 0.9818±0.0139 | 0.9654±0.0250 | 0.9873±0.0120 | 0.9811±0.0241 | 7.8419±1.9938 | |
| Deeplabv3 | 0.9811±0.0087 | 0.9630±0.0163 | 0.9873±0.0067 | 0.9821±0.0142 | 7.9112±1.3979 | |
| BG-CNN | 0.9854±0.0084 | 0.9714±0.0158 | 0.9899±0.0066 | 0.9853±0.0132 | 7.5422±1.4698 |
Table 4.
The p-values of the paired t-tests amongst the developed network and seven available networks on the collected OCT images in terms of the HD (in pixel). (‘-’ indicates invalid statistical analysis).
| Dataset | Method | U-Net | AT-Net | AS-Net | BiO-Net | CE-Net | CPFnet | M-Net | Deeplabv3 |
|---|---|---|---|---|---|---|---|---|---|
| Epithelium | U-Net | - | |||||||
| AT-Net | <0.0001 | - | |||||||
| AS-Net | 0.2703 | <0.0001 | - | ||||||
| BiO-Net | <0.0001 | 0.0405 | <0.0001 | - | |||||
| CE-Net | 0.4095 | <0.0001 | 0.9204 | <0.0001 | - | ||||
| CPFnet | <0.0001 | <0.0001 | <0.0001 | <0.0001 | <0.0001 | - | |||
| M-Net | 0.0414 | <0.0001 | 0.2942 | 0.0174 | 0.2750 | <0.0001 | - | ||
| Deeplabv3 | 0.1035 | <0.0001 | 0.4855 | 0.0070 | 0.4334 | <0.0001 | 0.7583 | - | |
| BG-CNN | <0.0001 | <0.0001 | <0.0001 | <0.0001 | <0.0001 | <0.0001 | <0.0001 | <0.0001 | |
| Dataset | Method | U-Net | AT-Net | AS-Net | BiO-Net | CE-Net | CPFnet | M-Net | Deeplabv3 |
| Stroma | U-Net | - | |||||||
| AT-Net | 0.0055 | - | |||||||
| AS-Net | <0.0001 | <0.0001 | - | ||||||
| BiO-Net | <0.0001 | 0.3624 | <0.0001 | - | |||||
| CE-Net | <0.0001 | <0.0001 | <0.0001 | <0.0001 | - | ||||
| CPFnet | <0.0001 | <0.0001 | <0.0001 | <0.0001 | 0.0065 | - | |||
| M-Net | <0.0001 | <0.0001 | <0.0001 | <0.0001 | 0.2245 | 0.1288 | - | ||
| Deeplabv3 | <0.0001 | <0.0001 | <0.0001 | <0.0001 | <0.0001 | 0.7248 | 0.0807 | - | |
| BG-CNN | <0.0001 | <0.0001 | 0.8457 | <0.0001 | <0.0001 | <0.0001 | <0.0001 | <0.0001 |
Fig. 8.
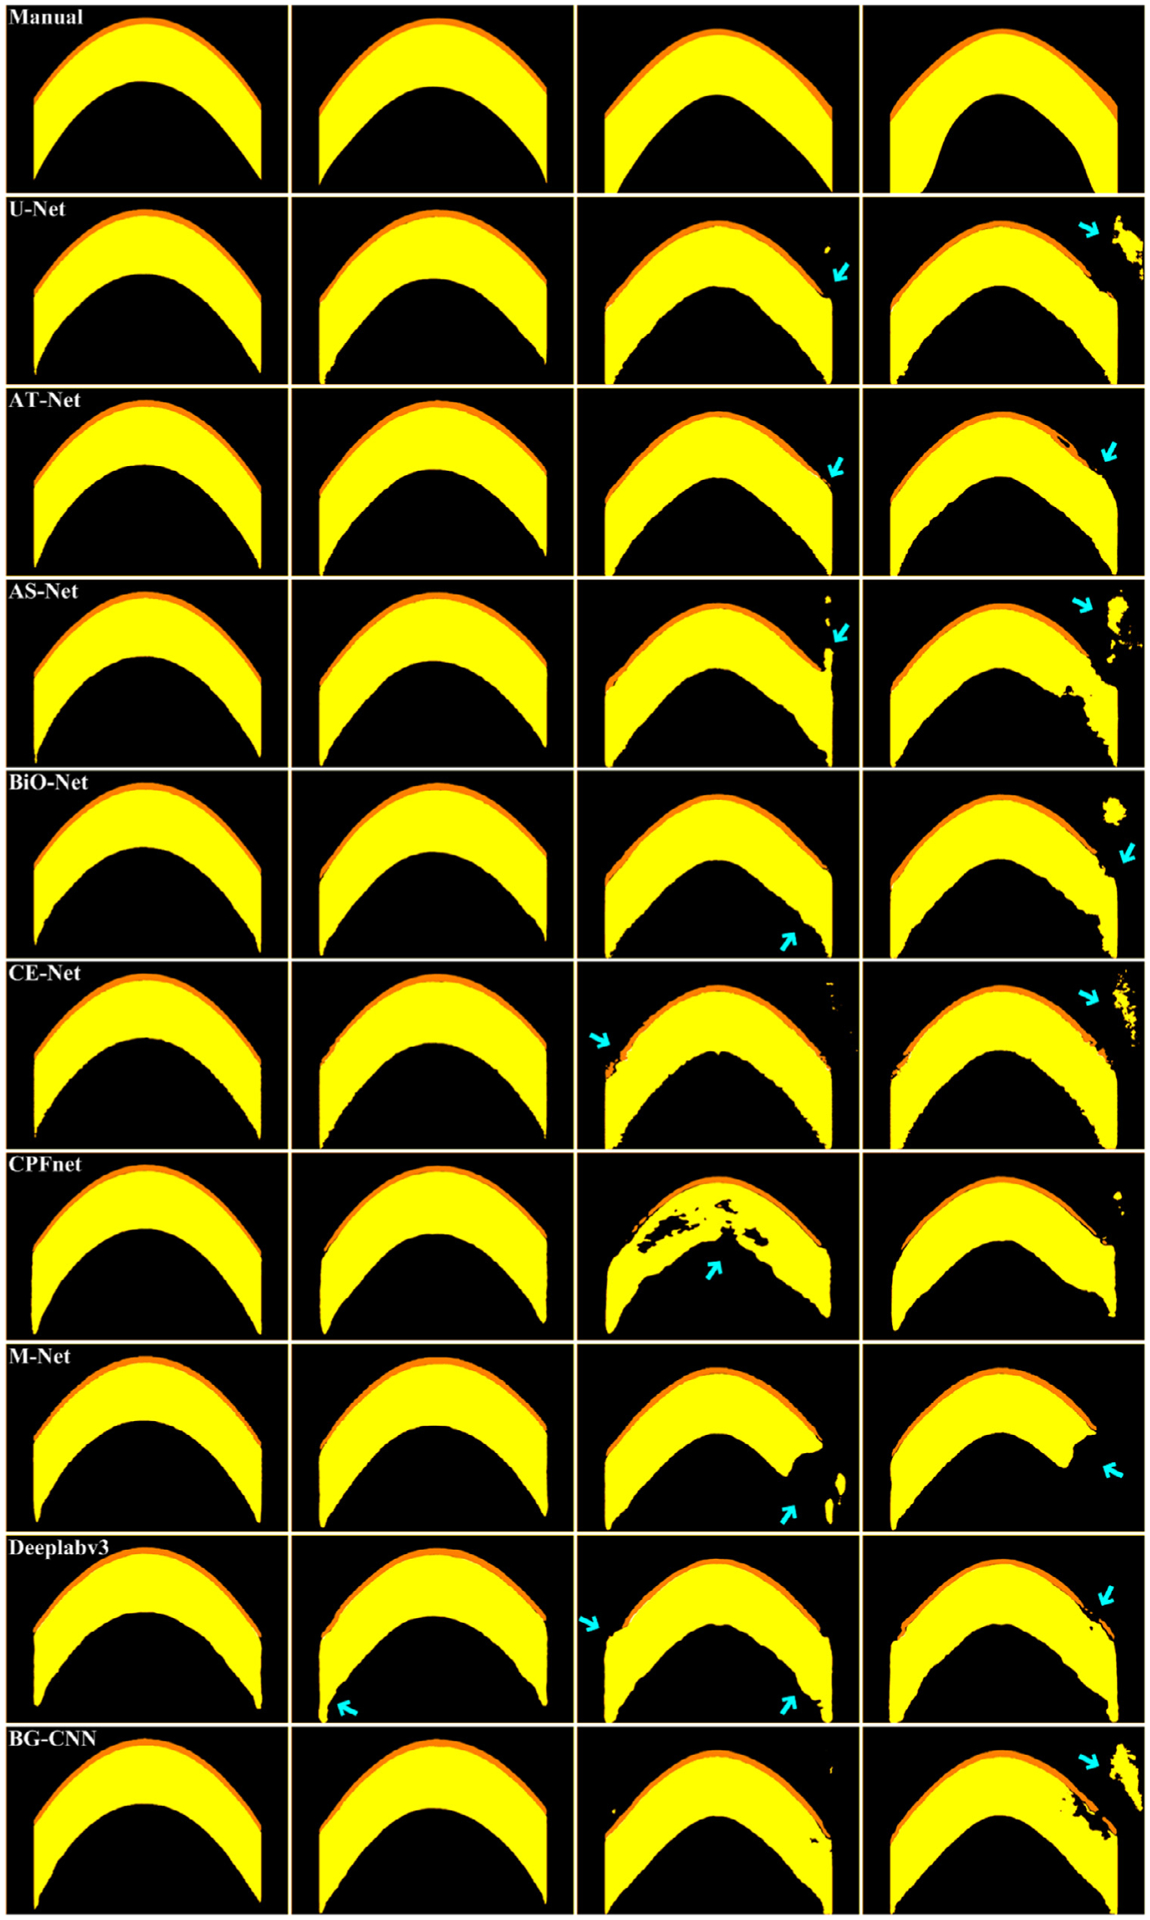
Performance differences of the involved eight segmentation networks in identifying the epithelium and stroma layers from four OCT images. The first row is the manual annotations of the given OCT images. The last seven rows are the segmentation results obtained by the U-Net, AT-Net, AS-Net, BiO-Net, CE-Net, CPFnet, M-Net, Deeplabv3, and BG-CNN, respectively.
3.3. Ablation study
Tables 5 and 6 demonstrated the impact of the parameter λ and the LR for the SGD algorithm, respectively, on the performance of the developed CNN model. The parameter was set to 0.3, 0.5, and 0.7 separately for the same segmentation experiments, while the LR was set to 0.1, 0.01, and 0.001 for the SGD algorithm. The experiments showed that the developed network had the best performance when the parameter and LR were set to 0.5 and 0.01, as compared with those of the other values in image segmentation.
Table 5.
The performance of the developed network with different λ values on the 10th-fold testing set in terms of the mean and standard deviation (SD) of DSC, IOU, BAC, Se, and HD (in pixel).
| DSC | IOU | BAC | Se | HD | ||
|---|---|---|---|---|---|---|
| Dataset | λ | Mean±SD | Mean±SD | Mean±SD | Mean±SD | Mean±SD |
| Epithelium | 0.3 | 0.9267±0.0507 | 0.8673±0.0815 | 0.9596±0.0371 | 0.9210±0.0738 | 7.6957±1.6215 |
| 0.5 | 0.9349±0.0466 | 0.8811±0.0757 | 0.9690±0.0262 | 0.9400±0.0516 | 7.5807±1.7206 | |
| 0.7 | 0.9276±0.0467 | 0.8682±0.0754 | 0.9533±0.0327 | 0.9079±0.0649 | 7.3010±1.3618 | |
| Dataset | λ | DSC | IOU | BAC | Se | HD |
| Mean±SD | Mean±SD | Mean±SD | Mean±SD | Mean±SD | ||
| Stroma | 0.3 | 0.9736±0.0244 | 0.9496±0.0438 | 0.9787±0.0219 | 0.9629±0.0429 | 9.0349±3.0690 |
| 0.5 | 0.9798±0.0150 | 0.9607±0.0276 | 0.9852±0.0134 | 0.9770±0.0259 | 8.1377±2.2932 | |
| 0.7 | 0.9787±0.0180 | 0.9588±0.0328 | 0.9842±0.0161 | 0.9750±0.0315 | 8.3968±2.7015 |
Table 6.
The performance of the BG-CNN with different learning rates (LR) for the SGD on the 10th-fold testing set in terms of the mean and standard deviation (SD) of DSC, IOU, BAC, Se, and HD (in pixel).
| DSC | IOU | BAC | Se | HD | ||
|---|---|---|---|---|---|---|
| Dataset | LR | Mean±SD | Mean±SD | Mean±SD | Mean±SD | Mean±SD |
| Epithelium | 0.1 | 0.8923±0.0627 | 0.8108±0.0945 | 0.9260±0.0522 | 0.8535±0.1047 | 7.8379±1.3502 |
| 0.01 | 0.9349±0.0466 | 0.8811±0.0757 | 0.9690±0.0262 | 0.9400±0.0516 | 7.5807±1.7206 | |
| 0.001 | 0.9032±0.0607 | 0.8286±0.0926 | 0.9405±0.0497 | 0.8830±0.0995 | 8.3357±1.2917 | |
| Dataset | LR | DSC | IOU | BAC | Se | HD |
| Mean±SD | Mean±SD | Mean±SD | Mean±SD | Mean±SD | ||
| Stroma | 0.1 | 0.9316±0.0520 | 0.8762±0.0861 | 0.9426±0.0432 | 0.8932±0.0836 | 13.273±3.9109 |
| 0.01 | 0.9798±0.0150 | 0.9607±0.0276 | 0.9852±0.0134 | 0.9770±0.0259 | 8.1377±2.2932 | |
| 0.001 | 0.9731±0.0206 | 0.9484±0.0369 | 0.9796±0.0179 | 0.9672±0.0336 | 9.1481±2.1374 |
Table 7 presented the impact of the subtraction operation on the segmentation performance of the developed CNN architecture, which was combined with different element-wise operations (i.e., the addition [42], multiplication [43], and subtraction [20]) to extract two corneal layers depicted on OCT images. As showed by the results, the model with the subtraction operation had the higher accuracy than its counterparts with the addition and multiplication operations in terms of the DSC, IOU and HD.
Table 7.
The performance of the developed network with addition, multiplication and subtract operations on the 10th-fold testing set in terms of the mean and standard deviation (SD) of DSC, IOU, BAC, Se, and HD (in pixel).
| DSC | IOU | BAC | Se | HD | ||
|---|---|---|---|---|---|---|
| Dataset | Operation | Mean±SD | Mean±SD | Mean±SD | Mean±SD | Mean±SD |
| Epithelium | Addition | 0.9288±0.0481 | 0.8706±0.0779 | 0.9667±0.0313 | 0.9357±0.0620 | 7.9404±1.7353 |
| Multiplication | 0.9050±0.0627 | 0.8320±0.0965 | 0.9365±0.0512 | 0.8746±0.1025 | 7.6783±1.5086 | |
| Subtraction | 0.9349±0.0466 | 0.8811±0.0757 | 0.9690±0.0262 | 0.9400±0.0516 | 7.5807±1.7206 | |
| Dataset | Operation | DSC | IOU | BAC | Se | HD |
| Mean±SD | Mean±SD | Mean±SD | Mean±SD | Mean±SD | ||
| Stroma | Addition | 0.9786±0.0163 | 0.9586±0.0301 | 0.9835±0.0153 | 0.9728±0.0312 | 8.7070±3.0603 |
| Multiplication | 0.9634±0.0377 | 0.9318±0.0649 | 0.9716±0.0323 | 0.9518±0.0628 | 10.358±4.2936 | |
| Subtraction | 0.9798±0.0150 | 0.9607±0.0276 | 0.9852±0.0134 | 0.9770±0.0259 | 8.1377±2.2932 |
4. Discussion
We developed a novel CNN architecture called BG-CNN to automatically segment corneal layers on OCT images and validated it using the 10-fold cross-validation method. The developed architecture used two different network modules to extract target objects and their boundaries. The integration of the two modules aims to largely alleviate the problems caused by the multiple down-sampling operations and thus effectively deal with the object boundaries with limited sensitivity to image artifact or noise. As a way to highlight the advantage of the developed method in segmentation performance, we compared the performance of the developed CNN model with the other eight available networks (i.e., the U-Net, AT-Net, AS-Net, BiO–Net, CE-Net, CPFnet, M-Net, and Deeplabv3) on the same dataset. Our quantitative experiments demonstrated the developed BG-CNN was slightly inferior to the BiO–Net, but significantly superior to the other seven segmentation models based on the same dataset (see Tables 2–4). However, the developed network needs much more time for the training procedures (7.329 h) than the U-Net (6.968 h), AS-Net (6.810 h), M-Net (7.046 h), and CPFnet (4.4727 h), but less than the AT-Net (8.127 h), BiO–Net (7.496 h), CE-Net (19.551 h), and Deeplabv3 (15.247 h).
The involved networks demonstrated very different segmentation performance when compared with previous studies [31–33]. For example, the CE-Net and CPFnet were inferior to the U-Net in our experiment, but superior to it in the studies [32,33]. The performance differences of these networks in different studies may be caused by the following facts: First, many different backbone networks were used for the involved networks (e.g., U-Net and Deeplabv3), making their performance very different. Second, the involved networks were trained using different image dimensions, data augmentation technologies, cost functions, optimization algorithms as well as the learning rates. This can lead to a large performance difference for a given network in different segmentation experiments. Third, some invovled networks were performed using different deep learning libraries (i.e., Keras and Pytorch), making some convolutional operations have slight different results, and thus giving rise to different segmentation performance. However, given the same dataset and experiment configuration, the developed network showed reasonable potential to identify corneal layers depicted on OCT images, as compared with the other eight segmentation networks.
In CNN-based deep learning, the cost function is used to assess the agreement between the output of a segmentation network and the ground truth (e.g., manual annotations by human experts). In our application, there are two target objects. Hence, it is natural to use two cost functions for each object, thereby leading to a weighted loss function. The weighted loss function was optimized to assure that the segmented regions agree with their manual annotations as well as possible. If only one loss function was used (i.e., λ=0 or 1), the target objects and their boundaries cannot be taken into account simultaneously, ultimately leading to the degradation of the segmentation performance. That is why the weighting parameter λ was set to 0.5 (Table 5). For segmentation purposes, the DSC has some unique characteristics, such as (1) DSC considers both the false positive and the false negative and (2) can effectively alleviate the class imbalance problem that the image backgrounds contain much more pixels than the foreground regions.
We are aware that there are limitations with this study. First, the developed CNN architecture may not identify the cornea layers well for some images with very poor qualities, such as those in Fig. 10. The extremely low contrast reduced the sensitivity of the introduced convolutional blocks to the object boundaries. It remains a challenge to identify the cornea layers on the images with very poor quality. Second, the introduction of the EDM module leads to an increase of the parameter number in the BG-CNN models, which makes it relatively time-consuming to train the model. Third, we trained the CNN models using a small image size (i.e., 256×256 pixels) due to the limited GPU memory of the computer. Due to the small image size or resolution, some detailed structures may be lost and thus lead to inaccurate segmentation. This can be partly alleviated by using a larger image size (e.g., 512 ×512 pixels), but need a very high requirement on computer hardware for the training procedures [44–46]. Despite these limitations, the developed network demonstrated an exciting performance in segmenting various corneal layers depicted on OCT images.
Fig. 10.
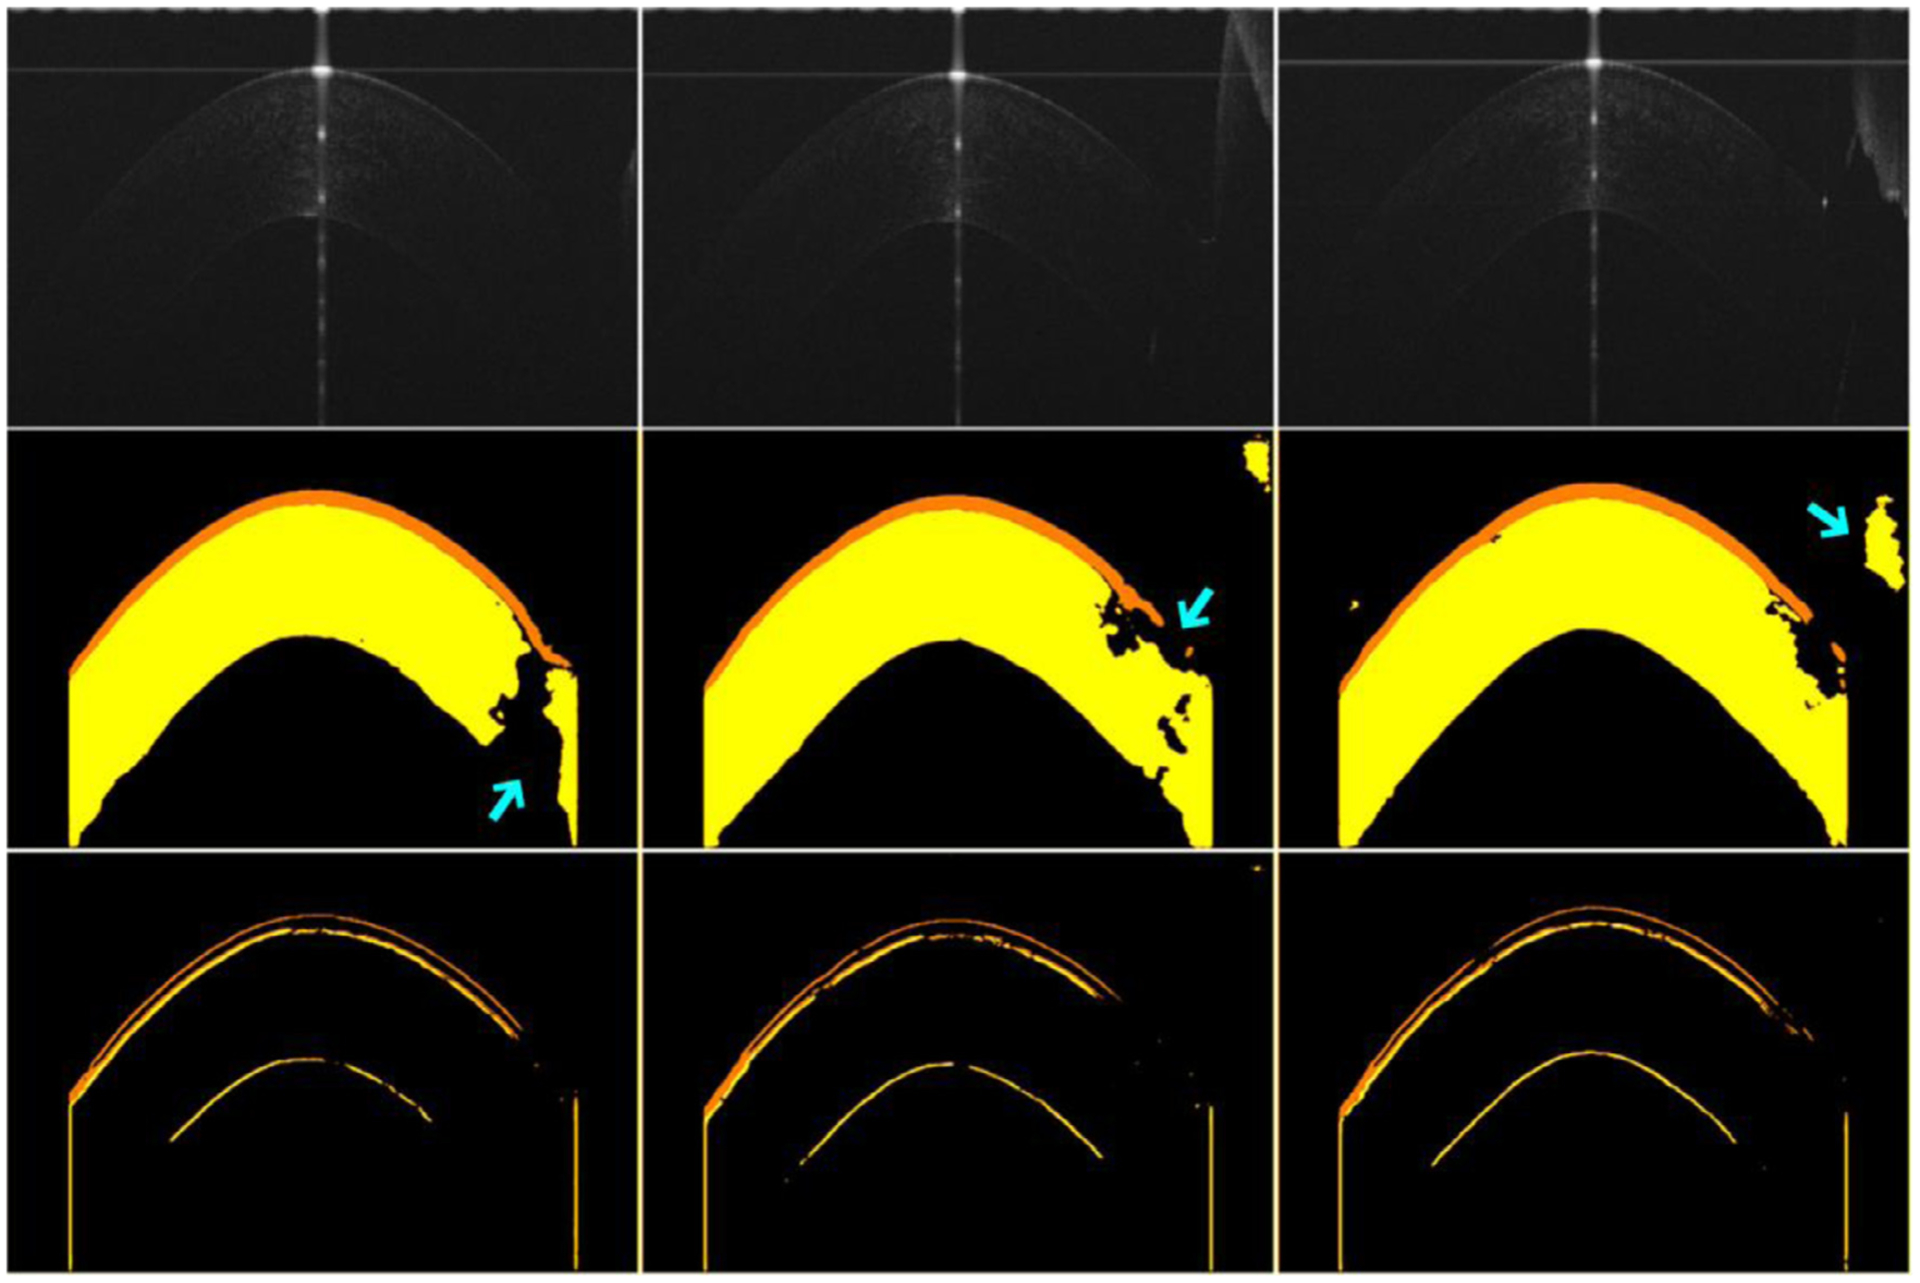
The segmentation results of the developed network on three different OCT images with very weak contrast or severe artifact.
Conclusion
We described a novel CNN architecture, namely BG-CNN, for automated segmentation of the corneal layers depicted on OCT images. Its novelty lies in the introduction of three convolutional blocks and two network modules. The underlying motivation was to extract target objects and their boundaries. Given the correlation between the objects and their boundaries, the integration of two modules can accelerate the detection / location of the objects and lead to a more accurate and reliable segmentation of the corneal layers depicted on OCT images. Our experiments demonstrated that the developed CNN architecture consistently outperforms the available classical CNN models under the same training and validation conditions. In the future, we will test the developed architecture on other types of medical images (e.g., color fundus images) to verify its generic characteristic.
Fig. 9.
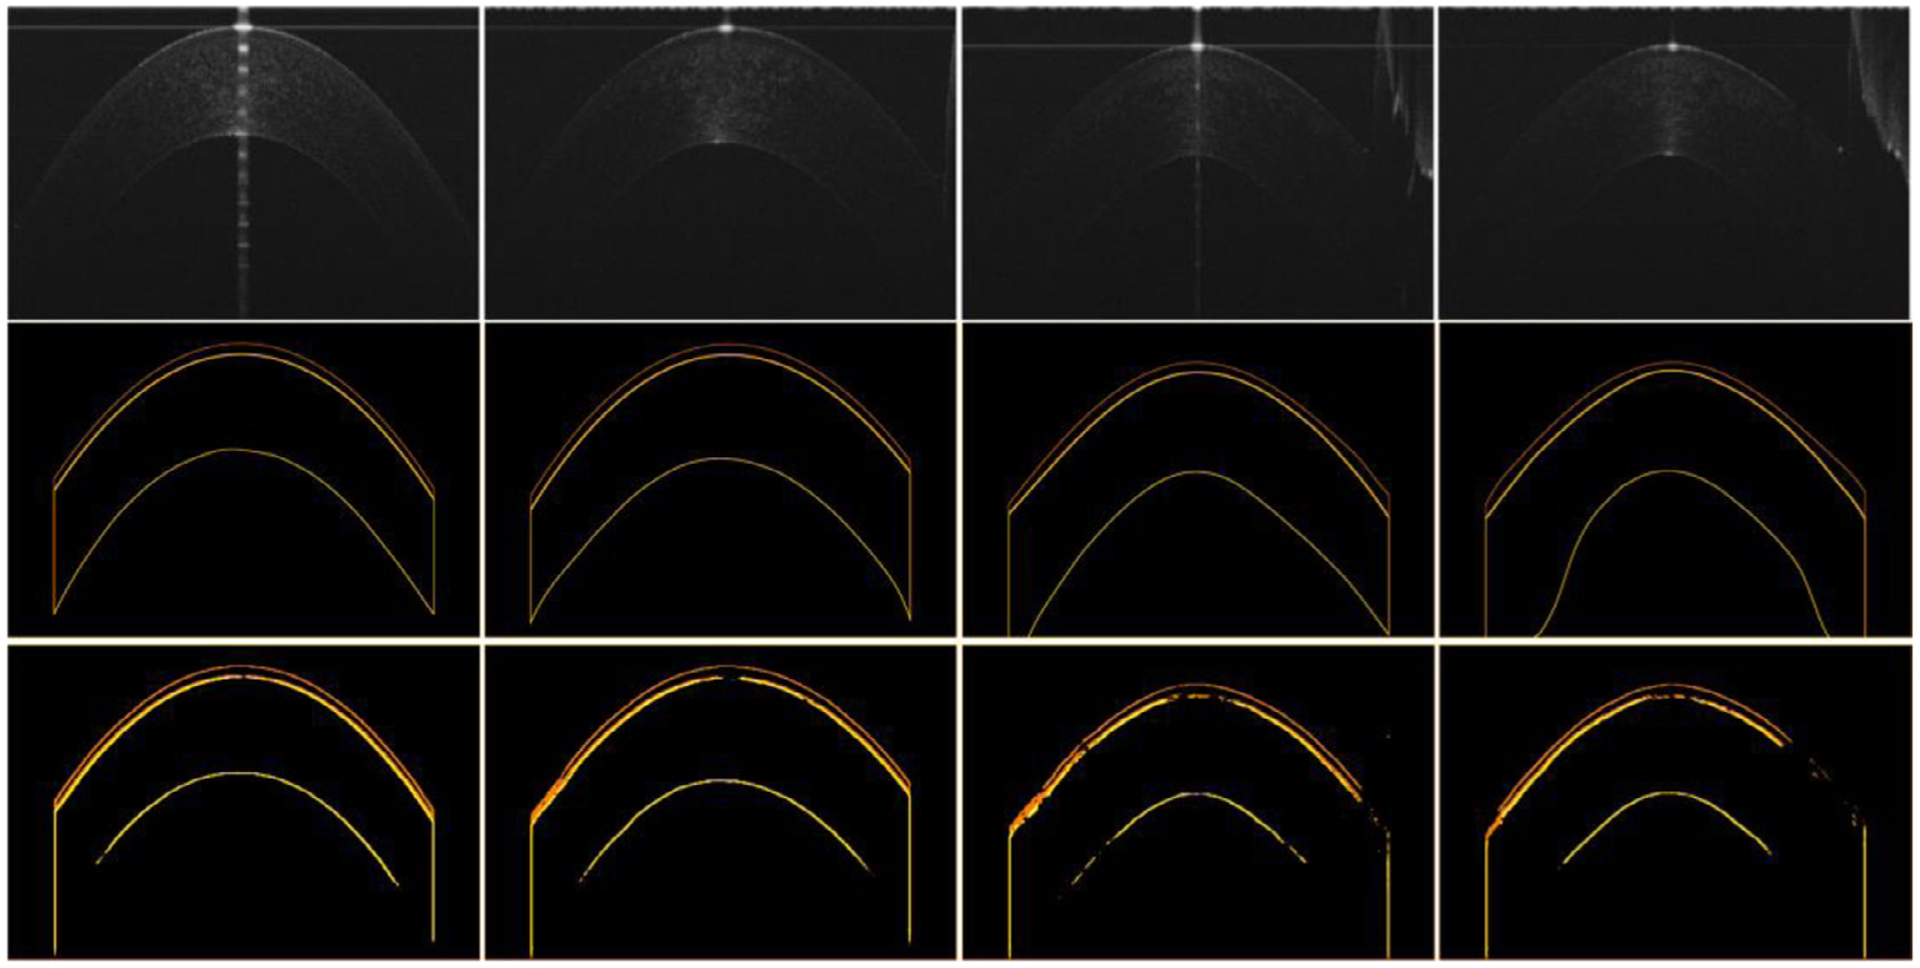
The boundaries of the epithelium and stroma layers identified by the BG-CNN for the OCT images in Fig. 8. The first two rows are the original OCT images and their manually annotated boundaries. The last row is the results obtained by the BG-CNN network.
Table 3.
The p-values of the paired t-tests amongst the developed network and seven available networks on the collected OCT images in terms of the IOU. (‘-’ indicates invalid statistical analysis).
| Dataset | Method | U-Net | AT-Net | AS-Net | BiO-Net | CE-Net | CPFnet | M-Net | Deeplabv3 |
|---|---|---|---|---|---|---|---|---|---|
| Epithelium | U-Net | - | |||||||
| AT-Net | 0.5605 | - | |||||||
| AS-Net | 0.3446 | 0.1615 | - | ||||||
| BiO-Net | <0.0001 | <0.0001 | <0.0001 | - | |||||
| CE-Net | 0.1086 | 0.0478 | 0.3007 | 0.0252 | - | ||||
| CPFnet | <0.0001 | <0.0001 | <0.0001 | <0.0001 | <0.0001 | - | |||
| M-Net | <0.0001 | <0.0001 | <0.0001 | <0.0001 | <0.0001 | 0.0184 | - | ||
| Deeplabv3 | <0.0001 | <0.0001 | <0.0001 | <0.0001 | <0.0001 | <0.0001 | <0.0001 | - | |
| BG-CNN | 0.0431 | 0.0228 | 0.1900 | 0.0379 | 0.8020 | <0.0001 | <0.0001 | <0.0001 | |
| Dataset | Method | U-Net | AT-Net | AS-Net | BiO-Net | CE-Net | CPFnet | M-Net | Deeplabv3 |
| Stroma | U-Net | - | |||||||
| AT-Net | 0.2270 | - | |||||||
| AS-Net | 0.0016 | <0.0001 | - | ||||||
| BiO-Net | <0.0001 | <0.0001 | 0.1006 | - | |||||
| CE-Net | <0.0001 | <0.0001 | <0.0001 | <0.0001 | - | ||||
| CPFnet | <0.0001 | <0.0001 | <0.0001 | <0.0001 | <0.0001 | - | |||
| M-Net | <0.0001 | <0.0001 | <0.0001 | <0.0001 | <0.0001 | 0.0001 | - | ||
| Deeplabv3 | <0.0001 | <0.0001 | <0.0001 | <0.0001 | <0.0001 | 0.6809 | <0.0001 | - | |
| BG-CNN | <0.0001 | <0.0001 | <0.0001 | <0.0001 | <0.0001 | <0.0001 | <0.0001 | <0.0001 |
Acknowledgments
This work is supported by Wenzhou Science and Technology Bureau (Grant No. Y2020035), State’s Key Project of Research and Development Plan (Grant No. 2017YFC0109202), National Natural Science Foundation of China (Grant No. 62006175), and Key Laboratory of Computer Network and Information Integration (Southeast University), Ministry of Education (Grant No. K93-9-2020-03).
Biography
LEI WANG received the B.Sc. degree in Mechanical Engineering and Automation from Qingdao University of Science and Technology, Qingdao, China, in 2010, the Ph.D. degree in Mechatronic Engineering from University of Chinese Academy of Sciences in 2015. His research interests include image segmentation and registration, pattern recognition, and machine learning.
Footnotes
Declaration of Competing Interest
The authors declare that they have no known competing financial interests or personal relationships that could have appeared to influence the work reported in this paper.
References
- [1].Delmonte D, Kim T, Anatomy and physiology of the cornea, J. Cataract Refract. Surg 37 (3) (2011) 0–598. [DOI] [PubMed] [Google Scholar]
- [2].Liu A, Brown D, Conn R, McNabb P, Pardue M, Kuo A, Topography and pachymetry maps for mouse corneas using optical coherence tomography, Exp. Eye Res 190 (2019) 107868. [DOI] [PMC free article] [PubMed] [Google Scholar]
- [3].Wolffsohn J, Bhogal G, Shah S, Effect of uncorrected astigmatism on vision, J. Cataract Refract. Surg 37 (2011) 454–460. [DOI] [PubMed] [Google Scholar]
- [4].Wang J, Shousha M, Perez V, Karp C, Yoo S, Shen M, Cui L, Hurmeric V, Du C, Zhu D, Chen Q, Li M, Ultra-high resolution optical coherence tomography for imaging the anterior segment of the eye, Ophthal. Surg. Lasers Imaging 42 (2011) S15–S27. [DOI] [PubMed] [Google Scholar]
- [5].Shousha M, Perez V, Canto A, Vaddavalli P, Sayyad F, Cabot F, Feuer W, Wang J, Yoo S, The use of Bowman’s layer vertical topographic thickness map in the diagnosis of keratoconus, Ophthalmology 121 (2014) 988–993. [DOI] [PMC free article] [PubMed] [Google Scholar]
- [6].Shousha M, Yoo S, Sayed M, Edelstein S, Council M, Shah R, Abernathy J, Schmitz Z, Stuart P, Bentivegna R, Fernandez M, Smith C, Yin X, Harocopos G, Dubovy S, Feuer W, Wang J, Perez V, In vivo characteristics of corneal endothelium/descemet membrane complex for the diagnosis of corneal graft rejection, Am. J. Ophthalmol 178 (2017) 27–37. [DOI] [PMC free article] [PubMed] [Google Scholar]
- [7].Roongpoovapatr V, Elsawy A, Wen D, Kanokkantapong J, Ahmed I, Syed Z, Mottaleb M, Yoo S, Shousha M, Three-dimensional Bowmans microlayer optical coherence tomography for the diagnosis of subclinical keratoconus, Invest. Ophthalmol. Vis. Sci 59 (2018) 5742. [Google Scholar]
- [8].Rabbani H, Kafieh R, Amini Z, Optical Coherence Tomography Image Analysis, Wiley Encyclopdia of Electrical and Electronics Engineering, John Wiley & Sons, Inc, 2016. [Google Scholar]
- [9].Shousha M, Karp C, Perez V, Hoffmann R, Ventura R, Chang V, Dubovy S, Wang J, Diagnosis and management of conjunctival and corneal intraepithelial neoplasia using ultra highresolution optical coherence tomography, Ophthalmology 118 (2011) 1531–1537. [DOI] [PubMed] [Google Scholar]
- [10].Hoffmann R, Shousha M, Karp C, Awdeh R, Kieval JS Dubovy L. Perez, Chang V, Yoo S, Wang J, Optical biopsy of corneal-conjunctival intraepithelial neoplasia using ultra-high resolution optical coherence tomography, Invest. Ophthalmol. Vis. Sci 50 (2009) 5795. [Google Scholar]
- [11].Geroge N, Jiji C, Two stage contour evolution for automatic segmentation of choroid and cornea in OCT images, Biocybernet. Biomed. Eng 39 (2019) 686–696. [Google Scholar]
- [12].Rabbani H, Kafieh R, Jahromi M, Jorjandi S, Dehnavi A, Hajizadeh F, Peyman A, Obtaining thickness maps of corneal layers using the optimal algorithm for intracorneal layer segmentation, Int. J. Biomed. Imaging 1420230 (2016). [DOI] [PMC free article] [PubMed] [Google Scholar]
- [13].LaRocca F, Chiu S, McNabb R, Kuo A, Izatt J, Farsiu S, Robust automatic segmentation of corneal layer boundaries in SDOCT images using graph theory and dynamic programming, Biomed. Opt. Express 2 (2011) 1524. [DOI] [PMC free article] [PubMed] [Google Scholar]
- [14].Eichel J, Mishra A, Clausi D, Fieguth P, Bizheva K, A novel algorithm for extraction of the layers of the cornea, in: Proceeding of the 2009 Canadian Conference on Computer and Robot Vision, CRV; 2009, 2009, pp. 313–320. [Google Scholar]
- [15].Elsawy A, Mottaleb M, Sayed I, Wen D, Roongpoovapatr V, Eleiwa T, Sayed A, Raheem M, Gameiro G, Shousha M, Automatic segmentation of corneal microlayers on optical coherence tomography images, Transl. Vis. Sci. Technol 8 (3) (2019) 39. [DOI] [PMC free article] [PubMed] [Google Scholar]
- [16].Wang L, Chen G, Shi D, Chang Y, Chan S, Pu J, Yang X, Active contours driven by edge entropy fitting energy for image segmentation, Signal Process. 149 (2018) 27–35. [DOI] [PMC free article] [PubMed] [Google Scholar]
- [17].Wang L, Zhang L, Yang X, Yi P, Chen H, Level set based segmentation using local fitted images and inhomogeneity entropy, Signal Process. 167 (2020) 107297. [Google Scholar]
- [18].Kuruvilla J, Sukumaran D, Sankar A, Joy S, A review on image processing and image segmentation, 2016 International Conference on Data Mining and Advanced Computing (SAPIENCE), 198–203, 2016. [Google Scholar]
- [19].Ge R, Yang G, Chen Y, Luo L, Feng C, Ma H, Ren J, Li S, K-net: integrate left ventricle segmentation and direct quantification of paired echo sequence, IEEE Trans. Med. Imaging 39 (5) (2020) 1690–1702. [DOI] [PubMed] [Google Scholar]
- [20].Wang L, Gu J, Chen Y, Liang Y, Zhang W, Pu J, Chen H, Automated segmentation of the optic disc from fundus images using an asymmetric deep learning network, Pattern Recognit. 112 (2021) 107810. [DOI] [PMC free article] [PubMed] [Google Scholar]
- [21].Wang L, Liu H, Lu Y, Chen H, Zhang J, Pu J, A coarse-to-fine deep learning framework for optic disc segmentation in fundus images, Biomed. Signal Process. Control 51 (2019) 82–89. [DOI] [PMC free article] [PubMed] [Google Scholar]
- [22].Passalis N, Raitoharju J, Tefas A, Gabbouj M, Efficient adaptive inference for deep convolutional neural networks using hierarchical early exists, Pattern Recognit. 105 (2020) 107346. [Google Scholar]
- [23].Wang L, Liu H, Zhang J, Chen H, Pu J, Automated segmentation of the optic disc using the deep learning, SPIE on Medical Imaging 2019: Image Processing, 2019. [Google Scholar]
- [24].Wu J, Wen Z, Zhao S, Huang K, Video semantic segmentation via feature propagation with holistic attention, Pattern Recognit. 104 (2020) 107268. [Google Scholar]
- [25].Agostinelli F, Hoffman M, Sadowski P, Baldi P, Learning activation functions to improve deep neural networks, international conference on learning representations (ICLR), 2015. [Google Scholar]
- [26].Ioffe S, Szegedy C, Batch normalization: accelerating deep network training by reducing internal covariate shift, in: Proceedings of the 32nd International Conference on Machine Learning, 2015. [Google Scholar]
- [27].Liu H, Wang L, Nan Y, Jin F, Wang Q, Pu J, SDFN:segmentation-based deep fusion network for thoracic disease classification in chest X-ray images, Comput. Med. Imaging Graph 75 (2019) 66–73. [DOI] [PMC free article] [PubMed] [Google Scholar]
- [28].Ronneberger O, Fischer P, Brox T, U-Net: convolutional networks for biomedical image segmentation, International Conference on Medical Image Computing and Computer Assisted Intervention (MICCAI), 2015. [Google Scholar]
- [29].Oktay O, Schlemper J, Folgoc L, Lee M, Heinrich M, Misawa K, Mori K, McDonagh S, Hammerla N, Kainz B, Glocker B, Rueckert D, Attention U-Net: learning where to look for the pancreas, Conference on Medical Imaging with Deep Learning, 2018. [Google Scholar]
- [30].Xiang T, Zhang C, Liu D, Song Y, Huang H, Cai W, BiO-Net: learning recurrent bi-directional connections for encoder-decoder architecture, International Conference on Medical Image Computing and Computer Assisted Intervention, 2020. [Google Scholar]
- [31].Gu Z, Cheng J, Fu H, Zhou K, Hao H, Zhao Y, Zhang T, Gao S, Liu J, CE-Net: context encoder network for 2D medical image segmentation, IEEE Trans. Med. Imaging 38 (10) (2019) 2281–2292. [DOI] [PubMed] [Google Scholar]
- [32].Feng S, Zhao H, Shi F, Cheng X, Wang M, Ma Y, Xiang D, Zhu W, Chen X, CPFNet: context pyramid fusion network for medical image segmentation, IEEE Trans. Med. Imaging 39 (10) (2020) 3008–3018. [DOI] [PubMed] [Google Scholar]
- [33].Fu H, Cheng J, Xu Y, Wong D, Liu J, Cao X, Joint optic disc and cup segmentation based on multi-label deep network and polar transformation, IEEE Trans. Med. Imaging 37 (7) (2018) 1597–1605. [DOI] [PubMed] [Google Scholar]
- [34].Wang S, Yu L, Yang X, Fu C, Heng P, Patch-based output space adversarial learning for joint optic disc and cup segmentation, IEEE Trans. Med. Imaging 38 (11) (2019) 2485–2495. [DOI] [PubMed] [Google Scholar]
- [35].Santos V, Schmetterer L, Stegmann H, Pfister M, Messner A, Schmidinger G, Garhofer G, Werkmeister R, CorneaNet: fast segmentation of cornea OCT scans of healthy and keratoconic eyes using deep learning, Biomed. Opt. Express 10 (2) (2019) 622. [DOI] [PMC free article] [PubMed] [Google Scholar]
- [36].Fabijanska A, Segmentation of corneal endothelium images using a U-Net-based convolutional neural network, Artif. Intell. Med 88 (2018) 1–13. [DOI] [PubMed] [Google Scholar]
- [37].Dai W, Dong N, Wang Z, Liang X, Zhang H, Xing E, SCAN: structure correcting adversarial network for organ segmentation in chest X-rays, deep learning in medical image analysis and multimodal learning for clinical decision support, DLMIA (2018). [Google Scholar]
- [38].Wang L, Shen M, Chang Q, Shi C, Zhou Y, Pu J, BG-CNN: a boundary guided convolutional neural network for corneal layer segmentation from optical coherence tomography, Conference on Biomedical Signal and Image Processing (ICBIP), 2020. [Google Scholar]
- [39].Zhang S, Fu H, Yan Y, Zhang Y, Wu Q, Yang M, Tan M, Xu Y, Attention guided network for retinal image segmentation, International Conference on Medical Image Computing and Computer Assisted Intervention (MICCAI), 2019. [Google Scholar]
- [40].Wang X, Huang D, Xu H, An efficient local Chan-vese model for image segmentation, Pattern Recognit. 43 (2010) 603–618. [Google Scholar]
- [41].Wang L, Zhu J, Sheng M, Cribb A, Zhu S, Pu J, Simultaneous segmentation and bias field estimation using local fitted images, Pattern Recognit. 74 (2018) 145–155. [DOI] [PMC free article] [PubMed] [Google Scholar]
- [42].Wang L, Chang Y, Wang H, Wu Z, Pu J, Yang X, An active contour model based on local fitted images for image segmentation, Inf. Sci. (Ny) 418 (2017) 61–73. [DOI] [PMC free article] [PubMed] [Google Scholar]
- [43].He K, Zhang X, Ren S, Sun J, Deep residual learning for image recognition, IEEE Conference on Computer Vision and Pattern Recognition (CVPR), 2016. [Google Scholar]
- [44].Zhang Z, Fu H, Dai H, Shen J, Pang Y, Shao L, ET-Net: a generic edge-attention guidance network for medical image segmentation, International Conference on Medical Image Computing and Computer Assisted Intervention (MICCAI), 2019. [Google Scholar]
- [45].Wang L, Liu H, Zhang J, Chen H, Pu J, Computerized assessment of glaucoma severity based on color fundus images, SPIE Medical Imaging 2019: Biomedical Applications in Molecular, Structural, and Functional Imaging, 2019. [Google Scholar]
- [46].Szegedy C, Vanhoucke V, Ioffe S, Shlens J, Wojna Z, Rethinking the inception architecture for computer vision, IEEE Conference on Computer Vision and Pattern Recognition (CVPR), 2016. [Google Scholar]


