Abstract
We report the non-adiabatic dynamics of VIIICl3(ddpd), a complex based on the Earth-abundant first-row transition metal vanadium with a d2 electronic configuration which is able to emit phosphorescence in solution in the near-infrared spectral region. Trajectory surface-hopping dynamics based on linear vibronic coupling potentials obtained with CASSCF provide molecular-level insights into the intersystem crossing from triplet to singlet metal-centered states. While the majority of the singlet population undergoes back-intersystem crossing to the triplet manifold, 1–2% remains stable during the 10 ps simulation time, enabling the phosphorescence described in Dorn et al. Chem. Sci., 2021, DOI: 10.1039/D1SC02137K. Competing with intersystem crossing, two different relaxation channels via internal conversion through the triplet manifold occur. The nuclear motion that drives the dynamics through the different electronic states corresponds mainly to the increase of all metal–ligand bond distances as well as the decrease of the angles of trans-coordinated ligand atoms. Both motions lead to a decrease in the ligand-field splitting, which stabilizes the interconfigurational excited states populated during the dynamics. Analysis of the electronic character of the states reveals that increasing and stabilizing the singlet population, which in turn can result in enhanced phosphorescence, could be accomplished by further increasing the ligand-field strength.
The ultrafast triplet-to-singlet mechanism, responsible for the photoluminescence of the open-shell VIIICl3(ddpd) complex – based on Earth-abundant vanadium – is unraveled using non-adiabatic dynamics in full dimensionality.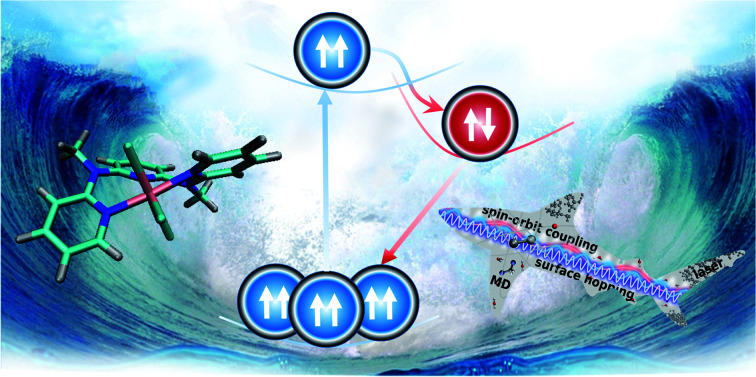
1. Introduction
The development of photoactive coordination compounds largely focuses on 4d or 5d metals because they often feature long-lived excited states that can be exploited in multiple applications. Such long-lived states are due to the large ligand-field splitting that increases the energy of metal-centered (MC) states, which are then inaccessible for relaxation.1 In contrast, complexes based on 3d metals have weaker ligand-field splitting and typically show rapid non-radiative relaxation through MC states.2 For practical applications, however, 4d/5d metals face the severe disadvantage that their rare natural occurrence makes them costly.3 Thus, significant effort is currently directed to the development of photoactive Earth-abundant 3d transition metal compounds, as low-cost alternatives, e.g. of photosensitizers.4–6
So far, 3d-metal complexes of chromium(0),7 iron(iii),8,9 cobalt(iii),10 and copper(i)11 exhibit luminescence in the visible region of the light spectrum. At longer wavelengths, luminescence has been observed for homoleptic chromium(iii) complexes using the ddpd,12,13 H2tpda14 and dqp15 ligands (ddpd = N,N′-dimethyl-N,N′-dipyridine-2-ylpyridine-2,6-diamine; H2tpda = 2,6-bis(2-pyridylamino)pyridine; dqp = 2,6-di(quinolin-8-yl)pyridine), which emit at the beginning of in the near-infrared region of the light spectrum (NIR) at 775, 782, and 747 nm, respectively. Using the ddpd ligand and vanadium(iii) in place of chromium(iii), the emission wavelength can be shifted to considerably longer wavelengths. Indeed, for the homoleptic [VIII(ddpd)2]3+ complex, luminescence was found in the NIR-II range around 1100 nm,16 paving the way for promising applications in different fields, from photovoltaics to bio-imaging.17,18
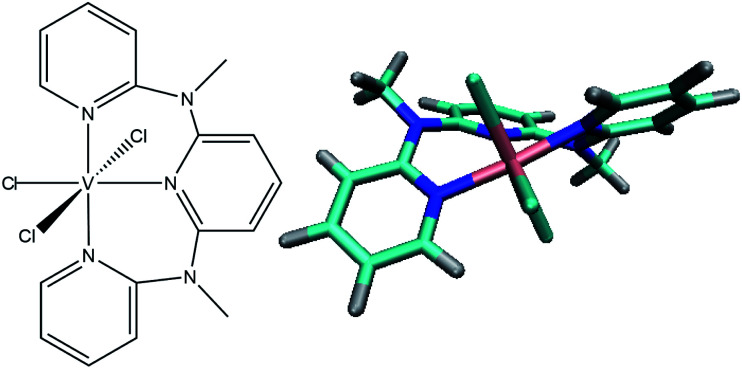
Here we present the heteroleptic chlorido-derivative VIIICl3(ddpd)19 (see Fig. 1), another exciting candidate for photoluminescence in the NIR-II range, which is able to emit at wavelengths of 1111 and 1219 nm at room temperature. While in paper I (see ref. 20) the experimental spectroscopic and electrochemical characterization of VIIICl3(ddpd) aided by static CASSCF-NEVPT2 calculations is presented, this work focuses on the electronic excited states and their time-dependent non-adiabatic evolution.
Fig. 1. Structure of VIIICl3(ddpd) investigated in this work.
A mechanistic understanding of photoluminescence can help identifying the competing non-adiabatic relaxation pathways in a molecule. This can enable a better modulation of quantum yields, which ultimately leads to design principles for improving luminescence in complexes based on Earth-abundant transition metals. In this respect, non-adiabatic molecular dynamics simulations are indispensable because spectroscopic experiments cannot access details on the motion of the atoms of the system. However, simulations of coupled electronic and nuclear degrees of freedom in transition metal complexes are extremely demanding for several reasons. One is the size of the molecules, which prevents dynamical studies in full dimensionality including all nuclear degrees of freedom.21–23 Another is the large number of closely lying (near-degenerate) electronic states that can participate in the photodynamics and need to be taken into account. In order to overcome these challenges, we recently combined the non-adiabatic trajectory surface hopping method SHARC24,25 with a linear vibronic coupling (LVC) approach26 to compute the electronic potentials.27 In this way, the photodynamics of a number of transition metal complexes have been investigated,16,28–30 where time-dependent density functional theory (TDDFT) was used to parametrize the LVC potentials. Given its positive trade-off between accuracy and computational cost, TDDFT is likely the most popular method to study transition metal complexes,31,32 and it has also been applied in on-the-fly surface hopping studies of other transition-metal complexes.33–37 However, TDDFT can become problematic for open-shell systems with degenerate ground states due to its single-reference nature. This is the case for pseudo-octahedral vanadium(iii) complexes, such as VIIICl3(ddpd), which possesses a d2 ground-state electron configuration.
Here we present full-dimensional non-adiabatic photodynamics simulations of VIIICl3(ddpd) using trajectory surface hopping molecular dynamics in solution based on complete-active space self-consistent field (CASSCF)-derived LVC potentials. We show that CASSCF is able to describe all low-lying MC states expected from ligand-field theory. The calculation of the entire set of MC states is only possible with a multi-configurational method, as demonstrated by a transition-density matrix analysis. This analysis also reveals the presence of an important higher-order excitation character in low-lying excited states with ligand contributions, which are missing in methods relying on single excitations such as TDDFT. This work emphasizes the need for going beyond single-reference methods to obtain even a qualitatively correct electronic structure in VIIICl3(ddpd). The demanding CASSCF-based nonadiabatic dynamics simulations uncover the population pathways from the triplet to the singlet excited MC states via intersystem crossing (ISC), providing new insight into the luminescent states of VIIICl3(ddpd) and strategies to enhance the luminescence properties of related 3d metal complexes.
2. Methods
2.1. Trajectory surface hopping simulations
The nonadiabatic dynamics of VIIICl3(ddpd) including all 123 normal modes were simulated using an LVC model within the SHARC surface hopping approach.27,38 Trajectories were set up using 2000 initial coordinates and momenta from a Wigner distribution of the ground-state PES.39,40 The initial excited states were selected stochastically within an energy range of 0.5 eV around the maximum of the second absorption band (3.0–3.5 eV) based on their oscillator strength.41 Accordingly, 2000 trajectories were started in the T6 (664), T7 (891), T8 (346), T9 (55), T10 (24), T11 (19), and T12 (1). The trajectories were then propagated for 10 ps using a nuclear time step of 0.5 fs and an electronic time step of 0.02 fs within the local diabatization method.42 In total, this amounts to 20 ns of non-adiabatic dynamics carried out with the PySHARC driver,27 which allows for efficient in-memory communication between a Python interface and the routines of SHARC. An energy-based decoherence correction with a constant of C = 0.1 a.u. was used.43 During the surface hops, the kinetic energy was adjusted by re-scaling the velocity vectors. Surface hopping probabilities were approximated using the wave function overlaps described in ref. 44.
2.2. Linear vibronic coupling model
In an LVC model, the potential energy surfaces (PESs) are approximated in terms of the ground-state PES V0 and the first-order (linear) vibronic coupling term W on the basis of the mass-frequency scaled normal mode coordinate Q
| V(Q) = V0(Q)1 + W(Q) | 1 |
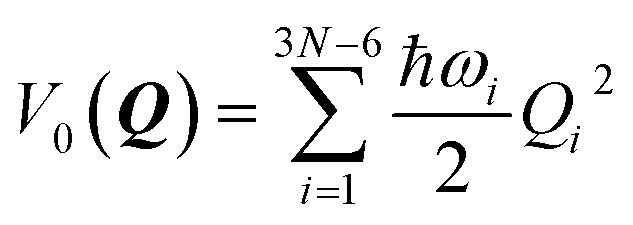
The ground-state PESs are approximated as harmonic oscillators with frequencies ωi, i.e.,
 |
2 |
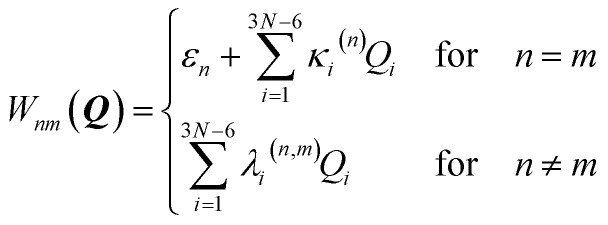
The coupling term reads
 |
3 |
where εn are the vertical excitation energies at the Franck–Condon (FC) geometry, while κi(n) and λi(n,m) are the intrastate and interstate coupling elements for the normal mode coordinate Qi. The coupling elements were obtained numerically from CASSCF calculations (see below) on geometries displaced by ±0.05 units from the ground-state equilibrium geometry for each normal mode. The intrastate coupling κi(n) values were obtained as numerical gradients and the interstate couplings λi(n,m) were obtained from the change in the wavefunction overlaps. The spin–orbit couplings (SOCs) in the LVC model potential were approximated by constant SOCs obtained at the ground-state equilibrium geometry.
The absorption spectrum and the density-of-states were calculated from a Wigner distribution of 20 000 geometries using the LVC model potential.
2.3. Electronic structure calculations
The triplet ground state of VIIICl3(ddpd) in acetonitrile (MeCN) was optimized using unrestricted B3LYP,45,46 the def2-TZVP basis set,47 and the D3 dispersion correction using Becke–Johnson damping (D3BJ)48 as implemented in the ORCA4.1 program package.49 A numerical frequency calculation at the same level of theory confirms that no imaginary frequencies are obtained. Solvent effects were modeled using the conductor polarizable continuum model (C-PCM). For the self-consistent-field (SCF) calculations, the resolution-of-identity approximation (RIJCOSX), tight SCF convergence criteria (TightSCF), and the Grid4 integration grid were used. For the geometry optimization, tight convergence criteria (TightOpt) were used. Scalar relativistic effects are taken into account with the zeroth-order regular approximation50 (ZORA). Cartesian coordinates are given in Table S1 in the ESI.†
The electronic excited states of VIIICl3(ddpd) in MeCN were calculated with CASSCF51 and the ANO-RCC-VDZP basis set52,53 using the v18.0.o180122-0800 version of the OpenMolcas program package.54 Thereby, 16 triplet and 15 singlet states were calculated at the state-averaged CASSCF level of theory with equal weights. An active space comprising 10 electrons in 13 orbitals was used (10,13). These orbitals correspond mainly to the five metal d orbitals, four ligand π orbitals, and four ligand π* orbitals; they are shown in Fig. S1 in the ESI.† A closer analysis also shows contributions from the p orbitals of the chlorido ligands in the active orbitals, which result in a small participation of the chlorido ligands in the charge flow during the excitation. Solvent effects of MeCN were described using the C-PCM model. SOCs between all states were calculated using the atomic mean field (AMFI) approximation55 in the restricted active space state interaction (RASSI) program in OpenMolcas.
In addition, to assess the performance of the CASSCF results, the energies of the 16 triplet and 15 singlet states were also calculated with the multi-state complete active space second-perturbation theory (MS-CASPT2)56 using an imaginary level shift of 0.1 a.u. (ref. 57) and IPEA shift values58,59 of 0.0 a.u. and 0.25 a.u. The corresponding results are discussed in Section S3 in the ESI.†
2.4. Quantitative wavefunction analysis
Electronically excited states are often described in terms of the canonical orbitals that characterize the most important configurations in the excited-state wave functions.60 In the presence of many configurations, this description becomes tedious and often misleading. A more comprehensible and quantitative analysis of the wavefunctions can be obtained by analyzing the one-particle transition-density matrix.61 For electronic structure methods including only single excitations, the one-particle transition-density matrix contains the full information of the excited-state wave functions. For electronic structure methods including higher excitation levels, such as CASSCF, this description is only approximate. A singular-value decomposition of the transition-density matrix provides a set of hole and electron natural transition orbitals that give a compact representation of the excited-state wave function – particularly in cases where a single pair of hole and electron natural-transition orbitals represents ∼99% of the character of the excitation. This orbital representation is convenient when analyzing the electronic structure at a single geometry. For multiple geometries, it is not possible to compute meaningful averaged orbitals in a straightforward manner. In these cases, it is possible to partition the molecule into several fragments and compute the contributions of the hole and electron parts of the fragments to the full transition density matrix. The fragments can comprise several atoms, e.g., a ligand, or correspond to individual atoms; importantly, their representation is invariant to the displacement of the nuclei. This procedure provides an easily understandable illustration of the charge flow that occurs during the dynamics in the different electronic states. The analysis of the transition-density matrix has been performed using the TheoDORE routine62 integrated in the WFA module in OpenMolcas.54
3. Results and discussion
3.1. Electronic structure calculations
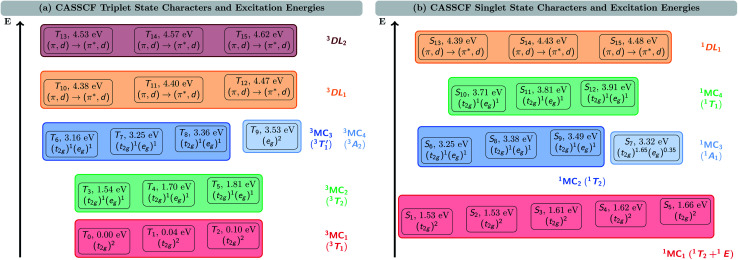
Fig. 2 shows the triplet (a) and singlet (b) electronic states of VIIICl3(ddpd) calculated at the CASSCF(10,13) level of theory. As the vanadium metal center possesses a d2 ground-state electron configuration, the ground state of VIIICl3(ddpd) is a triplet state, T0. Only slightly above T0, we find two further triplet states, T1 at 0.04 eV (332 cm−1) and T2 0.10 eV (799 cm−1). Since in VIIICl3(ddpd) the vanadium center has an almost octahedral coordination sphere, the three states T0–T2 correspond to the three components of the 3T1 term – the ground state term predicted by ligand-field theory (see the Tanabe–Sugano diagram in Fig. S2 in the ESI†). The CASSCF(10,13) natural orbital occupation numbers (Table S4 in the ESI†) show that in all three states the d electrons occupy two of the dxy, dyz, and dxz orbitals, and so they can be assigned the (t2g)2 configuration. To avoid confusion between the Tn nomenclature of triplet states ordered by energy and the 3Tn term symbol, here we also label these three states as 3MC1 states. Thereby, MC refers to the metal-centered character of these states, and we implicitly retain the threefold spatial degeneracy of the 3T1 term.
Fig. 2. Characters and energies of the (a) triplet and (b) singlet states calculated with CASSCF(10,13). Note that the energy axis is not on scale. 3,1DL denotes d-assisted ligand excited states, while other state labels follow ligand-field terms of octahedral complexes.
The higher-lying triplet states are described likewise. Between 1.54 and 1.81 eV (12 460–14 577 cm−1), we find the three components of the 3T2 term of the (t2g)1(eg)1 configuration, that will be referred to as (threefold nearly-degenerate) 3MC2 states. At energies of 3.16–3.53 eV (25 505–28 507 cm−1), there are four nearly degenerate states. Three of these states (T6–T8) also possess the (t2g)1(eg)1 configuration: these states can be assigned to the 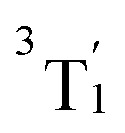 term (threefold nearly-degenerate 3MC3 states). The fourth state, T9, possesses a (eg)2 configuration; it is assigned to the 3A2 term (non-degenerate 3MC4 state). Finally, we find two sets of three states each, T10–T12 between 4.38 and 4.47 eV (35 303–36 046 cm−1)) and T13–T15 between 4.53 and 4.62 eV (36 546–37 285 cm−1), respectively. Based on the natural orbital occupation numbers (Table S4 in the ESI†), these states correspond to the transition of an electron from a ddpd π orbital to a ddpd π* orbital. However, these states are actually a linear combination of equal parts of π → π* single excitations and (π, d) → (π*, d) double excitations, as becomes apparent when analyzing the one-particle transition density (see discussion below). Thus, we label these sets of states as the d-assisted ligand-centered states 3DL1 and 3DL2, respectively.
The S1–S15 singlet states are shown in Fig. 2(b). As can be seen, there is a group of five states (S1–S5) at energies between 1.53 and 1.66 eV (12 329–13 362 cm−1). These states all share a (t2g)2 electron configuration. They correspond to the three components of the 1T2 term and the two components of the 1E term, which are predicted as the lowest-energy singlet states in the Tanabe–Sugano diagram (Fig. S2 in the ESI†), where they are almost degenerate. In this case, it is harder to distinguish which of the states S1–S5 corresponds to each of the two terms due to the small energy gap (0.13 eV, 1033 cm−1) as well as their shared electron configuration. Therefore, and for the sake of simplicity, we denote these five states only as 1MC1 states.
At higher energy, a group of four states appears between 3.25 and 3.49 eV (26 221–28 167 cm−1). Three of them (S6, S8, and S9) share the (t2g)1(eg)1 electron configuration. The remaining S7 state is described by a (t2g)1.65(eg)0.35 configuration. For this state, the non-integer occupation numbers of the natural orbitals originate from the multi-configurational nature of the CASSCF wave function. We note that the natural orbital occupation numbers for all other electronic states lie much closer to 0, 1, or 2, i.e., usually differing by less than 0.1 from these integer values. Following their different electronic configurations, we ascribe the S6, S8, and S9 states to the 1T2 term (threefold nearly-degenerate 1MC2 states), while S7 is assigned to the 1A1 term (non-degenerate 1MC3 state).
Between 3.71 and 3.91 eV (29 913–31 509 cm−1), we find a further group of three singlet states that share the (t2g)1(eg)1 configuration, which we assign to the 1T1 term (threefold nearly-degenerate 1MC4 states). Finally, we reach a group of three singlet states between 4.39 and 4.48 eV (35 429–36 149 cm−1) with similar features as the 3DL1,2 triplet states. Based on the natural orbital occupation numbers, these states correspond to the π → π* excitation; however, a closer analysis reveals additional (π, d) → (π*, d) double excitation character, which will be discussed in more detail below.
The analysis of the CASSCF natural orbitals provides a detailed, yet only qualitative description of the electronic states of VIIICl3(ddpd). One strategy to obtain a quantitative description is to analyze the transition density matrix (TDM) γIJ, which describes the change in electron density associated with a transition from the initial state ΨI—here the ground state Ψ0—to the final state ΨJ. This can be easily done for electronic structure methods including only single excitations, such as TDDFT, as in this case one needs to compute only the one-particle TDM γIJ(1). For methods like CASSCF that include higher-order excitations, one should also analyze higher-order TDMs γIJ(n). Unfortunately, there is no computer program available yet that offers this possibility. Thus, here we are content with scrutinizing the one-particle TDM γIJ(1) of the CASSCF electronic states to infer the limitations of the single-excitation character in the different electronic states. For simplicity, henceforth, we drop the superscript and refer to the one-particle TDM just by γIJ.
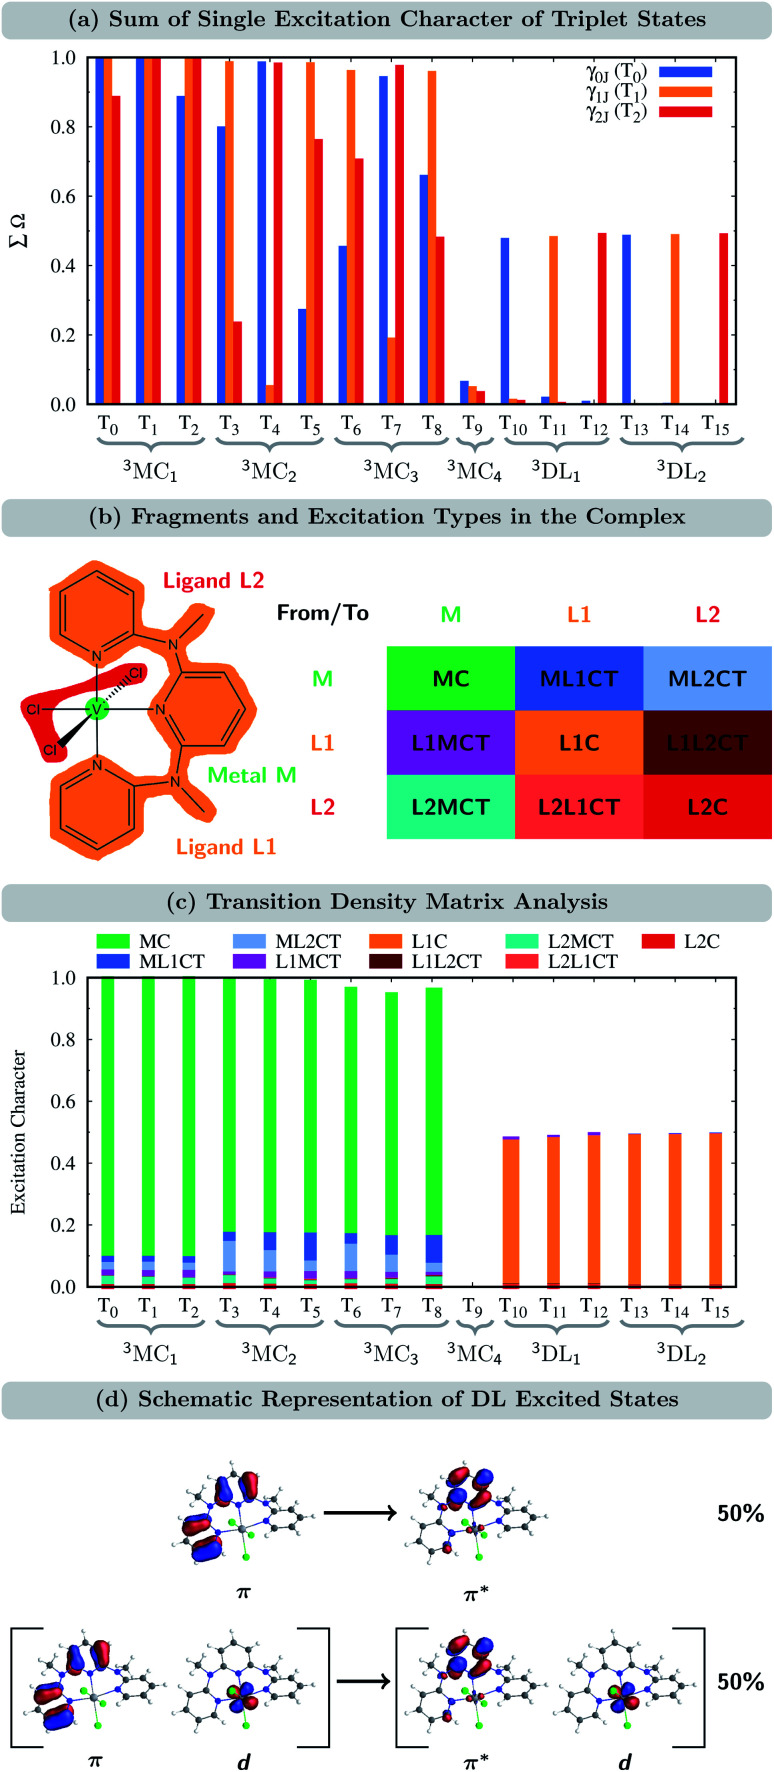
In order to verify to which extent the analysis of the one-particle TDM is appropriate for the CASSCF electronic states, we first determined the sum of the single excitations ∑Ω of the CASSCF wave functions with respect to the ground state of VIIICl3(ddpd), i.e., the T0 state, which is the lowest-energy component of the nearly-degenerate 3MC1 states. This quantity, ∑Ω for γ0J, for all the triplets is shown in Fig. 3(a) in blue. Remarkably, only for the states T1, T4, and T7, the sum of single excitations ∑Ω is close to 1. For two additional states (T2 and T3), ∑Ω still lies between 80 and 90%; however, for the remaining triplet states, ∑Ω is significantly smaller than one. Clearly, only a small subset of states can be accurately described as single excitations from the T0 reference state.
Fig. 3. (a) Sum of single excitation character ∑Ω for the triplet states calculated from the transition density matrices γ0J, γ1J, and γ2J of the T0, T1, and T2 states, respectively. Note that ∑Ω is set to 1 for γII to indicate that a state can be described quantitatively using itself as a reference when taking into account only single excitations. (b) Fragment partition and classification of excited-state characters in VIIICl3(ddpd). (c) Transition density matrix analysis of the triplet states. Analysis used the transition-density matrix with the largest ∑Ω out of γ0J, γ1J, and γ2J. (d) Characterization of DL excited states.
We recall that based on the natural orbital occupation numbers, the ground state of VIIICl3(ddpd) adopts the (t2g)2 configuration, while a number of excited states (3MC2,3) possess the (t2g)1(eg)1 configuration. At first glance, the latter states seem to be the result of promoting a single electron from a t2g orbital to an eg orbital. However, as revealed by the one-particle TDM analysis, their wave functions must also include higher-order excitations, leading to ∑Ω values significantly smaller than one. Yet, it is possible to describe the (t2g)1(eg)1 excited states mainly by single excitations if a different reference state other than the T0 state is chosen. In particular, this can be achieved by selecting the T1 and T2 states, which are the complementary components of the triply nearly-degenerate 3MC1 term. This is shown by the orange and red bars in Fig. 3(a) that denote the TDM γ1J and γ2J, which use the T1 and T2 states as a reference, respectively. Taking together all three one-particle TDMs γIJ (I = 0, 1, and 2), we now see that each of the states T0–T8 can be described by single excitations with ∑Ω ≈ 1 for at least one of the reference states (at least one of the three bars is close to 1). Thus, each of the states T0–T8 is reasonably described by the one-particle TDM, if the appropriate reference state is selected. For the T9 state, we see in Fig. 3(a) that ∑Ω for all three γIJ is close to zero. This is because the T9 state (3MC4) corresponds to the (eg)2 configuration, which naturally cannot be described by single excitations from (t2g)2.
For the states T10–T15 (3DL1,2), ∑Ω amounts only to ca. 0.5 when using the appropriate reference state. Based on the natural orbital occupation numbers, these states feature the (t2g)2 configuration at the vanadium center and the π → π* excitation at the ddpd ligand. However, these states do not correspond to the simple π → π* excitation as, otherwise, ∑Ω would amount to 1 for one of the TDMs. In order to clarify the character of the states T10–T15, we use charge transfer numbers63 and partition VIIICl3(ddpd) into three fragments (Fig. 3(b)): the metal center M, the ddpd ligand (ligand L1), and the three chlorido ligands (ligand L2). The CASSCF configurations can then be assigned to one of the nine different types of excitations sketched in Fig. 3(b): local excitations – either centered at the metal atom (MC) or at one of the two ligands (L1C, L2C) – metal-to-ligand charge transfer excitations (ML1CT, ML2CT), ligand-to-metal charge-transfer excitations (L1MCT, L2MCT), and ligand-to-ligand excitations (L1L2CT, L2L1CT). Fig. 3(c) collects the resulting charge-transfer numbers for each electronic state, see also Tables S6–S8 in the ESI.† As can be seen, the majority of the single excitation character of the T10–T15 states corresponds to L1C excitations, i.e., excitations centered at the ddpd ligand. Combining this observation with the natural orbital occupation numbers leads to the conclusion that these states correspond to linear combinations of 50% π → π* single excitations and 50% (π, d) → (π*, d) double excitations, see Fig. 3(d). Accordingly, we label these states d-assisted ligand-centered (DL) states.
From the remaining states in Fig. 3(c) (the T9 state is excluded as it corresponds to a double excitation), one can see that the states T0–T8 are MC excitations, with small admixtures of ML1CT and ML2CT characters. In passing, we note that the admixtures of chloride orbitals with the vanadium d orbitals can only be observed in the orbitals using an iso value lower than 0.05 (cf. Fig. S1(a and b) in the ESI†). This further highlights the benefits of using the quantitative TDM analysis compared to the qualitative orbital-based description.
In the accompanying paper I,20 the higher-energy part of the absorption spectrum of VIIICl3(ddpd) has been calculated using LR-TDDFT. The TDDFT calculations predicted excited states with L1MCT and L1C characters following the manifold of MC states. Based on the double excitation character found for the 3DL states, the excitation energies of the L1C states are likely to be overestimated by LR-TDDFT – as LR-TDDFT includes only single excitations – while standard hybrid functionals such as the employed B3LYP functional also tend to underestimate the energies of CT states. It is also interesting to discuss whether other DFT-based methods such as spin-flip TDDFT64 (SF-DFT) or a ΔSCF approach65 should, in principle, be able to provide a better description of the electronic states of VIIICl3(ddpd) than “standard” LR-TDDFT. While SF-DFT can be used to describe multi-configurational ground states of open-shell systems64 by applying a LR-TDDFT approach from a spin-flipped reference state, this is only reasonable if the reference state itself can be described as a single configuration. As shown in Fig. 2, this is problematic due to the near-degeneracy of the excited states, both among the triplet and the singlet manifold. Even if it was possible to choose one of the two excited states with rather unique electronic configurations, i.e., the S7 state or the T9 state, the subsequent success in SF-DFT calculations would be questionable. Due to the (eg)2 configuration of the T9 state, SF-DFT in a linear-response framework would not be capable of describing any of the ground-state components T0, T1, and T2. Furthermore, the (t2g)1.65(eg)0.35 configuration of the S7 state highlights its multi-reference character, making it inaccessible to single-reference methods. In ΔSCF methods, it is possible to compute single components of spatially degenerate excited states of different symmetry.65 However, as soon as this degeneracy is lifted, e.g., by moving away from a highly-symmetric reference geometry, these states become inaccessible as well. Thus, we conclude that the correct description of the electronic states of VIIICl3(ddpd) requires multi-configurational methods including higher-order excitations.
3.2. Excited-state dynamics simulations
The time evolution of the diabatic electronic states, i.e., states that are characterized by the same electronic configuration, is shown in Fig. 4(a). Since in the LVC model no intruder states can enter the dynamics simulation at any geometry, all electronic states can be described on the basis of the diabatic states of the equilibrium geometry at all simulation times. For the following analysis, we combine the population of the different components of the nearly degenerate 3MC1, 3MC2, and 3MC3 states into one population each. In addition, the populations of all singlet states were combined into one (1MC); individual diabatic singlet state populations can be found in Fig. S5 in the ESI.† For completeness, we also show the time evolution of the adiabatic states in Fig. S4 in the ESI.†
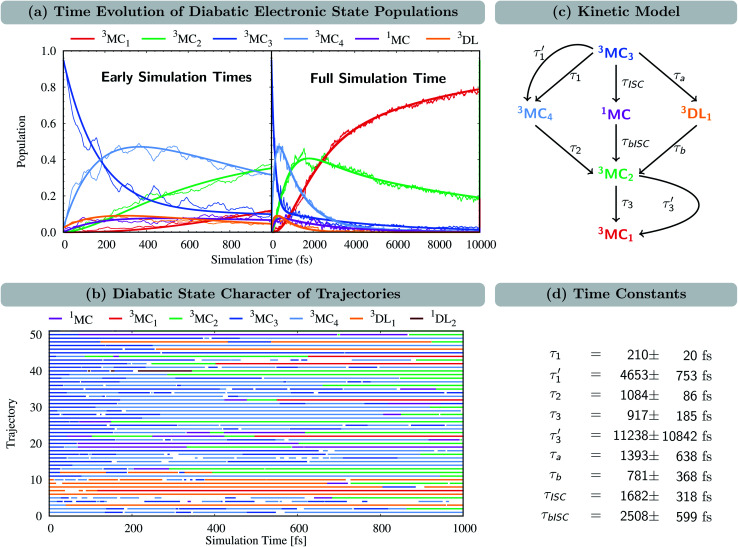
Fig. 4. (a) Time-evolution of the diabatic electronic state populations. Thin lines represent state populations and thick lines represent fitted curves. (b) Time-resolved diabatic state character of 50 sample trajectories. Colors indicate the dominant character, summing up to at least 60% of the total population for each trajectory (this threshold allowed an average assignment of 95%, i.e. 19 000 of the 20 000 time steps for each trajectory; see Fig. S7† for a more strict threshold of 70%, which accounts for 87% of the simulation time). Blank spots indicate that no dominant state could be assigned at a particular time step. (c) Kinetic model used to fit the time evolution of the populations. (d) Fitted time constants including error estimates obtained using the bootstrap method with 100 copies.66.
At t = 0 fs, the 3MC3 state is populated by 95%, while the remaining population is in the 3MC4 and 3DL1 states (2.5% each). Within the first 1 ps, the population of the 3MC3 state decreases to ca. 35%. Concomitantly, the population in the 3MC4 state increases up to ca. 45% until 300 fs and then decreases again. The population of 3MC2 also increases – albeit at a slower rate – reaching ca. 40% after 1 ps. Additionally, the 3MC1 and 3DL1 states are also populated in small amounts. Most importantly, the population is also transferred to the singlet states (1MC), reaching ca. 10% after 100 fs and remaining constant until 1 ps. At later times, all states depopulate strongly except 3MC1, illustrating how important it is to simulate dynamics beyond 1 ps. After 10 ps, the population of 3MC1 has reached ca. 80%, and the remaining ca. 20% is mainly in the 3MC2 state. The population of the singlet 1MC states decreases from its peak of 10% to values of 1–2% after 4 ps. Noticeably, the singlet population is almost entirely in the lowest singlet state 1MC1, as shown in Fig. S5 in the ESI.†
The time-evolution of the diabatic populations of 50 random trajectories is shown in Fig. 4(b) up to 1 ps (see also Fig. S6 in the ESI† for 10 ps). This allows us to easily follow the individual pathways of the trajectories through the different electronic states and propose a kinetic model to explain their time evolution. We see that trajectories in the 3MC3 state (dark blue) tend to change to either the 3MC4 state (light blue), the 3DL1 state (orange), or the singlet 1MC state (purple). From either of these states, trajectories then usually transfer to the 3MC2 state (green), from where they undergo internal conversion (IC) to the 3MC1 ground state (red). The 3DL2 states (brown) are rarely visited and thus henceforth disregarded. Based on these observations, we propose the following simplified kinetic model,
 |
4 |
 |
5 |
 |
6 |
for which, fits for the populations are shown in Fig. S8 in the ESI.† As some of the fitted curves did not follow closely the state populations, we described the 3MC3 → 3MC4 and 3MC2 → 3MC1 reactions by a biexponential function, adding
 |
7 |
 |
8 |
which improves the fit considerably: now all fit curves (thick lines in Fig. 4(a)) closely follow the population curves (thin lines). The complete kinetic model is shown in Fig. 4(c) and the fitted time constants are listed in Fig. 4(d).
Accordingly, IC via3MC3 → 3MC4 occurs with a fast time constant of τ1 = 210 ± 20 fs and a slow time constant of  . Competing with that is both, ISC to the 1MC singlet states with a single time constant of τISC = 1682 ± 318 fs and IC via the 3DL1 states with a time constant of τa = 1393 ± 638 fs. The time constant of ISC is thereby similar to the time constant τ = 1.5 ps that describes the rise of a long-lived signal in the transient absorption experiments in the accompanying paper I,20i.e., which describes the population of the singlet states via ISC. Based on the time constants fitted in the simulations, we can calculate the yields of the three deactivation pathways that start from the 3MC3 state. In total, 79.2% of the excited-state population decays via3MC3 → 3MC4, 11.4% of the excited population decays via3MC3 → 3DL1, and 9.4% of the excited state population undergoes ISC to the 1MC states.
From these results, it follows how one can increase ISC to the 1MC states and stabilize the population in the singlet manifold, thus enhancing phosphorescence in compounds related to VIIICl3(ddpd). As discussed above, the main competing reaction to 3MC3 → 1MC ISC, that populates the singlet states, is IC via3MC3 → 3MC4. The 3MC3 and 3MC4 states are characterized by (t2g)1(eg)1 and (eg)2 configurations, respectively, while the majority of the singlet population is in the 1MC1 states described by the (t2g)2 configuration. The t2g orbitals are non-bonding in ligand-field theory while the eg orbitals possess an antibonding character. If the ligand-field strength was increased, it would lead to a destabilization of the eg orbitals, which, in turn, would increase the energy of all electronic states where the eg orbital is occupied. Thus, increasing the ligand-field strength would increase the energy of the 3MC3 and 3MC4 states while leaving the 1MC1 states unaffected. Furthermore, the increase would be more pronounced for the 3MC4 state than for the 3MC3 state, since in the 3MC4 state, the eg orbitals are occupied twice. This could lead to a situation where 3MC4 is inaccessible during the dynamics, thus quenching the main competing pathway to ISC. Additionally, increasing the ligand-field strength can also stabilize the population in the singlet manifold, since the depopulation of the singlet states occurs via1MC → 3MC2. 3MC2 is characterized by the (t2g)1(eg)1 configuration. Thus, it will be shifted to higher energies compared to 1MC1 and may become inaccessible for depopulation of the singlet states as well.
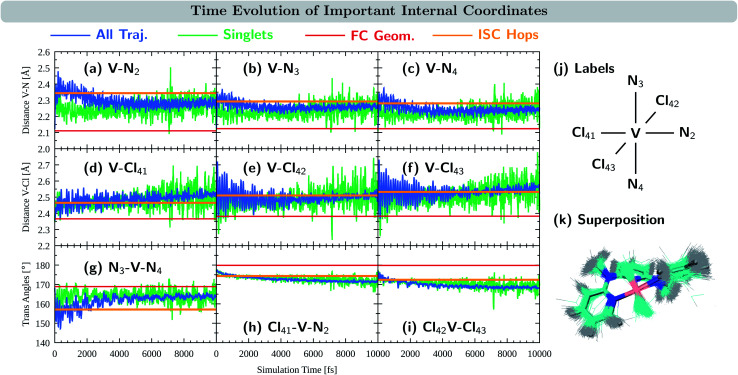
We now turn to discuss the internal coordinates that show most distinct changes during the course of the simulations. These coordinates were identified by analysing the average motion of all trajectories on the basis of the normal modes of the reference equilibrium geometry,67,68 see also Section S4.6 in the ESI.† The identified coordinates include the distances V–N and V–Cl between the central vanadium atom and the ligating N and Cl atoms, as well as the angles X–V–Y between the trans-coordinated ligand atoms (X, Y = N, Cl). The average values of these internal coordinates from the 2000 trajectories are shown in Fig. 5(a–i) in blue. For comparison, the respective value at the equilibrium geometry is shown as a red line. Atom numbering is shown in Fig. 5(j). Note that the initial average values at t = 0 fs do resemble their reference values at the equilibrium geometry, as demonstrated by 0–200 fs zoom in Fig. S12 in the ESI.†
Fig. 5. Time-evolution of important internal coordinates: (a–c) V–N distances, (d–f) V–Cl distances and (g–i) trans angles. Average values of the 10 000 trajectories in blue, the average of trajectories in singlet states in green, the value at the equilibrium geometry in red, and the average value at the ISC hopping geometries in orange. (j) Atom numbering. (k) Superposition of structures at the ISC hopping geometries.
As seen in Fig. 5(a–c), the distances between the vanadium atom and the ligating N atoms in the ddpd moiety increase rapidly at the beginning of the dynamics from ca. 2.11–2.12 Å to 2.3–2.4 Å. The effect is most pronounced for the V–N2 distance – the vanadium and the nitrogen atom trans to a chlorido ligand – which reaches values close to 2.5 Å. At later times, all V–N distances decrease again, however, ending up at 2.31 Å (V–N2) and 2.25–2.27 Å (V–N3,4), i.e., distances that are still considerably larger than in the equilibrium geometry. The evolution of the V–Cl distances, Fig. 5(d–f), also shows a rapid initial increase from values of 2.36–2.38 Å to the range of 2.4–2.6 Å. Thereby, the increase is smaller for the chlorido ligand that is coordinated trans to a ligating nitrogen atom (V–Cl41) than for the other two chlorido ligands. However, in contrast to the V–N distances, the V–Cl distances increase in average with longer simulation times, reaching 2.49–2.52 Å after 10 ps. The X–V–Y angles between the trans-coordinating atoms in VIIICl3(ddpd) are shown in Fig. 5(g–i). The N3–V–N4 angle decreases in the beginning of the dynamics from 169° to 150–160°, while at longer simulation times it increases again to values above 160° – however, still below the ground-state reference value. For the Cl41–V–N2 and Cl42–V–Cl43 angles, the initial decrease with respect to the starting geometries is smaller. However, both angles continue to decrease slightly at later simulation times and reach values of 168 and 171° after 10 ps, i.e., also smaller than their reference values at the ground-state minimum-energy geometry which are close to 180°.
The observations of the increase of all metal–ligand bond distances and the decrease of the trans angles can be nicely rationalized by the nature of the electronic states accessed during the dynamics. Compared to the 3MC1 ground state, that possesses the (t2g)2 configuration, the excited states 3MC2, 3MC3, and 3MC4 (which account for the majority of the population during the excited-state dynamics) are described by (t2g)1(eg)1 and (eg)2 configurations. These configurations feature electrons in the antibonding eg orbitals, which are stabilized at increased metal–ligand bond distances. At the same time, the energy of these excited states decreases when the system moves further away from the ideal octahedral coordination geometry, as the reduced overlap between the metal and ligand orbitals results in a smaller ligand-field strength that decreases the energy of these excited states. Accordingly, the system moves to longer metal–ligand bond distances and smaller trans angles during the dynamics.
Fig. 5(a–i) also display the average value of the respective internal coordinates at the ISC hopping geometries as an orange line. Such geometries include both, hops from triplet to singlet states as well as hops back from singlet to triplet states. A superposition of the ISC hopping geometries is shown in Fig. 5(k). As can be seen in Fig. 5(a–c), the average V–N distances at the ISC hopping geometries are 2.34 Å for V–N2 and 2.28–2.29 Å for V–N3 and V–N4. These values are only reached by the ensemble of trajectories (blue curve) in the first few ps after the initial V–N bond stretching. Thus, during this time window, both ISC from the triplet to the singlet states as well as back-ISC from the singlet to the triplet states is possible. At longer simulation times, both types of ISC are quenched, which leads to the singlet population being stable after ca. 4 ps. The same behavior is observed for the N3–V–N4 angle in Fig. 5(g): ISC hops occur at an average angle of 157° – a value which is only realized in the ensemble of trajectories during the first few ps. At later simulation times, the N3–V–N4 angle increases, moving the system away from the ISC hopping zone and stabilizing the remaining singlet population. For the other trans angles shown in Fig. 5(h and i), the ensemble average stays close to the average of the ISC hopping geometries for longer simulation times, before finally moving away by ca. 4°. The V–Cl distances of the ensemble stay most of the time close to the ISC hopping averages. Only the V–Cl41 ensemble distance increases towards the end of the simulation time to ca. 2.50 Å compared to the ISC hopping average of 2.46 Å.
Finally, it is also useful to analyze the evolution of the coordinates associated with the singlet states only, green curves in Fig. 5(a–i). Note that because the majority of the population is in the triplet states at all simulation times, the averages of the exclusive triplet trajectories (not shown) closely resemble the evolution of the full ensemble. Compared to the full ensemble of trajectories (blue curve), the main difference of the V–N distances and the N3–V–N4 angle in the singlet trajectories is noticeable during the first few ps: the V–N bonds are smaller and the N3–V–N4 angle is larger than in the triplet trajectories. This is due to the fact that the majority of the singlet population is in the 1MC1 states, which are characterized by the (t2g)2 configuration with no electrons in the eg orbitals. Thus, in the singlet states, the V–N distances do not tend to increase much, while keeping the N3–V–N4 angle closer to the octahedral angle of 180°. At later times, the full ensemble curve – corresponding to ca. 98% of triplet trajectories – resembles the average of the singlet curves, as now more and more electronic population reaches the 3MC1 triplet ground state that also possesses the (t2g)2 configuration.
4. Conclusion
Here we investigated the electronic excited states of the phosphorescent complex VIIICl3(ddpd) and its photodynamics using trajectory surface hopping and CASSCF potentials in 123 degrees of freedom. By analyzing the electronic wave functions and transition-density matrices, we evidence the complicated electronic structure of the MC excited states as well as the presence of excitations involving the organic ddpd ligand that requires multi-configurational methods including higher-order excitations.
Our dynamical study reveals that after excitation from the triplet ground state possessing a (t2g)2 configuration to a higher-lying MC state of (t2g)1(eg)1 character, the system evolves through different decay pathways. The main deactivation pathway involves IC to a different MC state with the (eg)2 configuration. Minor pathways include ISC to the singlet MC manifold and an additional IC pathway through triplet states involving excitations to the ddpd ligand. The time constant τISC = 1.7 ± 0.3 ps obtained for the ISC in the present simulation is in good agreement with that of τ = 1.5 ps obtained for the rise of a long-lived signal from transient absorption experiments in the accompanying paper I.20 All three mechanisms end in a further triplet MC state with the (t2g)1(eg)1 configuration, which eventually relaxes back to the triplet ground state.
The dynamics is driven by elongation of all metal–ligand bond distances and a decrease of the angle between all pairs of trans-coordinated ligands further away from the octahedral 180° ideal. Both features result in a decrease of the ligand-field strength, which stabilizes the excited triplet states visited during the dynamics. The ISC leads to a temporary 10% population in the singlet states, that subsequently decreases to 1–2% at later simulation times up to 10 ps. Based on the analysis of the electronic character of all states involved in the dynamics, it is suggested that the overall population of the singlet states can be increased by increasing the ligand-field strength through suitable modification of the ligands of VIIICl3(ddpd). Such modifications are expected to result both in a more favorable population of the singlet states compared to the competing pathway to the triplet MC states, as well as a stabilization of the population in the singlet states, thus leading to larger phosphorescence yields for derivatives of VIIICl3(ddpd).
Data availability
The data that support the findings of this study are available from the corresponding author upon reasonable request.
Author contributions
Conceptualization, J. P. Z. and L. G.; calculations, J. P. Z. and T. K.; analysis, J. P. Z.; writing—original draft preparation, J. P. Z.; writing—review and editing, L. G.
Conflicts of interest
There are no conflicts to declare.
Supplementary Material
Acknowledgments
The authors thank S. Mai and M. Heindl for fruitful discussion during the course of this work. This work was supported by Deutsche Forschungsgemeinschaft [DFG, Priority Program SPP 2102 “Light-controlled reactivity of metal complexes” (GO 1059/8-1)]. The authors thank the Vienna Scientific Cluster for allocation of computer time.
Electronic supplementary information (ESI) available: Optimized ground-state geometry (Section S1), additional details of the CASSCF calculations (Section S2), comparison to benchmark CASPT2 calculations and experimental absorption spectra (Section S3), additional analysis of the surface hopping dynamics (Section S4), and an additional file containing the parameters of the LVC model as well as the ground-state normal modes (lvc.zip). See DOI: 10.1039/d1sc02149d
Notes and references
- Kalyanasundaram K. Grätzel M. Coord. Chem. Rev. 1998;77:347–414. doi: 10.1016/S0010-8545(98)00189-1. [DOI] [Google Scholar]
- Auböck G. Chergui M. Nat. Chem. 2015;7:629–633. doi: 10.1038/nchem.2305. [DOI] [PubMed] [Google Scholar]
- CRC Handbook of Chemistry and Physics, ed. D. R. Lide, CRC Press, 2005 [Google Scholar]
- Wenger O. S. J. Am. Chem. Soc. 2018;140:13522–13533. doi: 10.1021/jacs.8b08822. [DOI] [PubMed] [Google Scholar]
- Bozic-Weber B. Constable E. C. Housecraft C. E. Coord. Chem. Rev. 2013;257:3089–3106. doi: 10.1016/j.ccr.2013.05.019. [DOI] [Google Scholar]
- Förster C. Heinze K. Chem. Soc. Rev. 2020;49:1057–1070. doi: 10.1039/C9CS00573K. [DOI] [PubMed] [Google Scholar]
- Büldt L. A. Guo X. Vogel R. Prescimone A. Wenger O. S. J. Am. Chem. Soc. 2017;139:985–992. doi: 10.1021/jacs.6b11803. [DOI] [PubMed] [Google Scholar]
- Chábera P. Liu Y. Prakash O. Thyrhaug E. El Nahhas A. Honarfar A. Essén S. Fredin L. A. Harlang T. C. B. Kjær K. S. Handrup K. Ericson F. Tatsuno H. Morgan K. Schnadt J. Häggström L. Ericsson T. Sobkowiak A. Lidin S. Huang P. Styring S. Uhlig J. Bendix J. Lomoth R. Sundström V. Persson P. Wärnmark K. Nature. 2017;543:695–699. doi: 10.1038/nature21430. [DOI] [PubMed] [Google Scholar]
- Kjær K. S. Kaul N. Prakash O. Chábera P. Rosemann N. W. Homarfar A. Gordivska O. Fredin L. A. Bergquist K.-E. Häggström L. Ericsson T. Lindh L. Yartsev A. Styring S. Huang P. Uhlig J. Bendix J. Strand D. Sundström V. Persson P. Lomoth R. Wärnmark K. Science. 2019;363:249–253. doi: 10.1126/science.aau7160. [DOI] [PubMed] [Google Scholar]
- Pal A. K. Li C. Hanan G. S. Zysman-Colman E. Angew. Chem., Int. Ed. 2018;57:8027–8031. doi: 10.1002/anie.201802532. [DOI] [PubMed] [Google Scholar]
- Hamze R. Peltier J. L. Sylvinson D. Jung M. Cardenas J. Haiges R. Soleilhavoup M. Jazzar R. Djurovich P. I. Bertrand G. Thompson M. E. Science. 2019;363:601–606. doi: 10.1126/science.aav2865. [DOI] [PubMed] [Google Scholar]
- Otto S. Grabolle M. Förster C. Kreitner C. Resch-Genger U. Heinze K. Angew. Chem., Int. Ed. 2015;54:11572–11576. doi: 10.1002/anie.201504894. [DOI] [PubMed] [Google Scholar]
- Wang C. Otto S. Dorn M. Kreidt E. Lebon J. Sršan L. Di Martino-Fumo P. Gerhards M. Resch-Genger U. Seitz M. Heinze K. Angew. Chem., Int. Ed. 2018;57:1112–1116. doi: 10.1002/anie.201711350. [DOI] [PubMed] [Google Scholar]
- Otto S. Förster C. Wang C. Resch-Genger U. Heinze K. Chem.–Eur. J. 2018;24:12555–12563. doi: 10.1002/chem.201802797. [DOI] [PubMed] [Google Scholar]
- Jiménez J.-R. Doistau B. Cruz C. M. Besnard C. Cuerva J. M. Campaña A. G. Piguet C. J. Am. Chem. Soc. 2019;141:13244–13252. doi: 10.1021/jacs.9b06524. [DOI] [PubMed] [Google Scholar]
- Dorn M. Kalmbach J. Boden P. Päpcke A. Gómez S. Förster C. Kuczelinis F. Carrella L. M. Büldt L. A. Bings N. H. Rentschler E. Lochbrunner S. González L. Gerhards M. Seitz M. Heinze K. J. Am. Chem. Soc. 2020;142:7947–7955. doi: 10.1021/jacs.0c02122. [DOI] [PubMed] [Google Scholar]
- Zampetti A. Minotto A. Cacialli F. Adv. Funct. Mater. 2019;29:1807623. doi: 10.1002/adfm.201807623. [DOI] [Google Scholar]
- Guo Z. Park S. Yoon J. Shin I. Chem. Soc. Rev. 2014;43:16–29. doi: 10.1039/C3CS60271K. [DOI] [PubMed] [Google Scholar]
- Förster C. Dorn M. Reuter T. Otto S. Davarci G. Reich T. Carrella L. Rentschler E. Heinze K. Inorganics. 2018;6:86. doi: 10.3390/inorganics6030086. [DOI] [Google Scholar]
- Dorn M. Kalmbach J. Boden P. Kruse A. Dab C. Reber C. Niedner-Schatteburg G. Lochbrunner S. Gerhards M. Seitz M. Heinze K. Chem. Sci. 2021 doi: 10.1039/D1SC02137K. [DOI] [PMC free article] [PubMed] [Google Scholar]
- Falahati K. Tamura H. Burghardt I. Huix-Rotllant M. Nat. Commun. 2018;9:4502. doi: 10.1038/s41467-018-06615-1. [DOI] [PMC free article] [PubMed] [Google Scholar]
- Fumanal M. Gindensperger E. Daniel C. J. Phys. Chem. Lett. 2018;9:5189–5195. doi: 10.1021/acs.jpclett.8b02319. [DOI] [PubMed] [Google Scholar]
- Pápai M. Vankó G. Rozgonyi T. Penfold T. J. J. Phys. Chem. Lett. 2016;7:2009–2014. doi: 10.1021/acs.jpclett.6b00711. [DOI] [PubMed] [Google Scholar]
- Richter M. Marquetand P. González-Vázquez J. Sola I. González L. J. Chem. Theory Comput. 2011;7:1253–1258. doi: 10.1021/ct1007394. [DOI] [PubMed] [Google Scholar]
- Mai S. Marquetand P. González L. Wiley Interdiscip. Rev.: Comput. Mol. Sci. 2018;8:e1370. doi: 10.1002/wcms.1370. [DOI] [PMC free article] [PubMed] [Google Scholar]
- Köppel H., Domcke W. and Cederbaum L. S., Advances in Chemical Physics Vol. 57, John Wiley & Sons, 1984, pp. 59–246 [Google Scholar]
- Plasser F. Gómez S. Menger M. F. S. J. Mai S. González L. Phys. Chem. Chem. Phys. 2019;21:57–69. doi: 10.1039/C8CP05662E. [DOI] [PubMed] [Google Scholar]
- Mai S. Menger M. F. S. J. Marazzi M. Stolba D. L. Monari A. González L. Theor. Chem. Acc. 2020;139:65. doi: 10.1007/s00214-020-2555-6. [DOI] [PMC free article] [PubMed] [Google Scholar]
- Zobel J. P. Bokareva O. S. Zimmer P. Wölper C. Bauer M. González L. Inorg. Chem. 2020;59:14666–14678. doi: 10.1021/acs.inorgchem.0c02147. [DOI] [PMC free article] [PubMed] [Google Scholar]
- Heindl M. Hongyan J. Hua S.-A. Oelschlegel M. Meyer F. Schwarzer D. González L. Inorg. Chem. 2021:1672–1682. doi: 10.1021/acs.inorgchem.0c03163. [DOI] [PMC free article] [PubMed] [Google Scholar]
- Cramer C. J. Truhlar D. G. Phys. Chem. Chem. Phys. 2009;11:10757–10816. doi: 10.1039/B907148B. [DOI] [PubMed] [Google Scholar]
- Mai S. González L. Angew. Chem., Int. Ed. 2020;59:16832–16846. doi: 10.1002/anie.201916381. [DOI] [PMC free article] [PubMed] [Google Scholar]
- Atkins A. J. González L. J. Phys. Chem. Lett. 2017;8:3840–3845. doi: 10.1021/acs.jpclett.7b01479. [DOI] [PubMed] [Google Scholar]
- Liu X.-Y. Zhang Y.-H. Fang W.-H. Cui G. J. Phys. Chem. A. 2018;122:5518–5532. doi: 10.1021/acs.jpca.8b04392. [DOI] [PubMed] [Google Scholar]
- Mai S. González L. Chem. Sci. 2019;10:10405–10411. doi: 10.1039/C9SC03671G. [DOI] [PMC free article] [PubMed] [Google Scholar]
- Fang Y.-G. Peng L.-Y. Liu X. Y. Fang W.-H. Cui G. Comput. Theor. Chem. 2019;1155:90–100. doi: 10.1016/j.comptc.2019.03.025. [DOI] [Google Scholar]
- Talotta F. Boggio-Pasqua M. González L. Chem.–Eur. J. 2020;26:11522–11528. doi: 10.1002/chem.202000507. [DOI] [PMC free article] [PubMed] [Google Scholar]
- Mai S., Richter M., Heindl M., Menger M. F. S. J., Atkins A., Ruckenbauer M., Plasser F., Ibele L. M., Kropf S., Oppel M., Marquetand P. and González L., SHARC2.1: Surface Hopping Including Arbitrary Couplings –Program Package for Non-Adiabatic Dynamics, http://sharc-md.org, 2019
- Barbatti M. Crespo-Otero R. Top. Curr. Chem. 2016;368:415–444. doi: 10.1007/128_2014_605. [DOI] [PubMed] [Google Scholar]
- Sun L. Hase W. L. J. Chem. Phys. 2010;133:044313. doi: 10.1063/1.3463717. [DOI] [PubMed] [Google Scholar]
- Barbatti M. Grannuci G. Persico M. Ruckenbauer M. Vazdar M. Eckert-Maksić M. Lischka H. J. Photochem. Photobiol., A. 2007;190:228–240. doi: 10.1016/j.jphotochem.2006.12.008. [DOI] [Google Scholar]
- Granucci G. Persico M. Toniolo A. J. Chem. Phys. 2001;114:10608–10615. doi: 10.1063/1.1376633. [DOI] [Google Scholar]
- Granucci G. Persico M. Zoccante A. J. Chem. Phys. 2010;133:134111. doi: 10.1063/1.3489004. [DOI] [PubMed] [Google Scholar]
- Plasser F. Ruckenbauer M. Mai S. Oppel M. Marquetand P. González L. J. Chem. Theory Comput. 2016;12:1207–1219. doi: 10.1021/acs.jctc.5b01148. [DOI] [PMC free article] [PubMed] [Google Scholar]
- Becke A. D. J. Chem. Phys. 1993;98:5648–5652. doi: 10.1063/1.464913. [DOI] [Google Scholar]
- Lee C. Yang W. Parr R. G. Phys. Rev. B. 1988;37:785–789. doi: 10.1103/PhysRevB.37.785. [DOI] [PubMed] [Google Scholar]
- Weigend F. Ahlrichs R. Phys. Chem. Chem. Phys. 2005;7:3297–3305. doi: 10.1039/B508541A. [DOI] [PubMed] [Google Scholar]
- Grimme S. Ehrlich S. Goerigk L. J. Comput. Chem. 2011;32:1456–1465. doi: 10.1002/jcc.21759. [DOI] [PubMed] [Google Scholar]
- Neese F. Wiley Interdiscip. Rev.: Comput. Mol. Sci. 2012;2:73–78. [Google Scholar]
- van Wüllen C. J. Chem. Phys. 1998;109:392–399. doi: 10.1063/1.476576. [DOI] [Google Scholar]
- Roos B. O. Taylor P. R. Siegbahn P. E. M. Chem. Phys. 1980;48:157–173. doi: 10.1016/0301-0104(80)80045-0. [DOI] [Google Scholar]
- Roos B. O. Lindh R. Malmqvist P.-Å. Veryazov V. Widmark P.-O. J. Phys. Chem. A. 2004;108:2851–2858. doi: 10.1021/jp031064+. [DOI] [Google Scholar]
- Roos B. O. Lindh R. Malmqvist P.-Å. Veryazov V. Widmark P.-O. J. Phys. Chem. A. 2005;109:6575–6579. doi: 10.1021/jp0581126. [DOI] [PubMed] [Google Scholar]
- Galván I. F. Vacher M. Alavi A. Angeli C. Aquilante F. Autschbach J. Bao J. J. Bokarev S. I. Bogdanov N. A. Carlson R. K. Chibotaru L. F. Creutzberg J. Dattani N. Delcey M. G. Dong S. S. Dreuw A. Freitag L. Frutos L. M. Gagliardi L. Gendron F. Giussani A. González L. Grell G. Guo M. Hoyer C. E. Johansson M. Keller S. Knecht S. Kovačević G. Källman E. Manni G. L. Lundberg M. Ma Y. Mai S. Malhado J. P. Malmqvist P. Å. Marquetand P. Mewes S. A. Norell J. Olivucci M. Oppel M. Phung Q. M. Pierloot K. Plasser F. Reiher M. Sand A. M. Schapiro I. Sharma P. Stein C. J. Sørensen L. K. Truhlar D. G. Ugandi M. Ungur L. Valentini A. Vancoillie S. Veryazov V. Weser O. Wesołowski T. A. Widmark P.-O. Wouters S. Zech A. Zobel J. P. Lindh R. J. Chem. Theory Comput. 2019;15:5925–5964. doi: 10.1021/acs.jctc.9b00532. [DOI] [PubMed] [Google Scholar]
- Schimmelpfennig B., AMFI, An Atomic Mean-Field Spin-Orbit Integral Program, University of Stockholm, 1996 [Google Scholar]
- Finley J. Malmqvist P.-Å. Roos B. O. Serrano-Andrés L. Chem. Phys. Lett. 1998;288:299–306. doi: 10.1016/S0009-2614(98)00252-8. [DOI] [Google Scholar]
- Forsberg N. Malmqvist P.-Å. Chem. Phys. Lett. 1997;274:196–204. doi: 10.1016/S0009-2614(97)00669-6. [DOI] [Google Scholar]
- Ghigo G. Roos B. O. Malmqvist P.-Å. Chem. Phys. Lett. 2004;396:142–149. doi: 10.1016/j.cplett.2004.08.032. [DOI] [Google Scholar]
- Zobel J. P. Nogueira J. J. González L. Chem. Sci. 2017;8:1482–1499. doi: 10.1039/C6SC03759C. [DOI] [PMC free article] [PubMed] [Google Scholar]
- Jäger M. Freitag L. González L. Coord. Chem. Rev. 2015;304–305:146–165. doi: 10.1016/j.ccr.2015.03.019. [DOI] [Google Scholar]
- Plasser F. Lischka H. J. Chem. Theory Comput. 2012;8:2777–2789. doi: 10.1021/ct300307c. [DOI] [PubMed] [Google Scholar]
- Plasser F. J. Chem. Phys. 2020;152:084108. doi: 10.1063/1.5143076. [DOI] [PubMed] [Google Scholar]
- Mai S. Plasser F. Dorn J. Fumanal M. Daniel C. González L. Coord. Chem. Rev. 2018;361:74–97. doi: 10.1016/j.ccr.2018.01.019. [DOI] [Google Scholar]
- Shao Y. Head-Gordon M. Krylov A. J. Chem. Phys. 2003;118:4807–4818. doi: 10.1063/1.1545679. [DOI] [Google Scholar]
- Ziegler T. Rauk A. Baerends E. J. Theor. Chim. Acta. 1977;43:261–271. doi: 10.1007/BF00551551. [DOI] [Google Scholar]
- Nangia S. Jasper A. W. Miller III T. F. Truhlar D. G. J. Chem. Phys. 2004;120:3586–3597. doi: 10.1063/1.1641019. [DOI] [PubMed] [Google Scholar]
- Kurtz K. Hofmann A. de Vivie-Riedle R. J. Chem. Phys. 2001;114:6151–6159. doi: 10.1063/1.1355658. [DOI] [Google Scholar]
- Plasser F. Barbatti M. Aquino A. J. A. Lischka H. J. Phys. Chem. A. 2009;113:8490–8499. doi: 10.1021/jp9032172. [DOI] [PubMed] [Google Scholar]
Associated Data
This section collects any data citations, data availability statements, or supplementary materials included in this article.
Supplementary Materials
Data Availability Statement
The data that support the findings of this study are available from the corresponding author upon reasonable request.


