


Abstract
Skeletal muscle regeneration is mediated by myoblasts that undergo epigenomic changes to establish the gene expression program of differentiated myofibers. mSWI/SNF chromatin remodeling enzymes coordinate with lineage-determining transcription factors to establish the epigenome of differentiated myofibers. Bromodomains bind to acetylated lysines on histone N-terminal tails and other proteins. The mutually exclusive ATPases of mSWI/SNF complexes, BRG1 and BRM, contain bromodomains with undefined functional importance in skeletal muscle differentiation. Pharmacological inhibition of mSWI/SNF bromodomain function using the small molecule PFI-3 reduced differentiation in cell culture and in vivo through decreased myogenic gene expression, while increasing cell cycle-related gene expression and the number of cells remaining in the cell cycle. Comparative gene expression analysis with data from myoblasts depleted of BRG1 or BRM showed that bromodomain function was required for a subset of BRG1- and BRM-dependent gene expression. Reduced binding of BRG1 and BRM after PFI-3 treatment showed that the bromodomain is required for stable chromatin binding at target gene promoters to alter gene expression. Our findings demonstrate that mSWI/SNF ATPase bromodomains permit stable binding of the mSWI/SNF ATPases to promoters required for cell cycle exit and establishment of muscle-specific gene expression.
Graphical Abstract
Graphical Abstract.
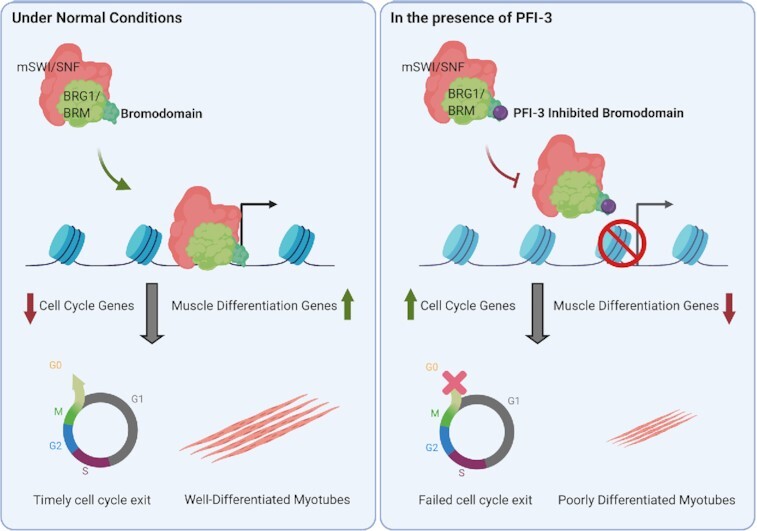
Effects of PFI-3 induced bromodomain inhibition on skeletal myogenesis. In normal conditions, BRG1/BRM with active bromodomains can bind to promoters of target genes when muscle differentiation is induced. This in turn affects two important aspects of skeletal myogenesis: cell cycle exit and the formation of differentiated multinucleated myotubes. In the presence of PFI-3, BRG1 and BRM show reduced binding to target gene promoters leading to continued cell-cycle and incomplete differentiation resulting in shorter myotubes.
INTRODUCTION
Regulation of gene expression is a tightly coordinated process that is dependent on transcription factors, coactivators and chromatin remodelers. Some of these regulators are tissue-specific and act on target genes in a context-dependent manner. Tissue-specific regulation is absolutely crucial for proper development of multi-cellular life forms in which all cells contain the same genetic information. Portions of the genome that are irrelevant to a particular tissue type are often condensed into repressive heterochromatin as development and differentiation occur (1,2). In contrast, coordinated activity of lineage-determining transcription factors and chromatin remodelers, in particular the mSWI/SNF family of chromatin remodeling enzymes, drives many differentiation events, including skeletal muscle differentiation (3–7). The mSWI/SNF enzymes remodel chromatin in an ATP-dependent manner (8–10) and form a family of enzymes assembled into different configurations from a potential pool of more than twenty subunit proteins (11–13). The BRG1 and BRM ATPases act as mutually exclusive catalytic subunits (10).
Skeletal muscle originates from the paraxial mesoderm during embryogenesis. Fetal skeletal myogenesis is characterized by an abundance of myogenic progenitor cells that divide actively and fuse to form multinucleated muscle fibers (14,15). As the embryo develops into an adult, these progenitor cells become relatively sparse and quiescent. These adult stem cells are known as satellite cells and can be activated to proliferate and regenerate new myofibers in case of an injury to adult skeletal muscle (16–18). Upon activation, expression of myogenic regulatory factors (MRFs)—MYOD, MRF4, MYF5 and Myogenin—is initiated in a coordinated manner. MRFs are basic helix-loop-helix (bHLH) proteins that are evolutionarily conserved from worms to humans (19–21). They bind to consensus sequences called E-boxes at target muscle promoters and activate muscle-specific gene expression (22). Another family of transcription factors called the myocyte enhancer factor 2 (MEF2) family acts with the MRFs to promote expression of the myogenic genes (23,24).
During skeletal myogenesis, the mSWI/SNF complex is recruited to the myogenic loci by MRFs (25–30), in some cases, in conjunction with PBX1 (25). Mechanistically, upon induction of differentiation in myocytes, the p38 kinase responds to extracellular cues by phosphorylating the BAF60c subunit of mSWI/SNF chromatin remodeling enzymes, which is associated with MYOD on myogenic genes in the absence of other mSWI/SNF subunits in proliferating myoblasts (27,29). The phospho-BAF60c-MYOD complex then recruits the rest of the mSWI/SNF complex to myogenic loci, which promotes chromatin accessibility and activates gene expression (29). Once recruited to myogenic loci, the ATPase activity of BRG1 or BRM in the complex is known to be indispensable for expression of the differentiation-specific gene program (26,28,31).
The BRG1 and BRM ATPases possess bromodomains in the C-terminal part of the protein (32–34). Bromodomains are well-characterized motifs known to interact with acetylated lysine residues on the N-terminal tails of histones H3 and H4 (35,36) and on other non-histone proteins (37). The interaction of bromodomains with acetylated histones has been determined to be crucial for regulation of some gene expression events (37). Based on structural homology, bromodomain-containing proteins can be classified into eight families (35,38). BRG1 and BRM belong to family VIII of bromodomains along with a third mSWI/SNF protein called BAF180 (Polybromo1, PBRM1, PB1) that contains six tandem bromodomains (38,39).
Efforts to identify pharmacological inhibitors of bromodomains identified salicylic acid as a specific interactor of BRG1, BRM and BAF180 bromodomains (40,41). This led to a series of structure-guided design steps that resulted in the PFI-3 inhibitor that is specific for the second and fifth bromodomain of BAF180 and the bromodomains of BRG1 and BRM (40,42). To date PFI-3 has been used to probe biological function in a number of contexts. Because BRG1 and other subunits of the mSWI/SNF enzyme have been shown to be required for proliferation of some cancer cells (43–45), PFI-3 was tested for inhibitory effects on cancer cell proliferation, with no effect observed on many different cancer cell types, including the NCI-60 tumor cell panel (40,46,47). These results demonstrate that mSWI/SNF bromodomains are not required for cancer cell proliferation. An inhibitory effect of PFI-3 was observed in PTEN-depleted prostate cancer cells in culture, in xenografts and in PTEN deficient mouse model susceptible to prostate cancer (48). PTEN is a tumor suppressor that normally regulates the AKT/PKB signaling pathway (49). Thus, the importance of mSWI/SNF bromodomains, and specifically, the BRG1 bromodomain, is enhanced in the absence of PTEN and inhibition of AKT/PKB signaling, suggesting a complex mode of regulation of mSWI/SNF protein bromodomain function. PFI-3 treatment increased the accessibility of an mSWI/SNF-repressed promoter and its gene expression (50). In these and other studies, PFI-3 altered both gene expression patterns dependent on mSWI/SNF bromodomain-containing proteins and the cellular and organismal phenotypes controlled by those genes (47,48,51–56). The data indicate that the pleiotropic effects of PFI-3 and inhibition of mSWI/SNF bromodomains links to the ability of the chromatin remodeling enzyme to modulate gene expression.
In the realm of tissue specification, PFI-3 treatment caused a loss of ‘stemness’ and promoted differentiation of ESCs and trophoblast and neural stem cells in the absence of differentiation signaling (40,57). In other contexts, PFI-3 inhibited differentiation, blocking the ability of myoblasts and pre-adipocytes to form myotubes and adipocytes, respectively, in the presence of differentiation signaling (42). In this study, we used PFI-3 to characterize the role of mSWI/SNF bromodomains in the context of skeletal myogenesis. PFI-3 reduced the ability of cultured mouse myoblasts to differentiate into myotubes, while PFI-3 induced inhibition of bromodomain function in mice reduced skeletal muscle regeneration following injury, demonstrating in vivo relevance. Using RNA-sequencing, we identified the genes whose expression is dependent on mSWI/SNF bromodomains. Broadly, proliferation-related genes were found to be upregulated by bromodomain inhibition while myogenic genes were downregulated. We also demonstrated that bromodomain function is essential for timely exit of myoblasts from the cell cycle upon induction of differentiation. We determined that BAF180 is not required for myogenesis in mouse myoblasts and demonstrated that the BRG1 and BRM bromodomains play a crucial role in skeletal muscle differentiation by promoting the stable binding of BRG1 and BRM to target gene promoters. Thus, this study mechanistically demonstrates the specific importance of mSWI/SNF bromodomains in context of skeletal muscle differentiation.
MATERIALS AND METHODS
Antibodies and chemicals
Antibodies were purchased from ABclonal Technology, USA (anti-PBRM1, A9878) and Santa Cruz Biotech, USA (anti-BRG1, sc-17796; anti-BrdU, sc-32323; anti-Cyclin A, sc-596; anti-Cyclin E, sc-198; anti-Vinculin, sc-25336; anti-LaminB1, sc-56144; anti-β-tubulin, sc-166729). Anti-acetyl histone H3 (06–599) and anti-acetyl histone H4 (06–598) were purchased from Miilipore Sigma, USA. Myosin Heavy Chain (MHC) (#MF20) and Myogenin (#F5D) antibodies were purchased from the Developmental Studies Hybridoma Bank, University of Iowa, USA. BRM and Myod antisera were described previously (25,58). PFI-3 was purchased from Cayman Chemicals, USA. Lysis buffers for ChIP assays were purchased from Cell Signaling Technology, USA (SimpleChIP® Enzymatic Cell Lysis Buffers A & B, 14282; SimpleChIP® Chromatin IP Buffers, 14231). Dulbecco's modified Eagle's medium (DMEM) was purchased from ThermoFisher Scientific (#11965118). Vectastain elite ABC (PK-6200) and HRP DAB substrate (SK-4100) kits were purchased from Vector Laboratories, USA. Corn Oil, Mayer's hematoxylin, Eosin Y and lithium carbonate were purchased from Millipore Sigma, USA. Cardiotoxin was purchased from Laxtoxan, France. Xylene was purchased from Electron Microscopy sciences, USA and Optimal Cutting Temperature (OCT) compound was from Fisher Healthcare, USA.
Cell culture
C2C12 cells were purchased from ATCC (Manassas, VA, USA) and maintained at sub-confluent densities in DMEM supplemented with 10% FBS and 1% penicillin/streptomycin in a humidified incubator at 37°C in 5% CO2.
Mouse satellite cells were isolated from leg muscles of 2 week old C57BL6/J mice using Percoll sedimentation followed by differential plating as described previously (59). Mice were housed in the animal care facility at the University of Massachusetts Medical School and used in accordance with a protocol approved by the Institutional Animal Care and Use Committee (IACUC).
For differentiation, cells at >70% confluency were switched to DMEM medium supplemented with 2% horse serum and 2 μg/ml of bovine insulin (Sigma-Aldrich, St. Louis, MO). Where indicated, cells were pre-treated with DMSO or PFI-3 for 24 h before inducing differentiation. PFI-3 concentration ranged from 10 to 100 μM in the initial titration experiment; for all other experiments, PFI-3 was maintained during the course of the experiment at 50 μM and the medium was replaced every 24 h.
siRNA transfection
C2C12 cells were plated on 12-well plates in DMEM medium 12 h before transfection. Cells were transfected at 50% confluence using the Lipofectamine 2000 (Invitrogen) reagent with 50 nM siRNA SMARTpool ON-TARGETplus (Dharmacon, Scrambled non-targeting Pool # D-001810-10-20 and Pbrm1 #L-044781-00-0005). Thirty six hours post-transfection, the cells were induced for differentiation and samples were harvested at indicated times for further analysis.
Immunofluorescence
Cells were seeded on 22 mm × 22 mm size coverslips in 35 mm dishes and were harvested after the indicated treatments at the specified timepoints. The samples were washed with PBS twice and then fixed with ice-cold fixative (2% formaldehyde and 0.2% glutaraldehyde in PBS) for 10 min on ice. The cells were washed with PBS twice and permeabilized with ice-cold permeabilization buffer (0.2% Triton-X 100 in PBS) for 5 min on ice. Samples were then washed once with PBS and blocked using freshly prepared blocking reagent (5% BSA in PBS) for 30 min at room temperature (RT). The cells were washed twice with PBS and incubated with primary antibody cocktail diluted to the desired concentration in blocking reagent (2% BSA in PBS) for 2 h at room temperature. Post-incubation, samples were washed thrice with PBS 10 min each to remove non-specific binding. Cells were then incubated with fluorophore-conjugated secondary antibody (1:100) and DAPI (2 μg/ml), both diluted in blocking reagent (2% BSA in PBS) for 45 min at RT followed by three washes with PBS to remove non-specific staining. The stained cells on coverslips were then inverted-mounted on glass slides in 70% glycerol and the sides were sealed with nail paint. Confocal imaging analysis was performed using Leica TCS SP5 II laser scanning confocal microscope and analyzed with Leica Lite software.
Immunocytochemistry
Cells were harvested at desired time points after indicated treatments and were fixed overnight in 10% formalin-PBS at 4°C. Samples were washed with PBS and permeabilized for 10 min in PBS containing 0.2% Triton X-100. Immunocytochemistry (ICC) was performed using Vectastain elite ABC system (PK-6200) and developed with Peroxidase (HRP) DAB Substrate Kit (SK-4100) according to manufacturer's instructions.
Fusion index
For calculation of fusion index, cells were harvested at the specified timepoints after the indicated treatments and were immunostained with myosin heavy chain (MF20, DSHB) and DAPI (nuclear staining) as described above. The images were captured at 40× magnification using a Leica TCS SP5 II laser scanning confocal microscope. Analysis was performed by scoring cells for number of nuclei and MHC staining. Fusion index was calculated as the percentage of nuclei/cells stained with myosin heavy chain as compared to total number of nuclei/cells (60).
RIPA buffer lysis
Cells were harvested after the indicated treatments at specific timepoints and were washed twice with ice-cold PBS. After draining all residual PBS, cells were scraped into 1 ml ice-cold PBS with 1× protease inhibitor cocktail (Sigma Aldrich, P8340) and pelleted at 1500 × g for 5 min at 4°C. The pellets were lysed in 500 μl RIPA buffer (50 mM Tris–HCl, pH 7.4, 150 mM NaCl, 1 mM EDTA, 1% NP-40 and 0.25% sodium deoxycholate) supplemented with 1× protease inhibitor cocktail (Sigma Aldrich, P8340). Samples were incubated on ice for 30 min and whole cell extracts were prepared by passing the lysed pellets through a 27-gauge needle at least 4–5 times. Samples were centrifuged at 14 000 × g for 10 min at 4°C and supernatants were collected.
Acid extraction of histones
Cells treated with either DMSO or PFI-3 were harvested at indicated timepoints. Cell pellets were resuspended in hypotonic lysis buffer (10 mM Tris, 1 mM KCl, 1.5 mM MgCl2) supplemented with 1 mM dithiothreitol and 1× protease inhibitor cocktail (Sigma Aldrich, P8340) added freshly. The resuspended cells were rotated for 30 min at 4°C. This was followed by pelleting the nuclei at 10 000 × g for 10 min at 4°C. The nuclear pellet was resuspended in 400 μl of 0.4 N H2SO4 and incubated overnight with rotation at 4°C. The suspension was centrifuged at 16 000 × g for 10 min at 4°C and supernatant was collected in fresh eppendorf tubes. Trichlorocacetic acid (TCA) was added dropwise (final concentration 33%) to the supernatant and the solution was gently mixed until it turned milky. This solution was incubated on ice for 1 h and subsequently centrifuged at 16 000 × g for 10 min at 4°C to pellet histones. The supernatant was removed carefully and the pellet was washed twice with ice-cold acetone. The washed pellet was air-dried for 20 min and resuspended in ultrapure water.
Western blot analysis
Protein concentrations were determined using a Pierce™ BCA protein assay kit (ThermoFisher Scientific, USA) according to the manufacturer's protocol. Equal amounts of protein from each sample were aliquoted and mixed with 4× Laemmli Sample Buffer (BioRad) and boiled at 95°C for 10 min. The samples were electrophoresed on denaturing SDS-polyacrylamide gels and transferred onto Immobilon-P PVDF membranes (Merck Millipore, USA). The membranes were then blocked using 5% non-fat milk in PBS for 30 min followed by overnight incubation at 4°C with primary antibody against protein of interest at the desired dilution in 2% non-fat milk prepared in PBS. This was followed by three washes with TBS containing 0.1% Tween-20 for 5 min each at room temperature. The membranes were then incubated with HRP-conjugated anti-mouse or anti-rabbit secondary antibodies (1:2500, GE Healthcare Life Sciences) diluted in 2% non-fat milk prepared in PBS for 1 h at RT followed by three washes with TBS containing 0.1% Tween-20 for 5 min each at room temperature. Chemiluminescent detection was performed with ECL Plus (GE Healthcare Life Sciences) using an Amersham Imager 600 (GE Healthcare Life Sciences). Representative blots from three independent experiments are shown. Band signal intensities were quantified using ImageJ software (NIH) (61).
RNA isolation and quantitative RT-PCR
For RNA isolation, cells were grown in 35 mm dishes and harvested after the indicated treatments at specified timepoints. The media were removed, and cells were washed twice with PBS before adding 1 ml of Trizol (ThermoFisher) to each sample. RNA extraction was performed as per the manufacturer's protocol. The final RNA pellet was resuspended in 50 μl nuclease-free water. RNA concentrations were quantified using a Nanodrop1000 spectrophotometer (ThermoFisher Scientific). cDNA was prepared using 2 μg of total RNA using Superscript III First Strand Synthesis Kit (Invitrogen) according to manufacturer's protocol.
For qRT-PCR, 15 μl reactions were prepared in duplicate for all desired samples using 1 μl each of forward and reverse primers (10 μM stocks) and 2 μl cDNA template, and the volume was brought to 7.5 μl using UltraPure distilled water. 7.5 μl of Fast SYBR Green 2X Master Mix (Applied Biosystems) was added to the reaction. The samples were run using the default protocol in QuantStudio 3 RT-PCR machine (Applied Biosystems). Fold-changes were calculated using the 2−ΔΔCt method (62). Primer sequences are listed in Supplementary Table S1.
RNA-sequencing analysis
For RNA sequencing, RNA samples were prepared as described above. Duplicate samples for each timepoint were evaluated for quality and concentration at the UMass Medical School MBCL Fragment Analyzer services. QC-approved samples were sent to BGI Americas Corporation for library preparation and RNA sequencing (63). Libraries were sequenced using the BGISEQ-500 platform and reads were filtered to remove adaptor-polluted, low quality and high content of unknown base reads. About 99% of the raw reads were identified as clean reads (∼65M). Of these, ∼70% of the reads were uniquely mapped to mouse reference genome mm10 using HISAT (64). Transcripts were reconstructed using StringTie (65), and novel transcripts were identified using Cufflinks (66). All transcripts were then combined and mapped to the mm10 reference transcriptome using Bowtie2 (67). Gene expression levels were calculated using RSEM (68). DEseq2 (69) and PoissonDis (70) algorithms were used to detect differentially expressed genes (DEG). GO analysis was performed on DEGs to cluster genes into function-based and pathway-based categories (71,72). Motif analysis was performed using the program findmotifs.pl in HOMER motif discovery software as described previously (72). For each differentially expressed gene, motif enrichment analysis was performed at promoters for locations up to 1 kb upstream of the TSS.
BrdU incorporation and immunostaining
Cell were grown on 22 mm × 22 mm size coverslips in 35 mm dishes with the indicated treatments. The culture media was replaced with fresh media containing 10 mM BrdU 30 min prior to harvesting to allow the cells in S-phase to incorporate the nucleoside analog. Harvested samples were fixed and permeabilized as described above for immunocytochemistry. For DNA hydrolysis, samples were then incubated with 1.2 N HCl diluted in PBS for 1 h at 37°C, followed by neutralization in 0.1 M sodium borate for 5 min at RT. The samples were washed with PBS thrice and immunostained as mentioned above.
Chromatin immunoprecipitation assay
Chromatin immunoprecipitation assays were performed as described previously (73). Quantification was performed using the fold enrichment method (2–(Ct sample – Ct IgG)) and shown as relative to a control region. Sequences of primers used for ChIP assays are listed in Supplementary Table S1.
Skeletal muscle injury and regeneration studies
All animal experiments were performed in accordance with the recommendations of the University of Ottawa Animal Care Facility, and the guidelines published by the Canadian Council on Animal Care (CCAC).
Adult mice were anesthetized under isoflurane (2% in oxygen), and buprenorphine administered (0.1 mg/kg bodyweight) for pain management. The tibialis anterior (TA) muscle was damaged with a single intramuscular injection of cardiotoxin (50 μl, 10 μM in saline), and the contralateral TA remained undamaged to serve as a control. At 72 and 120 h post-injury, mice received either PFI-3 treatment (50 mg/kg of bodyweight, delivered at a dose of 16 μg/μl in vehicle composed of 10% DMSO (v/v) in corn oil), or vehicle (10% DMSO (v/v) in corn oil) by intraperitoneal injection. Following a 7-day regeneration period from time of injury, mice were sacrificed through CO2 asphyxiation and cervical dislocation. Both regenerated and undamaged contralateral TA muscles were isolated from the host, submerged in a tinfoil cup filled with optimal cutting temperature compound, then frozen in isopentane cooled in liquid nitrogen, as decribed (74). For long-term storage, frozen TA muscles were stored at –80°C. Skeletal muscle was processed by capturing 10 μm cross-sections collected from the widest part of the muscle using a cryostat cooled down to –20°C. Cross-sections were captured on positively charged microscope slides, then stored at –80°C for long-term storage. Histological characterization of cross-sections is described below.
Hematoxylin & eosin staining and data quantification
Slides were thawed to room temperature, then immersed in tap water (2 min). From here, slides were immered in Mayer's hematoxylin (5 min), rinsed in tap water (10 s), then immersed in saturated lithium carbonate solution (aqueous, pH 8.00, 1 min). Slides were rinsed in tap water (10 s), dehydrated in 70% ethanol (1 min), then counterstained in Eosin Y solution (5 min). Slides were sequentially rinsed for 1 min each in 70% ethanol, 100% ethanol primary rinse, 100% ethanol secondary rinse, xylene primary rinse, then a secondary xylene rinse. Coverslips were mounted on the slides using xylene-based mounting media, and left to dry in the fumehood. Brightfield cross-sections were imaged using a Zeiss Z1 axioscan. Histology cross-sections imaged on a Zeiss Z1 axioscan were processed with the freely available version of Zen Blue, and minimal Feret diameter was quantified with FIJI.
Statistical analysis
All quantitative data for gene expression and chromatin immunoprecipitation are shown as mean ± the standard deviation of at least three independent biological replicates. In the fusion index and BrdU incorporation assays, two independent experiments were performed in duplicate. A minimum of 200 nuclei per sample were counted and the results were expressed as the mean of calculated fusion index ± standard deviation. The in vivo experiments were performed on adult mice (6-weeks) with equal replicates on male (n = 3) and female (n = 3) populations. Statistical results are represented as mean ± standard deviation. Statistical analyses were performed using Graphpad Prism8 Student's t-test with two-tailed distribution and equal variance (Graphpad Prism Software Inc., USA). Significance is displayed with *P < 0.05, **P < 0.01 and ***P < 0.005.
RESULTS
Inhibition of bromodomain function results in aberrant myotube fusion
PFI-3 is a pharmacological inhibitor specific for the BRG1, BRM and BAF180 bromodomains, members of bromodomain family VIII (40,46). Prior work showed that PFI-3 impaired differentiation of immortalized pre-adipocytes and myoblasts (42). The mechanisms responsible for the observed effects on differentiation were not defined, so we sought to investigate the roles played by mSWI/SNF bromodomains during myogenesis.
C2C12 immortalized myoblasts initially were treated with vehicle (DMSO) or a range of PFI-3 concentrations, allowed to differentiate for 24–96 h, and were assessed for MHC staining by immunocytochemistry (Supplementary Figure S1A). As previously observed (42), a clear inhibition in differentiation was observed using 50 μM at 48 h. Analysis of later timepoints indicated delayed differentiation under these conditions with an overall reduction in the number of myotubes compared to the control. Higher concentrations resulted in similar or enhanced differentiation but also resulted in cell death. C2C12 and primary myoblasts isolated from the tibialis anterior muscles of 1-week old C57BL/6 mice were then assayed for MHC staining by immunofluorescence for their ability to differentiate in the presence of 50μM PFI-3 or the vehicle. DMSO-treated C2C12 myoblasts showed formation of longer and thicker myotubes at 48 and 72 h post-induction of differentiation than did C2C12 myoblasts treated with PFI-3 (Figure 1A). The efficiency of myogenic differentiation can be scored by calculating fusion index, which is the ratio of the number of nuclei in MHC-stained cells to the total number of nuclei (60). C2C12 cells treated with PFI-3 showed a >50% decrease in fusion index at 24, 48 and 72 h as compared to control samples (Figure 1B).
Figure 1.

PFI-3 impairs skeletal muscle differentiation. (A) Confocal images for C2C12 myoblasts treated with DMSO or PFI-3 and stained for myosin heavy chain (green) and with DAPI (blue) at the indicated timepoints, scale 5 μm. (B) Quantification of fusion index (n > 200). (C) Differentiated myoblasts at respective timepoints were analyzed for number of nuclei per myotube. *P < 0.05, **P < 0.01 and ***P < 0.005 by Student's t-test. (D) In vivo effects of PFI-3 treatment on skeletal muscle regeneration. Diagrammatic representation of the experimental protocol followed, which shows intramuscular damage of the TA by cardiotoxin, followed by intraperitoneal administered PFI-3 at 3- and 5-days post-injury, followed by the experimental endpoint at 7-days post-injury (dpi). (E) Hematoxylin & eosin staining on representative cross-sections (10 μm) of the contralateral undamaged TA muscle and that at 7 dpi for vehicle treatment and PFI-3 treated conditions. (F) Quantification of the minimal Feret diameter measured shows significantly reduced myofiber diameter in regenerated skeletal muscle for PFI-3 treated samples (25.59 μm ± 0.49, n = 6) compared to vehicle treated controls (33.00 μm ± 0.91, n = 6). Minimal Feret diameter measurements of undamaged contralateral legs show no significant difference in PFI-3 treated samples (40.20 μm ± 0.90, n = 6) compared to vehicle treated controls (38.96 μm ± 0.81, n = 6). ns, not significant, ***P < 0.005 by Student's t-test.
Similar results were observed when primary myoblasts were exposed to PFI-3. While DMSO-treated primary myoblasts showed elongated myotubes upon induction of differentiation, the PFI-3-treated cells showed fewer and less elongated myotubes at corresponding timepoints (Supplementary Figure S1B). Quantitative analysis of differentiated primary myoblasts immunostained for MHC showed about a 25–30% decrease in fusion index (Supplementary Figure S1C).
We further quantitatively analyzed the extent of differentiation by counting the number of nuclei in MHC-positive myotubes and classifying them into groups at each timepoint. DMSO-treated C2C12 cells shifted from the majority of 48 h myotubes having <5 nuclei to the majority of myotubes having >5 nuclei by 72 h (Figure 1C). PFI-3-treated cells failed to make this switch; the majority of 72 h myotubes had <5 nuclei (Figure 1C). Similarly, in PFI-3 treated primary cells, the number of myotubes with >5 nuclei at 36h was about one-third of those in DMSO-treated control cells. In PFI-3 treated samples, cells with a single nucleus positively immunostained for MHC were abundant, showing a failure of differentiating myoblasts to fuse (Supplementary Figure S1D). These results suggest that an initial myogenic stimulus is present but is not fully implemented due to inhibition of bromodomain function.
PFI-3-induced inhibition of bromodomain function reduced skeletal muscle regeneration in vivo
To examine the requirement for the mSWI/SNF bromodomain in murine skeletal muscle regeneration, we induced an injury to the tibialis anterior (TA) muscle in vivo using cardiotoxin. PFI-3 was then administered through intraperitoneal injection at 3-days and 5-days post-injury. Histological analysis of the TA muscle after 7 days of regeneration (Figure 1D) showed a reduction in myofiber diameter in mice treated with PFI-3 compared to vehicle treated controls (Figure 1E). Quantification of the minimal Feret diameter of myofibers (Figure 1F) showed that regenerated myofibers were smaller in PFI-3 treated mice (25.59 μm ± 0.49, n = 6) compared to those in vehicle treated controls (33.00 μm ± 0.91, n = 6). In the absence of injury, PFI-3 treatment did not affect the myofiber diameter of the undamaged contralateral legs in PFI-3 treated samples (40.20 μm ± 0.90, n = 6) and the vehicle-treated controls (38.96 μm ± 0.81, n = 6). These results demonstrate that PFI-3 induced inhibition of bromodomain function reduced skeletal muscle regeneration after injury, highlighting the in vivo importance of BRG1 and BRM bromodomains.
Myogenic genes are downregulated upon PFI-3 induced inhibition of mSWI/SNF bromodomains
The results show that PFI-3 treatment causes in vitro and in vivo defects in myogenic differentiation, including an inability of the differentiating myoblasts and/or nascent myotubes to fuse. Myomaker and myomixer have been identified as master regulators of myoblast fusion (75–78). We therefore determined whether the expression of these two regulators was altered upon PFI-3 induced bromodomain inhibition. The results show that expression of these two genes was significantly lower in PFI-3 treated C2C12 cells (Figure 2A). Myogenic regulatory factors (MRFs), Myogenin and Myod, are known to regulate subsequent expression of myogenic genes including the fusion regulators, myomaker and myomixer (79,80). The expression of the Myod transcript and protein was unaffected by PFI-3 treatment (Supplementary Figure S2). However, the expression of Myogenin was significantly decreased in PFI-3 treated samples (Figure 2B and C). The expression of other myogenic genes like muscle creatine kinase and myosin light chain 1 was also significantly decreased in PFI-3 treated samples, as was the expression of caveolin 3 and integrin 7A, two muscle differentiation-related genes (Figure 2B). Western blot analysis confirmed the decreased expression of myosin heavy chain in PFI-3 treated C2C12 cells (Figure 2C). Similar results were obtained for PFI-3 treated primary myoblasts (Supplementary Figure S3). The gene expression signatures from both C2C12 cells and primary myoblasts provides a molecular explanation for the differentiation phenotype caused by bromodomain inhibition.
Figure 2.

mRNA expression levels at the indicated timepoints for (A) the fusion regulator genes myomaker and myomixer and (B) myogenin, muscle creatine kinase, myosin light chain 1, Integrin 7α and Caveolin 3 in C2C12 myoblasts treated with DMSO or PFI-3. Expression was normalized to a control gene (EEF1A1). 100% expression is defined as the timepoint at which maximal expression was observed. ns, not significant, *P < 0.05, **P < 0.01 and ***P < 0.005 by Student's t-test. (C) Representative western blots for expression of myogenin (Myog), myosin heavy chain (MHC), BRG1, BRM and BAF180 at the indicated times in C2C12 cells treated with DMSO or PFI-3. The indicated numbers are the pixel counts normalized to Vinculin expression calculated using ImageJ.
RNA-seq analysis of PFI-3 treated C2C12 cells shows upregulation of cell cycle genes and downregulation of myogenic genes
To gain better insight into effect of the molecular mechanism of bromodomain inhibition on skeletal muscle differentiation, we performed RNA-sequencing of C2C12 cells treated with DMSO or PFI-3. Cells were harvested from proliferative stage (GM) and two differentiated stages (DM 24 h and DM 48 h post-induction). Libraries generated from the samples had ∼45M unique reads. Transcripts were mapped to the mouse genome (mm10) and gene expression levels were calculated. Genes that were identified to be differentially expressed in both replicates for each condition and timepoint were considered for further analysis.
We first examined whether PFI-3 treatment affected gene expression of the subunits of mSWI/SNF complexes. A recent characterization of sub-families of mSWI/SNF complexes identified 29 subunit proteins (13). Assessment of expression of the genes encoding each of these proteins at each time point found only two instances of statistically significant differences (Supplementary Table S2). Arid1a expression was reduced ∼7% at 24 h post-differentiation and Actl6a expression was increased ∼27% at 48 h post-differentiation. We conclude that PFI-3 treatment had essentially no effect on the expression of the genes encoding mSWI/SNF subunits. We subsequently analyzed protein levels of the three bromodomain containing mSWI/SNF proteins by western blot. BRG1, BRM, and BAF180 protein levels were not altered by PFI-3 treatment (Figure 2C), indicating that there is no self- or cross- post-transcriptional regulation among these proteins.
Inhibition of bromodomain function affected the expression of about 50% of the total genes identified as expressed over the time course of the experiment (Figure 3A). The number of DEGs due to bromodomain inhibition increased as a function of differentiation (Figure 3B). The total number of DEGs for proliferating cells (GM) and differentiating cells at 24 h or 48 h post-differentiation (DM 24 h and DM 48 h) were 3144 (up 2216; down 928), 4675 (up 2878; down 1797) and 5261 (up 3105; down 2156), respectively (Supplementary Table S3). Gene expression at DM 24 h and DM 48 h was strongly correlated with 2359 common DEGs as compared to about 1634 common DEGs between GM and DM 24 h. There were 899 genes that were differentially expressed at all timepoints. Gene ontology (GO) analysis was performed on DEGs to cluster genes into function-based categories (71,72) and the complete results are listed in Supplementary Table S4. GO analysis of genes downregulated at DM 48 h showed that the top 10 biological process categories were related to skeletal muscle contraction and skeletal muscle tissue development (Figure 3C; Supplementary Table S4). This is in agreement with our qPCR results (Figure 2), thus identifying the importance of bromodomain function in myogenesis. The top 10 categories from GO analysis of genes upregulated at DM 48 h were related to cell proliferation (Figure 3D; Supplementary Table S4), which suggests altered proliferation due to PFI-3-induced bromodomain inhibition. The promoters of the differentially expressed genes were also analyzed using the HOMER motif enrichment software (72). Sequences 1 kb upstream of the transcription start sites were searched for presence of known consensus motifs (Supplementary Table S5). The analysis revealed that promoters of genes downregulated due to PFI-3 treatment were significantly enriched in motifs corresponding to muscle specific transcription factors from the MEF and MRF families. (Figure 3C; Supplementary Table S5). In the case of upregulated genes, HOMER analysis identified enrichment of motifs known to be bound by E2F family, NFY, KLF5 and Sp1 transcription factors (Figure 3D; Supplementary Table S5). E2F and KLF5 TF families are known to play key role in regulation of cell proliferation and differentiation (81–83). Thus, PFI-3 induced bromodomain inhibition affects expression of genes which are involved in regulation of cell proliferation and skeletal muscle differentiation.
Figure 3.

(A) Heat maps showing results from RNA-seq analysis of PFI-3 treated C2C12 cells assayed while in the proliferative stage in growth media (GM) and while in differentiation media (DM) for 24 and 48 h. (B) Venn diagram showing the number of genes affected at different timepoints. There were 3144 differentially expressed genes (DEGs) in GM (blue), 4675 DEGs in DM 24 h (peach) and 5261 DEGs in DM 48 h (green). (C) GO analysis of downregulated genes at 48 h post induction of differentiation shows downregulation of muscle related genes. Top 10 ‘known motifs’ identified using HOMER transcription factor (TF) motif discovery tool were related to muscle-specific TF families, P-values corresponding to each motif are shown. (D) GO analysis of upregulated genes at 48 h post induction of differentiation shows upregulation of cell cycle related processes. Top 10 ‘known motifs’ identified using HOMER TF motif discovery tool were related to cell cycle-related TF families, P-values corresponding to each motif are shown.
PFI-3 treatment blocked cell-cycle exit of C2C12 cells induced for differentiation
Cell cycle exit is prerequisite for cellular differentiation to proceed in a number of cell types (84–86). Results from the GO analysis of upregulated genes at DM 48 h indicated that inhibition of bromodomain function may interfere with cell cycle exit. To experimentally address the requirement of mSWI/SNF bromodomain function in cell cycle exit, a BrdU (5-bromo-deoxyuridine) incorporation assay was performed with samples treated with or without PFI-3 (Figure 4A). Confocal microscopy analysis showed that cells treated with PFI-3 continued to incorporate BrdU even after the control cells showed no further incorporation, indicating a partial inability to exit cell cycle. Quantification of these images is shown in Figure 4B. Increased protein levels of Cyclins A and E were observed at different timepoints of differentiation (Figure 4C). Decreased mRNA expression of cell cycle inhibitor p21 (Cdkn1a) and increased expression of cyclin A2, cyclin B1, cyclin D1, cyclin D2 and cyclin E1 in PFI-3 treated samples from DM 48h as compared to DMSO controls further correlates with continued cell cycle (Figure 4D). These results show that bromodomain inhibition allows some of the myoblasts to overcome the signals to exit cycle that are normally provided by the low mitogen media and by contact inhibition. Thus, PFI-3 induced bromodomain inhibition may be affecting two aspects of myogenesis: timely exit from the cell cycle and the expression of myogenic genes.
Figure 4.

(A) C2C12 cells treated with PFI-3 show continued BrdU (green) incorporation after 36 h and 48 h post-induction of differentiation as compared to control cells, scale 5 μm. (B) Quantification of confocal images for BrdU incorporation assay in DMSO or PFI-3 treated C2C12 cells at the indicated timepoints. (C) Representative western blot (n = 2) for protein expression of MHC and cyclins A and E at the indicated times in C2C12 cells treated with DMSO or PFI-3. Vinculin was probed as a control. (D) mRNA expression levels of p21 (cdkn1a), cyclin A2, cyclin B1, cyclin D1, cyclin D2 and cyclin E1 in C2C12 myoblasts treated with DMSO or PFI-3 at the indicated timepoints. Expression was normalized to a control gene (EEF1A1). 100% expression is defined as the timepoint at which maximal expression was observed. ns, not significant, *P < 0.05, **P < 0.01 and ***P < 0.005 by Student's t-test.
BAF180 is dispensable for C2C12 myoblast differentiation
The composition of mSWI/SNF complexes is variable depending on function, cell-type and context. Every functional mSWI/SNF complex contains either the BRG1 or the BRM ATPase, while one major sub-class of mSWI/SNF complexes also contains BAF180 (10,13). Thus, PFI-3 treatment affects all mSWI/SNF complexes. BRG1 and BRM have been shown to be required for skeletal muscle differentiation (25,26,28,30,87,88), but the requirement for BAF180 in this process has not been evaluated.
We knocked down BAF180 using siRNA. C2C12 cells depleted for BAF180 were induced for differentiation alongside cells with scrambled siRNA treatment (Figure 5A and B). The cells showed no phenotypic defect and differentiated normally. C2C12 cells depleted for BAF180 and treated with PFI-3 showed phenotypic defects similar to wildtype cells (Figure 1A). These results suggest that BAF180 is dispensable for myogenesis and imply that PFI-3 induced inhibition of myoblast differentiation is mediated through inactivation of BRG1 and/or BRM bromodomain function.
Figure 5.
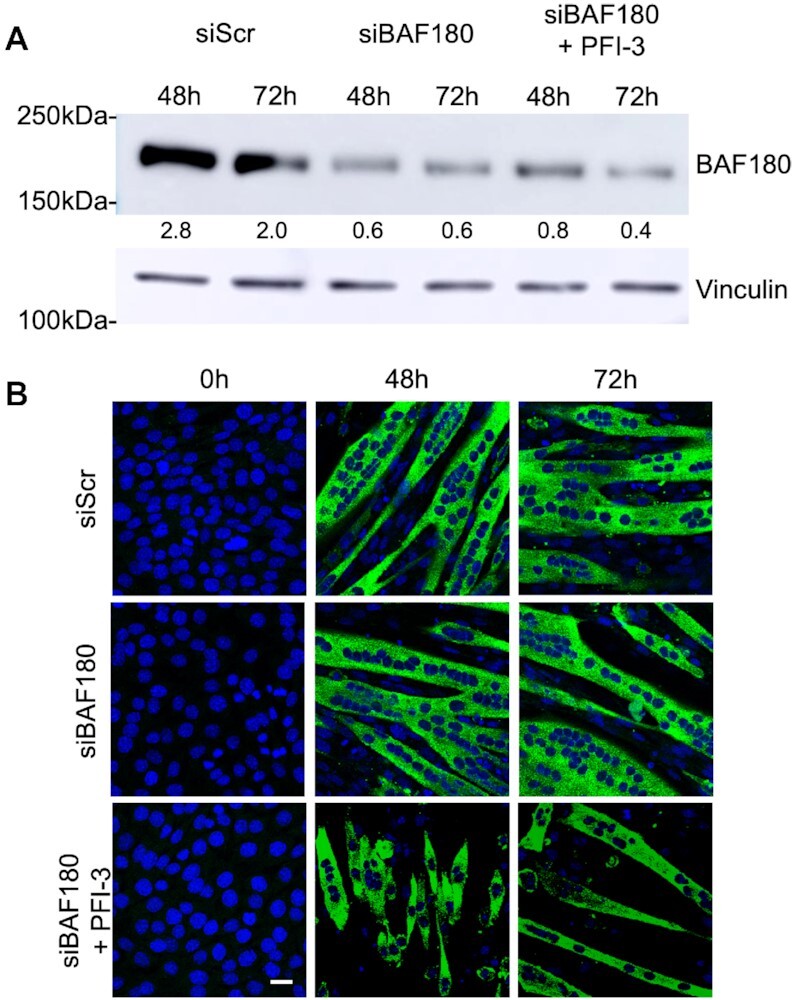
(A) Western blot analysis showed siRNA-mediated silencing of endogenous BAF180 in C2C12 cells differentiated for 48 h and 96 h. A scramble siRNA (siScr) was used as a control. The indicated numbers are the pixel counts normalized to Vinculin expression calculated using ImageJ. (B) Representative images of myosin heavy chain staining in 0, 48 and 96 h differentiated cells transfected with the control or BAF180-targeting siRNAs. The cells are immunostained for anti-myosin heavy chain mAb MF20 (green). The nuclei were visualized by DAPI staining (blue). Scale bar, 5 μm.
Gene targets of PFI-3 inhibition of mSWI/SNF bromodomains predominantly overlap with targets of BRG1 knockdown during myogenesis
The importance of BRG1 and BRM in skeletal muscle differentiation has been shown previously by multiple groups. These studies have looked at muscle-specific gene expression profiles and promoter binding of selected mSWI/SNF subunits on myogenic regulatory sequences. In a recently published study, the authors performed siRNA-mediated knockdown of BRG1 in C2C12 cells differentiated for 48 h followed by RNA-sequencing analysis (89). We compared the siBRG1 dataset from this study with our RNA-sequencing dataset generated from PFI-3 treated C2C12 cells differentiated under similar conditions (Figure 6A). The rationale behind this comparison was to understand the relative importance of the BRG1 bromodomain. The analysis showed that 46% of the gene targets downregulated due to PFI-3 treatment overlapped with downregulated genes in the siBRG1 dataset (Figure 6A). Similarly, 46% of the upregulated genes due to PFI-3 inhibition were common with upregulated genes from siBRG1 dataset. The results show that a subset of BRG1-dependent gene expression in differentiating myoblasts requires bromodomain function. GO analysis of the common overlapping genes was conducted. Common downregulated genes belonged to muscle differentiation related processes while the common upregulated targets fell into cell-cycle related categories. (Figure 6A and B; Supplementary Table S6). Promoters of the common upregulated and downregulated genes were also analyzed using HOMER to search for the presence of known consensus motifs within 1 kb upstream of their TSS (Figure 6A and B; Supplementary Table S6). Promoters of upregulated genes contained motifs known to be bound by E2F, KLF, NFY and Sp1 TF families while those of downregulated genes were enriched for motifs corresponding to MEF and MRF muscle-specific transcription factor families (Figure 6A and B; Supplementary Table S6). Thus, the results from the GO and HOMER motif enrichment analyses of overlapping genes and their promoters are similar to those from PFI-3 treatment as shown in Figure 3C and D and therefore point towards a crucial role played by BRG1 bromodomain in skeletal muscle differentiation and cell cycle regulation.
Figure 6.

Comparative analysis of RNA-seq datasets from BRG1 knockdown performed by Zhu et al. (89) and from PFI-3 treatment. Venn diagrams represent DEGs in corresponding datasets. The overlap represents genes common to both datasets. GO and HOMER motif enrichment analyses show biological process categories, motifs identified within 1 kb upstream of the TSS in the promoters of (A) common downregulated genes and (B) common upregulated genes, and their respective P-values.
We examined the genes that were dependent on BRG1 but independent of PFI-3-mediated inhibiton of bromodomain function (Supplementary Figure S4; Supplementary Table S7). Genes that are up- and down-regulated predominantly represent targets involved in metabolic processes and do not include genes that control skeletal muscle differentiation or control of cell cycle. This suggests that bromodomain-dependent regulation of gene expression is critical for myogenesis. This result also is consistent with prior studies showing that ATPase domain function is required for BRG1-mediated regulation of metabolism (90,91) and that PFI-3 treatment did not affect cancer cell proliferation dependent on BRG1 and/or BRM (46,91). We then performed GO analysis for genes that were affected by PFI-3 treatment but not by BRG1 knockdown (Supplementary Table S8). Upregulated genes were classified into immune system related categories while downregulated genes were identified as general regulators of biological and cellular processes.
Microarray analysis of gene expression in C2C12 cells upon siRNA-mediated knockdown of BRG1 or BRM has also been done in a prior study by Albini et. al (30). Despite the difference in methodologies, we overlapped the DEGs from that study with our RNA-seq data from PFI-3 treated C2C12 cells at comparable timepoints (48h post-differentiation) to evaluate if the outcome from this comparison is in consonance with the previous results. The analysis showed that more than 70% of the genes identified by Albini et al. as unique BRG1 targets overlapped with differentially expressed genes from our PFI-3 RNA-seq dataset (Supplementary Figure S5A). Upon looking individually at upregulated and downregulated targets uniquely regulated by BRG1, there was a 39% and 34% overlap, respectively (Supplementary Figure S5B). These common overlapping target genes were then characterized using GO analysis (Supplementary Figure S5A-B). Upregulated genes fell into cell cycle-related categories, and downregulated genes belonged to muscle differentiation-related categories (complete analysis in Supplementary Table S9). This is in agreement with the overall results from PFI-3 treatment (Figure 3C and D) indicating the importance of active bromodomain for BRG1 function. Of the genes identified by Albini et al. as unique BRM targets, only about 20% were common with PFI-3 DEGs (Supplementary Figure S5B). These numbers show that more genes may be regulated by the BRG1 bromodomain as compared to the BRM counterpart during myoblast differentiation. Albini et al. also identified a set of genes that were coregulated by both BRG1 and BRM. About 32% of these upregulated targets and 16% of the downregulated targets were found in the corresponding list of differentially expressed genes due to PFI-3 induced bromodomain inhibition (Supplementary Figure S5B; Supplementary Table S9). This comparative analysis further confirms that both BRG1 and BRM bromodomains play a role in skeletal myogenesis.
PFI-3 inhibition of mSWI/SNF bromodomains decreased binding of BRG1 and BRM to target gene promoters
BRG1-containing mSWI/SNF complexes are recruited to regulatory regions of myogenic genes upon induction of muscle differentiation (25,26,29,30,92,93). This step is required to induce remodeling of chromatin at myogenic gene loci, thus allowing activation of muscle-specific gene expression.
We performed ChIP experiments to determine whether the occupancy of BRG1 was affected at the myogenic gene regulatory regions in response to bromodomain inhibition by PFI-3. As expected, BRG1 occupancy at myogenic regulatory regions increased as a function of differentiation in DMSO-treated samples (Figure 7A). However, BRG1 occupancy at the tested regulatory sequences was partly inhibited in PFI-3 treated cells. This loss of binding correlates with the decreased expression of these genes as seen in previous results (Figure 2). We also looked at binding of BRG1 and BRM on the regulatory regions of cyclin genes. It is known that in C2C12 myoblasts differentiated for 48h, BRM binding to the cyclin D1 gene promoter is crucial for its repression and cell-cycle exit (30). In that study, the authors showed that the expression of cyclin D1 was co-regulated by both BRG1 and BRM during the later stages of differentiation (30). Additionally, in MCF-7 cells, BRG1 has been shown to bind to cyclin D1 promoter and regulate its expression (94). BRG1- and BRM-containing mSWI/SNF complexes have been implicated previously in the repression of cyclins, thus contributing to the control of cell cycle progression (95–98). In PFI-3 treated C2C12 cells, chromatin IPs at the promoters of the cyclin A2, cyclin B1, cyclin D1 and cyclin D2 genes showed a decrease in occupancy of BRM and BRG1 (Figure 7B). The observed loss of binding correlated with increased expression of these genes in PFI-3 treated C2C12 cells (Figure 4D). These results show that the bromodomain function of BRG1 and BRM contributes to their binding at target gene promoters. We note that the differences observed in BRG1/BRM binding to the cyclin D1 promoter appear more dramatic than the changes in mRNA expression that were observed (Figure 4D). We attribute this to post-translational gene regulation of cyclin D1. We also note that BRG1 and BRM binding at cyclin E1 did not show significant change (Supplementary Figure S6A), despite PFI-3-mediated changes in cyclin E1 expression (Figure 4D). This result suggests that the effects of BRG1 and BRM on cyclin E1 gene expression are likely indirect.
Figure 7.

ChIP assays show decreased occupancy of BRG1 and BRM on regulatory regions of target genes upon PFI-3 treatment of C2C12 cells. (A) Bar plots for BRG1 occupancy on the myogenin promoter (Myog P), myosin heavy chain IIb promoter (MHCIIb P), muscle creatine kinase promoter (Ckm P), muscle creatine kinase enhancer (Ckm E), myosin light chain 1/3 promoter (Myl1/3 P), myosin light chain enhancers (Myl1/3 E and Myl1/3 dsE) are shown. (B) Bar plots for BRG1 and BRM occupancies on the cyclin A2, cyclin B1, cyclin D1 and cyclin D2 promoters. (C) Bar plots for BRG1 and BRM occupancies at a non-specific control genomic locus. The values have been normalized to an IgG control. ns, not significant, *P < 0.05, **P < 0.01 and ***P < 0.005 by Student's t-test.
Since bromodomains interact with acetylated histones, we also investigated the global levels of histone H3 and H4 acetylation in cells treated with DMSO or PFI-3. No changes in the levels of bulk acetylated H3 or H4 were observed (Supplementary Figure S6B). We also probed the levels of histone H3 and H4 acetylation marks on the regulatory regions of myogenic and cell cycle genes. Chromatin immunoprecipitation studies showed no change in the incorporation of acetyl-histone H3 and acetyl-histone H4 at these promoters (Figure 8). These results indicate that inhibition of bromodomain function by PFI-3 did not affect the levels of acetyl-H3 and acetyl-H4 on target gene promoters.
Figure 8.

ChIP assays show enrichment of acetyl-histone H3 and acetyl-histone H4 on regulatory regions of target genes upon PFI-3 treatment of C2C12 cells. (A) Bar plots for enrichment of H3Ac and H4Ac on the myogenin promoter (Myog P), myosin heavy chain IIb promoter (MHCIIb P), myosin light chain 1/3 promoter (Myl1/3 P), muscle creatine kinase promoter (Ckm P) are shown. (B) Bar plots for enrichment of H3Ac and H4Ac on the cyclin A2, cyclin B1, cyclin D1 and cyclin D2 promoters. (C) Bar plots for H3Ac and H4Ac enrichment at a non-specific control genomic locus. The values have been normalized to an IgG control. ns, not significant, *P < 0.05, **P < 0.01 and ***P < 0.005 by Student's t-test.
DISCUSSION
Bromodomain function in mSWI/SNF proteins
Bromodomains are a conserved structural motif found in only 46 human proteins, and they are classified into eight families (38). Bromodomains bind to acetylated lysines, which facilitates protein–protein interactions (37). The ability of bromodomains to target proteins to acetylated nucleosomes containing acetylated histones has been predicted to be a mechanism by which chromatin epigenetic modifications are read, thereby enabling translation of the histone mark via the bromodomain protein or via proteins associated with the bromodomain-containing protein (37,99,100). Family VIII bromodomains include the 6 bromodomains found in the N-terminal portion of the BAF180 protein, the bromodomains present in the BRG1 and BRM ATPases, and the bromodomain found in the histone lysine N-methyltransferase ASH1L (38).
Work to date on mSWI/SNF bromodomains has consisted of structural analyses (101–105), in vitro studies of bromodomain binding to histones, DNA and nucleosomes (102,105–109) and a limited number of functional analyses in higher eukaryotes (110,111). Of particular note, BRG1/BRM bromodomains have specific DNA binding properties that drive association of the proteins with nucleosomes (106,107).
In vivo, deletion of the bromodomain in Drosophila BRM, which is the only SWI/SNF ATPase in that organism, had no effect on developing or adult flies (112). In human cells, reconstitution of BRG1-deficient tumor cells with wildtype or mutant versions of BRG1 determined that sequences C-terminal to the ATPase domain, which includes the bromodomain, were not required for BRG1-mediated co-activation of transcription by the glucocorticoid receptor (113). Similarly, BRG1 containing a bromodomain mutation was capable of co-activating myocardin to promote smooth muscle-specific gene expression (114). However, the BRG1 bromodomain directly contributes to the ability of Repressor Element 1-silencing Transcription Factor (REST) to bind chromatin and repress target genes (115). Mutation of each of the six BAF180 bromodomains revealed that four of the six promoted tumor suppressor function, gene regulation, and chromatin affinity in clear cell renal cell carcinoma cells (116). Other work showed that the fourth bromodomain of BAF180 mediated interaction with acetylated p53, which promotes p53 binding to and transcriptional activation of its target promoters (117). Thus, the requirement for functional mSWI/SNF protein bromodomains is variable. It may be cell-type dependent as well. Here we demonstrate that the BRG1 and/or BRM bromodomains, but not the BAF180 bromodomains, contribute to myogenic differentiation in cell culture and in vivo during skeletal muscle regeneration following injury. Both BRG1 and BRM are required for myogenic differentiation; this work is the first to identify a contribution to myogenesis by any domain other than the ATPase domain. The work further supports the idea of context-dependent requirements for mSWI/SNF bromodomain functions.
BAF180 is dispensable for myogenesis
mSWI/SNF complexes are a family of enzyme complexes marked by diversity of subunit composition (6,11,118). Initial descriptions of mSWI/SNF complexes reported two separable biochemical fractions that showed ATP-dependent chromatin remodeling activity (8–10). These complexes have become known as BAF (BRG1/BRM-associated factors) and PBAF (Polybromo-associated BAF), the latter taking its name from the presence of the BAF180 protein that is specific to this complex. However, both BAF and PBAF complexes themselves are merely separable groups of complexes that contain both shared and unique subunits (119,120). A third family of complexes, called ncBAF (noncanonical BAF) was identified more recently (13,121).
Although there are many subtypes of functional mSWI/SNF complexes in the cell, all of them necessarily have at least one of the proteins from the family VIII bromodomains (122). BAF and ncBAF complexes contain either BRG1 or BRM, while PBAF complexes contain BRG1 and BAF180 (13). BAF180 has been implicated in DNA damage repair (123,124) and is also required for cardiac development (125,126); knockout in mice caused severe hypoplastic ventricle development and trophoblast placental defects (125). However, adult mice with BAF180 depletion were phenotypically normal except for a hematopoietic stem cell defect observed in aged mice (127). A recent paper showed that genetic depletion of BAF180 in brown adipose and skeletal muscle resulted in no developmental defects (128). Similarly, BAF180 shows tumor-suppressive properties in some but not all cancer cell lines (127,129–132). These findings are consistent with context-specific requirements for the BAF180 protein.
In our work, we used siRNA-mediated knockdown to show that BAF180 is dispensable for skeletal muscle differentiation. This suggests that the PBAF family of mSWI/SNF complexes are also dispensable in this differentiation program. Although there are many reports characterizing the requirement for mSWI/SNF complexes in myogenesis, focus has been limited to the two ATPase subunits, to BAF47/INI1, which is shared by BAF and PBAF complexes, and to the BAF60 subunit that is shared by all subfamilies of mSWI/SNF complexes (25–27,29–31,59,73,87,88,133–144). A prior report documented the binding of BAF250A to myogenic promoters (73), perhaps implicating BAF complexes as the relevant mSWI/SNF enzyme subfamily for myogenic differentiation, but the requirement for BAF250A was not evaluated. Nevertheless, a requirement for specialized complexes for specific gene regulation events is one of the main hypotheses for existence of diverse families of mSWI/SNF complexes.
BRG1 and BRM bromodomain function are implicated in the regulation of myogenic differentiation
BRG1 and BRM contribute to the activation of the myogenic gene expression program and BRM contributes to the cell cycle arrest of myoblasts that precedes differentiation (25–30,87). Inhibition of the mSWI/SNF bromodomains by PFI-3 recapitulated these findings, indicating that the bromodomains of BRG1 and BRM are needed to both regulate cell cycle exit and for the initiation of tissue-specific gene expression. RNA-seq analysis of PFI-3 treated cells provided evidence of global disruption of the regulation of cell cycle exit and the initiation of myogenic gene expression. A published RNA-seq study investigating the role of chromatin remodeling in skeletal myogenesis performed knockdown of BRG1 and evaluated gene expression at timepoints comparable with our study (89). Comparison of this dataset with ours identified a large overlapping subset of gene targets involved in cell cycle exit and myogenesis indicating that BRG1 bromodomain plays a crucial role in regulation of BRG1-dependent events in skeletal muscle differentiation.
Additionally, prior microarray-based studies of myogenic gene expression upon BRG1 and BRM knockdown also identified these processes as being BRG1- and BRM-dependent (30). Despite the differences in platforms, we integrated the two datasets. There was a considerably greater overlap between PFI-3 affected genes and genes mis-regulated by BRG1 knockdown than there was between PFI-3 affected genes and genes mis-regulated by BRM knockdown. This may suggest that a greater percentage of genes that require BRG1 are also dependent on the BRG1 bromodomain than is true for the set of genes that require BRM.
Regardless, our ChIP experiments demonstrated that bromodomain inhibition resulted in a decreased ability of BRG1 to bind to genes activated during the myogenic differentiation protocol and a decreased ability of BRG1 and BRM to bind to genes controlling cell cycle. The chromatin interacting properties of the BRG1 and BRM bromodomains therefore likely contribute to gene expression. The principles determining the variable requirements for BRG1, BRM and BAF180 bromodomains in different cellular contexts remain to be investigated. However, many of the mSWI/SNF subunits have additional domains that could promote chromatin interaction. For instance, BRG1 and BRM proteins have AT hooks, BAF180 and the BAF57 protein have an HMG box-like domain, the ARID1A/1B and ARID2 proteins have ARID domains that may mediate nucleic acid interactions, and BRD7 and BRD9 also have bromodomains that belong to different bromodomain families. The requirement for any of these domains may be dependent on the protein makeup of the particular mSWI/SNF complex and the presence or absence of these other domains. Such a scenario suggests that these largely non-sequence specific DNA-binding domains function in an additive or cooperative manner to help facilitate chromatin interactions and remodeling events. Additional characterization of the putative chromatin interactions domains in the context of differentiation will be necessary to determine whether they are required and act in concert to promote mSWI/SNF interaction with chromatin and function.
DATA AVAILABILITY
The data from this RNA-seq study has been deposited in NCBI’s Gene Expression Omnibus and are accessible through GEO accession number GSE151218.
Supplementary Material
ACKNOWLEDGEMENTS
We thank T Padilla-Benavides, S. Syed, C. Emerson, Jr., K. Daman and J. Yan for comments and suggestions on experimental design and on the manuscript.
Notes
Present address: Hanna Witwicka, Charles River Laboratories, Inc., Shrewsbury, MA 01545, USA.
Contributor Information
Tapan Sharma, Department of Biochemistry and Molecular Pharmacology, University of Massachusetts Medical School, Worcester, MA 01605, USA.
Daniel C L Robinson, Sprott Centre for Stem Cell Research, Regenerative Medicine Program, Ottawa Hospital Research Institute, University of Ottawa, Ottawa, ON K1H 8L6, Canada; Department of Cellular and Molecular Medicine, University of Ottawa, Ottawa, ON, Canada.
Hanna Witwicka, Department of Biochemistry and Molecular Pharmacology, University of Massachusetts Medical School, Worcester, MA 01605, USA.
F Jeffrey Dilworth, Sprott Centre for Stem Cell Research, Regenerative Medicine Program, Ottawa Hospital Research Institute, University of Ottawa, Ottawa, ON K1H 8L6, Canada; Department of Cellular and Molecular Medicine, University of Ottawa, Ottawa, ON, Canada.
Anthony N Imbalzano, Department of Biochemistry and Molecular Pharmacology, University of Massachusetts Medical School, Worcester, MA 01605, USA.
SUPPLEMENTARY DATA
Supplementary Data are available at NAR Online.
FUNDING
National Institues of Health (NIH) [GM56244, GM136393 to A.N.I.]; Canadian Institutes of Health Research (CIHR) [FDN-143330 to F.J.D.]. Funding for open access charge: NIH [GM136393].
Conflict of interest statement. None declared.
REFERENCES
- 1.Allshire R.C., Madhani H.D.. Ten principles of heterochromatin formation and function. Nat. Rev. Mol. Cell Biol. 2018; 19:229–244. [DOI] [PMC free article] [PubMed] [Google Scholar]
- 2.Janssen A., Colmenares S.U., Karpen G.H.. Heterochromatin: guardian of the genome. Annu. Rev. Cell Dev. Biol. 2018; 34:265–288. [DOI] [PubMed] [Google Scholar]
- 3.Hota S.K., Bruneau B.G.. ATP-dependent chromatin remodeling during mammalian development. Development. 2016; 143:2882–2897. [DOI] [PMC free article] [PubMed] [Google Scholar]
- 4.De La Serna I.L., Ohkawa Y., Imbalzano A.N.. Chromatin remodelling in mammalian differentiation: lessons from ATP-dependent remodellers. Nat. Rev. Genet. 2006; 7:461–473. [DOI] [PubMed] [Google Scholar]
- 5.Clapier C.R., Cairns B.R.. The biology of chromatin remodeling complexes. Annu. Rev. Biochem. 2009; 78:273–304. [DOI] [PubMed] [Google Scholar]
- 6.Hargreaves D.C., Crabtree G.R.. ATP-dependent chromatin remodeling: genetics, genomics and mechanisms. Cell Res. 2011; 21:396–420. [DOI] [PMC free article] [PubMed] [Google Scholar]
- 7.Wu J.I.Diverse functions of ATP-dependent chromatin remodeling complexes in development and cancer. Acta Biochim. Biophys. Sin. (Shanghai). 2012; 44:54–69. [DOI] [PubMed] [Google Scholar]
- 8.Kwon H., Imbalzano A.N., Khavari P.A., Kingston R.E., Green M.R.. Nucleosome disruption and enhancement of activator binding by a human SW1/SNF complex. Nature. 1994; 370:477–481. [DOI] [PubMed] [Google Scholar]
- 9.Imbalzano A.N., Kwon H., Green M.R., Kingston R.E.. Facilitated binding of TATA-binding protein to nucleosomal DNA. Nature. 1994; 370:481–485. [DOI] [PubMed] [Google Scholar]
- 10.Wang W., Côté J., Xue Y., Zhou S., Khavari P.A., Biggar S.R., Muchardt C., Kalpana G.V., Goff S.P., Yaniv M.et al.. Purification and biochemical heterogeneity of the mammalian SWI-SNF complex. EMBO J. 1996; 15:5370–5382. [PMC free article] [PubMed] [Google Scholar]
- 11.Wang W., Xue Y., Zhou S., Kuo A., Cairns B.R., Crabtree G.R.. Diversity and specialization of mammalian SWI/SNF complexes. Genes Dev. 1996; 10:2117–2130. [DOI] [PubMed] [Google Scholar]
- 12.Wu J.I., Lessard J., Olave I.A., Qiu Z., Ghosh A., Graef I.A., Crabtree G.R.. Regulation of dendritic development by neuron-specific chromatin remodeling complexes. Neuron. 2007; 56:94–108. [DOI] [PubMed] [Google Scholar]
- 13.Mashtalir N., D’avino A.R., Michel B.C., Cassel S.H., Ranish J.A., Kadoch Correspondence C.. Modular organization and assembly of SWI/SNF family chromatin remodeling complexes. Cell. 2018; 175:1272–1288. [DOI] [PMC free article] [PubMed] [Google Scholar]
- 14.Chal J., Pourquié O.. Making muscle: skeletal myogenesis in vivo and in vitro. Development. 2017; 144:2104–2122. [DOI] [PubMed] [Google Scholar]
- 15.Comai G., Tajbakhsh S.. Molecular and cellular regulation of skeletal myogenesis. Curr. Top. Dev. Biol. 2014; 110:1–73. [DOI] [PubMed] [Google Scholar]
- 16.Motohashi N., Asakura A.. Muscle satellite cell heterogeneity and self-renewal. Front. Cell Dev. Biol. 2014; 2:1. [DOI] [PMC free article] [PubMed] [Google Scholar]
- 17.Chang N.C., Rudnicki M.A.. Satellite cells: the architects of skeletal muscle. Curr. Top. Dev. Biol. 2014; 107:161–181. [DOI] [PubMed] [Google Scholar]
- 18.Sambasivan R., Tajbakhsh S.. Adult skeletal muscle stem cells. Results Probl. Cell Differ. 2015; 56:191–213. [DOI] [PubMed] [Google Scholar]
- 19.Hernández-Hernández J.M., García-González E.G., Brun C.E., Rudnicki M.A.. The myogenic regulatory factors, determinants of muscle development, cell identity and regeneration. Semin. Cell Dev. Biol. 2017; 72:10–18. [DOI] [PMC free article] [PubMed] [Google Scholar]
- 20.Moncaut N., Rigby P.W.J., Carvajal J.J.. Dial M(RF) for myogenesis. FEBS J. 2013; 280:3980–3990. [DOI] [PubMed] [Google Scholar]
- 21.Asfour H.A., Allouh M.Z., Said R.S.. Myogenic regulatory factors: The orchestrators of myogenesis after 30 years of discovery. Exp. Biol. Med. 2018; 243:118–128. [DOI] [PMC free article] [PubMed] [Google Scholar]
- 22.Blackwell T., Weintraub H.. Differences and similarities in DNA-binding preferences of MyoD and E2A protein complexes revealed by binding site selection. Science. 1990; 250:1104–1110. [DOI] [PubMed] [Google Scholar]
- 23.Taylor M.V., Hughes S.M.. Mef2 and the skeletal muscle differentiation program. Semin. Cell Dev. Biol. 2017; 72:33–44. [DOI] [PubMed] [Google Scholar]
- 24.Pon J.R., Marra M.A.. MEF2 transcription factors: Developmental regulators and emerging cancer genes. Oncotarget. 2016; 7:2297–2312. [DOI] [PMC free article] [PubMed] [Google Scholar]
- 25.de la Serna I.L., Ohkawa Y., Berkes C.a, Bergstrom D.a., Dacwag C.S., Tapscott S.J., Imbalzano A.N.. MyoD targets chromatin remodeling complexes to the myogenin locus prior to forming a stable DNA-bound complex. Mol. Cell. Biol. 2005; 25:3997–4009. [DOI] [PMC free article] [PubMed] [Google Scholar]
- 26.Ohkawa Y., Tachibana T., Imbalzano A.N., Yoshimura S., Higashi C., Marfella C.G.A., Dacwag C.S., Tachibana T., Imbalzano A.N.. Myogenin and the SWI /SNF ATPase Brg1 maintain myogenic gene expression at different stages of skeletal myogenesis. J. Biol. Chem. 2007; 282:6564–6570. [DOI] [PubMed] [Google Scholar]
- 27.Simone C., Forcales S.V., Hill D.A., Imbalzano A.N., Latella L., Puri P.L.. p38 pathway targets SWI-SNF chromatin-remodeling complex to muscle-specific loci. Nat. Genet. 2004; 36:738–743. [DOI] [PubMed] [Google Scholar]
- 28.Ohkawa Y., Marfella C.G.A., Imbalzano A.N.. Skeletal muscle specification by myogenin and Mef2D via the SWI/SNF ATPase Brg1. EMBO J. 2006; 25:490–501. [DOI] [PMC free article] [PubMed] [Google Scholar]
- 29.Forcales S.V., Albini S., Giordani L., Malecova B., Cignolo L., Chernov A., Coutinho P., Saccone V., Consalvi S., Williams R.et al.. Signal-dependent incorporation of MyoD-BAF60c into Brg1-based SWI/SNF chromatin-remodelling complex. EMBO J. 2012; 31:301–316. [DOI] [PMC free article] [PubMed] [Google Scholar]
- 30.Albini S., Toto P.C., Dall’agnese A., Malecova B., Cenciarelli C., Felsani A., Caruso M., Bultman S.J., Puri P.L. Brahma is required for cell cycle arrest and late muscle gene expression during skeletal myogenesis. EMBO Rep. 2015; 16:1037–1050. [DOI] [PMC free article] [PubMed] [Google Scholar]
- 31.de la Serna I.L., Roy K., Carlson K.A., Imbalzano A.N.. MyoD can induce cell cycle arrest but not muscle differentiation in the presence of dominant negative SWI/SNF chromatin remodeling enzymes. J. Biol. Chem. 2001; 276:41486–41491. [DOI] [PubMed] [Google Scholar]
- 32.Khavari P.A., Peterson C.L., Tamkunt J.W., Mendel D.B., Crabtree G.R.. BRG1 contains a conserved domain of the SWI2 /SNF2 family necessary for normal mitotic growth and transcription. Lett. to Nat. 1993; 366:170–174. [DOI] [PubMed] [Google Scholar]
- 33.Muchardt C., Yaniv M.. A human homologue of Saccharomyces cerevisiae SNF2/SWI2 and Drosophila brm genes potentiates transcriptional activation by the glucocorticoid receptor. EMBO J. 1993; 12:4279–4290. [DOI] [PMC free article] [PubMed] [Google Scholar]
- 34.Chiba H., Muramatsu1 M., Nomoto A., Kato H.. Two human homologues of Saccharomyces cerevisiae SWI2ISNF2 and Drosophila brahma are transcriptional coactivators cooperating with the estrogen receptor and the retinoic acid receptor. Nucleic Acids Res. 1994; 22:1815–1820. [DOI] [PMC free article] [PubMed] [Google Scholar]
- 35.Meslamani J., Smith S.G., Sanchez R., Zhou M.-M.. Structural features and inhibitors of bromodomains. Drug Discov. Today. Technol. 2016; 19:3–15. [DOI] [PMC free article] [PubMed] [Google Scholar]
- 36.Moustakim M., Clark P.G.K., Hay D.A., Dixon D.J., Brennan P.E.. Chemical probes and inhibitors of bromodomains outside the BET family. Medchemcomm. 2016; 7:2246–2264. [DOI] [PMC free article] [PubMed] [Google Scholar]
- 37.Fujisawa T., Filippakopoulos P.. Functions of bromodomain-containing proteins and their roles in homeostasis and cancer. Nat. Rev. Mol. Cell Biol. 2017; 18:246–262. [DOI] [PubMed] [Google Scholar]
- 38.Filippakopoulos P., Picaud S., Mangos M., Keates T., Lambert J.P., Barsyte-Lovejoy D., Felletar I., Volkmer R., Müller S., Pawson T.et al.. Histone recognition and large-scale structural analysis of the human bromodomain family. Cell. 2012; 149:214–231. [DOI] [PMC free article] [PubMed] [Google Scholar]
- 39.Xue Y., Canman J.C., Lee C.S., Nie Z., Yang D., Moreno G.T., Young M.K., Salmon E.D., Wang W.. The human SWI/SNF-B chromatin-remodeling complex is related to yeast Rsc and localizes at kinetochores of mitotic chromosomes. Proc. Natl. Acad. Sci. U.S.A. 2000; 97:13015–13020. [DOI] [PMC free article] [PubMed] [Google Scholar]
- 40.Fedorov O., Castex J., Tallant C., Owen D.R., Martin S., Aldeghi M., Monteiro O., Filippakopoulos P., Picaud S., Trzupek J.D.et al.. Selective targeting of the BRG/PB1 bromodomains impairs embryonic and trophoblast stem cell maintenance. Sci. Adv. 2015; 1:e1500723. [DOI] [PMC free article] [PubMed] [Google Scholar]
- 41.Fedorov O., Niesen F.H., Knapp S.. Kinase Inhibitor selectivity profiling using differential scanning fluorimetry. Methods Mol. Biol. 2012; 795:109–118. [DOI] [PubMed] [Google Scholar]
- 42.Gerstenberger B.S., Trzupek J.D., Tallant C., Fedorov O., Filippakopoulos P., Brennan P.E., Fedele V., Martin S., Picaud S., Rogers C.et al.. Identification of a chemical probe for family VIII Bromodomains through optimization of a fragment hit. J. Med. Chem. 2016; 59:4800–4811. [DOI] [PMC free article] [PubMed] [Google Scholar]
- 43.Baylin S.B., Jones P.A.. Epigenetic determinants of cancer. Cold Spring Harb. Perspect. Biol. 2016; 8:a019505. [DOI] [PMC free article] [PubMed] [Google Scholar]
- 44.Feinberg A.P., Tycko B.. The history of cancer epigenetics. Nat. Rev. Cancer. 2004; 4:143–153. [DOI] [PubMed] [Google Scholar]
- 45.Zaidi S.K., Van Wijnen A.J., Lian J.B., Stein J.L., Stein G.S.. Targeting deregulated epigenetic control in cancer. J. Cell. Physiol. 2013; 228:2103–2108. [DOI] [PMC free article] [PubMed] [Google Scholar]
- 46.Vangamudi B., Paul T.A., Shah P.K., Kost-Alimova M., Nottebaum L., Shi X., Zhan Y., Leo E., Mahadeshwar H.S., Protopopov A.et al.. The SMARCA2/4 ATPase domain surpasses the bromodomain as a drug target in SWI/SNF-Mutant cancers: Insights from cDNA rescue and PFI-3 inhibitor studies. Cancer Res. 2015; 75:3865–3878. [DOI] [PMC free article] [PubMed] [Google Scholar]
- 47.Wu Q., Sharma S., Cui H., LeBlanc S.E., Zhang H., Muthuswami R., Nickerson J.A., Imbalzano A.N.. Targeting the chromatin remodeling enzyme BRG1 increases the efficacy of chemotherapy drugs in breast cancer cells. Oncotarget. 2016; 7:27158–27175. [DOI] [PMC free article] [PubMed] [Google Scholar]
- 48.Ding Y., Li N., Dong B., Guo W., Wei H., Chen Q., Yuan H., Han Y., Chang H., Kan S.et al.. Chromatin remodeling ATPase BRG1 and PTEN are synthetic lethal in prostate cancer. J. Clin. Invest. 2019; 129:759–773. [DOI] [PMC free article] [PubMed] [Google Scholar]
- 49.Georgescu M.M.Pten tumor suppressor network in PI3K-Akt pathway control. Genes Cancer. 2010; 1:1170–1177. [DOI] [PMC free article] [PubMed] [Google Scholar]
- 50.Gillis N.E., Taber T.H., Bolf E.L., Beaudet C.M., Tomczak J.A., White J.H., Stein J.L., Stein G.S., Lian J.B., Frietze S.et al.. Thyroid hormone receptor β suppression of RUNX2 Is mediated by brahma-related gene 1–Dependent chromatin remodeling. Endocrinology. 2018; 159:2484–2494. [DOI] [PMC free article] [PubMed] [Google Scholar]
- 51.Li Z., Xia J., Fang M., Xu Y.. Epigenetic regulation of lung cancer cell proliferation and migration by the chromatin remodeling protein BRG1. Oncogenesis. 2019; 8:66. [DOI] [PMC free article] [PubMed] [Google Scholar]
- 52.Minderjahn J., Schmidt A., Fuchs A., Schill R., Raithel J., Babina M., Schmidl C., Gebhard C., Schmidhofer S., Mendes K.et al.. Mechanisms governing the pioneering and redistribution capabilities of the non-classical pioneer PU.1. Nat. Commun. 2020; 11:402. [DOI] [PMC free article] [PubMed] [Google Scholar]
- 53.Li H., Lan J., Han C., Guo K., Wang G., Hu J., Gong J., Luo X., Cao Z.. Brg1 promotes liver fibrosis via activation of hepatic stellate cells. Exp. Cell Res. 2018; 364:191–197. [DOI] [PubMed] [Google Scholar]
- 54.Li Z., Lv F., Dai C., Wang Q., Jiang C., Fang M., Xu Y.. Activation of Galectin-3 (LGALS3) transcription by injurious stimuli in the liver is commonly mediated by BRG1. Front. Cell Dev. Biol. 2019; 7:310. [DOI] [PMC free article] [PubMed] [Google Scholar]
- 55.Wang Z.-J., Martin J.A., Mueller L.E., Caccamise A., Werner C.T., Neve R.L., Gancarz A.M., Li J.-X., Dietz D.M.. BRG1 in the nucleus accumbens regulates cocaine-seeking behavior-supplementary info. Biol. Psychiatry. 2016; 80:652–660. [DOI] [PMC free article] [PubMed] [Google Scholar]
- 56.Ganguly D., Sims M., Cai C., Fan M., Pfeffer L.M.. Chromatin remodeling factor BRG1 regulates stemness and chemosensitivity of glioma initiating cells. Stem Cells. 2018; 36:1804–1815. [DOI] [PMC free article] [PubMed] [Google Scholar]
- 57.Güneş C., Paszkowski-Rogacz M., Rahmig S., Khattak S., Camgöz A., Wermke M., Dahl A., Bornhäuser M., Waskow C., Buchholz F.. Comparative RNAi screens in isogenic human stem cells reveal SMARCA4 as a differential regulator. Stem Cell Rep. 2019; 12:1084–1098. [DOI] [PMC free article] [PubMed] [Google Scholar]
- 58.de la Serna I.L., Carlson K.A., Hill D.A., Guidi C.J., Stephenson R.O., Sif S., Kingston R.E., Imbalzano A.N.. Mammalian SWI-SNF complexes contribute to activation of the hsp70 gene. Mol. Cell. Biol. 2000; 20:2839–2851. [DOI] [PMC free article] [PubMed] [Google Scholar]
- 59.Nasipak B.T., Padilla-Benavides T., Green K.M., Leszyk J.D., Mao W., Konda S., Sif S., Shaffer S.a., Ohkawa Y., Imbalzano A.N.. Opposing calcium-dependent signalling pathways control skeletal muscle differentiation by regulating a chromatin remodelling enzyme. Nat. Commun. 2015; 6:7441. [DOI] [PMC free article] [PubMed] [Google Scholar]
- 60.Metzinger L., Passaquin A.C., Warter J.M., Poindron P.. α-Methylprednisolone promotes skeletal myogenesis in dystrophin-deficient and control mouse cultures. Neurosci. Lett. 1993; 155:171–174. [DOI] [PubMed] [Google Scholar]
- 61.Abràmoff M.D., Magalhaes P.J., Ram S.J.. Image processing with imageJ. Biophotonics Int. 2004; 11:36–42. [Google Scholar]
- 62.Livak K.J., Schmittgen T.D.. Analysis of relative gene expression data using real-time quantitative PCR and the 2-ΔΔCT method. Methods. 2001; 25:402–408. [DOI] [PubMed] [Google Scholar]
- 63.Huang J., Liang X., Xuan Y., Geng C., Li Y., Lu H., Qu S., Mei X., Chen H., Yu T.et al.. A reference human genome dataset of the BGISEQ-500 sequencer. Gigascience. 2017; 6:1–9. [DOI] [PMC free article] [PubMed] [Google Scholar]
- 64.Kim D., Langmead B., Salzberg S.L.. HISAT: A fast spliced aligner with low memory requirements. Nat. Methods. 2015; 12:357–360. [DOI] [PMC free article] [PubMed] [Google Scholar]
- 65.Pertea M., Pertea G.M., Antonescu C.M., Chang T.C., Mendell J.T., Salzberg S.L.. StringTie enables improved reconstruction of a transcriptome from RNA-seq reads. Nat. Biotechnol. 2015; 33:290–295. [DOI] [PMC free article] [PubMed] [Google Scholar]
- 66.Trapnell C., Williams B.A., Pertea G., Mortazavi A., Kwan G., Van Baren M.J., Salzberg S.L., Wold B.J., Pachter L.. Transcript assembly and quantification by RNA-Seq reveals unannotated transcripts and isoform switching during cell differentiation. Nat. Biotechnol. 2010; 28:511–515. [DOI] [PMC free article] [PubMed] [Google Scholar]
- 67.Langmead B., Salzberg S.L.. Fast gapped-read alignment with Bowtie 2. Nat. Methods. 2012; 9:357–359. [DOI] [PMC free article] [PubMed] [Google Scholar]
- 68.Li B., Dewey C.N.. RSEM: accurate transcript quantification from RNA-Seq data with or without a reference genome Bo. BMC Bioinformatics. 2011; 12:323. [DOI] [PMC free article] [PubMed] [Google Scholar]
- 69.Love M.I., Huber W., Anders S.. Moderated estimation of fold change and dispersion for RNA-seq data with DESeq2. Genome Biol. 2014; 15:550. [DOI] [PMC free article] [PubMed] [Google Scholar]
- 70.Audic S., Claverie J.M.. The significance of digital gene expression profiles. Genome Res. 1997; 7:986–995. [DOI] [PubMed] [Google Scholar]
- 71.Wei Huang D., Sherman B.T., Lempicki R.A.. Bioinformatics enrichment tools: paths toward the comprehensive functional analysis of large gene lists. Nucleic Acids Res. 2008; 37:1–13. [DOI] [PMC free article] [PubMed] [Google Scholar]
- 72.Heinz S., Benner C., Spann N., Bertolino E., Lin Y.C., Laslo P., Cheng J.X., Murre C., Singh H., Glass C.K.. Simple combinations of lineage-determining transcription factors prime cis-regulatory elements required for macrophage and B cell identities. Mol. Cell. 2010; 38:576–589. [DOI] [PMC free article] [PubMed] [Google Scholar]
- 73.Witwicka H., Nogami J., Syed S.A., Maehara K., Padilla-Benavides T., Ohkawa Y., Imbalzano A.N.. Calcineurin broadly regulates the initiation of skeletal muscle-specific gene expression by binding target promoters and facilitating the interaction of the SWI/SNF chromatin remodeling enzyme. Mol. Cell. Biol. 2019; 39:e00063-19. [DOI] [PMC free article] [PubMed] [Google Scholar]
- 74.Le Moal E., Juban G., Bernard A.S., Varga T., Policar C., Chazaud B., Mounier R.. Macrophage-derived superoxide production and antioxidant response following skeletal muscle injury. Free Radic. Biol. Med. 2018; 120:33–40. [DOI] [PubMed] [Google Scholar]
- 75.Millay D.P., O’Rourke J.R., Sutherland L.B., Bezprozvannaya S., Shelton J.M., Bassel-Duby R., Olson E.N.. Myomaker is a membrane activator of myoblast fusion and muscle formation. Nature. 2013; 499:301–305. [DOI] [PMC free article] [PubMed] [Google Scholar]
- 76.Leikina E., Gamage D.G., Prasad V., Kozlov M.M., Chernomordik L.V, Millay Correspondence D.P., Goykhberg J., Crowe M., Diao J., Kozlov M.M.et al.. Myomaker and myomerger work independently to control distinct steps of membrane remodeling during myoblast fusion. Dev. Cell. 2018; 46:767–780. [DOI] [PMC free article] [PubMed] [Google Scholar]
- 77.Bi P., Ramirez-Martinez A., Li H., Cannavino J., McAnally J.R., Shelton J.M., Sánchez-Ortiz E., Bassel-Duby R., Olson E.N.. Control of muscle formation by the fusogenic micropeptide myomixer. Science. 2017; 356:323–327. [DOI] [PMC free article] [PubMed] [Google Scholar]
- 78.Zhang Q., Vashisht A.A., O’Rourke J., Corbel S.Y., Moran R., Romero A., Miraglia L., Zhang J., Durrant E., Schmedt C.et al.. The microprotein Minion controls cell fusion and muscle formation. Nat. Commun. 2017; 8:15664. [DOI] [PMC free article] [PubMed] [Google Scholar]
- 79.Ganassi M., Badodi S., Ortuste Quiroga H.P., Zammit P.S., Hinits Y., Hughes S.M.. Myogenin promotes myocyte fusion to balance fibre number and size. Nat. Commun. 2018; 9:4232. [DOI] [PMC free article] [PubMed] [Google Scholar]
- 80.Chen B., You W., Wang Y., Shan T.. The regulatory role of Myomaker and Myomixer–Myomerger–Minion in muscle development and regeneration. Cell. Mol. Life Sci. 2019; 77:1551–1569. [DOI] [PMC free article] [PubMed] [Google Scholar]
- 81.Müller H., Helin K.. The E2F transcription factors: key regulators of cell proliferation. Biochim. Biophys. Acta - Rev. Cancer. 2000; 1470:M1–M12. [DOI] [PubMed] [Google Scholar]
- 82.Helin K.Regulation of cell proliferation by the E2F transcription factors. Curr. Opin. Genet. Dev. 1998; 8:28–35. [DOI] [PubMed] [Google Scholar]
- 83.Dong J.T., Chen C.. Essential role of KLF5 transcription factor in cell proliferation and differentiation and its implications for human diseases. Cell. Mol. Life Sci. 2009; 66:2691–2706. [DOI] [PMC free article] [PubMed] [Google Scholar]
- 84.Soufi A., Dalton S.. Cycling through developmental decisions: how cell cycle dynamics control pluripotency, differentiation and reprogramming. Dev. 2016; 143:4301–4311. [DOI] [PMC free article] [PubMed] [Google Scholar]
- 85.Id Y.M., Mckay Id D.J., Buttitta Id L.. Changes in chromatin accessibility ensure robust cell cycle exit in terminally differentiated cells. PLoS Biol. 2019; 17:e3000378. [DOI] [PMC free article] [PubMed] [Google Scholar]
- 86.Politis P.K., Thomaidou D., Matsas R.. Coordination of cell cycle exit and differentiation of neuronal progenitors. Cell Cycle. 2008; 7:691–697. [DOI] [PubMed] [Google Scholar]
- 87.de la Serna I.L., Carlson K.A., Imbalzano A.N.. Mammalian SWI/SNF complexes promote MyoD-mediated muscle differentiation. Nat. Genet. 2001; 27:187–190. [DOI] [PubMed] [Google Scholar]
- 88.Roy K., de la Serna I.L., Imbalzano A.N.. The myogenic basic helix-loop-helix family of transcription factors shows similar requirements for SWI/SNF chromatin remodeling enzymes during muscle differentiation in culture. J. Biol. Chem. 2002; 277:33818–33824. [DOI] [PubMed] [Google Scholar]
- 89.Zhu X., Lan B., Yi X., He C., Dang L., Zhou X., Lu Y., Sun Y., Liu Z., Bai X.et al.. HRP2-DPF3a-BAF complex coordinates histone modification and chromatin remodeling to regulate myogenic gene transcription. Nucleic Acids Res. 2020; 48:6563–6582. [DOI] [PMC free article] [PubMed] [Google Scholar]
- 90.Barutcu A.R., Lajoie B.R., Fritz A.J., McCord R.P., Nickerson J.A., Van Wijnen A.J., Lian J.B., Stein J.L., Dekker J., Stein G.S.et al.. SMARCA4 regulates gene expression and higherorder chromatin structure in proliferating mammary epithelial cells. Genome Res. 2016; 26:1188–1201. [DOI] [PMC free article] [PubMed] [Google Scholar]
- 91.Wu Q., Madany P., Dobson J.R., Schnabl J.M., Sharma S., Smith T.C., van Wijnen A.J., Stein J.L., Lian J.B., Stein G.S.et al.. The BRG1 chromatin remodeling enzyme links cancer cell metabolism and proliferation. Oncotarget. 2016; 7:38270–38281. [DOI] [PMC free article] [PubMed] [Google Scholar]
- 92.Harada A., Okada S., Konno D., Odawara J., Yoshimi T., Yoshimura S., Kumamaru H., Saiwai H., Tsubota T., Kurumizaka H.et al.. Chd2 interacts with H3.3 to determine myogenic cell fate. EMBO J. 2012; 31:2994–3007. [DOI] [PMC free article] [PubMed] [Google Scholar]
- 93.Ohkawa Y., Mallappa C., Vallaster C.S.D., Imbalzano A.N.. Isolation of nuclei from skeletal muscle satellite cells and myofibers for use in chromatin immunoprecipitation assays. Methods Mol. Biol. 2012; 798:517–530. [DOI] [PMC free article] [PubMed] [Google Scholar]
- 94.Rao M., Casimiro M.C., Lisanti M.P., Amico M.D., Wang C., Shirley L.A., Leader J.E., Liu M., Stallcup M., Engel D.A.et al.. Inhibition of cyclin D1 gene transcription by Brg-1. Cell Cycle. 2008; 7:647–655. [DOI] [PubMed] [Google Scholar]
- 95.Zhang H.S., Gavin M., Dahiya A., Postigo A.A., Ma D., Luo R.X., Harbour J.W., Dean D.C.. Exit from G1 and S phase of the cell cycle is regulated by repressor complexes containing HDAC-Rb-hSWI/SNF and RB-hSWI/SNF. Cell. 2000; 101:79–89. [DOI] [PubMed] [Google Scholar]
- 96.Reyes J.C., Barra J., Muchardt C., Camus A., Babinet C., Yaniv M.. Altered control of cellular proliferation in the absence of mammalian brahma (SNF2α). EMBO J. 1998; 17:6979–6991. [DOI] [PMC free article] [PubMed] [Google Scholar]
- 97.Muchardt C., Yaniv M.. When the SWI/SNF complex remodels … the cell cycle. Oncogene. 2001; 20:3067–3075. [DOI] [PubMed] [Google Scholar]
- 98.Strobeck M.W., Knudsen K.E., Fribourg A.F., DeCristofaro M.F., Weissman B.E., Imbalzano A.N., Knudsen E.S.. BRG-1 is required for RB-mediated cell cycle arrest. Proc. Natl. Acad. Sci. U.S.A. 2000; 97:7748–7753. [DOI] [PMC free article] [PubMed] [Google Scholar]
- 99.Haynes S.R., Dollard C., Winston F., Beck S., Trowsdale J., Dawid I.B.. The bromodomain: a conserved sequence found in human, Drosophila and yeast proteins. Nucleic Acids Res. 1992; 20:246–257. [DOI] [PMC free article] [PubMed] [Google Scholar]
- 100.Dhalluin C., Carlson J.E., Zeng L., He C., Aggarwal A.K., Zhou M.M.. Structure and ligand of a histone acetyltransferase bromodomain. Nature. 1999; 399:491–496. [DOI] [PubMed] [Google Scholar]
- 101.Singh M., Popowicz G.M., Krajewski M., Holak T.A.. Structural ramification for acetyl-lysine recognition by the bromodomain of human BRG1 protein, a central ATPase of the SWI/SNF remodeling complex. Chem. Bio. Chem. 2007; 8:1308–1316. [DOI] [PubMed] [Google Scholar]
- 102.Singh M., D’Silva L., Holak T.A.. DNA-binding properties of the recombinant high-mobility-group-like AT-hook-containing region from human BRG1 protein. Biol. Chem. 2006; 387:1469–1478. [DOI] [PubMed] [Google Scholar]
- 103.Chandrasekaran R., Thompson M.. Polybromo-1-bromodomains bind histone H3 at specific acetyl-lysine positions. Biochem. Biophys. Res. Commun. 2007; 355:661–666. [DOI] [PubMed] [Google Scholar]
- 104.Shen W., Xu C., Huang W., Zhang J., Carlson J.E., Tu X., Wu J., Shi Y.. Solution structure of human Brg1 bromodomain and its specific binding to acetylated histone tails. Biochemistry. 2007; 46:2100–2110. [DOI] [PubMed] [Google Scholar]
- 105.Charlop-Powers Z., Zeng L., Zhang Q., Zhou M.M.. Structural insights into selective histone H3 recognition by the human Polybromo bromodomain 2. Cell Res. 2010; 20:529–538. [DOI] [PMC free article] [PubMed] [Google Scholar]
- 106.Liao L., Alicea-Velázquez N.L., Langbein L., Niu X., Cai W., Cho E.A., Zhang M., Greer C.B., Yan Q., Cosgrove M.S.et al.. High affinity binding of H3K14ac through collaboration of bromodomains 2, 4 and 5 is critical for the molecular and tumor suppressor functions of PBRM1. Mol. Oncol. 2019; 13:811–828. [DOI] [PMC free article] [PubMed] [Google Scholar]
- 107.Sanchez J.C., Zhang L., Evoli S., Schnicker N.J., Nunez-Hernandez M., Yu L., Wereszczynski J., Pufall M.A., Musselman C.A.. The molecular basis of selective DNA binding by the BRG1 AT-hook and bromodomain. Biochim. Biophys. Acta - Gene Regul. Mech. 2020; 1863:194566. [DOI] [PMC free article] [PubMed] [Google Scholar]
- 108.Morrison E.A., Sanchez J.C., Ronan J.L., Farrell D.P., Varzavand K., Johnson J.K., Gu B.X., Crabtree G.R., Musselman C.A.. DNA binding drives the association of BRG1/hBRM bromodomains with nucleosomes. Nat. Commun. 2017; 8:16080. [DOI] [PMC free article] [PubMed] [Google Scholar]
- 109.Slaughter M.J., Shanle E.K., McFadden A.W., Hollis E.S., Suttle L.E., Strahl B.D., Davis I.J.. PBRM1 bromodomains variably influence nucleosome interactions and cellular function. J. Biol. Chem. 2018; 293:13592–13603. [DOI] [PMC free article] [PubMed] [Google Scholar]
- 110.Wang X., Wang S., Troisi E.C., Howard T.P., Haswell J.R., Wolf B.K., Hawk W.H., Ramos P., Oberlick E.M., Tzvetkov E.P.et al.. BRD9 defines a SWI/SNF sub-complex and constitutes a specific vulnerability in malignant rhabdoid tumors. Nat. Commun. 2019; 10:1881. [DOI] [PMC free article] [PubMed] [Google Scholar]
- 111.Dutta A., Gogol M., Kim J.H., Smolle M., Venkatesh S., Gilmore J., Florens L., Washburn M.P., Workman J.L.. Swi/Snf dynamics on stress-responsive genes is governed by competitive bromodomain interactions. Genes Dev. 2014; 28:2314–2330. [DOI] [PMC free article] [PubMed] [Google Scholar]
- 112.Elfring L.K., Daniel C., Papoulas O., Deuring R., Sarte M., Moseley S., Beek S.J., Ross Waldrip W., Daubresse G., Depace A.et al.. Genetic analysis of brahma: The drosophila homolog of the yeast chromatin remodeling factor SWI2/SNF2. Genetics. 1998; 148:251–265. [DOI] [PMC free article] [PubMed] [Google Scholar]
- 113.Trotter K.W., Fan H.-Y., Ivey M.L., Kingston R.E., Archer T.K.. The HSA domain of BRG1 mediates critical interactions required for glucocorticoid receptor-dependent transcriptional activation in vivo. Mol. Cell. Biol. 2008; 28:1413–1426. [DOI] [PMC free article] [PubMed] [Google Scholar]
- 114.Zhou J., Zhang M., Fang H., El-Mounayri O., Rodenberg J.M., Imbalzano A.N., Herring B.P.. The SWI/SNF chromatin remodeling complex regulates myocardin-induced smooth muscle-specific gene expression. Arterioscler. Thromb. Vasc. Biol. 2009; 29:921–928. [DOI] [PMC free article] [PubMed] [Google Scholar]
- 115.Ooi L., Belyaev N.D., Miyake K., Wood I.C., Buckley N.J.. BRG1 chromatin remodeling activity is required for efficient chromatin binding by repressor element 1-silencing transcription factor (REST) and facilitates REST-mediated repression. J. Biol. Chem. 2006; 281:38974–38980. [DOI] [PMC free article] [PubMed] [Google Scholar]
- 116.Porter E.G., Dykhuizen E.C.. Individual bromodomains of Polybromo-1 contribute to chromatin association and tumor suppression in clear cell renal carcinoma. J. Biol. Chem. 2017; 292:2601–2610. [DOI] [PMC free article] [PubMed] [Google Scholar]
- 117.Cai W., Su L., Liao L., Liu Z.Z., Langbein L., Dulaimi E., Testa J.R., Uzzo R.G., Zhong Z., Jiang W.et al.. PBRM1 acts as a p53 lysine-acetylation reader to suppress renal tumor growth. Nat. Commun. 2019; 10:5800. [DOI] [PMC free article] [PubMed] [Google Scholar]
- 118.Kadoch C., Crabtree G.R.. Mammalian SWI/SNF chromatin remodeling complexes and cancer: Mechanistic insights gained from human genomics. Sci. Adv. 2015; 1:e1500447. [DOI] [PMC free article] [PubMed] [Google Scholar]
- 119.Pulice J.L., Kadoch C.. Composition and function of mammalian SWI/SNF chromatin remodeling complexes in human disease. Cold Spring Harb. Symp. Quant. Biol. 2016; 81:53–60. [DOI] [PubMed] [Google Scholar]
- 120.Hodges C., Kirkland J.G., Crabtree G.R.. The many roles of BAF (mSWI/SNF) and PBAF complexes in cancer. Cold Spring Harb. Perspect. Med. 2016; 6:a026930. [DOI] [PMC free article] [PubMed] [Google Scholar]
- 121.Michel B.C., D’Avino A.R., Cassel S.H., Mashtalir N., McKenzie Z.M., McBride M.J., Valencia A.M., Zhou Q., Bocker M., Soares L.M.M.et al.. A non-canonical SWI/SNF complex is a synthetic lethal target in cancers driven by BAF complex perturbation. Nat. Cell Biol. 2018; 20:1410–1420. [DOI] [PMC free article] [PubMed] [Google Scholar]
- 122.Tang L., Nogales E., Ciferri C.. Structure and function of SWI/SNF chromatin remodeling complexes and mechanistic implications for transcription. Prog. Biophys. Mol. Biol. 2010; 102:122–128. [DOI] [PMC free article] [PubMed] [Google Scholar]
- 123.Brownlee P.M., Chambers A.L., Cloney R., Bianchi A., Downs J.A.. BAF180 promotes cohesion and prevents genome instability and aneuploidy. Cell Rep. 2014; 6:973–981. [DOI] [PMC free article] [PubMed] [Google Scholar]
- 124.Kakarougkas A., Ismail A., Chambers A.L., Riballo E., Herbert A.D., Künzel J., Löbrich M., Jeggo P.A., Downs J.A.. Requirement for PBAF in transcriptional repression and repair at DNA breaks in actively transcribed regions of chromatin. Mol. Cell. 2014; 55:723–732. [DOI] [PMC free article] [PubMed] [Google Scholar]
- 125.Wang Z., Zhai W., Richardson J.A., Olson E.N., Meneses J.J., Firpo M.T., Kang C., Skarnes W.C., Tjian R.. Polybromo protein BAF180 functions in mammalian cardiac chamber maturation. Genes Dev. 2004; 18:3106–3116. [DOI] [PMC free article] [PubMed] [Google Scholar]
- 126.Huang X., Gao X., Diaz-Trelles R., Ruiz-Lozano P., Wang Z.. Coronary development is regulated by ATP-dependent SWI/SNF chromatin remodeling component BAF180. Dev. Biol. 2008; 319:258–266. [DOI] [PubMed] [Google Scholar]
- 127.Lee H., Dai F., Zhuang L., Xiao Z.D., Kim J., Zhang Y., Ma L., You M.J., Wang Z., Gan B.. BAF180 regulates cellular senescence and hematopoietic stem cell homeostasis through p21. Oncotarget. 2016; 7:19134–19146. [DOI] [PMC free article] [PubMed] [Google Scholar]
- 128.Park Y.K., Lee J.E., Yan Z., McKernan K., O’Haren T., Wang W., Peng W., Ge K.. Interplay of BAF and MLL4 promotes cell type-specific enhancer activation. Nat. Commun. 2021; 12:1630. [DOI] [PMC free article] [PubMed] [Google Scholar]
- 129.Chowdhury B., Porter E.G., Stewart J.C., Ferreira C.R., Schipma M.J., Dykhuizen E.C.. PBRM1 regulates the expression of genes involved in metabolism and cell adhesion in renal clear cell carcinoma. PLoS One. 2016; 11:e0153718. [DOI] [PMC free article] [PubMed] [Google Scholar]
- 130.Huang L., Peng Y., Zhong G., Xie W., Dong W., Wang B., Chen X., Gu P., He W., Wu S.et al.. PBRM1 suppresses bladder cancer by cyclin B1 induced cell cycle arrest. Oncotarget. 2015; 6:16366–16378. [DOI] [PMC free article] [PubMed] [Google Scholar]
- 131.Xia W., Nagase S., Montia A.G., Kalachikov S.M., Keniry M., Su T., Memeo L., Hibshoosh H., Parsons R.. BAF180 is a critical regulator of p21 induction and a tumor suppressor mutated in breast cancer. Cancer Res. 2008; 68:1667–1674. [DOI] [PMC free article] [PubMed] [Google Scholar]
- 132.Gao W., Li W., Xiao T., Liu X.S., Kaelin W.G.. Inactivation of the PBRM1 tumor suppressor gene amplifies the HIF-response in VHL-/- clear cell renal carcinoma. Proc. Natl. Acad. Sci. U.S.A. 2017; 114:1027–1032. [DOI] [PMC free article] [PubMed] [Google Scholar]
- 133.Ohkawa Y., Imbalzano A.N.. Skeletal muscle specification by myogenin. EMBO J. 2006; 25:490–501. [DOI] [PMC free article] [PubMed] [Google Scholar]
- 134.Mallappa C., Nasipak B.T., Etheridge L., Androphy E.J., Jones S.N., Sagerstro C.G., Ohkawa Y., Imbalzano A.N.. Myogenic MicroRNA expression requires ATP-dependent chromatin remodeling enzyme function. Mol. Cell. Biol. 2010; 30:3176–3186. [DOI] [PMC free article] [PubMed] [Google Scholar]
- 135.Albini S., Coutinho P., Malecova B., Giordani L., Savchenko A., Forcales S.V., Puri P.L.. Epigenetic reprogramming of human embryonic stem cells into skeletal muscle cells and generation of contractile myospheres. Cell Rep. 2013; 3:661–670. [DOI] [PMC free article] [PubMed] [Google Scholar]
- 136.Padilla-Benavides T., Nasipak B.T., Imbalzano A.N.. Brg1 controls the expression of Pax7 to promote viability and proliferation of mouse primary myoblasts. J. Cell. Physiol. 2015; 230:2990–2997. [DOI] [PMC free article] [PubMed] [Google Scholar]
- 137.Ochi H., Hans S., Westerfield M.. Smarcd3 regulates the timing of zebrafish myogenesis onset. J. Biol. Chem. 2008; 283:3529–3536. [DOI] [PubMed] [Google Scholar]
- 138.Lickert H., Takeuchi J.K., Von Both I., Walls J.R., McAuliffe F., Adamson S.L., Henkelman R.M., Wrana J.L., Rossant J., Bruneau B.G.. Baf60c is essential for function of BAF chromatin remodelling complexes in heart development. Nature. 2004; 432:107–112. [DOI] [PubMed] [Google Scholar]
- 139.Harada A., Mallappa C., Okada S., Butler J.T., Baker S.P., Lawrence J.B., Ohkawa Y., Imbalzano A.N.. Spatial re-organization of myogenic regulatory sequences temporally controls gene expression. Nucleic Acids Res. 2015; 43:2008–2021. [DOI] [PMC free article] [PubMed] [Google Scholar]
- 140.Padilla-Benavides T., Nasipak B.T., Paskavitz A.L., Haokip D.T., Schnabl J.M., Nickerson J.A., Imbalzano A.N.. Casein kinase 2-mediated phosphorylation of Brahma-related gene 1 controls myoblast proliferation and contributes to SWI/SNF complex composition. J. Biol. Chem. 2017; 292:18592–18607. [DOI] [PMC free article] [PubMed] [Google Scholar]
- 141.Padilla-Benavides T., Haokip D.T., Yoon Y., Reyes-Gutierrez P., Rivera-Pérez J.A., Imbalzano A.N.. CK2-Dependent phosphorylation of the Brg1 chromatin remodeling enzyme occurs during mitosis. Int. J. Mol. Sci. 2020; 21:923. [DOI] [PMC free article] [PubMed] [Google Scholar]
- 142.Giacinti C., Bagella L., Puri P.L., Giordano A., Simone C.. MyoD recruits the cdk9/cyclin T2 complex on myogenic-genes regulatory regions. J. Cell. Physiol. 2006; 206:807–813. [DOI] [PubMed] [Google Scholar]
- 143.Joliot V., Ait-Mohamed O., Battisti V., Pontis J., Philipot O., Robin P., Ito H., Ait-Si-Ali S.. The SWI/SNF Subunit/Tumor suppressor BAF47/INI1 Is essential in cell cycle arrest upon skeletal muscle terminal differentiation. PLoS One. 2014; 9:e108858. [DOI] [PMC free article] [PubMed] [Google Scholar]
- 144.Serra C., Palacios D., Mozzetta C., Forcales S.V., Morantte I., Ripani M., Jones D.R., Du K., Jhala U.S., Simone C.et al.. Functional interdependence at the chromatin level between the MKK6/p38 and IGF1/PI3K/AKT pathways during muscle differentiation. Mol. Cell. 2007; 28:200–213. [DOI] [PMC free article] [PubMed] [Google Scholar]
Associated Data
This section collects any data citations, data availability statements, or supplementary materials included in this article.
Supplementary Materials
Data Availability Statement
The data from this RNA-seq study has been deposited in NCBI’s Gene Expression Omnibus and are accessible through GEO accession number GSE151218.