

ABSTRACT
Antimicrobial resistance (particularly through extended-spectrum β-lactamase and aminoglycoside-modifying enzyme production) in neonatal sepsis is a global problem, particularly in low- and middle-income countries, with significant mortality rates. High rates of resistance are reported for the current WHO-recommended first-line antibiotic regimen for neonatal sepsis, i.e., ampicillin and gentamicin. We assessed the utility of fosfomycin and amikacin as a potential alternative regimen to be used in settings of increasingly prevalent antimicrobial resistance. The combination was studied in a 16-arm dose-ranged hollow-fiber infection model (HFIM) experiment. The combination of amikacin and fosfomycin enhanced bactericidal activity and prevented the emergence of resistance, compared to monotherapy with either antibiotic. Modeling of the experimental quantitative outputs and data from checkerboard assays indicated synergy. We further assessed the combination regimen at clinically relevant doses in the HFIM with nine Enterobacterales strains with high fosfomycin and amikacin MICs and demonstrated successful kill to sterilization for 6/9 strains. From these data, we propose a novel combination breakpoint threshold for microbiological success for this antimicrobial combination against Enterobacterales strains, i.e., MICF × MICA < 256 (where MICF and MICA are the fosfomycin and amikacin MICs, respectively). Monte Carlo simulations predict that a standard fosfomycin-amikacin neonatal regimen would achieve >99% probability of pharmacodynamic success for strains with MICs below this threshold. We conclude that the combination of fosfomycin with amikacin is a viable regimen for the empirical treatment of neonatal sepsis and is suitable for further clinical assessment in a randomized controlled trial.
KEYWORDS: amikacin, combination antibiotics, fosfomycin, hollow fiber, mathematical modelling, neonatal sepsis, synergy, aminoglycosides, antimicrobial resistance, pharmacodynamics
TEXT
Neonatal sepsis is a common condition with a high mortality rate (1). Leading causative pathogens are both Gram-negative (e.g., Escherichia coli and Klebsiella pneumoniae) and Gram-positive (e.g., Staphylococcus aureus and Streptococcus agalactiae [group B streptococci [GBS]]) organisms (1). Neonatal sepsis accounts for an estimated 430,000 to 680,000 deaths annually, with the highest mortality rates in low- and middle-income countries (LMICs) (2, 3). The World Health Organization (WHO) currently recommends a narrow-spectrum β-lactam agent (e.g., amoxicillin or penicillin G) in combination with gentamicin as the first-line empirical regimen to treat neonatal sepsis (4, 5). This regimen has an acceptable safety profile, is active against common causative wild-type organisms, is inexpensive, and is feasible to administer. However, clinical efficacy is increasingly compromised by the rise of antimicrobial resistance (AMR).
Multiple epidemiological studies of neonatal sepsis have demonstrated significant levels of drug resistance, particularly to β-lactams and gentamicin (6–12), with a variety of increasingly prevalent resistance mechanisms such as extended-spectrum β-lactamases (ESBLs) and aminoglycoside-modifying enzymes (AMEs). In hospital settings, rates of resistance of Gram-negative bacteria causing neonatal sepsis to amoxicillin and gentamicin are approximately 80% and 60%, respectively, with some regional variation (6–12). Alternative options are urgently required for the treatment of neonatal sepsis caused by multidrug-resistant (MDR) and extremely drug resistant bacteria, suitable for use in LMIC settings.
A potential replacement regimen would need to provide a spectrum of activity against the commonly encountered pathogens and resistance motifs. Additionally, if the regimen were a combination of two agents, then a favorable pharmacodynamic (PD) interaction would be beneficial. Antimicrobial interactions can be defined by several metrics and definitions (13). However, the interaction model described by Greco et al., based on Loewe additivity (14, 15), allows determination and quantification of any interaction with precision and without arbitrary thresholds for determining the nature of interaction.
Amikacin and fosfomycin have several attributes that make them potential candidates for use in neonatal sepsis. They are off patent with a neonatal license, have an acceptable safety profile with limited toxicities (16, 17), and have efficacy against commonly encountered MDR pathogens. Therefore, we studied the potential utility of this combination for neonatal sepsis by assessing in vitro activity and the nature and extent of any PD interactions using checkerboard assays and a hollow-fiber infection model (HFIM), and we defined candidate combination regimens suitable for further clinical study.
RESULTS
In vitro susceptibility testing.
A panel of 40 strains of bacterial species was assembled to give a representative range of bacteria that cause neonatal sepsis in a LMIC setting, with a majority of strains harboring relevant resistance motifs for geographic regions of interest; these included 10 methicillin-resistant Staphylococcus aureus (MRSA) strains, 10 E. coli strains and 10 K. pneumoniae strains (all ESBL or carbapenemase producers), and 10 wild-type S. agalactiae strains (see Table S1 in the supplemental material). The MIC distributions for fosfomycin and amikacin against this panel of strains are shown in Table S2. The modal amikacin MIC was 2 to 4 mg/liter (excluding the intrinsically resistant S. agalactiae strains, which were inhibited by a modal MIC of >32 mg/liter); the modal fosfomycin MIC was 2 mg/liter (excluding the K. pneumoniae strains, which had a modal MIC of >32mg/liter, likely due to a high incidence of chromosomal FosA [18]).
In vitro drug-drug interaction modeling.
Checkerboard assays were performed on a selection of the strains in the neonatal sepsis panel (n = 16). These strains were selected on the basis of having MICs of >0.0625 mg/liter and <32 mg/liter for fosfomycin and amikacin. An interaction model originally developed by Greco et al. (14) was fitted to the data set to estimate a PD interaction parameter, α, for each strain (Fig. 1). Values of α for the interaction of two agents are interpreted as follows: a lower bound of the 95% confidence interval (CI) of α of >0 indicates a synergistic interaction, an upper bound of the 95% CI of α of <0 indicates an antagonistic interaction, and a 95% CI containing 0 indicates no evidence of interaction, i.e., simple additivity (14). A total of 9/16 individual strains had CIs of >0 (and therefore demonstrated synergy); the remaining 7/16 strains had CIs containing 0 (and therefore demonstrated no evidence of interaction). When the α value outputs of the models fitted to each strain were combined in a meta-analysis, the combined α interaction value was 0.1705 (95% CI, 0.0811 to 0.2599), with low interstrain heterogeneity (I2 = 30.7%, P = 0.383), indicating a synergistic effect observed across all species/strains tested.
FIG 1.
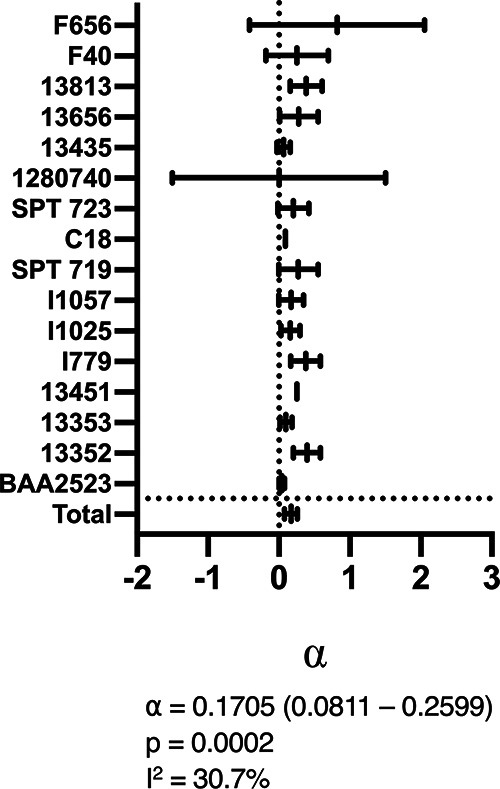
Modeled output for checkerboard assays with three antimicrobial combinations against 16 isolates, with a combined total statistic for each combination. α is the interaction parameter in the Greco model indicating the level of synergy. A CI of >0 indicates the presence of synergy, a CI of <0 indicates antagonism, and a CI containing 0 indicates no interaction, with additive effects only. α and P values for combined statistics are given below the graph. I2 represents the heterogeneity in effect between individual strains.
PD interaction of fosfomycin and amikacin using neonatal PK.
To determine the nature and magnitude of the PD interaction between fosfomycin and amikacin using neonatal concentration-time profiles, a HFIM was used (Fig. S1) using the E. coli ST195 strain, a CTX-M-14 producer from Laos (amikacin MIC, 4 mg/liter; fosfomycin MIC, 1 mg/liter) (19). These experiments were conducted following preliminary dose-finding experiments with each drug alone to define informative parts of the drug exposure-response and drug exposure-emergence of resistance relationships. For fosfomycin, the 20% effective concentration (EC20), EC50, and EC80 for bactericidal effects were achieved with area under the concentration-time curve from 0 to 24 h for the free drug fraction (fAUC0–24) values of 25, 200, and 400 mg · h/liter, respectively. For amikacin, the EC20, EC50, and EC80 were achieved with fAUC0–24 values of 50, 200, and 380 mg · h/liter, respectively.
The PD of the fosfomycin-amikacin combination were determined in a 16-arm 4 × 4 experiment that included no-treatment controls, each drug alone at the three doses, and an interaction matrix of all two-drug dose combinations, as shown in Fig. 2. When administered alone, increasing fosfomycin exposures resulted in profound early bacterial killing. However, failure to achieve sterility led to rapid regrowth, with emergence of a resistant clone (or clones) with fosfomycin MICs of ≥128 mg/liter, with maximal emergent resistance at fAUC0–24 values of 50 and 200 mg · h/liter (Fig. 2, 1 to 4). Similarly, progressively increasing exposures of amikacin as monotherapy led to initial suppression of logarithmic growth with subsequent exposure-dependent emergence of a resistant subpopulation with amikacin MICs of ≥16 mg/liter, with maximal emergent resistance at an fAUC0–24 value of 380 mg · h/liter (Fig. 2, 1, 5, 9, and 13).
FIG 2.

PD output of the 16-arm fosfomycin-amikacin combination HFIM experiment, with the indicated fAUC0–24 values for each arm. The gray symbol in arm 15 was a real data point in the initial experiment but was not reproducible in repeat experiments. It is presented here for completeness but was not included in the modeling.
In combination, fosfomycin and amikacin achieved a greater magnitude of initial bacterial kill, with delayed and reduced emergence of resistance to fosfomycin and amikacin, compared with equivalent drug exposures in monotherapy. Higher combination exposures achieved sterility. The relationship between drug exposure and the emergence of resistance with each drug administered alone formed an inverted U (20). Fosfomycin and amikacin in combination resulted in the suppression of resistance that occurred at comparable drug exposures in monotherapy of each drug (Fig. 2, 11, 12, and 14 to 16). As the exposure of the other antibiotic increased, the inverted U shifted to the left as the emergence of resistance was progressively suppressed (Fig. 3).
FIG 3.

PD relationships for the emergence of resistance in relation to modeled fAUC/MIC ratios for each agent. (A) Increasing fosfomycin fAUC/MIC on a background of fixed amikacin fAUC/MIC. (B) Increasing amikacin fAUC/MIC on a background of fixed fosfomycin fAUC/MIC.
The nature and magnitude of the PD interaction between fosfomycin and amikacin was estimated by fitting a PD interaction model to the pharmacokinetic-pharmacodynamic (PK/PD) data (Table 1). The R2 values for the observed versus individual predicted values were 0.875 (free fosfomycin concentrations), 0.963 (free amikacin concentrations), 0.869 (total bacterial counts), 0.944 (fosfomycin-resistant bacterial counts), and 0.669 (amikacin-resistant bacterial counts). There were synergistic relationships for the effects of the combination on susceptible, fosfomycin-resistant, and amikacin-resistant bacteria, with α values of 13.046 (95% CI, 0.761 to 25.331), 20.520 (95% CI, 11.727 to 29.313), and 25.227 (95% CI, 14.485 to 35.969), respectively. Hence, the combination of fosfomycin and amikacin was synergistic in terms of killing both drug-susceptible and drug-resistant subpopulations.
TABLE 1.
Parameter value estimates from the HFIM PK/PD model
| Parametera | Mean | Median | 95% credibility interval |
|---|---|---|---|
| V1 (liters) | 0.459 | 0.469 | 0.416–0.5 |
| V2 (liters) | 0.359 | 0.312 | 0.306–0.417 |
| CL1 (liters/h) | 0.082 | 0.077 | 0.0755–0.0967 |
| CL2 (liters/h) | 0.038 | 0.031 | 0.0308–0.0369 |
| Kg ,s | 1.320 | 1.124 | 1.000–1.579 |
| Kk ,s | 2.698 | 2.922 | 2.700–3.000 |
| E501s (mg/liter) | 9.081 | 6.805 | 4.417–11.260 |
| E502s (mg/liter) | 11.674 | 6.768 | 4.041–17.540 |
| αs | 16.288 | 13.046 | 3.439–29.997 |
| Kg ,r1 | 1.375 | 1.324 | 1.239–1.329 |
| Kk ,r1 | 2.384 | 2.221 | 1.933–2.902 |
| E501r1 (mg/liter) | 34.554 | 28.833 | 28.228–42.833 |
| αr1 | 17.023 | 20.520 | 11.021–22.068 |
| Kg ,r2 | 1.361 | 1.367 | 1.299–1.375 |
| Kk ,r2 | 2.325 | 2.070 | 1.972–2.872 |
| E502r2 (mg/liter) | 37.795 | 39.150 | 28.819–43.860 |
| αr2 | 19.815 | 25.227 | 7.259–29.675 |
| H1,s | 3.794 | 4.801 | 2.726–4.996 |
| H2,s | 3.347 | 3.923 | 0.735–4.967 |
| H1,r1 | 2.160 | 2.488 | 1.205–2.831 |
| H2,r2 | 2.776 | 2.913 | 0.883–3.942 |
V, volume of distribution; CL, clearance; Kg, bacterial growth constant; Kk, bacterial kill constant; E50, concentration of drug achieving 50% efficacy; α, interaction parameter; H, Hill constant. Parameter suffixes are defined as follows; 1, relating to fosfomycin; 2, relating to amikacin; s, relating to wild-type bacterial population; r1, relating to fosfomycin-resistant bacterial population; r2, relating to amikacin-resistant bacterial population.
Assessment of a neonatal combination regimen of fosfomycin and amikacin.
We assessed the PD of the combination of fosfomycin and amikacin using neonatal concentration-time profiles of each drug over a 7-day period. For amikacin, we used a standard neonatal dose of 15 mg/kg every 24 h (21) and a median neonatal half-life of 7 h (22). For fosfomycin, we used a neonatal dose of 100 mg/kg every 12 h with a half-life of 5.2 h, based on preliminary data from the NeoFosfo trial (ClinicalTrials.gov identifier NCT03453177) (23). As the challenge strains, we selected nine Gram-negative bacteria that had a range of MICs for both drugs and had different mechanisms of resistance (Table 2). We successfully recapitulated the target free drug PK profiles associated with each regimen (data not shown).
TABLE 2.
Details of strains used in HFIM experiments testing the physiological PK of fosfomycin and amikacin
| Strain | Species | Resistance mechanism(s)a | Amikacin MIC (mg/liter) | Fosfomycin MIC (mg/liter) |
|---|---|---|---|---|
| a NS, not sequenced at the time of writing. | ||||
| ST195 | E. coli | CTX-M-14 | 4 | 1 |
| I1057 | E. coli | CTX-M-15, CMY-23, fluoroquinolone resistant | 32 | 2 |
| NCTC 13451 | E. coli | CTX-M-15, OXA-1, TEM-1, aac6′-lb-cr, mph(A), catB4, tet(A), dfrA7, aadA5, sulI | 16 | 4 |
| BAA2523 | E. coli | OXA-48 | 4 | 8 |
| L75546 | K. pneumoniae | NS | 64 | 4 |
| 1237221 | K. pneumoniae | SHV-OSBL, CTX-M-15 | 8 | 32 |
| 1216477 | K. pneumoniae | SHV-OSBL, TEM-OSBL, CTX-M-15 | 8 | 32 |
| NCTC 13438 | K. pneumoniae | KPC3 | 32 | 32 |
| 1256506 | K. pneumoniae | SHV-OSBL, TEM-OSBL, CTX-M-2, CMY-2 | 2 | 128 |
| L41464 | K. pneumoniae | NS | 16 | 128 |
NS, not sequenced at the time of writing.
The summary PD are shown in Fig. 4 (full PD outputs are shown in Fig. S2 to S10). When administered alone, amikacin and fosfomycin failed to achieve extinction for 9/9 and 7/9 strains, respectively. All arms with strains inhibited by fosfomycin with MICs of >4 mg/liter when treated with fosfomycin monotherapy had rapid emergence of resistance within 24 h. The three strains inhibited by fosfomycin with MICs of ≤4 mg/liter were either killed to sterility (two strains) or had delayed emergence of resistance toward the end of the experiment. In contrast, the combination regimen achieved extinction in 6/9 strains. The strains for which the combination failed were all inhibited with MICs of ≥32 mg/liter and ≥8 mg/liter for fosfomycin and amikacin, respectively. The distribution of combined fosfomycin and amikacin MICs versus response is shown in Fig. 4A. In Fig. 4A, a plane (or line) delineated two groups of strains, defined by the fosfomycin and amikacin MICs, that predicted success (defined as sterility at the end of the experiment) and failure. This “breakpoint plane” was described in the Cartesian format MICA × MICF = 256, where MICA and MICF are amikacin and fosfomycin MICs, respectively. In a clinical context, this means that, if the product of the amikacin and fosfomycin MICs inhibiting a bacterial pathogen is <256, then treatment with a neonatal regimen of fosfomycin and amikacin in combination can be predicted to succeed (i.e., the bacterium is sensitive to this combination).
FIG 4.

Summary of PD outputs of fosfomycin-amikacin combination and monotherapy regimens in the HFIM, shown by pathogen fosfomycin and amikacin MICs (A) and fosfomycin and amikacin fAUC/MIC ratios (B). Success is defined by bacterial kill to sterility at the end of the experiment.
The amikacin-fosfomycin combination success data can also be arranged according to the fAUC/MIC ratio for each drug, as shown in Fig. 4B, with a similar plane describing the threshold for successful treatment with the combination. This target plane can be described with the form (fAUCF/MICF) × (fAUCA/MICA) = 2,709.5 (where F and A subscripts denote fosfomycin and amikacin fAUCs and MICs, respectively). Interpreted in a clinical context, if the product of the amikacin and fosfomycin fAUC/MIC ratios is >2,709.5, then the target for PD success has been met, with predicted treatment success.
Monte Carlo simulations.
Amikacin and fosfomycin fAUCs for 10,000 neonates were created using a Monte Carlo simulation from a neonatal fosfomycin model that included neonatal covariate distributions based on the neonatal cohorts from the NeoFosfo trial and a recently completed global neonatal sepsis observational study (NeoAMR) (23, 24) and a recently published neonatal amikacin model (25). Simulated dosing regimens were fosfomycin at 100 mg/kg every 12 h for neonates ≤7 days of age and 150 mg/kg every 12 h for neonates >7 days of age, as suggested by the NeoFosfo trial results and the EMA dosing recommendations (23, 26). Simulated amikacin dosages were 15 mg/kg every 24 h for all neonates >2 kg; neonates weighing ≤2 kg were dosed every 48 h if ≤7 days of age and every 36 h if >7 days of age (27).
Using the target relationships defined above, we calculated a combined probability of PD target attainment for both drugs across MIC ranges (1 to 256 mg/liter) (Table 3). These simulated fAUCs demonstrated ≥99% predicted target attainment for Enterobacterales strains with amikacin and fosfomycin MICs below the breakpoint plane. This indicates a high likelihood that fosfomycin and amikacin in combination in the simulated dosing regimens (i.e., at standard neonatal doses) will successfully treat neonatal sepsis caused by these pathogens.
TABLE 3.
Probability of attainment of the target (fAUCF/MICF) × (fAUCA/MICA) = 2,709.5 across a range of amikacin and fosfomycin MICs, using 10,000 Monte Carlo simulated neonatal amikacin and fosfomycin fAUCs
| Fosfomycin MIC (mg/liter) | Probability (%) of target attainment at amikacin MIC ofa |
||||||||
|---|---|---|---|---|---|---|---|---|---|
| 1 mg/liter | 2 mg/liter | 4 mg/liter | 8 mg/liter | 16 mg/liter | 32 mg/liter | 64 mg/liter | 128 mg/liter | 256 mg/liter | |
| 256 | 91.33 | 51.81 | 3.43 | 0.00 | 0.00 | 0.00 | 0.00 | 0.00 | 0.00 |
| 128 | 99.42 | 91.33 | 51.81 | 3.43 | 0.00 | 0.00 | 0.00 | 0.00 | 0.00 |
| 64 | 99.97 | 99.42 | 91.33 | 51.81 | 3.43 | 0.00 | 0.00 | 0.00 | 0.00 |
| 32 | 100.00 | 99.97 | 99.42 | 91.33 | 51.81 | 3.43 | 0.00 | 0.00 | 0.00 |
| 16 | 100.00 | 100.00 | 99.97 | 99.42 | 91.33 | 51.81 | 3.43 | 0.00 | 0.00 |
| 8 | 100.00 | 100.00 | 100.00 | 99.97 | 99.42 | 91.33 | 51.81 | 3.43 | 0.00 |
| 4 | 100.00 | 100.00 | 100.00 | 100.00 | 99.97 | 99.42 | 91.33 | 51.81 | 3.43 |
| 2 | 100.00 | 100.00 | 100.00 | 100.00 | 100.00 | 99.97 | 99.42 | 91.33 | 51.81 |
| 1 | 100.00 | 100.00 | 100.00 | 100.00 | 100.00 | 100.00 | 99.97 | 99.42 | 91.33 |
Gray shading in the table body denotes MIC combinations with probability of target attainment of <95%.
DISCUSSION
In both static and dynamic in vitro pharmacological models, there were unequivocal synergistic interactions between amikacin and fosfomycin, as measured by bactericidal killing and the prevention of emergence of AMR. In particular, the addition of increasing doses of the second agent suppresses the “inverted U” of AMR emergence (20) (Fig. 3), preventing the resistance observed at equivalent doses in monotherapy. These characteristics are unaffected by the presence of resistance mechanisms that render first-line agents ineffective (e.g., ESBLs and AMEs) in the bacteria tested in our experiments. The combination of fosfomycin and amikacin is therefore a potentially useful regimen for empirical treatment of neonatal sepsis in the context of a high prevalence of these resistance mechanisms.
Prediction of antimicrobial success has traditionally been conceived using breakpoint thresholds on a scale of a single drug concentration, with treatment success being dependent on the bacteria being inhibited at a MIC above or below a certain threshold on this scale. Our data suggest that using conventional monotherapy breakpoints is of limited value for combinations of antibiotics (Fig. 4). Here, we propose a novel two-dimensional breakpoint concentration threshold for treatment success defined by the Cartesian function of the pathogen’s fosfomycin and amikacin MICs, i.e., MICA × MICF = 256, where A and F subscripts denote amikacin and fosfomycin MICs, respectively. Enterobacterales pathogens that are inhibited with amikacin and fosfomycin MICs beneath this threshold (i.e., MICA × MICF < 256) can be predicted to be successfully treated by the standard regimen of these agents used in neonates, i.e., it is specific to a neonatal context.
In a further extension, we also propose a novel combination PD target threshold for the combination regimen for predicted treatment success, described in the following Cartesian format: (fAUCF/MICF) × (fAUCA/MICA) = 2,709.5. The probabilities of standard neonatal regimens of these drugs attaining this threshold, for bacteria inhibited at a range of MIC combinations and incorporating the variability of neonatal drug exposure, are summarized in Table 3.
We aimed to ensure a diversity of resistance mechanisms across the strains used, with commonly encountered resistance motifs in LMICs being represented, acknowledging that we are limited to the nine strains used. While it is possible that bacteria with resistance mechanisms not examined in our experiments would not follow the relationship described, the MIC provides an integrative measure of potency regardless of the molecular mechanism of resistance and can be used to predict PD response, as with conventional breakpoints.
In our HFIM experiments, the monotherapy arms failed with strains inhibited by fosfomycin and amikacin at MICs below their EUCAST breakpoint concentrations (32 mg/liter for fosfomycin and 8 mg/liter for amikacin [28]). The underperformance of amikacin partially supports the recent downward revision of aminoglycoside breakpoint concentrations by EUCAST, with a recommendation to avoid aminoglycoside monotherapy for systemic infections (28), but also reflects the observed greater tendency of aminoglycoside exposure to generate the emergence of resistant small-colony variants in vitro than that observed in vivo (29). Failure of fosfomycin as monotherapy for strains inhibited at MICs of >4 mg/liter supports suggestions that the breakpoint concentration for neonatal systemic infections should be lower than the currently stated EUCAST breakpoint of 32 mg/liter for adult systemic infections (28) (as has also been suggested previously in an adult context [30]). However, the ideal breakpoint concentration for fosfomycin alone is difficult to define because this agent should not be used as monotherapy due to the potential for rapid emergence of resistance (31, 32).
There are increasing numbers of experimental models of neonatal infection and sepsis (33, 34). The HFIM has been used previously to explore the PD of vancomycin and teicoplanin for neonatal sepsis (33, 35). The HFIM has the advantage of enabling the simulation of neonatal PK to explore drug exposure effects and drug exposure resistance relationships that are specific to this special population; this is extremely difficult to achieve in laboratory animal models, due to inherent PK differences in comparison with humans. Furthermore, laboratory animal models of bacteremia have additional difficulties in establishing PD relationships due to the relatively low and intermittently detectable bacterial densities. The HFIM overcomes these limitations.
However, the HFIM does not replicate the anatomical barriers that may be important for infections of the lung and brain and does not contain any immunological effectors that may contribute to antimicrobial activity (even if these are immature in neonates). Furthermore, the relatively high density of the inoculum used in the HFIM to ensure reproducible results (∼106 CFU/ml) is higher than the estimates for the bacterial density in the bloodstream of neonates with sepsis (∼100 to 103 CFU/ml) (36, 37). For these reasons, the conclusions from the HFIM may be conservative and may represent a worst-case scenario for regimen identification.
Furthermore, the conclusions of these experiments are applicable only to the treatment of systemic infections (i.e., neonatal sepsis), given the replication of neonatal systemic drug exposures. While both amikacin and fosfomycin have a degree of cerebrospinal fluid (CSF) penetration (amikacin has a CSF partition coefficient of 0.1 in neonates [38], and fosfomycin has a CSF coefficient of 0.15 to 0.2 in adults [39], with neonatal data expected in the NeoFosfo trial [23]), the CSF drug exposures and the behavior of bacterial inocula in neonatal meningitis will be different from those modeled in this system.
Despite these limitations, we conclude that these experiments demonstrate that the regimen of fosfomycin and amikacin in combination is synergistic in both bactericidal effects and the prevention of acquired AMR to either drug, with a defined threshold for probable treatment success. Additionally, both agents have attributes that make them suitable for use in LMIC settings, including (i) stability at room temperature (40, 41); (ii) ease of administration, with once- or twice-daily dosing; (iii) minimal toxicities; (iv) off-patent status and therefore potential affordability; and (v) potential activity, in combination, for the predominant bacterial causes of neonatal sepsis. We conclude that this combination regimen could be considered appropriate for empirical treatment of neonatal sepsis in LMIC settings.
MATERIALS AND METHODS
Antimicrobial agents.
Amikacin (Alfa Aesar, Haverhill, MA) and fosfomycin (Sigma-Aldrich, St. Louis, MO) were purchased. Both agents were stored at 2 to 8°C in anhydrous form. Fresh solutions were prepared in sterile distilled water prior to any use. For the in vitro HFIM experiments, a licensed pharmaceutical preparation of fosfomycin (Fomicyt; Kent Pharmaceuticals Ltd) was used and was prepared using sterile distilled water.
Medium and agar.
Cation-adjusted Muller-Hinton broth (MHB) (Sigma-Aldrich) was used as the primary medium in all experiments. Because fosfomycin requires the presence of glucose-6-phosphate (G6P) for bacterial cell entry (42), the MHB was supplemented with 25 mg/liter G6P (Sigma-Aldrich) in experiments in which fosfomycin was used. Mueller-Hinton agar (MHA) was used in all agar plates. Commercially preprepared 20-ml round MHA plates (Thermo Fisher Scientific, Waltham, MA) or self-prepared 50-ml square MHA plates (MHA from Sigma-Aldrich and square plates from VWR, Radnor, PA) were used in all experiments. For drug-containing plates, MHA was supplemented with antibiotic (with 25 mg/liter G6P in the case of fosfomycin) and prepared within each antibiotic’s stability limits. Drug concentrations in agar were 4 times the MIC of the specific bacterial strain used in a given experiment.
Bacterial isolates.
Isolates were supplied by JMI Laboratories, IHMA, Public Health England (PHE), LGC Standards, University of Birmingham, University of Oxford, and Royal Liverpool University Hospital. For the initial nondynamic in vitro experiments, a collection of strains representing a range of common possible neonatal sepsis bacterial pathogens and resistance mechanisms in an environment in which AMR is prevalent was collated. In total, this included 10 strains of each of the following: GBS, MRSA, Escherichia coli, and Klebsiella pneumoniae. All of the Gram-negative bacteria were ESBL (nine E. coli strains and nine K. pneumoniae strains) or carbapenemase (one E. coli strain and one K. pneumoniae strain) producers. Some of these strains were used in the HFIM experiments based on their MICs, including another two K. pneumoniae strains and one E. coli strain (ESBL producers) not included in the original 40-strain panel (full details of the isolates are presented in Table S1 in the supplemental material). All isolates were stored in glycerol at −80°C and subcultured on two MHA plates for 18 to 24 h at 37°C prior to each experiment. In each non-HFIM experiment, colonies were suspended in phosphate-buffered saline (PBS) to a MacFarland standard of 0.5 (1 × 10⁸ CFU/ml) and were diluted to the target concentration. For HFIM experiments, bacteria were incubated in MHB until the bacteria entered exponential growth and were quantified by the optical density at 600 nm (OD600) according to a strain-specific standard growth curve.
Antimicrobial susceptibility testing.
Fosfomycin and amikacin MICs for the panel of representative neonatal sepsis bacterial pathogens were determined using the EUCAST broth microdilution methodology (43). E. coli ATCC 25922 or S. aureus ATCC 29213 was used as the control in all experiments. The antibiotic gradient strip assay method was used for isolates from the HFIM experiment. Briefly, an inoculum of the isolate was made using a suspension of a sweep of colonies into PBS to a McFarland standard of 0.5. A lawn of the inoculum was plated on an MHA plate and an antibiotic gradient strip (Etest; bioMérieux, Marcy-l’Étoile, France) was placed on the plate, which was subsequently incubated for 18 to 24 h at 37°C before reading. Interpretation of susceptibility was performed using 2020 EUCAST breakpoints (28). The breakpoint for intravenously administered fosfomycin was used for fosfomycin MIC interpretation.
In vitro PD assays.
Checkerboard assays were used for selected strains to assess the PD interaction of the fosfomycin-amikacin combination. Strains were selected based on having MICs of ≤32 mg/liter and >0.0625 mg/liter for both fosfomycin and amikacin. One hundred-microliter aliquots of the antimicrobials in sterile distilled water were added to an 8 × 8 grid on a 96-well plate, with concentration gradients created with 1:2 serial dilutions along each axis and with the final row/column having 0 mg/liter of the appropriate drug. The drug concentration ranges used on each plate were chosen according to the drug MICs of each strain, with the maximum concentration of each antimicrobial being 4× MIC for that strain. The inoculum was made up to 1 × 10⁶ CFU/ml in MHB and was quantified using 1:10 serial dilutions onto MHA plates. One hundred microliters of the inoculum was added to each well of the prepared checkerboard. The well containing 0 mg/ml of each drug acted as the positive control; an additional row of blank MHB on the plate acted as the negative control. Plates were incubated for 18 to 24 h at 37°C before being read with an optical densitometer (Varioskan; Thermo Fisher Scientific) at 600 nm. Plates were considered valid if the MICs on the monotherapy rows of the checkerboard were within 1 dilution of previously determined MICs, the negative controls had no growth, and the prepared inoculum was within 6 × 10⁵ to 14 × 105 CFU/ml.
Raw OD readings were normalized to that of the positive control. The readouts were then modeled using the model of drug synergy described by Greco et al. (15) using ADAPT 5 (44), with determination of α; CIs were calculated using the standard error of the model outputs. Meta-analysis was performed on the output of the combination using the R package metafor (45).
HFIM.
The HFIM is a well-established dynamic model simulating the PD effect of antimicrobials with physiological dynamic concentrations (46). The HFIM method was used largely as described previously (33). Briefly, each arm in the HFIM is set up as demonstrated in Fig. S1; monotherapy arms omit the supplementary compartments. MHB is pumped into the central compartment at a rate set to simulate a physiological clearance rate for the drug, with all medium in the central compartment above 300 ml being removed via an elimination pump. The target simulated half-lives for fosfomycin and amikacin were 5.1 and 7 h, respectively. The neonatal half-life of fosfomycin was determined from then-unpublished data from the NeoFosfo trial (23). The neonatal half-life of amikacin was taken from the summary of product characteristics (47) and confirmed with other published neonatal clinical PK data (22, 48–51). To account for the difference in clearance between fosfomycin and amikacin, supplementary compartments were set up according the principles laid out by Blaser (52).
Throughout the HFIM experiments, inoculum concentrations were determined by 1:10 serial dilutions. A total of 10 μl of each dilution was pipetted onto MHA plates, one drug-free and two containing either fosfomycin or amikacin. An additional 100 μl of the original inoculum was plated onto a drug-free MHA plate to lower the limit of detection (LOD) for total bacterial quantification (i.e., to 10 CFU/ml). Plates were then incubated at 37°C for 18 to 24 h for drug-free plates and 42 to 48 h for drug-containing plates. After incubation, colonies were counted for at least two dilutions and the CFU per milliliter of the original inoculum was calculated.
Preliminary monotherapy experiments were performed with the ESBL-producing E. coli strain ST195 (fosfomycin MIC, 1 mg/liter; amikacin MIC, 4 mg/liter; supplied by the University of Birmingham) (19). PK and PD outputs of these experiments were modeled using Pmetrics (53) and parameters were simulated using ADAPT (44) to determine the fosfomycin and amikacin doses required to achieve EC20, EC50, and EC80, in terms of bactericidal effects within the HFIM. A 16-arm HFIM experiment was performed using a 4 × 4 dosing matrix with these three doses and no dose for both antibiotics in combination. The experiment was run over 96 h, with a target initial inoculum of 1 × 10⁶ CFU/ml of ST195 inoculated into the hollow-fiber cartridges. A dose of fosfomycin corresponding to the EC20, EC50, or EC80 was administered every 12 h to the primary central compartment only; an amikacin dose achieving the EC20, EC50, or EC80 was administered to the primary and supplementary central compartments every 24 h.
PK samples were taken for bioanalysis at four time points in dosing windows in days 1 and 3 of the experiment. Samples of inoculum were taken from each hollow-fiber cartridge at four time points during the first 24 h and then once daily, before administration of the dose, until the 96-h time point. Each sample was prepared and plated onto drug-free square agar plates and fosfomycin- and amikacin-containing plates, as described above. MICs from any viable colonies from each arm at the final time point were determined via antibiotic gradient strip assay.
Further HFIM experiments were performed to assess the effects of clinically relevant fosfomycin and amikacin doses leading to neonatal-like PK profiles alone and in combination against a variety of bacteria with different fosfomycin and amikacin MICs. The PK profiles of fosfomycin and amikacin were designed to have half-lives of 5.1 and 7 h, with maximum concentration (Cmax) values of 250 mg/liter and 40 mg/liter, respectively. These values were determined from the sources used to determine the half-lives, as described above. Nine parallel experiments were performed using nine Gram-negative strains with a wide distribution of fosfomycin and amikacin MICs (Table 2). Each individual experiment consisted of four arms, i.e., monotherapy arms for both fosfomycin and amikacin, a combination therapy arm, and an untreated control. Because this experiment aimed to replicate clinically relevant drug exposures in neonates, each experiment lasted 7 days to reflect the typical treatment course of neonatal sepsis. Four PK samples were taken in each of three dose intervals distributed evenly throughout the experiment. Four inoculum samples were taken on day 1 and once every 24 h thereafter. These samples were quantified on drug-free, fosfomycin-containing, and amikacin-containing square MHA plates. MICs from any viable colonies from each arm at the final time point were determined via antibiotic gradient strip assay.
Amikacin bioanalysis.
The internal standard, [2H5]amikacin (Alsachim, Illkirch-Graffenstaden, France), was prepared in acetonitrile plus 5% trichloroacetic acid (25 mg/liter; Thermo Fisher Scientific), and 150 μl was added to a 96-well protein precipitation plate (Phenomenex, Cheshire, UK). Fifty microliters each of samples, blanks, calibrators in the range of 0.5 to 50 mg/liter, and quality controls (0.75, 7.5, and 37.5 mg/liter) were mixed with the internal standard on an orbital shaker. Liquid was drawn through the protein precipitation plate into a collection plate using a positive pressure manifold. Samples were evaporated under nitrogen (40 liters/min), followed by reconstitution in water (Thermo Fisher Scientific) and 0.1% heptafluorobutyric acid (Sigma-Aldrich), and were mixed using an orbital shaker prior to analysis by liquid chromatography-tandem mass spectrometry (LC-MS/MS).
LC-MS/MS analysis was performed using an Agilent 1290 Infinity high-performance liquid chromatography (HPLC) system coupled to an Agilent 6420 triple-quadrupole mass spectrometer fitted with an electrospray source controlled using Agilent MassHunter data acquisition software (version B.06.00). Analytes (5 μl) were injected onto a Discovery HS C18 HPLC column (2.1 mm by 50 mm, 3 μm) at 50°C and separated with a 3.5-min gradient using a mixture of solvents A (LC-MS-grade water with 0.1% [vol/vol] heptafluorobutyric acid) and B (HPLC-grade acetonitrile with 0.1% [vol/vol] heptafluorobutyric acid). Separations were performed by applying a linear gradient of 2% to 98% solvent B over 3 min at 0.5 ml/min, followed by an equilibration step (0.5 min at 2% solvent B).
The mass spectrometer was operated in positive-ion mode using a multiple reaction monitoring (MRM) method with the following specified mass transitions and collision energy (Ce) values: amikacin, 586.4 to 163.2 (Ce, 30 eV); [2H5]amikacin, 591.3 to 163.2 (Ce, 30 eV). Mass spectrometry readouts were processed using Agilent MassHunter quantitative analysis (version B.05.02).
Prior to sample analysis, the analytical method was validated to assess recovery and matrix effects, interday and intraday accuracy and precision, carryover, dilution integrity, stability in the matrix (4 h at room temperature and three-freeze thaw cycles), and processed sample stability (reinjection of extracts after 24 h). The average recovery from the matrix was 75.3%. The limit of quantification (LLQ) was defined as 0.5 mg/liter and the LOD as 0.25 mg/liter. The interday and intraday coefficient of variation (CV) values at the three quality control levels ranged from 2.5% to 5.7% and from 2.9% to 6.41%, respectively. The analyte was found to be stable under all conditions described above.
Fosfomycin bioanalysis.
The internal standard, ethylphosphonic acid (EPA) (Sigma-Aldrich), was prepared in acetonitrile (5 mg/liter; Thermo Fisher Scientific), and 200 μl was added to a 96-well protein precipitation plate (Phenomenex). Fifty microliters each of samples, blanks, calibrators in the range of 1 to 500 mg/liter, and quality controls (3.5, 35, and 350 mg/liter) were mixed with the internal standard on an orbital shaker. Liquid was drawn through the protein precipitation plate into a collection plate using a positive pressure manifold, with water and 2 mM ammonium acetate (150 μl) added to each well, before sealing and mixing on an orbital shaker.
LC-MS/MS analysis was carried out using the same technical setup as described above. Analytes were injected (5 μl) onto an Agilent Zorbax rapid-resolution high-definition HILIC Plus 95-Å column (2.1 mm by 50 mm, 1.8 μm) at 40°C and separated over a 3.5-min gradient using a mixture of solvents A (LC-MS-grade water with 2 mM [vol/vol] ammonium acetate) and B (HPLC-grade acetonitrile). Separations were performed by applying a linear gradient of 100% to 0% solvent B over 2 min at 0.4 ml/min, followed by an equilibration step (1.5 min at 100% solvent B).
The mass spectrometer was operated in negative-ion mode using an MRM method with the following specified mass transitions and Ce values: fosfomycin, 137.1 to 79.0 (Ce, 20 eV); EPA, 109.1 to 79.0 (Ce, 20 eV). Mass spectrometry readouts were processed as described above.
This fosfomycin analytical method underwent the same validation process as the amikacin method described above. The average recovery from the matrix was 80.9%. The LLQ was defined as 1 mg/liter and the LOD as 0.5 mg/liter. The interday and intraday CV values at the three quality control levels ranged from 6.5% to 8.1% and from 4.7% to 6.9%, respectively. The analyte was found to be stable under all conditions described above.
Modeling.
Population PK models were constructed with the PK and PD outputs of the HFIM experiments using the population PK program Pmetrics with a nonparametric adaptive grid estimation routine (53). The structural model was based on the models of pharmacological synergy described by Greco et al. (15) (described in full in Text S1 in the supplemental material).
Monte Carlo simulation.
A neonatal model for fosfomycin developed from the NeoFosfo trial (23, 54) and previously published neonatal amikacin data (55) were used to simulate fosfomycin and amikacin PK profiles from 10,000 neonates using the linPK package in R (https://cran.r-project.org/web/packages/linpk/index.html). The simulated population was based on the demographic distribution of neonates in the NeoFosfo trial (23) combined with data from an international multicenter neonatal observational trial (24). From the simulated PK profiles, individual fAUC0–24 values were calculated.
Data availability.
The programs ADAPT and Pmetrics are publicly available, with instructions, at https://bmsr.usc.edu/software/adapt and http://www.lapk.org/pmetrics.php, respectively.
ACKNOWLEDGMENTS
This work was funded the Global Antibiotic Research and Development Partnership (GARDP). The GARDP was funded by the German Federal Ministry of Education and Research, the German Federal Ministry of Health, Médecins Sans Frontières, the Netherlands Ministry of Health, Welfare, and Sport, the U.K. Department for International Development, and the U.K. National Institute of Health Research. C.A.D. is an MRC Clinical Training Fellow based at the University of Liverpool supported by the North West England Medical Research Council Fellowship Scheme in Clinical Pharmacology and Therapeutics, which is funded by the Medical Research Council (award reference no. MR/N025989/1), Roche Pharma, Eli Lilly and Company Limited, UCB Pharma, Novartis, the University of Liverpool, and the University of Manchester. The funders had no role in study design, data collection and interpretation, or the decision to submit the work for publication.
We thank Sam Lipworth for identifying and supplying the strains from the University of Oxford, Jonathan Folb for supplying GBS strains from the Royal Liverpool Hospital, and JMI Laboratories and IHMA for gifting their strains for this work.
Declared interest: None.
Footnotes
Supplemental material is available online only.
REFERENCES
- 1.Shane AL, Sánchez PJ, Stoll BJ. 2017. Neonatal sepsis. Lancet 390:1770–1780. doi: 10.1016/S0140-6736(17)31002-4. [DOI] [PubMed] [Google Scholar]
- 2.Oza S, Lawn JE, Hogan DR, Mathers C, Cousens SN. 2015. Neonatal cause-of-death estimates for the early and late neonatal periods for 194 countries: 2000–2013. Bull World Health Organ 93:19–28. doi: 10.2471/BLT.14.139790. [DOI] [PMC free article] [PubMed] [Google Scholar]
- 3.Seale AC, Blencowe H, Manu AA, Nair H, Bahl R, Qazi SA, Zaidi AK, Berkley JA, Cousens SN, Lawn JE. 2014. Estimates of possible severe bacterial infection in neonates in sub-Saharan Africa, south Asia, and Latin America for 2012: a systematic review and meta-analysis. Lancet Infect Dis 14:731–741. doi: 10.1016/S1473-3099(14)70804-7. [DOI] [PMC free article] [PubMed] [Google Scholar]
- 4.Fuchs A, Bielicki J, Mathur S, Sharland M, Van Den Anker JN. 2016. Antibiotic use for sepsis in neonates and children: 2016 evidence update. World Health Organization, Geneva, Switzerland. [Google Scholar]
- 5.World Health Organization. 2013. Pocket book of hospital care for children, 2nd ed. World Health Organization, Geneva, Switzerland. [Google Scholar]
- 6.DeNIS collaboration. 2016. Characterisation and antimicrobial resistance of sepsis pathogens in neonates born in tertiary care centres in Delhi, India: a cohort study. Lancet Glob Heal 4:e752–e760. doi: 10.1016/S2214-109X(16)30148-6. [DOI] [PubMed] [Google Scholar]
- 7.Labi AK, Obeng-Nkrumah N, Bjerrum S, Enweronu-Laryea C, Newman MJ. 2016. Neonatal bloodstream infections in a Ghanaian tertiary hospital: are the current antibiotic recommendations adequate? BMC Infect Dis 16:598. doi: 10.1186/s12879-016-1913-4. [DOI] [PMC free article] [PubMed] [Google Scholar]
- 8.Bandyopadhyay T, Kumar A, Saili A, Randhawa VS. 2018. Distribution, antimicrobial resistance and predictors of mortality in neonatal sepsis. J Neonatal Perinatal Med 11:145–153. doi: 10.3233/NPM-1765. [DOI] [PubMed] [Google Scholar]
- 9.Jajoo M, Manchanda V, Chaurasia S, Sankar MJ, Gautam H, Agarwal R, Yadav CP, Aggarwal KC, Chellani H, Ramji S, Deb M, Gaind R, Kumar S, Arya S, Sreenivas V, Kapil A, Mathur P, Rasaily R, Deorari AK, Paul VK. 2018. Alarming rates of antimicrobial resistance and fungal sepsis in outborn neonates in North India. PLoS One 13:e0180705. doi: 10.1371/journal.pone.0180705. [DOI] [PMC free article] [PubMed] [Google Scholar]
- 10.Yadav NS, Sharma S, Chaudhary DK, Panthi P, Pokhrel P, Shrestha A, Mandal PK. 2018. Bacteriological profile of neonatal sepsis and antibiotic susceptibility pattern of isolates admitted at Kanti Children’s Hospital, Kathmandu, Nepal. BMC Res Notes 11:301. doi: 10.1186/s13104-018-3394-6. [DOI] [PMC free article] [PubMed] [Google Scholar]
- 11.Pokhrel B, Koirala T, Shah G, Joshi S, Baral P. 2018. Bacteriological profile and antibiotic susceptibility of neonatal sepsis in neonatal intensive care unit of a tertiary hospital in Nepal. BMC Pediatr 18:208. doi: 10.1186/s12887-018-1176-x. [DOI] [PMC free article] [PubMed] [Google Scholar]
- 12.Chaurasia S, Sivanandan S, Agarwal R, Ellis S, Sharland M, Sankar MJ. 2019. Neonatal sepsis in South Asia: huge burden and spiralling antimicrobial resistance. BMJ 364:k5314. doi: 10.1136/bmj.k5314. [DOI] [PMC free article] [PubMed] [Google Scholar]
- 13.Doern CD. 2014. When does 2 plus 2 equal 5? a review of antimicrobial synergy testing. J Clin Microbiol 52:4124–4128. doi: 10.1128/JCM.01121-14. [DOI] [PMC free article] [PubMed] [Google Scholar]
- 14.Greco WR, Bravo G, Parsons JC. 1995. The search for synergy: a critical review from a response surface perspective. Pharmacol Rev 47:331–385. [PubMed] [Google Scholar]
- 15.Greco WR, Park HS, Rustum YM. 1990. Application of a new approach for the quantitation of drug synergism to the combination of cis-diamminedichloroplatinum and 1-β-d-arabinofuranosylcytosine. Cancer Res 50:5318–5327. [PubMed] [Google Scholar]
- 16.Iarikov D, Wassel R, Farley J, Nambiar S. 2015. Adverse events associated with fosfomycin use: review of the literature and analyses of the FDA Adverse Event Reporting System database. Infect Dis Ther 4:433–458. doi: 10.1007/s40121-015-0092-8. [DOI] [PMC free article] [PubMed] [Google Scholar]
- 17.Kent A, Turner MA, Sharland M, Heath PT. 2014. Aminoglycoside toxicity in neonates: something to worry about? Expert Rev Anti Infect Ther 12:319–331. doi: 10.1586/14787210.2014.878648. [DOI] [PubMed] [Google Scholar]
- 18.Ito R, Mustapha MM, Tomich AD, Callaghan JD, McElheny CL, Mettus RT, Shanks RMQ, Sluis-Cremer N, Doi Y. 2017. Widespread fosfomycin resistance in Gram-negative bacteria attributable to the chromosomal fosA gene. mBio 8:e00749-17. doi: 10.1128/mBio.00749-17. [DOI] [PMC free article] [PubMed] [Google Scholar]
- 19.Anu K, Esther K, Dunn SJ, Dance DA, Newton PN, Davong V, Sointu M, Pakkanen SH, Andreas N, Cristoph H, Ann S, Teemu K, Jukka C, Alan M. 2019. Real-time sampling of travelers shows intestinal colonization by multidrug-resistant bacteria to be a dynamic process with multiple transient acquisitions. bioRxiv 827915. doi: 10.1101/827915. [DOI]
- 20.Tam VH, Louie A, Deziel MR, Liu W, Drusano GL. 2007. The relationship between quinolone exposures and resistance amplification is characterized by an inverted U: a new paradigm for optimizing pharmacodynamics to counterselect resistance. Antimicrob Agents Chemother 51:744–747. doi: 10.1128/AAC.00334-06. [DOI] [PMC free article] [PubMed] [Google Scholar]
- 21.Joint Formulary Committee. 2021. British national formulary online. Royal Pharmaceutical Society, London, England. [Google Scholar]
- 22.Howard JB, McCraken GH, Trujillo H, Mohs E. 1976. Amikacin in newborn infants: comparative pharmacology with kanamycin and clinical efficacy in 45 neonates with bacterial diseases. Antimicrob Agents Chemother 10:205–210. doi: 10.1128/aac.10.2.205. [DOI] [PMC free article] [PubMed] [Google Scholar]
- 23.Drugs for Neglected Diseases. 2019. Intravenous and oral fosfomycin in hospitalised neonates with clinical sepsis (NeoFosfo). ClinicalTrials.gov identifier NCT03453177. https://clinicaltrials.gov/ct2/show/NCT03453177.
- 24.Drugs for Neglected Diseases. 2018. NeoAMR observational study in neonatal sepsis. ClinicalTrials.gov identifier NCT03721302. https://clinicaltrials.gov/ct2/show/NCT03721302.
- 25.Illamola SM, Sherwin CM, van Hasselt JGC. 2018. Clinical pharmacokinetics of amikacin in pediatric patients: a comprehensive review of population pharmacokinetic analyses. Clin Pharmacokinet 57:1217–1228. doi: 10.1007/s40262-018-0641-x. [DOI] [PubMed] [Google Scholar]
- 26.European Medicines Agency. 2020. Assessment report: referral under article 31 of directive 2001/83/EC: fosfomycin-containing medicinal products. Procedure number EMEA/H/A-31/1476. European Medicines Agency, Amsterdam, Netherlands. https://www.ema.europa.eu/en/documents/referral/fosfomycin-article-31-referral-assessment-report_en.pdf. [Google Scholar]
- 27.Brady M, Jackson M, Kimberlin D, Long S. 2018. Red book: 2018–2021 report of the Committee on Infectious Diseases, 31st ed.American Academy of Pediatrics, Itasca, IL. [Google Scholar]
- 28.EUCAST. 2020. Breakpoint tables for interpretation of MICs and zone diameters Version 10.0. https://www.eucast.org/fileadmin/src/media/PDFs/EUCAST_files/Breakpoint_tables/v_10.0_Breakpoint_Tables.pdf.
- 29.Bulitta JB, Hope WW, Eakin AE, Guina T, Tam VH, Louie A, Drusano GL, Hoover JL. 2019. Generating robust and informative nonclinical in vitro and in vivo bacterial infection model efficacy data to support translation to humans. Antimicrob Agents Chemother 63:e02307-18. doi: 10.1128/AAC.02307-18. [DOI] [PMC free article] [PubMed] [Google Scholar]
- 30.Merino-Bohórquez V, Docobo-Pérez F, Sojo J, Morales I, Lupión C, Martín D, Cameán M, Hope W, Pascual Á, Rodríguez-Baño J. 2018. Population pharmacokinetics and pharmacodynamics of fosfomycin in non–critically ill patients with bacteremic urinary infection caused by multidrug-resistant Escherichia coli. Clin Microbiol Infect 24:1177–1183. doi: 10.1016/j.cmi.2018.02.005. [DOI] [PubMed] [Google Scholar]
- 31.Docobo-Pérez F, Drusano GL, Johnson A, Goodwin J, Whalley S, Ramos-Martín V, Ballestero-Tellez M, Rodriguez-Martinez JM, Conejo MC, Van Guilder M, Rodríguez-Baño J, Pascual A, Hope WW. 2015. Pharmacodynamics of fosfomycin: insights into clinical use for antimicrobial resistance. Antimicrob Agents Chemother 59:5602–5610. doi: 10.1128/AAC.00752-15. [DOI] [PMC free article] [PubMed] [Google Scholar]
- 32.VanScoy BD, McCauley J, Ellis-Grosse EJ, Okusanya OO, Bhavnani SM, Forrest A, Ambrose PG. 2015. Exploration of the pharmacokinetic-pharmacodynamic relationships for fosfomycin efficacy using an in vitro infection model. Antimicrob Agents Chemother 59:7170–7177. doi: 10.1128/AAC.04955-14. [DOI] [PMC free article] [PubMed] [Google Scholar]
- 33.Ramos-Martín V, Johnson A, Livermore J, McEntee L, Goodwin J, Whalley S, Docobo-Pérez F, Felton TW, Zhao W, Jacqz-Aigrain E, Sharland M, Turner MA, Hope WW. 2016. Pharmacodynamics of vancomycin for CoNS infection: experimental basis for optimal use of vancomycin in neonates. J Antimicrob Chemother 71:992–1002. doi: 10.1093/jac/dkv451. [DOI] [PMC free article] [PubMed] [Google Scholar]
- 34.Warn PA, Livermore J, Howard S, Felton TW, Sharp A, Gregson L, Goodwin J, Petraitiene R, Petraitis V, Cohen-Wolkowiez M, Walsh TJ, Benjamin DK, Hope WW. 2012. Anidulafungin for neonatal hematogenous Candida meningoencephalitis: identification of candidate regimens for humans using a translational pharmacological approach. Antimicrob Agents Chemother 56:708–714. doi: 10.1128/AAC.05826-11. [DOI] [PMC free article] [PubMed] [Google Scholar]
- 35.Ramos-Martín V, Johnson A, McEntee L, Farrington N, Padmore K, Cojutti P, Pea F, Neely MN, Hope WW. 2017. Pharmacodynamics of teicoplanin against MRSA. J Antimicrob Chemother 72:3382–3389. doi: 10.1093/jac/dkx289. [DOI] [PubMed] [Google Scholar]
- 36.Kellogg JA, Ferrentino FL, Goodstein MH, Liss J, Shapiro SL, Bankert DA. 1997. Frequency of low level bacteremia in infants from birth to two months of age. Pediatr Infect Dis J 16:381–385. doi: 10.1097/00006454-199704000-00009. [DOI] [PubMed] [Google Scholar]
- 37.Dietzman DE, Fischer GW, Schoenknecht FD. 1974. Neonatal Escherichia coli septicemia: bacterial counts in blood. J Pediatr 85:128–130. doi: 10.1016/s0022-3476(74)80308-2. [DOI] [PubMed] [Google Scholar]
- 38.Allegaert K, Scheers I, Adams E, Brajanoski G, Cossey V, Anderson BJ. 2008. Cerebrospinal fluid compartmental pharmacokinetics of amikacin in neonates. Antimicrob Agents Chemother 52:1934–1939. doi: 10.1128/AAC.01099-07. [DOI] [PMC free article] [PubMed] [Google Scholar]
- 39.Pfausler B. 2004. Concentrations of fosfomycin in the cerebrospinal fluid of neurointensive care patients with ventriculostomy-associated ventriculitis. J Antimicrob Chemother 53:848–852. doi: 10.1093/jac/dkh158. [DOI] [PubMed] [Google Scholar]
- 40.Tillomed Laboratories. 2020. Amikacin 250 mg/ml solution for injection/infusion. https://www.medicines.org.uk/emc/product/11189/smpc#gref.
- 41.Kent Pharma UK. 2021. Fomicyt 40 mg/ml powder for solution for infusion. https://www.medicines.org.uk/emc/product/11249/smpc#gref.
- 42.Winkler HH. 1973. Distribution of an inducible hexose phosphate transport system among various bacteria. J Bacteriol 116:1079–1081. doi: 10.1128/JB.116.2.1079-1081.1973. [DOI] [PMC free article] [PubMed] [Google Scholar]
- 43.EUCAST. 2003. Determination of minimum inhibitory concentrations (MICs) of antibacterial agents by broth dilution. Clin Microbiol Infect 9:ix–xv. doi: 10.1046/j.1469-0691.2003.00790.x. [DOI] [PubMed] [Google Scholar]
- 44.D’Argenio DZ, Schumitzky A, Wang X. 2009. ADAPT 5 user’s guide: pharmacokinetic/pharmacodynamic systems analysis software. Biomedical Simulations Resource, University of Southern California, Los Angeles, CA. https://bmsr.usc.edu/files/2013/02/ADAPT5-User-Guide.pdf. [Google Scholar]
- 45.Viechtbauer W. 2010. Conducting meta-analyses in R with the metafor package. J Stat Softw 36:1–48. doi: 10.18637/jss.v036.i03. [DOI] [Google Scholar]
- 46.Cadwell J. 2012. The hollow fiber infection model for antimicrobial pharmacodynamics and pharmacokinetics. Adv Pharmacoepidemiol Drug Saf S1:7. doi: 10.4172/2167-1052.S1-007. [DOI] [Google Scholar]
- 47.Hospira UK. 2015. Amikacin 250 mg/ml injection. https://www.medicines.org.uk/emc/product/3784/smpc#gref.
- 48.Abdel-Hady E, El Hamamsy M, Hedaya M, Awad H. 2011. The efficacy and toxicity of two dosing-regimens of amikacin in neonates with sepsis. J Clin Pharm Ther 36:45–52. doi: 10.1111/j.1365-2710.2009.01152.x. [DOI] [PubMed] [Google Scholar]
- 49.Allegaert K, Anderson BJ, Cossey V, Holford NHG. 2006. Limited predictability of amikacin clearance in extreme premature neonates at birth. Br J Clin Pharmacol 61:39–48. doi: 10.1111/j.1365-2125.2005.02530.x. [DOI] [PMC free article] [PubMed] [Google Scholar]
- 50.Hughes KM, Johnson PN, Anderson MP, Sekar KC, Welliver RC, Miller JL. 2017. Comparison of amikacin pharmacokinetics in neonates following implementation of a new dosage protocol. J Pediatr Pharmacol Ther 22:33–40. doi: 10.5863/1551-6776-22.1.33. [DOI] [PMC free article] [PubMed] [Google Scholar]
- 51.Kenyon CF, Knoppert DC, Lee SK, Vandenberghe HM, Chance GW. 1990. Amikacin pharmacokinetics and suggested dosage modifications for the preterm infant. Antimicrob Agents Chemother 34:265–268. doi: 10.1128/aac.34.2.265. [DOI] [PMC free article] [PubMed] [Google Scholar]
- 52.Blaser J. 1985. In-vitro model for simultaneous simulation of the serum kinetics of two drugs with different half-lives. J Antimicrob Chemother 15:125–130. doi: 10.1093/jac/15.suppl_A.125. [DOI] [PubMed] [Google Scholar]
- 53.Neely MN, Van Guilder MG, Yamada WM, Schumitzky A, Jelliffe RW. 2012. Accurate detection of outliers and subpopulations with pmetrics, a nonparametric and parametric pharmacometric modeling and simulation package for R. Ther Drug Monit 34:467–476. doi: 10.1097/FTD.0b013e31825c4ba6. [DOI] [PMC free article] [PubMed] [Google Scholar]
- 54.Kane Z, Gastine S, Williams P, Berkley JA, Ellis S, Correia E, Darlow C, Hope W, Sharland M, Standing JF. 2020. PK/PD of intravenous and oral fosfomycin in neonates with presumed serious bacterial Infection, abstr 4568. Proc ECCMID 2020. [Google Scholar]
- 55.Illamola SM, Colom H, Hasselt JGC. 2016. Evaluating renal function and age as predictors of amikacin clearance in neonates: model-based analysis and optimal dosing strategies. Br J Clin Pharmacol 82:793–805. doi: 10.1111/bcp.13016. [DOI] [PMC free article] [PubMed] [Google Scholar]
Associated Data
This section collects any data citations, data availability statements, or supplementary materials included in this article.
Supplementary Materials
Supplemental material. Download AAC.00293-21-s0001.pdf, PDF file, 1.0 MB (991.1KB, pdf)
Data Availability Statement
The programs ADAPT and Pmetrics are publicly available, with instructions, at https://bmsr.usc.edu/software/adapt and http://www.lapk.org/pmetrics.php, respectively.