

Abstract
Background
Hypoxia‐inducible factors (HIFs) have been evaluated in various cancers and diseases. However, the specific role of hypoxia‐inducible factor 3 alpha (HIF3A) in non‐small cell lung cancer (NSCLC) remains controversial.
Materials and Methods
We investigated HIF3A mRNA expression in the plasma and tumor tissues of patients with NSCLC and explored its clinical significance. Plasma samples from 103 cases of lung adenocarcinoma (LUAD) and 96 cases of lung squamous cell carcinoma (LUSC), and tumor‐adjacent normal tissues from 58 LUAD and 62 LUSC cases were retrospectively evaluated at the No.8 People's Hospital of Qing Dao. HIF3A expression was explored using RT‐qPCR. The clinical significance of HIF3A was evaluated in the plasma and tumor tissues using the receiver operating curve (ROC) and the area under the curve (AUC).
Results
Hypoxia‐inducible factor 3 alpha expression was notably downregulated in the plasma or tumor tissues of patients with LUAD and LUSC, compared with the healthy control group or adjacent normal tissues. Furthermore, HIF3A expression had a significant positive correlation in the plasma and tumor tissues of LUAD and LUSC patients. Meanwhile, the ROC‐AUCs achieved a significantly higher range, from 0.84 to 0.93, with the plasma or tumor tissues of NSCLC patients. Thus, HIF3A expression was not only correlated with plasma and tumor tissues, but also showed potential significance in NSCLC.
Conclusion
Hypoxia‐inducible factor 3 alpha is aberrantly detectable in NSCLC patients in the plasma and tumor tissues. HIF3A may be involved in hypoxic responses during the development and occurrence of NSCLC.
Keywords: HIF3A, hypoxia, mRNA gene, non‐small cell lung cancer, plasma
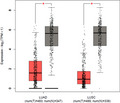
Bioinformatics‐based differential signature scores analysis in box plots by using GEPIA2 tool. The signature score is calculated by the mean value of log2 (TPM +1) of each gene in HIF3A signature gene set. The red box indicates the tumor samples while the gray one represents the normal adjacent tissues. The HIF3A signature score level in NSCLC is significantly lower than normal tissues.
1. INTRODUCTION
Lung cancer is one of the most common malignant tumors and the primary cause of cancer‐related deaths worldwide.1, 2 There are two main types: small cell lung cancer (SCLC) and non‐small cell lung cancer (NSCLC). NSCLC is mainly characterized by lung adenocarcinoma (LUAD), lung squamous cell carcinoma (LUSC), and lung large cell carcinoma (LULC).3 Even though considerable progress has been observed in recent years in the development of diagnostic and prognostic biomarkers and anti‐cancer‐based therapeutics including chemotherapy, radiation therapy, biological targeted therapy, and immunotherapy, the mortality of patients with advanced NSCLC persists due to the inability to diagnose to condition at early stages or treat advanced conditions surgically.2, 3 Consequently, research into novel diagnostic biomarkers, target genes, and therapeutic target structures of NSCLC has attracted the attention of researchers.
Hypoxia‐inducible factors (HIFs) have been evaluated in various cancers and diseases.4 HIFs are heterodimers that include HIF α (oxygen‐labile) and HIF β subunits.4, 5 Three distinct HIF genes are found in humans and other vertebrates, but HIF signaling is acquired from variants of HIF‐1 α and HIF‐2 β.6, 7, 8, 9, 10 Meanwhile, the functions of the HIF‐3 complex are because of existing alternative spliced variants of HIF3A (hypoxia‐inducible factor 3 alpha, also known as HIF‐3 α), which result in four dissimilar variants of mRNA that code for additional isoforms by using different promoters.11 The effect of suppression on HIF‐1 and HIF‐2 activity is represented by the factors embracing the α‐3 subunit, which are anti‐regulatory for hypoxia‐induced expression of genes.12, 13
There is much to discover about HIF3A compared with HIF1A and HIF2A. Previous studies have discovered the tumor‐suppressive activities of HIF1A and HIF2A in renal cell carcinoma and lung cancer.4 However, the specific role of HIF3 in NSCLC remains controversial. The current study aimed to evaluate HIF3A mRNA expression in the plasma and tumor tissues of patients with LUAD and LUSC. Furthermore, this study aimed to evaluate the diagnostic value of HIF3A in NSCLC.
2. MATERIALS AND METHODS
2.1. Patients
Plasma samples from 103 cases of LUAD and 96 cases of LUSC, and tumor‐adjacent normal tissues from 58 cases of LUAD and 62 cases of LUSC were retrospectively collected from patients undergoing primary tumor resection surgery at the No.8 People's Hospital of Qing Dao. Paired plasma samples were also collected from the 58 LUAD and 62 LUSC patients from whom tissue samples were obtained. The patients were recruited from May 2019 to September 2020. All patients signed informed consent forms during their hospital stay. The study was approved by the ethics committee of the No.8 People's Hospital of Qing Dao and was conducted following the guidelines from the Declaration of Helsinki.
2.2. RNA isolation
Total RNA was extracted using phenol‐chloroform solutions and then homogenized using guanidine isothiocyanate (Trizol RNA Preparation kit; Invitrogen). RNA concentration was evaluated using a NanoDrop spectrophotometer ND1000 (NanoDrop Technologies Inc.).
2.3. RT‐qPCR
The total RNA in the plasma and tissue samples after transfection was extracted with TRIzol reagent, according to the manufacturer's instructions. Thereafter, the total RNA was reverse‐transcribed into cDNA using a reverse transcription kit (Shanghai Sangon Biological Engineering Co., Ltd.). The primers used were as follows: HIFA3,5′‐F: AGGCGCCAGAGGCACCATGGAC‐3′, R: 5′‐CATCCTGTGCGTTGGCTGCC‐3′,U6 F: 5′‐GAAGGTGAAGGTCGGAGTC‐3′, R: 5′‐GAAGATGGTGATGGGATTT‐3′. The PCR reaction conditions were as follows: A: pre‐denaturation at 95°C for 10 min, B: denaturation at 95°C for 15 s, annealing at 60°C for 15 s, and elongation at 72°C for 20 s, for a total of 40 cycles; and C: 72°C for 15 min. The reaction was terminated at 4°C. Three replicates were set for each sample, and 2−△△Ct was used for the relative quantitative analysis of the data.
2.4. Bioinformatics
Bioinformatics were performed using GEPIA 2(http://gepia2.cancer‐pku.cn/). The data used were from TCGA normal and GTEx data.
2.5. Statistical analysis
SPSS 20.0 (SPSS Inc.) was used for all statistical analyses in the study, and data were expressed as mean ± SD. Clinical information of the patients in Tables 1 and 2 was analyzed by chi‐square test. A t test was performed to compare the two groups, and one‐way ANOVA was used to compare multiple groups. Pearson's correlation was used for the correlation analysis. The clinical significance of HIF3A was evaluated in plasma and tumor tissues using the receiver operating curve (ROC) and the area under the curve (AUC). Statistical significance was set at p < 0.05.
TABLE 1.
Correlation between the plasma level of HIF3A and the clinical information of the LUAD patients
| LUAD (n = 103) | p‐Value | ||
|---|---|---|---|
| Plasma HIF3A Low (n = 52) | Plasma HIF3A High (n = 51) | ||
| Age (Years) | 0.6058 | ||
| ≥60 | 29 | 31 | |
| <60 | 23 | 20 | |
| Gender | 0.7391 | ||
| Male | 32 | 33 | |
| Female | 20 | 18 | |
| Differentiation | 0.6148 | ||
| Well‐moderate | 27 | 29 | |
| Poor | 25 | 22 | |
| Tumor size | 0.0005 | ||
| ≥5 cm | 33 | 15 | |
| <5 cm | 19 | 36 | |
| Lymph node metastasis | 0.0384 | ||
| Negative | 18 | 28 | |
| Positive | 34 | 23 | |
| Smoking history | 0.7753 | ||
| Yes | 30 | 28 | |
| No | 22 | 23 | |
TABLE 2.
Correlation between the plasma level of HIF3A and the clinical information of the LUSC patients
| LUSC (n = 96) | p‐Value | ||
|---|---|---|---|
| Plasma HIF3A Low (n = 53) | Plasma HIF3A High (n = 43) | ||
| Age (Years) | 0.9723 | ||
| ≥60 | 31 | 25 | |
| <60 | 22 | 18 | |
| Gender | 0.6334 | ||
| Male | 32 | 28 | |
| Female | 21 | 15 | |
| Differentiation | 0.9044 | ||
| Well‐moderate | 29 | 20 | |
| Poor | 24 | 23 | |
| Tumor size | 0.0011 | ||
| ≥5 cm | 35 | 14 | |
| <5 cm | 18 | 29 | |
| Lymph node metastasis | 0.0012 | ||
| Negative | 22 | 32 | |
| Positive | 31 | 11 | |
| Smoking history | 0.5473 | ||
| Yes | 34 | 25 | |
| No | 19 | 18 | |
3. RESULTS
3.1. Characteristics of patients
A total of 199 NSCLC patients were enrolled to evaluate HIF3A expression in plasma samples, consisting of 103 LUAD and 96 LUSC patients with higher or lower expression of HIF3A. Furthermore, the patients were characterized according to clinical parameters such as age, sex, smoking history, differentiation, tumor size, and lymph node (LN) metastasis. Among the LUAD and LUSC groups, the tumor size and LN metastasis were statistically significant compared with the other parameters (Table 1 and Table 2).
3.2. HIF3A expression in the tumor tissues and plasma of NSCLC patients
Bioinformatics tools were used to analyze HIF3A expression between tumor tissues and their adjacent normal tissues in LUAD and LUSC patients via signature score analysis (GEPIA 2). Overall, the results demonstrated that HIF3A expression levels in both groups were significantly lower in tumor tissues than in adjacent normal tissues (Figure 1, p < 0.05). Furthermore, in 58 patients with LUAD, the tumor tissues had significantly low expression of HIF3A mRNA (Figure 2A). Similarly, the expression of HIF3A mRNA was significantly diminished in the tumor tissues of 62 LUSC patients (Figure 2A), and HIF3A mRNA expression was significantly lower in plasma samples from 103 LUAD patients and 96 LUSC patients compared with healthy recruits (Figure 3A,B). Thus, HIF3A expression was significantly downregulated in the tumor tissues or plasma samples of NSCLC patients.
FIGURE 1.

Bioinformatics‐based differential signature scores analysis in box plots by using GEPIA2 tool. The signature score is calculated by the mean value of log2 (TPM +1) of each gene in HIF3A signature gene set. The red box indicates the tumor samples, while the gray one represents the normal adjacent tissues. The HIF3A signature score level in NSCLC is significantly lower than normal tissues
FIGURE 2.

Expression of HIF3A in tumor and adjacent normal tissue of patients with NSCLC. In (A) LUAD and (B) LUSC groups, the relative HIF3A mRNA was significantly downgraded expression between tumor tissues compared with adjacent normal tissues; ***p < 0.001
FIGURE 3.
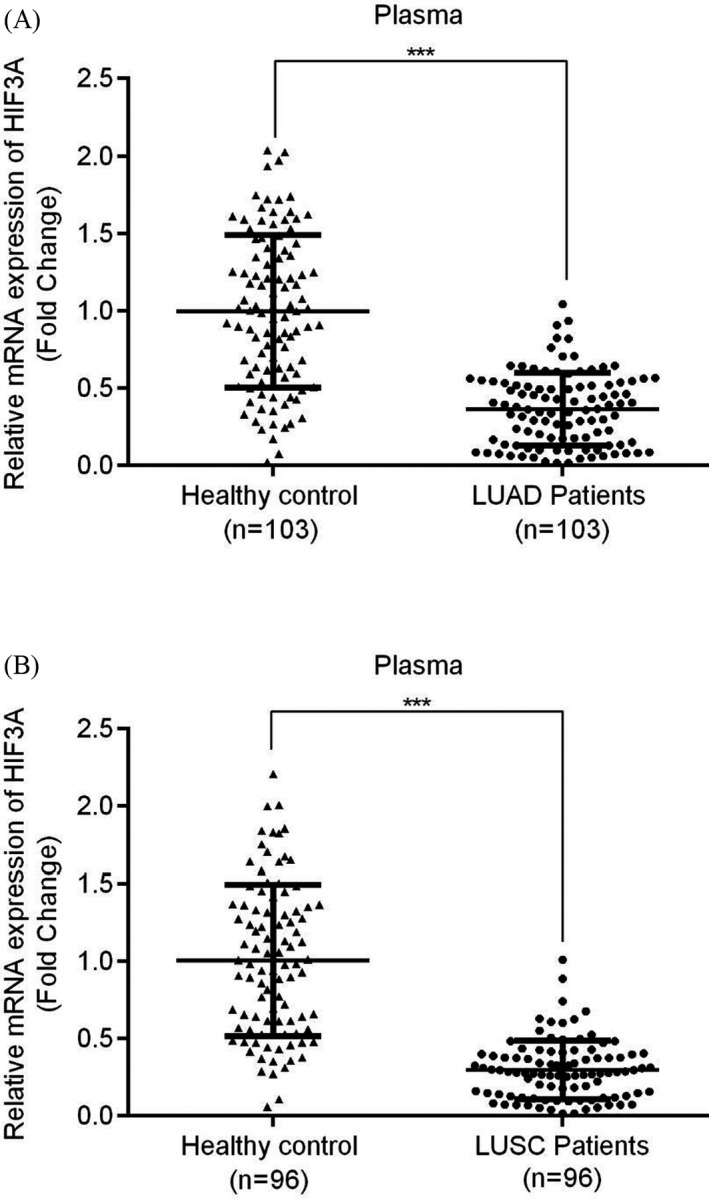
Expression of HIF3A in plasma samples of patients with NSCLC. (A) LUAD (B) LUSC both groups have significantly lower expression of HIF3A; ***p < 0.001
3.3. Correlation of HIF3A between plasma and tumor tissues
The correlation between plasma and tumor tissues with respect to HIF3A expression in 58 LUAD and 62 LUSC patients is shown by scatter plots. Here, the LUAD patients showed a significantly moderate positive relationship between plasma and tumor tissues for HIF3A expression (Figure 4A; r = 0.493, p < 0.001). Subsequently, a significant positive correlation was observed between the plasma and tumor tissues in LUSC patients (Figure 4B; r = 0.437, p < 0.004). Therefore, the expression level of HIF3A was directly correlated between the plasma and tumor tissues of NSCLC patients.
FIGURE 4.

Correlation analysis between plasma and tissue expression level of HIF3A in NSCLC. (A) LUAD and (B) LUSC groups represent the positive and significant correlation between plasma and tumor tissue expression of HIF3A
3.4. Efficacy of HIF3A in NSCLC
The efficacy of detection of HIF3A was reported using the ROC‐AUC phenomenon in the tumor tissues and plasma samples of LUAD and LUCS patients. First, the tumor tissues with HIF3A expression in LUAD patients significantly achieved an AUC of 0.9376 (95% CI = 0.8961–0.9791, cutoff value 0.4594, specificity 91.38%, and sensitivity 84.48%) (Figure 5A), whereas in LUSC tumor tissues, AUC was 0.849 (95% CI = 0.7832–0.9155, cutoff value 0.7266, specificity 77.42%, and sensitivity 80.65%) (Figure 5B). In this context, HIF3A expression showed higher detection efficiency in LUAD tumor tissues than in LUSC patients. Second, the plasma expression of HIF3A was observed to be significant with AUCs of 0.865 (95% CI = 0.8155–0.9149, cutoff value 0.5694, specificity 82.52%, and sensitivity 76.70%) and 0.924 (95% CI = 0.8863–0.9618, cutoff value 0.4310, specificity 89.58%, and sensitivity 82.29%) in LUAD and LUSC patients, respectively (Figure 6A,B). Conversely, the plasma samples showed a slightly lower AUC in the LUAD group than in the LUSC group. Overall, the plasma and tumor tissues of NSCLC patients demonstrated notable efficacies for the diverse detection of HIF3A mRNA.
FIGURE 5.

ROC curves of tumor tissue‐based HIF3A for patients with NSCLC. (A) LUAD (B) LUSC groups observed significant potential area under the curves (AUCs), for the tumor tissue‐based HIF3A
FIGURE 6.
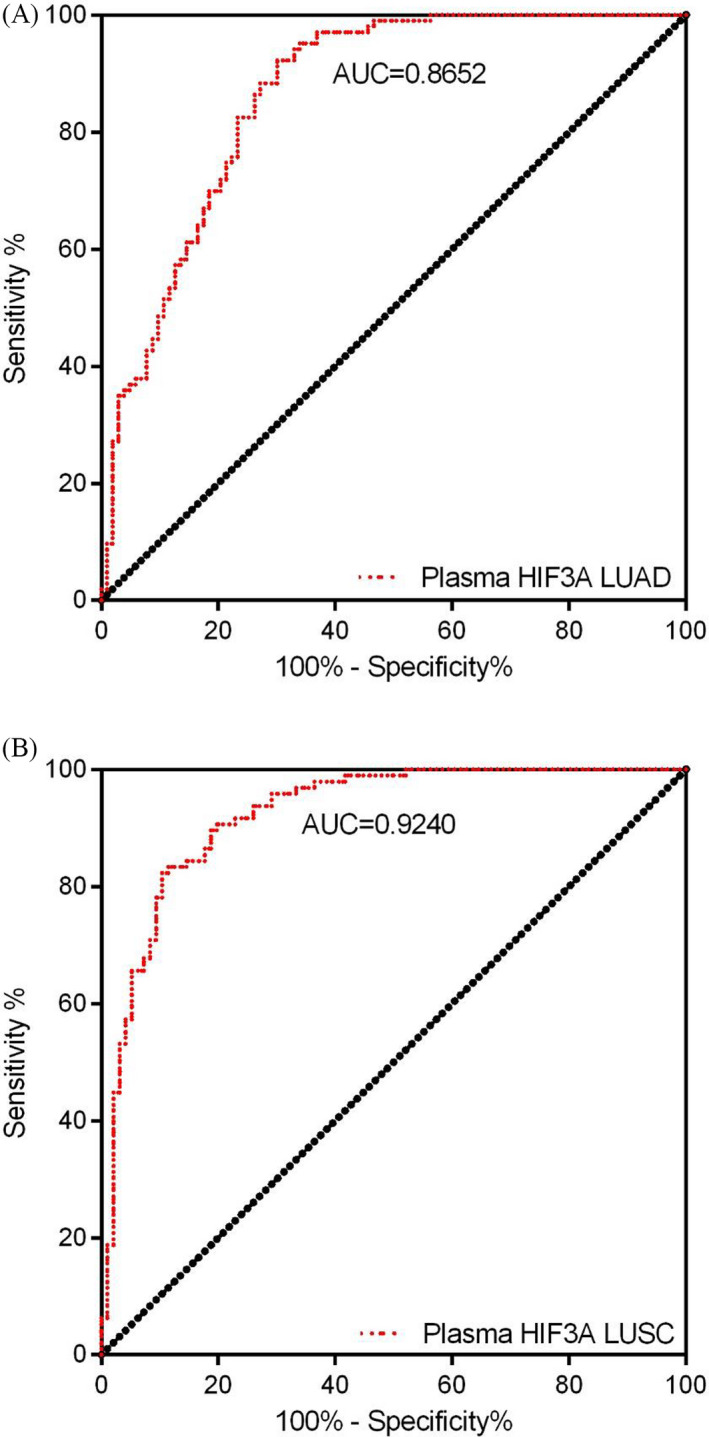
ROC of plasma‐based HIF3A for patients of NSCLC. (A) LUAD and (B) LUSC groups have achieved significant AUCs for plasma‐based HIF3A
4. DISCUSSION
The HIF3A gene is located on chromosome 19q13.2, which is 43 kb long and comprises 19 exons.14, 15 To date, ten diverse HIF3A transcripts have been observed.14, 15, 16, 17, 18 It was previously discovered that human HIF‐3 α 1 expression was induced by hypoxia19 and that the HIF‐3 α 4 variant was downregulated.15, 16 Evaluation of HIF3A‐regulated genes has considerably progressed in recent years. One transcriptomic study reported HIF3A expression in the lung epithelium of a transgenic mouse line. The study observed many upregulated genes that were linked to the development of lung, while 25 genes were downregulated by DNA microarray analysis of lung RNA. The authors further provided evidence that in cultured A549 cells, SOX2 was a direct target gene of HIF3A.20 Thus, HIF3A may exist in the lung epithelium and play a role in the hypoxic environment of cancer cells or adjacent normal cells, in association with other targeted genes.
Human HIF3A may play an opposing role to HIF‐1 and HIF‐2, which have a significant role in the development and progression of cancers. Jang et al.21 reported that human HIF‐3 α 4 blocks vascular endothelial growth factor (VEGF) expression by inducing hypoxia, and hindering cell migration and tube formation in human umbilical vein endothelial cells, thereby repressing the process of new blood vessel growth (angiogenesis). Meanwhile, Maynard et al.16, 17 found that the HIF3A variant was downregulated in primary clear cell renal cell carcinomas and that von Hippel‐Lindau (VHL) gene mutations activated the hypoxia response pathway, and further exogenous expression of HIF‐3 α 4 variants suppressed the advancement of VHL‐null renal cell carcinoma. Similarly, a previous study reported that variants of HIF3A were detected at an identifiable level in the cDNA panels of cancer cells and subsequently showed that the HIF3A‐based three alternative first exons were discovered at a downgraded extent in multiple cancer cell lines.18 However, there have been no previous reports on HIF3A mRNA expression in NSCLC. In this study, we first investigated HIF3A mRNA gene expression in NSCLC‐based plasma and tissue samples using RT‐PCR assays. The results showed that the mRNA expression of the HIF3A gene was significantly downregulated in the NSCLC‐based plasma or tissue samples compared with that in healthy controls and adjacent noncancerous tissues. Our study findings are consistent with the above‐mentioned studies in that HIF3A expression was downregulated in plasma or tumor tissue samples.
The exact molecular mechanisms of HIF3A in human cancer, specifically in NSCLC, remain unknown. HIF1 α and HIF2 α affect tumor progression by directly regulating distinctive and allocated target genes such as SCGB3A1 in NSCLC,22 and ADRP, ADAM1, BNIP3, CCND1, GLUT1, IL‐6, TGF α, and VEGF in renal cell carcinoma.4, 23, 24, 25, 26 HIF α proteins also influence tumor progression by applying definite and often contrasting effects on critical oncoproteins and tumor suppressors, including p53, MYC, and mTOR.4 Thus, our study may indicate that HIF3A could be involved in tumor formation, occurrence, and progression of NSCLC, and subsequent studies are needed to fully understand and evaluate this hypothesis. Moreover, the present study explored the correlation between plasma and tissue samples for HIF3A expression, and they were positively and significantly correlated with each other (p < 0.05).
In recent years, the prognosis and survival rates of NSCLC patients are closely associated with clinical tumor stages, representing a keen drop from approximately 70%–90% in early‐stage (I/II) patients to 5%–10% in patients with advanced stages (III/IV).27, 28 The soaring mortality rate is chiefly due to the lack of influential steps for early detection and diagnosis, as only 15% of lung cancers are determined or diagnosed at early stages.29 Thus, wide‐ranging endeavors are vital for improving the efficacy of early detection and diagnosis to improve overall survival. Furthermore, this study evaluated the diagnostic value of HIF3A using the ROC curve, which achieved a significantly higher AUC of 0.84~0.93, in plasma and tissue samples of LUAD and LUSC. Taken together, our data suggest that HIF3A might be a promising therapeutic or diagnostic target gene for the treatment of NSCLC.
Currently, there are no related studies that can prove the diagnostic value of HIF3A in LUAD or LUSC, and as this study had a smaller sample size, to confirm our findings, a larger number of samples are required. The present study did not record whether patients received any chemotherapy or radiotherapy treatments; therefore, subsequent validation is essential. HIF3A could act as a novel target to be comprehensively studied in hypoxic cancer biology. Further studies are needed to increase our understanding of the role of HIF3A in the occurrence and development of NSCLC.
5. CONCLUSION
Hypoxia‐inducible factor 3 alpha is aberrantly detectable in plasma and tumor tissues of NSCLC patients and is a potentially discoverable target gene that might play an effective role in LUAD and LUSC. HIF3A expression was notably downregulated in the plasma or tumor tissues of LUAD and LUSC patients compared with the plasma of the healthy control group or adjacent tumor tissues. The present study validated the expression of HIF3A and its clinical significance in NSCLC. HIF3A may be involved in hypoxic responses during tumor occurrence and development.
CONFLICT OF INTEREST
The authors declare that they have no potential conflicts of interest.
ACKNOWLEDGMENTS
Nothing to declare.
Wei L, Yuan N, Chen Y, Gong P. Aberrant expression of HIF3A in plasma of patients with non‐small cell lung cancer and its clinical significance. J Clin Lab Anal. 2021;35:e23889. 10.1002/jcla.23889
DATA AVAILABILITY STATEMENT
The datasets used and analyzed during the current study are available from the corresponding author on reasonable request.
REFERENCES
- 1.Bray F, Ferlay J, Soerjomataram I, Siegel RL, Torre LA, Jemal A. Global cancer statistics 2018: GLOBOCAN estimates of incidence and mortality worldwide for 36 cancers in 185 countries. CA Cancer J Clin. 2018;68(6):394‐424. 10.3322/caac.21492 [DOI] [PubMed] [Google Scholar]
- 2.Siegel RL, Miller KD, Jemal A. Cancer statistics, 2020. CA Cancer J Clin. 2020;70(1):7‐30. 10.3322/caac.21590 [DOI] [PubMed] [Google Scholar]
- 3.Ettinger DS, Wood DE, Akerley W, et al. Non–small cell lung cancer, version 6.2015. J Natl Compr Canc Netw. 2015;13(5):515‐524. 10.6004/jnccn.2015.0071 [DOI] [PubMed] [Google Scholar]
- 4.Keith B, Johnson RS, Simon MC. HIF1α and HIF2α: sibling rivalry in hypoxic tumour growth and progression. Nat Rev Cancer. 2011;12(1):9‐22. 10.1038/nrc3183 [DOI] [PMC free article] [PubMed] [Google Scholar]
- 5.Duan C. Hypoxia‐inducible factor 3 biology: complexities and emerging themes. Am J Physiol Cell Physiol. 2016;310(4):C260‐C269. 10.1152/ajpcell.00315.2015 [DOI] [PubMed] [Google Scholar]
- 6.Greer SN, Metcalf JL, Wang Y, Ohh M. The updated biology of hypoxia‐inducible factor. EMBO J. 2012;31(11):2448‐2460. 10.1038/emboj.2012.125 [DOI] [PMC free article] [PubMed] [Google Scholar]
- 7.Prabhakar NR, Semenza GL. Adaptive and maladaptive cardiorespiratory responses to continuous and intermittent hypoxia mediated by hypoxia‐inducible factors 1 and 2. Physiol Rev. 2012;92(3):967‐1003. 10.1152/physrev.00030.2011 [DOI] [PMC free article] [PubMed] [Google Scholar]
- 8.Semenza GL. Hypoxia‐inducible factors in physiology and medicine. Cell. 2012;148(3):399‐408. 10.1016/j.cell.2012.01.021 [DOI] [PMC free article] [PubMed] [Google Scholar]
- 9.Shay JE, Celeste SM. Hypoxia‐inducible factors: crosstalk between inflammation and metabolism. Semin Cell Dev Biol. 2012;23(4):389‐394. 10.1016/j.semcdb.2012.04.004 [DOI] [PubMed] [Google Scholar]
- 10.Shen C, Kaelin WG Jr. The VHL/HIF axis in clear cell renal carcinoma. Semin Cancer Biol. 2013;23(1):18‐25. 10.1016/j.semcancer.2012.06.001 [DOI] [PMC free article] [PubMed] [Google Scholar]
- 11.Heikkilä M, Pasanen A, Kivirikko KI, Myllyharju J. Roles of the human hypoxia‐inducible factor (HIF)‐3α variants in the hypoxia response. Cell Mol Life Sci. 2011;68(23):3885‐3901. 10.1007/s00018-011-0679-5 [DOI] [PMC free article] [PubMed] [Google Scholar]
- 12.Ando H, Natsume A, Iwami K, et al. A hypoxia‐inducible factor (HIF)‐3α splicing variant, HIF‐3α4 impairs angiogenesis in hypervascular malignant meningiomas with epigenetically silenced HIF‐3α4. Biochem Biophys Res Commun. 2013;433(1):139‐144. 10.1016/j.bbrc.2013.02.044 [DOI] [PubMed] [Google Scholar]
- 13.Wu K, Hu M, Chen Z, et al. Asiatic acid enhances survival of human AC16 cardiomyocytes under hypoxia by upregulating miR‐1290. IUBMB Life. 2017;69(9):660‐667. 10.1002/iub.1648 [DOI] [PubMed] [Google Scholar]
- 14.Hara S, Hamada J, Kobayashi C, Kondo Y, Imura N. Expression and characterization of hypoxia‐inducible factor (HIF)‐3alpha in human kidney: suppression of HIF‐mediated gene expression by HIF‐3alpha. Biochem Biophys Res Commun. 2001;287(4):808‐813. 10.1006/bbrc.2001.5659 [DOI] [PubMed] [Google Scholar]
- 15.Maynard MA, Qi H, Chung J, et al. Multiple splice variants of the human HIF‐3 alpha locus are targets of the von Hippel‐Lindau E3 ubiquitin ligase complex. J Biol Chem. 2003;278(13):11032‐11040. 10.1074/jbc.M208681200 [DOI] [PubMed] [Google Scholar]
- 16.Maynard MA, Evans AJ, Hosomi T, Hara S, Jewett MA, Ohh M. Human HIF‐3alpha4 is a dominant‐negative regulator of HIF‐1 and is down‐regulated in renal cell carcinoma. FASEB J. 2005;19(11):1396‐1406. 10.1096/fj.05-3788com [DOI] [PubMed] [Google Scholar]
- 17.Maynard MA, Evans AJ, Shi W, Kim WY, Liu FF, Ohh M. Dominant‐negative HIF‐3 alpha 4 suppresses VHL‐null renal cell carcinoma progression. Cell Cycle. 2007;6(22):2810‐2816. 10.4161/cc.6.22.4947 [DOI] [PubMed] [Google Scholar]
- 18.Pasanen A, Heikkilä M, Rautavuoma K, Hirsilä M, Kivirikko KI, Myllyharju J. Hypoxia‐inducible factor (HIF)‐3alpha is subject to extensive alternative splicing in human tissues and cancer cells and is regulated by HIF‐1 but not HIF‐2. Int J Biochem Cell Biol. 2010;42(7):1189‐1200. 10.1016/j.biocel.2010.04.008 [DOI] [PubMed] [Google Scholar]
- 19.Li QF, Wang XR, Yang YW, Lin H. Hypoxia upregulates hypoxia inducible factor (HIF)‐3alpha expression in lung epithelial cells: characterization and comparison with HIF‐1alpha. Cell Res. 2006;16(6):548‐558. 10.1038/sj.cr.7310072 [DOI] [PubMed] [Google Scholar]
- 20.Huang Y, Kapere Ochieng J, Kempen MB, et al. Hypoxia inducible factor 3α plays a critical role in alveolarization and distal epithelial cell differentiation during mouse lung development. PLoS One. 2013;8(2):e57695. 10.1371/journal.pone.0057695 [DOI] [PMC free article] [PubMed] [Google Scholar]
- 21.Jang MS, Park JE, Lee JA, et al. Binding and regulation of hypoxia‐inducible factor‐1 by the inhibitory PAS proteins. Biochem Biophys Res Commun. 2005;337(1):209‐215. 10.1016/j.bbrc.2005.09.038 [DOI] [PubMed] [Google Scholar]
- 22.Mazumdar J, Hickey MM, Pant DK, et al. HIF‐2alpha deletion promotes Kras‐driven lung tumor development. Proc Natl Acad Sci USA. 2010;107(32):14182‐14187. 10.1073/pnas.1001296107 [DOI] [PMC free article] [PubMed] [Google Scholar]
- 23.Hu CJ, Wang LY, Chodosh LA, Keith B, Simon MC. Differential roles of hypoxia‐inducible factor 1alpha (HIF‐1alpha) and HIF‐2alpha in hypoxic gene regulation. Mol Cell Biol. 2003;23(24):9361‐9374. 10.1128/mcb.23.24.9361-9374.2003 [DOI] [PMC free article] [PubMed] [Google Scholar]
- 24.Raval RR, Lau KW, Tran MG, et al. Contrasting properties of hypoxia‐inducible factor 1 (HIF‐1) and HIF‐2 in von Hippel‐Lindau‐associated renal cell carcinoma. Mol Cell Biol. 2005;25(13):5675‐5686. 10.1128/MCB.25.13.5675-5686.2005 [DOI] [PMC free article] [PubMed] [Google Scholar]
- 25.Hu CJ, Sataur A, Wang L, Chen H, Simon MC. The N‐terminal transactivation domain confers target gene specificity of hypoxia‐inducible factors HIF‐1alpha and HIF‐2alpha. Mol Biol Cell. 2007;18(11):4528‐4542. 10.1091/mbc.e06-05-0419 [DOI] [PMC free article] [PubMed] [Google Scholar]
- 26.Gunaratnam L, Morley M, Franovic A, et al. Hypoxia inducible factor activates the transforming growth factor‐alpha/epidermal growth factor receptor growth stimulatory pathway in VHL(‐/‐) renal cell carcinoma cells. J Biol Chem. 2003;278(45):44966‐44974. 10.1074/jbc.M305502200 [DOI] [PubMed] [Google Scholar]
- 27.Detterbeck FC. The eighth edition TNM stage classification for lung cancer: what does it mean on main street? J Thorac Cardiovasc Surg. 2018;155(1):356‐359. 10.1016/j.jtcvs.2017.08.138 [DOI] [PubMed] [Google Scholar]
- 28.Yang X, Zhang Q, Zhang M, et al. Serum microRNA signature is capable of early diagnosis for non‐small cell lung cancer. Int J Biol Sci. 2019;15(8):1712‐1722. 10.7150/ijbs.33986 [DOI] [PMC free article] [PubMed] [Google Scholar]
- 29.Zhou Y, Shen S. MiR‐520f acts as a biomarker for the diagnosis of lung cancer[J]. Medicine, 2019, 98(30):e16546. 10.1097/MD.0000000000016546 [DOI] [PMC free article] [PubMed]
Associated Data
This section collects any data citations, data availability statements, or supplementary materials included in this article.
Data Availability Statement
The datasets used and analyzed during the current study are available from the corresponding author on reasonable request.