

Abstract
Background
Acute pancreatitis (AP), one of the most common clinical emergencies, is characterized by variable clinical features and inadequate diagnostic methods. At present, the commonly used indicators do not have high specificity and do not necessarily reflect disease severity. We therefore aimed to investigate diagnostic and prognostic value of plasma procalcitonin, heparin‐binding protein, and interleukin‐6 for acute pancreatitis by separate detection and joint detection.
Methods
The study involved 451 participants, including 343 AP patients and 108 healthy controls. We analyzed the association of the three biomarkers with the severity and prognosis of AP.
Results
A statistically significant increase in the mean plasma analyte levels was detected in the study group compared to the control group. Multivariate comparison showed that plasma levels of PCT, HBP, and IL‐6 were all significantly different among the three groups at different sampling times (1st, 3rd, 7th, and 10th day of admission) (p < 0.01). The combination of the three indicators had significantly higher diagnostic value than either the individual markers or pairwise combinations (p < 0.001). The levels of the three were all significantly higher in severe acute pancreatitis (SAP) patients than in non‐SAP patients (p < 0.001); meanwhile, patients with high levels had a worse prognosis than those with low levels (p < 0.05). In multivariate analysis adjusted for age and sex, high levels of PCT, HBP, and IL‐6 were found to be independently associated with the development of AP.
Conclusions
It dramatically improved the diagnostic power of AP when PCT, HBP, and IL‐6 were combined; high PCT, HBP, and IL‐6 levels within 3 days of admission may be the potentially useful indicators for predicting SAP.
Keywords: acute pancreatitis, diagnose, heparin‐binding protein, interleukin‐6, predict, procalcitonin
For a single biomarker, the order of the AUC value was IL‐6 ˃ PCT ˃ HBP > 0.78, and each had a certain predictability. Surprisingly, the AUC of any pairwise combination was not higher than those of isolated individual biomarkers, that is, the combined use of any two markers was no more advantageous than single use in the prediction of SAP. When the three combined, the AUC, sensitivity, and specificity were 0.96, 90%, and 98%, respectively, showed 93% overall accuracy. Comparing various combinations, we found that the combination of the three biomarkers showed better predictive capability than any of the individual biomarkers or two biomarker combinations.

1. INTRODUCTION
Acute pancreatitis (AP) is an inflammatory reaction caused by the activated pancreatic enzymes in the pancreas, which leads to subsequent pancreatic autodigestion, edema, hemorrhage, necrosis, and even distal organ dysfunction.1, 2 A majority of AP patients have mild symptoms and a favorable prognosis, whereas 20% of AP patients develop severe acute pancreatitis, characterized by rapid progression, poor prognosis, and a high mortality rate of 30%.3, 4, 5 AUCs of conventional evaluation systems typically range from 0.6 to 0.8, and their broad application is limited by inherent complexity.6 For this reason, accurate and timely diagnosis and prediction are essential to prevent various complications of AP.
In recent years, with rapid advances in vitro diagnostic tests, researches on more biomarkers for AP have received extensive attention. Conventional markers such as amylase, lipase, CRP, and leukocytes are less specific in assessing the severity of AP.7, 8, 9 Control of the systemic inflammatory response is a key factor in the prognosis of AP; thus, pro‐inflammatory markers can be mined as potential diagnostic and prognostic indicators of AP. Procalcitonin (PCT), one of the specific markers for the diagnosis of bacterial infection, is of crucial value for the early prediction of the severity of necrotizing pancreatitis.10 Heparin‐binding protein (HBP) has emerged as another inflammatory agent due to its biological functions of enhancing vascular endothelial cell permeability, activating inflammatory cells, and promoting inflammatory responses.11, 12 As an anti‐inflammatory cytokine, interleukin‐6 (IL‐6) may play an important role in the pathogenesis of AP through its anti‐inflammatory effects.13
To our knowledge, the present study is the first report to explore the diagnostic and prognostic value of the combination of three markers in patients with AP.
2. MATERIALS AND METHODS
2.1. Subjects
A total of 343 AP patients (225 males and 118 females) and 108 healthy controls were involved in this study from the Department of Surgery, the Second Affiliated Hospital of Zhejiang University School of Medicine, between October 2019 and October 2020. All patients who were admitted to our hospital within 24 h of onset met the guidelines for the Diagnosis and Treatment of Acute Pancreatitis revised in 2019 by the Pancreatic Surgical Science Section of the Chinese Medical Association Surgery Branch.
The inclusion criteria for AP patients were as follows: (1) confirmed diagnosis of AP; (2) aged between 18 and 75 years; and (3) patients with first onset and admitted to hospital within 24 h of onset. The exclusion criteria were as follows: (1) autoimmune pancreatitis, immunodeficiency disease, or immunosuppressive drugs used in the past 6 months; (2) patients with malignant tumors; (3) pregnant women and children; and (4) lack of complete medical record information. According to the severity of pancreatitis, the study group was divided into three groups: MAP, MSAP, and SAP. During the same period, a total of 108 healthy individuals served as the control group. The age, gender, and demographic information for each group is presented in Table 1.
TABLE 1.
Demographic data and clinical characteristics of the four groups
| Clinical characteristics |
Controls (N = 108) |
MAP (N = 214) |
MSAP (N = 78) |
SAP (N = 51) |
Total (N = 451) |
p Value |
|---|---|---|---|---|---|---|
| Gender, n (%) | ||||||
| Male | 57 (52.78) | 137 (64.02) | 50 (64.10) | 38 (74.51) | 282 (62.53) | 0.021 |
| Female | 51 (47.22) | 77 (35.98) | 28 (35.90) | 13 (25.49) | 169 (37.47) | |
| Age in years | ||||||
| Mean ± SD | 43.30 ± 10.50 | 47.37 ± 11.77 | 49.55 ± 12.09 | 51.84 ± 13.16 | 47.27 ± 11.97 | 0.261 |
| Range | 25–67 | 28–67 | 24–69 | 27–68 | 24–70 | — |
| Etiology, n (%) | 0.820 | |||||
| Biliary pancreatitis | — | 87 (40.65) | 31 (39.74) | 18 (35.29) | 136 (39.65) | — |
| Alcoholicity | — | 63 (29.44) | 26 (33.33) | 21 (41.18) | 110 (32.07) | — |
| Hypertriglyceridemia | — | 42 (19.63) | 13 (16.67) | 8 (15.69) | 63 (18.37) | — |
| Other | — | 22 (10.28) | 8 (10.26) | 4 (7.84) | 34 (9.91) | — |
| BMI, (kg/m2), mean ± SD | — | 23.54 ± 3.73 | 25.54 ± 5.27 | 25.00 ± 3.98 | 24.68 ± 4.29 | 0.688 |
| Scoring system | ||||||
| APACHE II (IQR) | — | 5.92 ± 2.43 | 7.08 ± 3.42 | 12.75 ± 5.43 | — | 0.00 |
| BISAP | — | 0 (0–1) | 4 (1–2) | 6 (2–5) | — | 0.00 |
| SIRS score (IQR) | — | 0 (0–1) | 8 (1–2) | 7 (2–4) | — | 0.00 |
Abbreviations: APACHE II, Acute Physiological And Chronic Health Evaluation II; BISAP, Bedside Index for Severity in Acute Pancreatitis; BMI, Body Mass Index; MAP, Mild Acute Pancreatitis; MSAP, Moderately Severe Acute Pancreatitis; SAP, Severe Acute Pancreatitis; SD, Standard Deviation; SIRS, Systemic Inflammatory Response Syndrome.
The exemption of this study was granted by the Institutional Review Board (IRB) of the Second Affiliated Hospital of Zhejiang University School of Medicine because of a retrospective study and directly anonymous patient information.
2.2. Prognostic subgroups
According to the clinical outcome within 28 days, all patients were divided into the death group and survival group, while the survival group included four subgroups based on the clinical manifestations: pancreatic infection and necrosis, pancreatic tissue accumulation, extrapancreatic infection, and new‐onset diabetes, some of which overlapped with each other.
2.3. Clinical data collection
The clinical information of AP patients who met the enrollment criteria was collected from the medical record. (1) Information at the time of hospitalization: sex, age, body mass index, time of abdominal pain onset, etiology, medical history, and length of hospital and ICU stay. (2) Scoring System: APACHE II (Acute Physiology and Chronic Health Evaluation II) score, BISAP (Bedside Index for Severity in AP), and SIRS (systemic inflammatory response syndrome) score were evaluated for each patient within 24, 24, and 48 h of admission, respectively. (3) Laboratory indicators: plasma levels of PCT, HBP, and IL‐6 on days 1, 3, 7, and 10 after admission for all patients in this study. (4) Patient outcomes: death, infectious pancreatic necrosis, necrotic tissue accumulation, septic shock, new‐onset diabetes, and extrapancreatic infection.
2.4. Statistical analysis
SPSS 22.0 software was employed for data analysis, and GraphPad Prism 8.0 software was used for graphing. ROC curve was plotted by MedCalc Statistical Software. Categorical variables were presented as numbers and percentages (n, %), and the significance was analyzed by Pearson's chi‐square test or Fisher's exact probability test. Continuous variables were presented as mean and standard deviation (x ± SD) or median and interquartile range (IQR), and comparisons between different groups were performed using nonparametric Mann‐Whitney tests for skewed distributed variables or t tests for normally distributed variables. Independent predictors were determined by multivariate logistic regression model. p < 0.05 was considered statistically significant.
3. RESULTS
3.1. Demographic data and basic characteristics
There were no significant differences in age, etiology, and body mass index (BMI) among the four groups, while the APACHE II score, SIRS, and BISAP score were significantly increased in the SAP group (p < 0.01) (Table 1).
3.2. Comparison of plasma PCT, HBP, and IL‐6 levels in different groups
Multivariate comparisons indicated that except for IL‐6 levels on days 7 and 10 did not differ between MAP and MSAP group, there were significant differences among the three groups in PCT, HBP, and IL‐6 variables at different sampling times (1st, 3rd, 7th, and 10th day after admission) (Figure 1).
FIGURE 1.
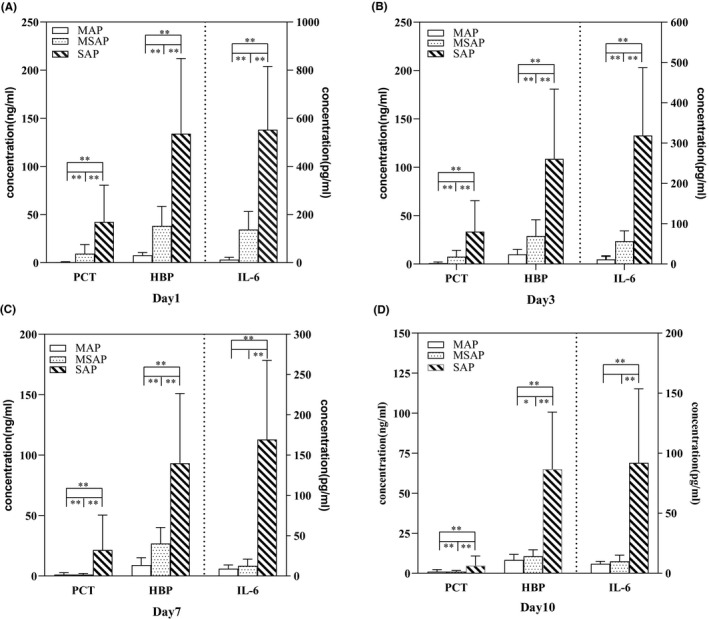
Comparison of plasma PCT, HBP, and IL‐6 levels among different groups at 1 (A); 3 (B); 7 (C); and 10 (D) days after admission. HBP, heparin‐binding protein; IL‐6, Interleukin‐6; PCT, procalcitonin
Plasma PCT, HBP, and IL‐6 concentrations were positively correlated with the severity of AP. As shown in Figure 2, the levels of the three markers on day 1 in the SAP group were significantly higher than those in non‐SAP group (PCT: (47.24 ± 38.14) ng/ml vs (23.53 ± 47.34) ng/ml, p < 0.001; HBP: (134.0 ± 78.13) ng/ml vs (20.13 ± 20.01) ng/ml, p < 0.001; IL‐6: (552.3 ± 264.1) pg/ml vs (97.90 ± 85.47) pg/ml, p < 0.001). Similarly, the same results were obtained on days 3, 7, and 10.
FIGURE 2.
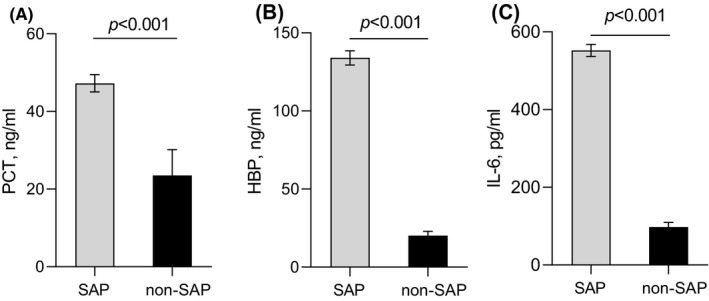
Comparison of plasma PCT (A), HBP (B), and IL‐6 (C) levels between SAP and non‐SAP group at day 1. The error bars represent mean ± SEM. HBP, heparin‐binding protein; IL‐6, Interleukin‐6; PCT, procalcitonin; SAP, severe acute pancreatitis
3.3. Predictive value of PCT, HBP, and IL‐6 in SAP
Since the plasma levels of PCT, HBP, and IL‐6 were significantly higher in SAP patients, ROC curves of the three indicators for D1, with the most significant statistical differences, were plotted to predict SAP occurrence (Figure 3). The areas under the ROC curve were 0.85 (95% CI, 0.77–0.92), 0.79 (95% CI, 0.70–0.87), and 0.88 (95% CI, 0.80–0.93) for PCT, HBP, and IL‐6, respectively. Sensitivity/specificity/cut‐off of PCT were 68.63%/92.16%/7.89 ng/ml, respectively, those of HBP were 70.59%/88.24%/85.8 ng/ml, and those of IL‐6 were 70.59%/90.20%/167 pg/ml, respectively.
FIGURE 3.
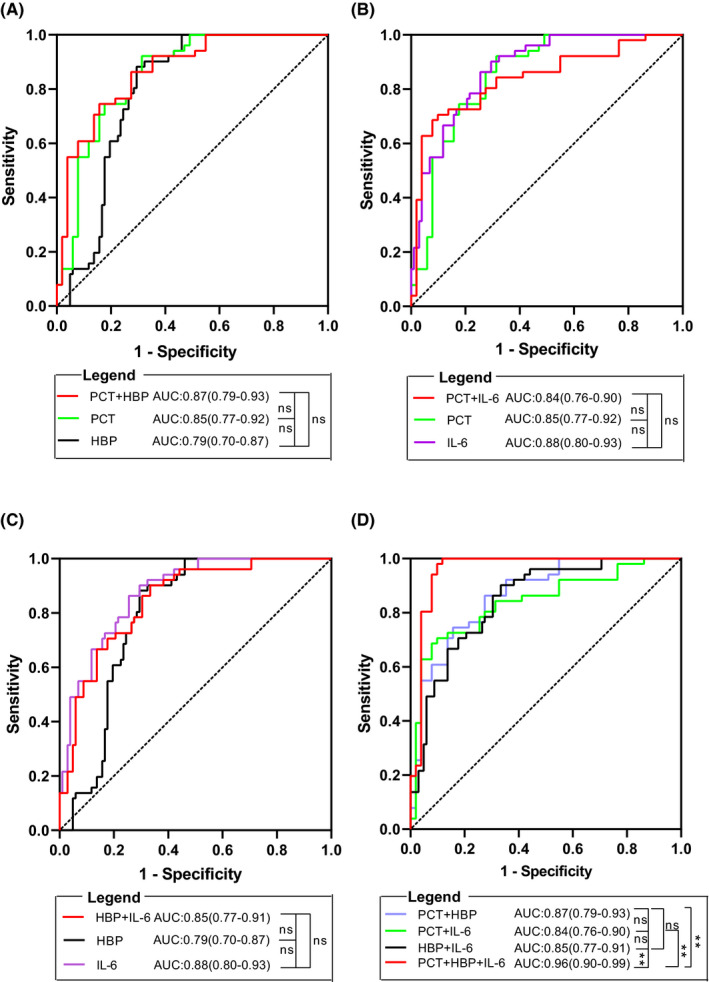
ROC curves for PCT, HBP, IL‐6, and combination model in prediction of SAP. (A) curves for PCT, HBP, and PCT combined with HBP. (B) curves for PCT, IL‐6, and PCT combined with IL‐6. (C) curves for HBP, IL‐6, and HBP combined with IL‐6. (D) curves for pairwise combinations and combinations of three indicators. HBP, heparin‐binding protein; IL‐6, Interleukin‐6; PCT, procalcitonin; SAP, severe acute pancreatitis
A combined diagnostic model was developed based on logistic regression analysis. The AUC, sensitivity, specificity, accuracy, +LR, ‐LR, PPV, and NPV of combined detection are shown in Table 2 and Figure 3.
TABLE 2.
Diagnostic value of PCT, HBP, and IL‐6 in SAP and methodological comparison
| Biomarker | AUC (95% CI) |
Cut‐off (ng/ml) |
Sensitivity (%) |
Specificity (%) |
Accuracy (%) |
+LR | −LR | PPV (%) | NPV (%) |
|---|---|---|---|---|---|---|---|---|---|
| PCT | 0.85 (0.77–0.92) | 7.89 | 68.63 | 92.16 | 79.41 | 8.75 | 0.34 | 89.7 | 74.6 |
| HBP | 0.79 (0.70–0.87) | 85.8 | 70.59 | 88.24 | 77.45 | 6.00 | 0.33 | 85.7 | 75.0 |
| IL−6 | 0.88 (0.80–0.93) | 0.167 | 70.59 | 90.20 | 79.41 | 7.20 | 0.33 | 87.8 | 75.4 |
| PCT + HBP | 0.87 (0.79–0.93) | — | 84.30 | 74.50 | 79.41 | 3.33 | 0.21 | 76.8 | 82.6 |
| PCT + IL−6 | 0.84 (0.76–0.90) | — | 92.16 | 68.63 | 75.50 | 2.94 | 0.11 | 74.6 | 89.7 |
| HBP + IL−6 | 0.85 (0.77–0.91) | — | 66.67 | 90.20 | 76.47 | 6.80 | 0.37 | 87.2 | 73.0 |
| PCT + HBP + IL−6 | 0.96 (0.90–0.99) | — | 90.20 | 98.04 | 93.14 | 46.00 | 0.10 | 97.9 | 90.9 |
Abbreviations: AUC, area under the curve; CI, confidence interval; HBP, heparin‐binding protein; IL‐6, interleukin‐6; LR, likelihood ratio; NPV, negative predictive value; PCT, procalcitonin; PPV, positive predictive value.
3.4. Comparison of plasma PCT, HBP, and IL‐6 in different prognostic subgroups
We divided all patients into two groups according to the PCT cut‐off value: 221 patients with high PCT (≥7.89 ng/ml) and 122 patients with low PCT (<7.89 ng/ml) (Table 3). Each group was then further subdivided into four subgroups depending on clinical outcomes. Subsequent analysis showed that patients with high PCT levels had a significantly worse prognosis than those with low PCT levels, including in‐hospital mortality (0% vs 15.6%, p < 0.01), infectious pancreatic necrosis (7.3% vs 46.7%, p < 0.01), necrotic tissue accumulation (17.6% vs 54.9%, p < 0.01), extrapancreatic infection (21.3% vs 41.8%, p < 0.01), length of hospital stay (8 [5–13] vs 15 [8–16] days, p < 0.01), and length of ICU stay (7 [5–8.5] vs 15 [13–16] days, p < 0.01). However, no statistically significant difference was observed between the two groups in terms of new‐onset diabetes (6.3% vs 12.3%, p = 0.100).
TABLE 3.
Clinical prognosis of different subgroups
| Outcome |
Total (N = 343) |
PCT (ng/ml) |
HBP (ng/ml) | IL−6 (pg/ml) | ||||||
|---|---|---|---|---|---|---|---|---|---|---|
|
<7.89 (N = 221) |
≥7.89 (N = 122) |
p Value |
<85.8 (N = 246) |
≥85.8 (N = 97) |
p Value |
<167 (N = 157) |
≥167 (N = 186) |
p Value | ||
| Death, n (%) | 19 (5.6) | 0 (0) | 19 (15.6) | 0.000 | 3 (1.22) | 16 (16.5) | 0.000 | 4 (2.55) | 15 (8.06) | 0.021 |
| Survival, n (%) | 324 (94.4) | 221 (100) | 103 (84.4) | 0.000 | 243 (98.8) | 81 (83.5) | 0.000 | 144 (9.17) | 180 (96.8) | 0.036 |
| Infectious pancreatic necrosis | 73 (21.2) | 16 (7.3) | 57 (46.7) | 0.000 | 49 (19.9) | 24 (27.4) | 0.042 | 42 (26.8) | 31 (16.7) | 0.016 |
| Necrotic tissue accumulation | 106 (30.9) | 39 (17.6) | 67 (54.9) | 0.000 | 69 (28.0) | 37 (38.1) | 0.046 | 27 (17.2) | 79 (42.5) | 0.000 |
| Extrapancreatic infection | 98 (28.6) | 47 (21.3) | 51 (41.8) | 0.000 | 41 (16.7) | 57 (58.8) | 0.000 | 30 (21.0) | 68 (34.9) | 0.000 |
| New‐onset diabetes | 29 (8.5) | 14 (6.3) | 15 (12.3) | 0.100 | 9 (3.66) | 20 (20.6) | 0.000 | 19 (12.1) | 10 (5.38) | 0.021 |
| Length of hospital stay, median (IQR) | 12 (7–16) | 8 (5–13) | 15 (8–16) | 0.004 | 8.5 (4.25–13) | 14 (7.5–16) | 0.024 | 7.5 (5.75–15) | 14 (9–16) | 0.031 |
| Length of ICU stay, median (IQR) | 8 (6.0–12.5) | 7 (5–8.5) | 15 (13–16) | 0.000 | 5.5 (4.0–8.25) | 10 (7.0–14.25) | 0.000 | 7 (5.25–7.75) | 11 (6.25–14.75) | 0.013 |
Abbreviations: HBP, heparin‐binding protein; ICU, Intensive Care Unit; IL‐6, Interleukin‐6; IQR, interquartile range; PCT, procalcitonin.
Similarly, the patients were split into different two groups based on the cut‐off values of 85.8 ng/ml and 167 pg/ml for HBP and IL‐6, respectively. Clinical outcomes were similar to those of the PCT groups, implying that the elevated levels of HBP or IL‐6 were also related to poor prognosis.
3.5. Independent predictors of acute pancreatitis
Prognosis was taken as a dependent variable, and the patient's age, gender, BMI, and plasma PCT, HBP, and IL‐6 levels on day 1 were used as independent variables, the gender covariates were adjusted: female = 1, male = 0 as reference category; the age variable was categorized: 35 years or older = 1, under 35 years = 0 as reference category. As shown in Figure 4, there was no correlation between age and prognosis (p = 0.165). Female gender, BMI, PCT, HBP, and IL‐6 were found to be independent predictors of AP by multiple logistic regression analysis (p < 0.01).
FIGURE 4.
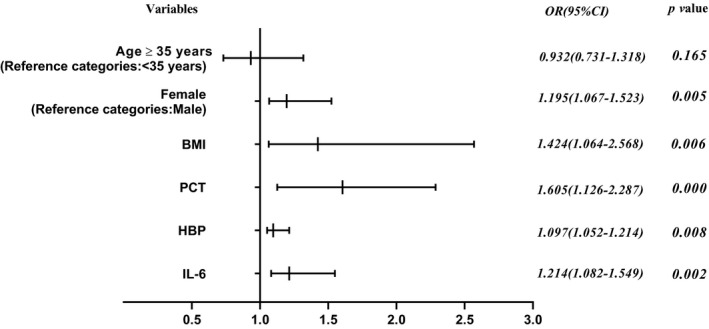
Independent predictors of acute pancreatitis. ORs of each variable were obtained using multivariate logistic regression models
4. DISCUSSION
Acute pancreatitis is one of the most common acute abdominal conditions in surgical hospitalization. The disease progresses rapidly, and the case fatality rate may reach up to 50% once secondary infection occurs; thus, the assessment of disease severity and outcome is of great significance to improve patient prognosis.14 The scoring systems such as APACHE II, BISAP, and SIRS score are often used to evaluate the disease in clinical practice; however, they are complex and cumbersome with a high false‐positive rate that bring some inconvenience to clinical implementation and limit their broader application.15, 16 Recent studies have shown that the inflammatory cytokines and transmitters are closely related to the pathogenesis of AP, and they can be used as biological indicators to diagnose and predict AP.17
Procalcitonin is a hormone‐free active precursor of calcitonin secreted by paraspinal thyroid cells, and its serum concentration is closely related to infection or organ failure.18 HBP, refers to granule proteins derived from neutrophils, has antimicrobial activity and active roles in inflammatory responses.19 HBP is positively correlated with PCT levels and may therefore also serve as an indirect biomarker for early diagnosis of infection.20 It has been studied in several acute diseases, such as acute kidney injury,21 acute lung injury,22 bacterial skin infection,23 acute bacterial meningitis,24 but rarely in AP. IL‐6 is one of the more well‐studied cytokines that rapidly decreases within 48 h unless severe infection persists.13 Presently, IL‐6 has been used for precise stratification of complex disease course in some hospitals. In our study, there were no significant differences in plasma PCT/IL‐6/HBP levels between the MAP group and the control group at different sampling times, whereas HBP levels differed between the MSAP group and the control group on day 7. We found that in SAP group, the PCT, HBP, and IL‐6 values measured on day 1 were significantly higher than those measured on day 10 (42.24 ng/ml, 134 ng/ml, and 552.3 pg/ml vs 4.74 ng/ml, 64.99 ng/ml, and 91.92 pg/ml, respectively). Based on our statistical results, early monitoring of three biomarkers plays an important role in the diagnosis of AP, which is consistent with the related reports.17, 25
In the current study, we divided AP patients into SAP and non‐SAP (MAP and MSAP), and the mean plasma concentrations of all analyzed biomarkers in SAP group were significantly increased compared to the non‐SAP group, indicating that plasma levels of the biomarkers were positively correlated with the severity of AP. We observed the changes of PCT, HBP, and IL‐6 in peripheral blood over a 10‐day period, and the day 1 was found to be the time point with the most statistical difference between SAP and non‐SAP. The diagnostic efficiency of different biomarkers based on the ROC curves and relative values varies greatly among studies,26, 27 probably due to different observation times and different treatment options. In our study, for a single biomarker, the order of the AUC value was IL‐6 ˃ PCT ˃ HBP > 0.78, and each had a certain predict ability. Surprisingly, the AUC of any pairwise combination was not higher than those of individual biomarkers alone; that is, the combined use of any two markers was no more advantageous than single use in the prediction of SAP. When the three combined, the AUC, sensitivity, and specificity were 0.96, 90%, and 98%, respectively, showed 93% overall accuracy. Comparing various combinations, we found that the combination of the three biomarkers showed better predictive capability than any of the individual biomarkers or two biomarker combinations.
Infection is an important factor affecting the course and prognosis of SAP patients. The mortality rate of sepsis and multiple organ failure caused by secondary pancreatic and peripancreatic infection is as high as 50%.25 Semmlack S' study suggested that APACHE II scoring system, which was based only on acute physiology and health assessments, was less effective in assessing complications.28 A multicenter trial revealed that at a PCT value of 3.8 ng/ml within 96 h after the onset of symptoms, diagnostic sensitivity and specificity for pancreatic necrosis or death were 93% and 79%, respectively.29 Some studies have also confirmed the potential value of IL‐6 as a prognostic indicator in SAP.30, 31 However, to the best of our knowledge, to date, only 1 study published in 2020 has reported the use of HBP to predict persistent organ failure in AP patients with a specificity of 74%, a sensitivity of 90%, and an AUC of 0.82.25 Our study revealed that the concentrations of analyzed biomarkers were all significantly higher in deaths than in survivors, suggesting that elevated levels were important risk factors for the development of AP. In addition, these three biomarkers showed similar changes: plasma levels increased significantly in cases of infectious pancreatic necrosis, necrotic tissue accumulation, and extrapancreatic infection. HBP and IL‐6, however, had advantages in predicting new‐onset diabetes, while PCT did not. Our statistics showed that the analyzed biomarkers achieved good results in predicting length of hospital stay and ICU stay, which made them interesting parameters for early risk stratification. Accordingly, we concluded that the three indicators can reflect the situation of infection and necrosis of SAP and can be used as effective biomarkers for SAP screening and severity prediction.
Given a single‐center study with small sample size in our study, this needs to be further confirmed by multicenter prospective and randomized researches. Nonetheless, this article suggests that as long as the testing conditions are available, various medical units should strengthen the monitoring of the above indicators to help clinicians determine the intensity and scope of treatment, promote the rational application of medical resources, and maximize the quality of medical care.
In summary, the diagnostic and prognostic value was demonstrated in our study: the combined detection of plasma PCT, HBP, and IL‐6 provided a new idea for the diagnosis of patients with AP; increased concentrations of PCT, HBP, or IL‐6 within 3 days of admission were associated with AP severity and poor prognosis; high concentrations of PCT, HBP, or IL‐6 may be the useful predictors of SAP and the independent risk factors for AP.
Zhong Y, Yu Z, Wang L, Yang X. Combined detection of procalcitonin, heparin‐binding protein, and interleukin‐6 is a promising assay to diagnose and predict acute pancreatitis. J Clin Lab Anal. 2021;35:e23869. 10.1002/jcla.23869
Funding information
Educational Commission of Zhejiang Province, Grant/Award Number: Y201838965; Health Commission of Zhejiang Province, Grant/Award Number: 2019318785
DATA AVAILABILITY STATEMENT
The datasets used and/or analyzed during the current study are available from the corresponding author on reasonable request.
REFERENCES
- 1.Kylänpää ML, Repo H, Puolakkainen PA. Inflammation and immunosuppression in severe acute pancreatitis. World J Gastroenterol. 2010;16(23):2867‐2872. [DOI] [PMC free article] [PubMed] [Google Scholar]
- 2.Gukovskaya AS, Gukovsky I, Algül H, Habtezion A. Autophagy, inflammation, and immune dysfunction in the pathogenesis of pancreatitis. Gastroenterology. 2017;153(5):1212‐1226. [DOI] [PMC free article] [PubMed] [Google Scholar]
- 3.Leppäniemi A, Tolonen M, Tarasconi A, et al. Executive summary: WSES Guidelines for the management of severe acute pancreatitis. J Trauma Acute Care Surg. 2020;88(6):888‐890. [DOI] [PubMed] [Google Scholar]
- 4.Garg PK, Singh VP. Organ failure due to systemic injury in acute pancreatitis. Gastroenterology. 2019;156(7):2008‐2023. [DOI] [PMC free article] [PubMed] [Google Scholar]
- 5.Schepers NJ, Bakker OJ, Besselink MG, et al. Impact of characteristics of organ failure and infected necrosis on mortality in necrotising pancreatitis. Gut. 2019;68(6):1044‐1051. [DOI] [PubMed] [Google Scholar]
- 6.Mounzer R, Langmead CJ, Wu BU, et al. Comparison of existing clinical scoring systems to predict persistent organ failure in patients with acute pancreatitis. Gastroenterology. 2012;142(7):1476‐1482. [DOI] [PubMed] [Google Scholar]
- 7.Wu Y, Potempa LA, El Kebir D, Filep JG. C‐reactive protein and inflammation: conformational changes affect function. Biol Chem. 2015;396(11):1181‐1197. [DOI] [PubMed] [Google Scholar]
- 8.Bernabeu MO, Köry J, Grogan JA, et al. Abnormal morphology biases hematocrit distribution in tumor vasculature and contributes to heterogeneity in tissue oxygenation. Proc Natl Acad Sci USA. 2020;117(45):27811‐27819. [DOI] [PMC free article] [PubMed] [Google Scholar]
- 9.Ismail OZ, Bhayana V. Lipase or amylase for the diagnosis of acute pancreatitis? Clin Biochem. 2017;50(18):1275‐1280. [DOI] [PubMed] [Google Scholar]
- 10.Smeets XJNM, Litjens G, Gijsbers K, et al. The accuracy of pancreatic perfusion computed tomography and angiography in predicting necrotizingpancreatitis: a systematic review. Pancreas. 2018;47(6):667‐674. [DOI] [PubMed] [Google Scholar]
- 11.Fisher J, Linder A. Heparin‐binding protein: a key player in the pathophysiology of organ dysfunction in sepsis. J Intern Med. 2017;281(6):562‐574. [DOI] [PubMed] [Google Scholar]
- 12.Kaukonen K‐M, Linko R, Herwald H, et al. Heparin‐binding protein (HBP) in critically ill patients with influenza A(H1N1) infection. Clin Microbiol Infect. 2013;19(12):1122‐1128. [DOI] [PubMed] [Google Scholar]
- 13.Mayer J, Rau B, Gansauge F, Beger HG. Inflammatory mediators in human acute pancreatitis: clinical and pathophysiological implications. Gut. 2000;47(4):546‐552. [DOI] [PMC free article] [PubMed] [Google Scholar]
- 14.Tian F, Li H, Wang L, et al. The diagnostic value of serum C‐reactive protein, procalcitonin, interleukin‐6 and lactate dehydrogenase in patients with severe acute pancreatitis. Clin Chim Acta. 2020;510:665‐670. [DOI] [PubMed] [Google Scholar]
- 15.Li M, Xing XK, Lu ZH, et al. Comparison of scoring systems in predicting severity and prognosis of hypertriglyceridemia‐induced acute pancreatitis. Dig Dis Sci. 2020;65(4):1206‐1211. [DOI] [PubMed] [Google Scholar]
- 16.Khanna AK, Meher S, Prakash S, et al. Comparison of Ranson, Glasgow, MOSS, SIRS, BISAP, APACHE‐II, CTSI scores, IL‐6, CRP, and procalcitonin in predicting severity, organ failure, pancreatic necrosis, and mortality in acute pancreatitis. HPB Surg. 2013;2013: 367581. [DOI] [PMC free article] [PubMed] [Google Scholar]
- 17.Sebastian MS, Daniel O, Christian AN. Laboratory markers predicting severity of acute pancreatitis. Crit Rev Clin Lab Sci. 2015;52(6):273‐283. [DOI] [PubMed] [Google Scholar]
- 18.Lipińska GM, Mierzchała PM, Durek G. Procalcitonin kinetics ‐ prognostic and diagnostic significance in septic patients. Arch Med Sci. 2016;12(1):112‐119. [DOI] [PMC free article] [PubMed] [Google Scholar]
- 19.Gisela H, Victoria P, Fredrik K, Arne E, Lisa IP. Heparin‐binding protein in sputum as a marker of pulmonary inflammation, lung function, and bacterial load in children with cystic fibrosis. BMC Pulm Med. 2018;18(1):104. [DOI] [PMC free article] [PubMed] [Google Scholar]
- 20.Yang Y, Liu G, He Q, et al. A promising candidate: heparin‐binding protein steps onto the stage of sepsis prediction. J Immunol Res. 2019;2019:e7515346. [DOI] [PMC free article] [PubMed] [Google Scholar]
- 21.Tverring J, Vaara ST, Fisher J, et al. Heparin‐binding protein (HBP) improves prediction of sepsis‐related acute kidney injury. Ann Intensive Care. 2017;7(1):105. [DOI] [PMC free article] [PubMed] [Google Scholar]
- 22.Tydén J, Herwald H, Sjöberg F, Johansson J. Increased plasma levels of heparin‐binding protein on admission to intensive care are associated with respiratory and circulatory failure. PLoS One. 2016;11(3):e0152035. [DOI] [PMC free article] [PubMed] [Google Scholar]
- 23.Linder A, Johansson L, Thulin P, et al. Erysipelas caused by group A streptococcus activates the contact system and induces the release of heparin‐binding protein. J Invest Dermatol. 2010;130(5):1365‐1372. [DOI] [PubMed] [Google Scholar]
- 24.Kandil M, Khalil G, El‐Attar E, Shehata G, Hassan S. Accuracy of heparin binding protein: as a new marker in prediction of acute bacterial meningitis. Braz J Microbiol. 2018;49(Suppl 1):213‐219. [DOI] [PMC free article] [PubMed] [Google Scholar]
- 25.Shu W, Wan J, Yang X, et al. Heparin‐binding protein levels at admission and within 24 h are associated with persistent organ failure in acute pancreatitis. Dig Dis Sci. 2020. 10.1007/s10620-020-06660-1 [DOI] [PubMed] [Google Scholar]
- 26.Liang Y, Zhao X, Meng F. Procalcitonin, C‐reactive protein, and neutrophil ratio contribute to the diagnosis and prognosis of severe acute pancreatitis. Iran J Public Health. 2019;48(12):2177‐2186. [PMC free article] [PubMed] [Google Scholar]
- 27.Niu T, Liu Y, Zhu F, Ma J, Gao J. Time‐resolved fluorescent immunoassay‐based combined detection of procalcitonin, C‐reactive protein, heparin binding protein, and serum amyloid A1 to improve the diagnostic accuracy of early infection. J Clin Lab Anal. 2019;33(2):e22694. [DOI] [PMC free article] [PubMed] [Google Scholar]
- 28.Semmlack S, Kaplan PW, Spiegel R, et al. Illness severity scoring in status epilepticus‐When STESS meets APACHE II, SAPSII, and SOFA. Epilepsia. 2019;60(2):189‐200. [DOI] [PubMed] [Google Scholar]
- 29.Rau BM, Kemppainen EA, Gumbs AA, et al. Early assessment of pancreatic infections and overall prognosis in severe acute pancreatitis by procalcitonin (PCT): a prospective international multicenter study. Ann Surg. 2007;245(5):745‐754. [DOI] [PMC free article] [PubMed] [Google Scholar]
- 30.Chen YJ, Lin TL, Cai Z, Yan CH, Gou SR, Zhuang YD. Assessment of acute pancreatitis severity via determination of serum levels of hsa‐miR‐126‐5p and IL‐6. Exp Ther Med. 2021;21(1):26. [DOI] [PMC free article] [PubMed] [Google Scholar]
- 31.Jain S, Midha S, Mahapatra SJ, et al. Interleukin‐6 significantly improves predictive value of systemic inflammatory response syndrome for predicting severe acute pancreatitis. Pancreatology. 2018;18(5):500‐506. [DOI] [PubMed] [Google Scholar]
Associated Data
This section collects any data citations, data availability statements, or supplementary materials included in this article.
Data Availability Statement
The datasets used and/or analyzed during the current study are available from the corresponding author on reasonable request.