

Abstract
Background
Urinary oxalate can provide important clues for the screening and monitoring of children with primary hyperoxaluria (PH), which is a potentially life‐threatening condition. However, little effort has been devoted to improve the oxalate assay in recent years. We have proposed a reliable and cost‐effective high‐performance liquid chromatography (HPLC) method for urinary oxalate determination.
Methods
Urine specimens were centrifuged after one‐step derivatization, and the supernatants were subjected to HPLC analysis.
Results
The method was validated with consistent linearity from 0.0625 to 2.0 mmol/L with coefficients of variation ≤7.73%, good recovery, low carryover, satisfactory sample stability, and analytical specificity. The lower limit of quantification and the limit of detection were 0.03130 and 0.0156 mmol/L, respectively. Imprecision values were ≤2.92% and ≤16.6% for externally and internally produced controls, respectively. The pediatric reference interval of spot urinary oxalate to creatinine ratios was established together with its application in screening of PH in patients with renal diseases, revealing its successful deployment in our laboratory.
Conclusions
This reliable HPLC method could serve as a significant tool to determine urinary oxalate levels for screening and monitoring of children with PH in routine clinical laboratories.
Keywords: oxalate, high‐performance liquid chromatography, spot urine, primary hyperoxaluria
A reliable and economical HPLC method was developed and validated for urinary oxalate determination. The pediatric reference interval of spot urinary oxalate to creatinine ratio has also been investigated for screening and monitoring of primary hyperoxaluria in a modern clinical laboratory environment.

1. INTRODUCTION
Primary hyperoxaluria (PH) is a rare genetic disease involving endogenous overproduction of oxalate, often leading to widespread deposition of insoluble oxalate crystals in multiple organs and posing a risk to human health.1 Oxalate is primarily produced by the liver and eliminated by the kidneys, as humans have no enzyme capable of degrading it.2, 3 Strongly elevated urinary oxalate levels in PH are closely associated with recurrent urolithiasis and progressive nephrocalcinosis, often followed by renal damage due to tubular toxicity from oxalate, nephrocalcinosis, and renal obstruction by stones.4, 5 The true prevalence of PH is unknown, and the estimated prevalence is less than three cases per million individuals.4 Therefore, the rarity of this disease leads to a certain neglect in terms of screening and early diagnostic efforts. It is often diagnosed and concerned only after patients have experienced considerable pain over a prolonged period of time or even after they have reached end‐stage renal disease (ESRD). For children, PH carries an increased risk of progression to ESRD as early as within the first few weeks of life and kidney or combined liver‐kidney transplantation is always required to avoid death.4, 6 Considering the adverse and rapid progression of PH, testing of urinary oxalate, which is convenient in young children, is vital for biochemical screening and monitoring of PH.
A number of analytical methods such as enzymatic assays,7, 8 ion chromatography,9 gas chromatography (GC),10 high‐performance liquid chromatography (HPLC),11, 12, 13, 14 and liquid chromatography‐tandem mass spectrometry (LC‐MS/MS)15, 16 have been reported for the analysis of urinary oxalate. Among these, enzymatic assays are used by the majority of the laboratories, but a manual sample clean‐up step with pH adjustment and activated charcoal columns is always required due to color inhibition caused by reducing substrates.15 For GC, oxalate needs to be isolated initially by precipitation with calcium chloride and then derived for analysis. Although LC‐MS/MS has recently gained increasing attention due to its high selectivity and sensitivity, it is not widely used when compared with HPLC due to its cost and complexity.17, 18 Consequently, interest in HPLC has been motivated, partially due to its low cost, easy operation, and ease of availability Nonetheless, HPLC methods described in the literature were developed 20 years ago and required large sample volumes, extensive sample preparation, specialized ion chromatography methods, or elution gradients,14 accompanied by inadequate method evaluation. In addition to the aforementioned limitations, very few HPLC methods have been implemented in clinical laboratories and much less attention has been devoted to investigating the pediatric reference interval (RI), since various pre‐analytical and analytical factors related to different methodologies might lead to an extensive variation in the normal range of oxalate. Therefore, our goal was to develop a robust and economical HPLC urinary oxalate assay along with an investigation regarding the RIs of spot urinary oxalate to creatinine ratio in children.
2. MATERIALS AND METHODS
2.1. Chemicals and reagents
Oxalic acid (purified grade, 99.999% trace metals basis) was purchased from Sigma‐Aldrich (St. Louis, MO, USA). o‐Phenylenediamine (OPD) was bought from Aladdin Company (Shanghai, China). Hydrochloric acid (HCl, 37%) and sodium hydroxide (NaOH) were bought from Beijing Chemical Reagent Company (Beijing, China). Ammonium acetate (LC‐MS grade) was obtained from Fisher Scientific (Bremen, Germany). Methanol (HPLC grade) was from Merck (Darmstadt, Germany). Deionized water was prepared by a water purification system (ELga, High Wycombe, UK).
2.2. Preparation of solutions
A stock solution of oxalic acid (40 mmol/L) was prepared in deionized water and stored at −80°C until analysis. In addition, a solution of OPD (0.46 M) in 2 M HCl was freshly prepared by dissolving 2.4 g of OPD in 40 mL of water, followed by mixing with 8 mL of HCl. A NaOH solution (10 M) was prepared by dissolving 40 g of NaOH in 100 mL of water.
2.3. HPLC analysis
High‐performance liquid chromatography coupled with an ultraviolet detector (Agilent 1200 Series LC System, Agilent Technologies, Santa Clara, CA, USA) was used for quantification. HPLC analysis was performed on a Phenomenex Luna C18 column (250 × 4.6 mm, particle size 5 μm) (Phenomenex, Torrance, CA, USA). Isocratic elution of 15% methanol in water containing 0.17 M ammonium acetate was used as the mobile phase for chromatographic separation at a flow rate of 1 mL/min. The column temperature was maintained at 25°C. The ultraviolet (UV) detector wavelength was set to 314 nm. After each sampling, the injection syringe was washed with water. All data were acquired using Agilent ChemStation software. From the peak area of oxalate recorded in the chromatogram and calibration curve plotted by peak area against calibration concentration, the concentration of oxalate in each sample was calculated by using the peak area over the slope of the calibration curve.
2.4. Calibration, calibration verification, and quality controls
A stock oxalic acid solution (40 mmol/L) in a volumetric flask was prepared by dissolving 0.036 g of oxalic acid in 10 mL of water. Calibrators were freshly prepared by diluting the stock solution of oxalic acid (40 mmol/L) with water to concentrations of 0.0625, 0.125, 0.15, 0.5, 1.0, and 2.0 mmol/L, close to the expected biological concentrations in human urine. Pooled urine specimens were also obtained to construct matrix‐matched calibrators, as described previously. A preliminary study was performed to determine whether there was any difference in the slopes of the oxalic acid calibration curves between calibrators prepared in water and those prepared in urine matrices.19 A standard addition experiment was also performed by comparing the signals (peak areas) of the standard solutions in urine (0.25, 0.50, 1.0 mmol/L, 5:95 v/v) after subtracting oxalate in blank urine with the signals (peak areas) of standard solutions in pure water at the same concentration to further investigate the influence of matrix type on testing. The results (Table S1) showed no significant difference, and thus, water‐based calibrators were used thereafter. Calibration verification was performed at three levels (0.10, 0.40, and 1.8 mmol/L) at least every six months using a commercially available standard with a different lot number. However, this was performed immediately in case of a change of reagent or column lot, unacceptable control values, or major maintenance performance (Clinical Laboratory Improvement Amendments‐Calibration and Calibration Verification).
Quality controls (QCs) were prepared in two matrices (urine and water) and were labeled as internally produced controls (IQCs) and externally produced controls (EQCs), respectively. The IQCs were generated from pooled urine specimens and prepared at two levels within the expected biological range. The EQCs were prepared separately in water from a different lot number than those used as calibrators (0.250 and 1.000 mmol/L). The QCs were aliquoted and stored at −80°C for up to 1 month until use. QCs including both IQCs and EQCs were analyzed with a batch representing at least 5% of the total number of patient samples, which were always placed at the beginning, middle, and end of an analytical run.
All setups used for standard solution preparation including glassware, pipettes, and analytical balance were calibrated annually according to the College of American Pathologists checklist for our laboratory. All these descriptions have been documented in the “Standard Operating Procedure,” and the corresponding operations have been routinely recorded in the “quality control management software” and the “daily record” in our laboratory for QC assurance.
2.5. Sample preparation
Calibrators/QCs/urine specimens (1.0 mL) were mixed with 5 μL of concentrated HCl and 250 μL of OPD solution in tubes. The tubes were capped, vortexed, and heated to 120°C for 30 minutes. The solution changed from yellow to dark brown. After the solutions were cooled, 30 μL of 10 M NaOH was added. Finally, the solutions were centrifuged for 10 minutes at 18,000 rpm.
2.6. Method evaluation
The European Medicines Agency guideline on bioanalytical method validation (European Medicines Agency 2011) was followed for evaluation of the present method emphasizing on linearity, the lower limit of quantification (LLOQ), the limit of detection (LOD), precision, accuracy, sample stability, carryover, and analytical specificity.
2.6.1. Linearity
Five replicates were performed at each level of the calibrators in the range of 0.0625–2.0 mmol/L. An external calibration, in which the concentration of the analyte in a sample was calculated from its calibration curve plotted by the calibrators of this analyte, was used for oxalate determination.
2.6.2. LLOQ and LOD
The LLOQ, defined as the lowest concentration with a signal‐to‐noise >10, was determined by assaying a series of low‐concentration calibrators in five replicates and established based on the criteria that a coefficient of variation (CV) of <20% and an accuracy within 80%–120%. The LOD represents the concentration that gives a signal‐to‐noise >3.
2.6.3. Precision
Two types of control materials made in water and in pooled urine (IQCs and EQCs) were used to evaluate precision. Five replicates of each level were assayed over five days to evaluate the intra‐day and inter‐day precision.
2.6.4. Accuracy
Accuracy of the method was evaluated by a recovery study. Pooled urine specimens spiked with known amounts of oxalic acid (0.1, 0.5, 1.0 mmol/L) were assayed in five replicates at each level. The recovery was calculated as [(final concentration‐initial concentration)/added concentration].
2.6.5. Sample stability
The pooled urine specimen was aliquoted and stored at room temperature, in a refrigerator (4°C) or in a freezer (−80°C). The oxalate level was determined at different time intervals (0, 3, and 7 days after storage at room temperature, and 0, 3, 7, and 14 days after storage at 4°C or −80°C). Five replicates were measured at each time point under different storage conditions.
2.6.6. Carryover
A urine specimen spiked with 2.0 mmol/L of oxalic acid aqueous solution (95:5, v/v) was assigned as the high concentration sample, and water was assigned as the blank sample. The high concentration sample and the blank sample were injected in alternative for five times. Carryover is not significant if the signal of any peak in the blank sample at the retention time of oxalate is below the signal of LOD.
2.6.7. Analytical specificity
Analytical specificity was evaluated by assaying samples and QCs spiked with known concentrations of structurally similar compounds. Citric acid, of which the property and the structure were similar to oxalic acid, was tested for analytical specificity. A citric acid aqueous solution (20 mmol/L) was spiked into a urine specimen, the low EQC and the high EQC at a ratio of 5:95. These samples together with an equivalent series of non‐spiked samples were subjected to sample preparation for assaying interference.
2.7. Urine collection and reference intervals
Spot urine specimens were collected without preservatives from pediatric subjects (n = 178, 114 males and 64 females, aged 2 days to 17 years, mean age: 4.5 years) to establish the RI of oxalate. The subjects were recruited and selected according to the following exclusion criteria: pediatric patients with renal diseases (kidney stones, hydronephrosis, nephritis, nephrotic syndrome) and digestive system diseases (idiopathic inflammatory bowel disease, ileectomy, jejunal/ileal bypass, celiac disease, chronic pancreatitis, chronic biliary diseases, and unexplained diarrhea with abnormal fat absorption). In addition, large doses (>2 g orally/24 hours) of vitamin C were avoided before specimen collection. All urine specimens were analyzed on the day of collection, and the concentrations of oxalate were measured using the newly proposed method. Urine creatinine (Cr) was determined using the Roche Cobas 8000 system (Roche, Germany).
Urinary oxalate was measured in 64 patients (38 males and 26 females aged 7 months to 17 years old with a mean age of 7.5 years) admitted to the pediatric nephrology unit of Tongji Hospital from June 2020 to August 2020. They were mainly characterized by renal disease, and screening for renal damage from PH was considered necessary. Finally, three cases were confirmed with PH.
2.8. Statistical analysis
Normality of variable distribution was tested using Kolmogorov‐Smirnov test or Shapiro‐Wilk test. Continuous data were presented as mean (median). The RI was established using mean ± 1.96SD on the basis of normally distributed data; otherwise, the RI was presented in non‐parametric 95th percentiles. Comparisons between two groups were made using t test or Mann‐Whitney test, and comparisons among multiple‐groups were performed by one‐way ANOVA or Kruskal‐Wallis test as appropriate. Pearson's test or Spearman's test was used to assess relationship among variables depending on normality of data. A linear model for an age‐adjusted RI was generated by linear quantile regression analysis. All statistical tests were two‐sided, and P values less than 0.05 were considered as statistically significant. The statistical analyses were performed using SPSS 13.0, Graphpad Prism 7.0, and Stata 12.0.
3. RESULTS
3.1. Chromatography
During sample preparation, HCl was added. Oxalate primarily existed in the form of oxalic acid, which could react with o‐phenylenediamine to yield the derivative 2,3‐dihydroxquinoxaline (Figure S1). Considering the strong UV absorbance of this derivative, low concentrations of oxalate could be easily detected. Quantitative chromatographic profiles of a standard solution, a spiked urine sample, urine sample from a healthy child, and urine sample from a child with PH are presented in panels A, B, C, and D of Figure 1. The retention time was approximately 13 minutes, and all samples achieved excellent separation without interference peaks. After the chromatographic column was injected 800 times, the theoretical plate number of this column was 7638, which was consistent with its initial performance. The target analytes in urine specimens were identified by comparing their retention times with those of the calibrators and controls.
FIGURE 1.
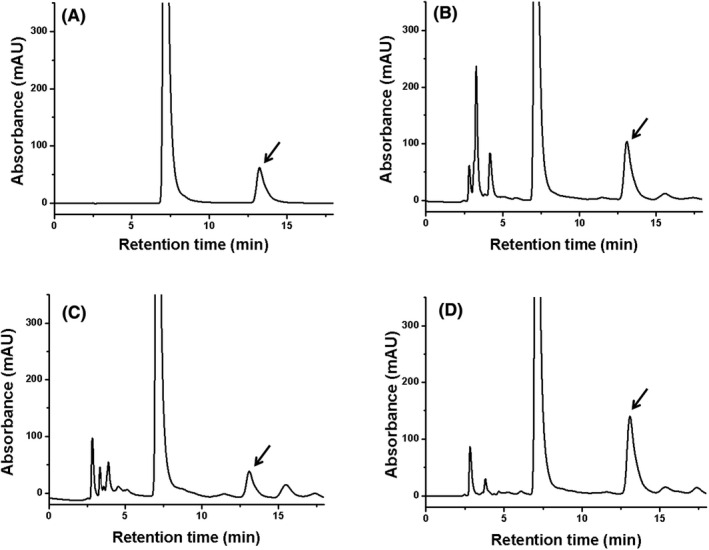
The chromatographic profiles of oxalate in (A) a standard solution (0.50 mmol/L); (B) a spiked urine sample (spiked concentration: 0.50 mmol/L); (C) a urine from a healthy child (0.48 mmol/L); (D) a urine from a child with PH (1.19 mmol/L)
3.2. Linearity
In this experiment, water‐matched and matrix‐matched calibrators were prepared. The slopes of the calibration curves of the two types of calibrators were not significantly different, with percentage differences in the range from ‐5.57% to 1.23% (Table S1). The percentage differences in peak areas in the standard addition experiment were ≤2.66% (Table S2), demonstrating that the signals of the analytes in water and in urine showed no obvious differences. Hence, water‐based calibrators were used for validation.
The inter‐assay (n = 5) variability of the calibration data was monitored. CV values were ≤7.73% (Table 1). The linear equation obtained for this range (0.0625–2.0 mmol/L) was y = 8170.3× + 8.001 (r 2 = 0.9995), demonstrating excellent linearity for quantification.
TABLE 1.
Linearity
| Expected concentration (mmol/L) | Mean concentration (mmol/L) | Coefficient of variation (CV) | Linear regression | Linear regression (r 2) |
|---|---|---|---|---|
| 0.0625 | 0.0611 | 7.73% | y = 8170.3x + 8.001 | 0.9995 |
| 0.125 | 0.1297 | 6.15% | ||
| 0.25 | 0.2461 | 1.81% | ||
| 0.50 | 0.5025 | 0.74% | ||
| 1.0 | 0.9935 | 1.16% | ||
| 2.0 | 1.9994 | 0.45% |
3.3. LLOQ and LOD
Analysis of a series of low‐concentration calibrators (0.00195, 0.00390, 0.00780, 0.01560, and 0.03130 mmol/L) resulted in a CV of <20% and an accuracy of 80–120% at a concentration of 0.03130 mmol/L. Therefore, the concentration of 0.03130 mmol/L, which provided a 10‐fold higher signal than that of noise, was accepted as the LLOQ. The LOD, defined as the concentration with a signal threefold higher than that of noise, was 0.0156 mmol/L.
3.4. Precision
The precision, calculated as the CV for EQCs and IQCs, is presented in Table 2. Intra‐day CVs were ≤1.16% for EQCs (0.25 mmol/L, 1.00 mmol/L) and ≤7.29% for IQCs (0.092 mmol/L, 1.590 mmol/L) after running five replicates at each level. The inter‐day CVs were ≤2.92% for EQCs and ≤16.6% for IQCs.
TABLE 2.
Precision
| Expected concentration (mmol/L) | Intra‐day | Inter‐day | |||
|---|---|---|---|---|---|
| Mean concentration (mmol/L) | CV | Mean concentration (mmol/L) | CV | ||
| EQCs | 0.250 | 0.241 | 1.16% | 0.240 | 2.92% |
| 1.000 | 1.015 | 0.92% | 1.017 | 1.36% | |
| IQCs | 0.092 | 0.095 | 7.29% | 0.087 | 16.6% |
| 1.590 | 1.596 | 2.88% | 1.592 | 11.7% | |
3.5. Accuracy
Recovery was performed in five replicates for each sample by spiking known amounts of oxalic acid into urine specimens. The recoveries at 0.10, 0.50, and 1.00 mmol/L (Table 3) were 80.0%, 91.1%, and 103.7%, respectively, indicating that accurate quantification of oxalate was possible using this method.
TABLE 3.
Recovery
| Spiked concentration (mmol/L) | Average recovery | CV |
|---|---|---|
| 0.100 | 80.0% | 1.95% |
| 0.500 | 91.1% | 8.15% |
| 1.000 | 103.7% | 6.10% |
3.6. Sample stability
The fresh pooled urine was stored at room temperature for at least 7 days with a CV of 6.24%. At 4°C and −80°C, the storage time of the pooled urine extended to at least 14 days with CVs of 13.1% and 7.20%, respectively, revealing that the urine samples could be stored at 4°C or lower for a longer storage duration.
3.7. Carryover
The high concentration sample and the blank sample were injected in alternative for five times. No peaks were found in blank samples at the retention time of oxalate, demonstrating that no carryover was presented.
3.8. Analytical specificity
Citrate exerts an inhibitory effect on the formation of calcium oxalate stones and has a similar structure to oxalate.20 Citric acid was tested for analytical specificity. Percent bias, calculated as the ratio of the analyte concentrations in the spiked vs. baseline samples, was employed to evaluate interference.21 After the addition of citric acid to the sample, the low control, high control, and average biases of oxalate were 4.96%, 2.38%, and 1.80%, respectively. Furthermore, no interference peak was observed at the retention time of oxalate.
3.9. Reference intervals
The pediatric RI of spot urinary oxalate to creatinine ratio was investigated in subjects aged 2 days to 17 years (n = 178, 114 males and 64 females). The mean (median) oxalate concentration was 88 (69) mmol/mol Cr, with a range of 5–380 mmol/mol Cr. No statistically significant difference in spot urinary oxalate concentrations was observed between male and female subjects (p = 0.563). However, the reference population showed a negative relationship with age (r = −0.680, p < 0.001), indicating that the establishment of age‐related RIs in pediatric subjects is of great importance.
A wide variety of analytical procedures and methods used for urinary oxalate determination might lead to substantial batch‐to‐batch and lab‐to‐lab variations. Hence, the RI was investigated based on the determination of urinary oxalate using the present HPLC method. Since diet composition might influence urinary oxalate excretion,22 infants up to 6 months of age who exclusively consume milk are more likely to be included in an age group alone. Furthermore, according to the scatter plot of oxalate/Cr vs. age presented in Figure 2 and the median splits presented in Table 4, pediatric subjects were divided into four age subgroups (<0.5, 0.5–2, 2–8, and 8–17 years of age, Table 5). In subjects aged <0.5 years (n = 20), the mean (median) oxalate concentration was 208 (165) mmol/mol Cr with a range of 87–381 mmol/mol Cr and the RI was <379 mmol/mol (0.301 mg/mg Cr). In subjects aged 0.5–2 years (n = 26), the mean (median) oxalate concentration was 120 (117) mmol/mol Cr with a range of 23–178 mmol/mol Cr and the RI was <192 mmol/mol Cr (<0.152 mg/mg Cr). In subjects aged 2–8 years (n = 107), the mean (median) oxalate concentration was 73 (64) mmol/mol Cr with a range of 11–199 mmol/mol Cr and the RI was <165 mmol/mol Cr (<0.131 mg/mg Cr). In subjects aged 8–17 years (n = 25), the mean (median) oxalate concentration was 27 (22) mmol/mol Cr with a range of 4–78 mmol/mol Cr and the RI was <75 mmol/mol Cr (<0.060 mg/mg Cr). In order to improve the interpretation of test results, the age‐adjusted pediatric upper reference limit (URL) for oxalate, estimated from a quantile regression equation (URL = −13.1398 years + 261.826 mmol/mol Cr), was also established.
FIGURE 2.
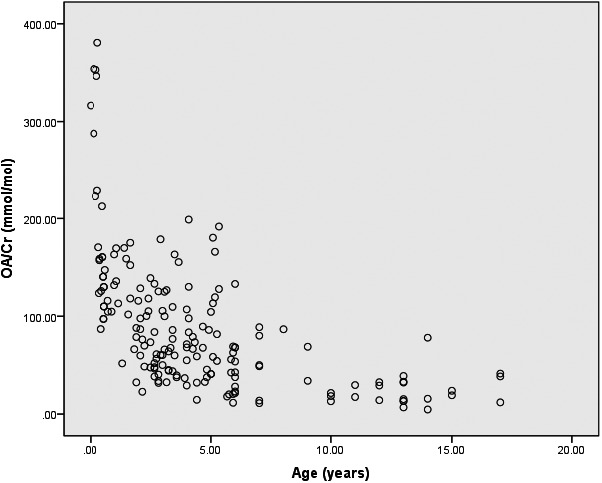
The scatter plot of OA/Cr vs. age
TABLE 4.
The subgroups of study population based on scatter plot of OA/Cr vs. age
|
Age (years old) |
N |
Mean (Median) (mmol/mol Cr) |
Range (mmol/mol Cr) |
|---|---|---|---|
| 0–0.5 | 20 | 208 (165) | 87–381 |
| 0.5–1 | 11 | 128 (130) | 97–163 |
| 1–2 | 15 | 115 (116) | 32–175 |
| 2–3 | 31 | 77 (61) | 23–179 |
| 3–5 | 43 | 74 (68) | 15–199 |
| 5–8 | 33 | 68 (56) | 11–192 |
| 8–17 | 25 | 27 (22) | 5–78 |
TABLE 5.
The oxalate/creatinine values in spot urine of the tested population for establishment of reference intervals
| n |
Mean (Median) (mmol/mol Cr) |
Range (5‐95th) (mmol/mol Cr) |
RI | P | ||
|---|---|---|---|---|---|---|
| Total | 178 | 88 (69) | 5–380 (14–213) | / | ||
| Gender | Male | 114 | 87 (78) | 5–354 (14–176) | / | 0.563 |
| Female | 64 | 91 (64) | 7–380 (15–309) | / | ||
| Age (years old) | <0.5 | 20 | 208 (165) | 87–381 (87–379) | <379b | <0.001 |
| 0.5–2 | 26 | 120 (117) | 23–178 (39–173) | <192a | ||
| 2–8 | 107 | 73 (64) | 11–199 (19–165) | <165b | ||
| 8–17 | 25 | 27 (22) | 4–78 (5–75) | <75b |
The data are normal distribution, and the reference intervals are expressed as mean ± 1.96SD.
The data are abnormal distribution, and the reference intervals are expressed in non‐parametric 95th percentiles.
3.10. Clinical testing
The present method offered an excellent opportunity for use in our laboratory. To date, 64 patients with suspected PH have been subjected to clinical testing for oxalate in spot urine specimens. Among these, three cases were confirmed to have PH. These patients were also grouped by age (0.5–2 years: n = 1 for PH and n = 9 for other renal diseases, 2–8 years: n = 1 for PH and n = 27 for other renal diseases, 8–17 years: n = 1 for PH and n = 25 for other renal diseases). Spot urinary oxalate concentrations in each group were significantly higher in patients with PH than in patients with other renal diseases and in the tested population for the RI (Figure 3). Since the sample size of patients with PH was too small, statistical analysis was performed only between the RI population and patients with other renal diseases. No statistically significant differences were observed among these age subgroups (p = 0.576, p = 0.301, and p = 0.082).
FIGURE 3.
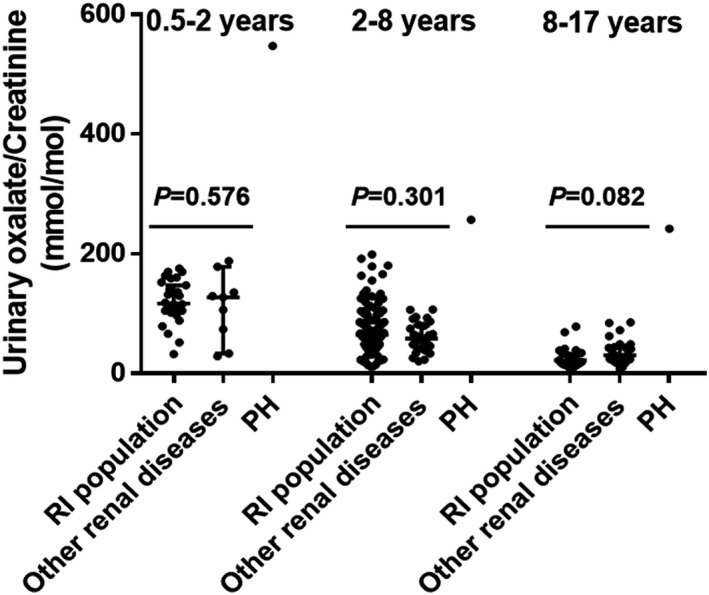
Histograms showing distributions of spot urinary concentrations of oxalate in the reference population, patients with other renal diseases and PH (median with 95 confidence interval)
4. DISCUSSION
Primary hyperoxaluria is characterized by overproduction of oxalate. In patients with PH, kidney stones usually consist of more than 95% calcium oxalate monohydrate, which may eventually cause renal damage.1 Consequently, determination of urinary oxalate is important for a good evaluation for biochemical screening and monitoring of PH, especially in children with rapid disease progression. Many methods based on enzymatic assays, GC, ion chromatography, HPLC, and LC‐MS/MS have been developed. However, enzymatic assays and GC are complicated by sample clean‐up, and LC‐MS/MS has high instrument cost and complicated sample preparation, which has prevented its widespread use to date. HPLC has received great acceptance because of its selectivity and cost‐effectiveness. However, the previous HPLC methods described 20 years ago are too old and complicated in terms of sample preparation and separation accompanied by inadequate method evaluation. In the present study, the sample was derivatized with OPD and injected directly for HPLC analysis under isocratic elution, independent of pH adjustment or sample clean‐up. This HPLC method was further validated with excellent linearity, satisfying analytical sensitivity, good precision, and accuracy. The chromatographic column could be used at least 800 times without any obvious damage to the column performance. Thus, this method has great potential for widespread use in routine clinical laboratories. In addition, a comparison study between the calibrators prepared in water and in urine, which focused on the slope of the calibration curve and signal intensity, showed no significant differences, alleviating the difficulty in preparing matrix‐matching calibrators from oxalate‐free urine. Moreover, this method has already been shown to be robust in routine use, with no batch failures to date.
A variety of sample preparation procedures and analytical techniques have been employed in urinary oxalate assays, resulting in uncertain effects on testing results due to the lack of global standardization in these laboratory developed tests. Therefore, establishment of an RI for urinary oxalate in children is of utmost importance and offers excellent promise for its use in clinical laboratories. The scatter plot of oxalate/Cr vs. age is presented in Figure 2. The study population was initially divided into seven specific groups. Subsequently, based on median splits presented in Table 4 and the specific milk‐dominated diet composition of infants <6 months of age, participants were re‐divided into four groups (<0.5, 0.5–2, 2–8, and 8–17 years of age) for the establishment of RIs (Table 5; 0–0.5 years: <379 mmol/mol Cr, 0.5–2 years: <192 mmol/mol Cr, 2–8 years: <165 mmol/mol Cr, 8–17 years: <75 mmol/mol Cr). The age‐dependent decrease in oxalate levels in pediatric subjects is consistent with earlier reports that used different methodologies.23, 24 Cochat et al. reported the age‐related RI of oxalate in random urine (<1 year: 15–260 mmol/mol Cr, 1–5 years: 11–120 mmol/mol Cr, 5–12 years: 60–150 mmol/mol Cr, >12 years: 2–80 mmol/mol Cr) and the URL values were primarily consistent with the quantile regression equation (URL = −13.1398 years + 261.826 mmol/mol Cr).1 These findings indicate the clinical feasibility of this method.
After clinical testing of spot urinary oxalate in patients with renal diseases, three cases were confirmed to have PH, which was consistent with the genetic test results. No statistically significant differences were observed in urinary oxalate concentrations between the RI population and patients with other renal diseases in age subgroups, possibly because oxalosis or calcium oxalate deposition in the tissues did not develop in these patients with other renal diseases.
In conclusion, our study has proposed, validated, and standardized a suitable HPLC method for oxalate measurement in clinical laboratories. However, several limitations of this study should be considered. The sample size was small. Thus, more subjects should be included for improvement and validation of the RIs in the future. Moreover, external quality assessment is urgently needed to assess the performance of this method in a clinical laboratory.
5. CONCLUSION
We successfully developed and validated an HPLC method for the determination of urinary oxalate levels. Due to the reliability, simplicity, and cost‐effectiveness of this method, it would be suitable as a screening and monitoring tool for children with PH.
CONFLICT OF INTEREST
None declared.
Supporting information
ACKNOWLEDGMENT
We gratefully acknowledge the financial support from the National Natural Science Foundation of China NSFC‐81401718.
Shen Y, Luo X, Li H, Guan Q, Cheng L. Evaluation of a high‐performance liquid chromatography method for urinary oxalate determination and investigation regarding the pediatric reference interval of spot urinary oxalate to creatinine ratio for screening of primary hyperoxaluria. J Clin Lab Anal. 2021;35:e23870. 10.1002/jcla.23870
DATA AVAILABILITY STATEMENT
The data can be available if needed.
REFERENCES
- 1.Cochat P, Rumsby G. Primary hyperoxaluria. N Engl J Med. 2013;369:649‐658. [DOI] [PubMed] [Google Scholar]
- 2.Ermer T, Eckardt KU, Aronson PS, Knauf F. Oxalate, inflammasome, and progression of kidney disease. Curr Opin Nephrol Hypertens. 2016;25:363‐371. [DOI] [PMC free article] [PubMed] [Google Scholar]
- 3.Williams HE. Oxalic acid and the hyperoxaluric syndromes. Kidney Int. 1978;13:410‐417. [DOI] [PubMed] [Google Scholar]
- 4.Hoppe B. An update on primary hyperoxaluria. Nat Rev Nephrol. 2012;8:467‐475. [DOI] [PubMed] [Google Scholar]
- 5.Robertson DS. The function of oxalic acid in the human metabolism. Clin Chem Lab Med. 2011;49:1405‐1412. [DOI] [PubMed] [Google Scholar]
- 6.Franssen CFM, Kema IP, Eleveld DJ, Porte RJ, van der Heide JJH. Intra‐operative continuous renal replacement therapy during combinedliver–kidney transplantation in two patients with primaryhyperoxaluria type 1. NET Plus. 2011;4:113‐116. [DOI] [PMC free article] [PubMed] [Google Scholar]
- 7.Buttery JE, Ludvigsen N, Braiotta EA, Pannall PR. Determination of urinary oxalate with commercially available oxalate oxidase. Clin Chem. 1983;29:700‐702. [PubMed] [Google Scholar]
- 8.Ichiyama A, Nakai E, Funai T, Oda T, Katafuchi R. Spectrophotometric determination of oxalate in urine and plasma with oxalate oxidase. J Biochem. 1985;98:1375‐1385. [DOI] [PubMed] [Google Scholar]
- 9.Robertson WG, Scurr DS, Smith A, Orwell RL. The determination of oxalate in urine and urinary calculi by a new ion‐chromatographic technique. Clin Chim Acta. 1982;24:91‐99. [DOI] [PubMed] [Google Scholar]
- 10.Park KIY, Gregory J. Gas‐chromatography determination of urinary oxalate. Clin Chem. 1980;26:1170‐1172. [PubMed] [Google Scholar]
- 11.Larsson L, Libert B, Asperud M. Determination of urinary oxalate by reversed‐phase ion‐pair “high performance” liquid chromatography. Clin Chem. 1982;28:2272‐2274. [PubMed] [Google Scholar]
- 12.Hughes H, Hagen L, Sutton R. Determination of urinary oxalate by high‐performance liquid chromatography. Anal Biochem. 1982;119:1‐3. [DOI] [PubMed] [Google Scholar]
- 13.Fry IDR, Starkey BJ. The determination of oxalate in urine and plasma by high performance liquid chromatography. Ann Clin Biochem. 1991;28:581‐587. [DOI] [PubMed] [Google Scholar]
- 14.Khaskhali MH, Bhanger MI, Khand FD. Simutaneous determination of oxalic and citric acids in urine by high performance liquid chromatography. J Chromatogr B. 1996;675:147‐151. [DOI] [PubMed] [Google Scholar]
- 15.Keevil BG, Thornton S. Quantification of urinary oxalate by liquid chromatography‐tandem mass spectrometry with online weak anion exchange chromatography. Clin Chem. 2006;52:2296‐2299. [DOI] [PubMed] [Google Scholar]
- 16.Elgstoen KB, Woldseth B, Hoie K, Morkrid L. Liquid chromatography‐tandem mass spectrometry determination of oxalate in spot urine. Scand J Clin Lab Invest. 2010;70:145‐150. [DOI] [PubMed] [Google Scholar]
- 17.Jannetto PJ, Fitzgerald RL. Effective use of mass spectrometry in the clinical laboratory. Clin Chem. 2016;62:92‐98. [DOI] [PubMed] [Google Scholar]
- 18.Locatelli M, Furton KG, Tartaglia A, Sperandio E, Ulusoy HI, Kabir A. An FPSE‐HPLC‐PDA method for rapid determination of solar UV filters in human whole blood, plasma and urine. J Chromatogr B Analyt Technol Biomed Life Sci. 2019;1118–1119:40‐50. [DOI] [PubMed] [Google Scholar]
- 19.Chung WY, Chung JK, Szeto YT, Tomlinson B, Benzie IF. Plasma ascorbic acid: measurement, stability and clinical utility revisited. Clin Biochem. 2001;34:623‐627. [DOI] [PubMed] [Google Scholar]
- 20.Kok DH, Socrates E, Papaouls SE, Bijvoet OLM. Crystal agglomeration is a major element in calcium oxalate urinary stone formation. Kidney Int. 1990;37:51‐56. [DOI] [PubMed] [Google Scholar]
- 21.Clark ZD, Frank EL. Urinary metanephrines by liquid chromatography tandem mass spectrometry: Using multiple quantification methods to minimize interferences in a high throughput method. J Chromatogr B. 2011;879:3673‐3680. [DOI] [PubMed] [Google Scholar]
- 22.Siener R, Hesse A. The effect of different diets on urine composition and the risk of calcuim oxalate crystallisation in healthy subjects. Eur Urol. 2002;42:289‐296. [DOI] [PubMed] [Google Scholar]
- 23.Leumann EP, Dietl A, Matasovic A. urinary oxalate and glycolate excretion in healthy infants and children. Pediat Nephrol. 1990;4:493‐497. [DOI] [PubMed] [Google Scholar]
- 24.von Schnakenburg C, Byrd DJ, Latta K, Reusz GS, Graf D, Brodehl J. Determination of oxalate excretion in spot urines of healthy children by ion chromatography. Eur J Clin Chem Clin Biochem. 1994;32:27‐29. [DOI] [PubMed] [Google Scholar]
Associated Data
This section collects any data citations, data availability statements, or supplementary materials included in this article.
Supplementary Materials
Data Availability Statement
The data can be available if needed.