

Abstract
Aims.
To estimate the association between per capita alcohol consumption and fatal accidents in the United States and to compare the outcome with findings from Europe and Canada.
Data and method.
Yearly data on fatal accidents by gender and age were analysed in relation to per capita alcohol consumption for 1950–2002 using the Box-Jenkins technique for time series analysis.
Findings.
A one-litre increase in per capita consumption was on average followed by 4.4 male deaths per 100,000 inhabitants, but had no significant effect on female accident mortality. Regarding specific categories of accidents, the effect on fatal motor vehicle accidents accounted for a large part of the overall effect for men and was also significant for women. With respect to fatal falling accidents and other accidents, the only significant effects were found among young males. As concerns women, the association with per capita consumption in the US was weak in comparison with Canada and Europe. The US effect estimate for overall male accidents was however equally strong as in Northern Europe (5.2) or Canada (5.9), and stronger than that found in central and Southern Europe (2.1 and 1.6, respectively). With respect to alcohol and fatal motor vehicle accidents, the association for men of 3.2 was stronger than in Europe and more similar to the Canadian finding (3.6).
Conclusions.
Per capita alcohol consumption has at least partly been an explanation for the development of male fatal accidents and particularly motor vehicle accident rates in the postwar United States. High traffic density and relatively high legal limits for drunken driving blood alcohol concentration (BAC) are suggested to explain the strong association found between alcohol and fatal motor vehicle accidents. The results also suggest that a reduction in per capita consumption would have its most preventive impact on fatal accidents among younger males.
Keywords: Accident mortality, population drinking, United States, time series analyses
Introduction
Many studies have demonstrated that alcohol consumption is an important risk factor underlying fatal accidents (for reviews see Rossow et al., 2001; Brisman & Bergman, 1998; Romelsjö, 1995). Most evidence comes from analyses of individual-level data, e.g., from hospital emergency room studies and post-mortem reports. The area in which most research has been conducted is certainly traffic accidents, but the role of alcohol has also been demonstrated for accidental falls, poisonings, drowning as well as accidental fires (Smith et al., 1999; Hingson, R. & Howland, J., 1993). According to a recent study from the World Health Organisation (WHO), alcohol-related fatalities represent a substantial burden in most countries, with unintended fatal accidents accounting for on average 32% of all alcohol-related mortality in the world (Rehm et al., 2004).
Alcohol-related fatalities also constitute a major problem in the United States (US), where they were estimated to cause 35% of male and 32% of female alcohol-related mortality. Further, alcohol involvement in non-traffic unintentional deaths has been estimated to 38.5% and in motor vehicle accidents to 39.7%. Corresponding proportions of intoxicated victims are 31% and 32%, respectively (Smith et al., 1999). The role of alcohol in fatal accidents has also been established in analyses of cross-sectional time series data from all 50 American states over a period of 14 years, where alcohol consumption per capita remained a significant predictor of fatalities also when controlling for potential confounders, e.g., changes in infrastructure (Noland, 2003).
The main aim of the present paper is to estimate to what extent a change in per capita consumption influences the number of fatal accidents in the US and whether the impact differs from that found in Europe and Canada. This will be accomplished by analysing the relationship between per capita consumption and accident mortality rates by gender and age using time series analyses of data for the period 1950–2002. To our knowledge, this kind of aggregate-level time series analyses of alcohol and fatal accidents has never previously been conducted on US data. The basic question addressed in aggregate-level time series analysis is somewhat different from that addressed in individual-level analyses. Instead of asking to what extent an individual’s drinking is related to an accident, the aim is to test whether drinking in the population as a whole affects the number of accidents in the entire population and its subgroups. For some types of accidents, asking questions at the aggregate level is even more relevant, for example when someone who has not consumed any alcohol is killed by a drunken driver. In such cases, the impact of alcohol will be neglected in data concerning the victim.
The rationale for expecting an aggregate-level association is that an increase in per capita consumption reflects an increase in the number of drinking occasions and thus also an increased number of circumstances involving risk of an accident. This is not an obvious outcome: If per capita consumption were to increase due to lower abstention rates and an increased number of low consumption occasions, then a significant impact of a rise in population drinking on accident rates may not be observed. However, fluctuations in per capita consumption based solely on fluctuations in low or moderate drinking would seem to be fairly rare.
Existing time series studies of alcohol and fatal accidents have demonstrated that accident mortality is typically significantly related to population drinking, but that there are cross-cultural differences in the magnitude of this association (for a review, see Norström & Ramstedt, 2005). The results reported in the European Comparative Alcohol Study (ECAS) represent the most comprehensive evaluation of this association (Skog, 2001a; Skog, 2001b). Regarding the relationship between alcohol consumption per capita and male and female overall accident mortality, a statistically significant and positive relationship was found in about 9 of the 14 Western European countries studied. When country-specific estimates were pooled into different regions, it appeared that the effect parameter was larger in Northern Europe than in central Europe, and smallest in Southern Europe. Similar analyses of Canadian data suggested alcohol effects on accidents similar to those found for Northern Europe (Skog, 2003). A more detailed analysis of various kinds of accidents revealed a stronger effect of per capita consumption on fatal traffic accidents in Southern and central Europe, whereas in Northern Europe, accidental falls and a category “other accidents” were more strongly related to population drinking (Skog, 2001b). In Canada, the strongest effect was found for traffic accidents, but significant effects were established also for falls and “other accidents”.
The present study aims at locating the US experience in this pattern by using a time series approach similar to that used in the previously mentioned studies. To what extent are various kinds of fatal accidents in the US influenced by population drinking and how do the results compare with Canadian and European experiences?
Data and method
US national data on accidental deaths by year were obtained from the National Center for Health Statistics Compressed Mortality File for the years 1968 to 2002 and from the Vital Statistics of the United States for each year from 1950 to 1967. These sources report deaths according to underlying cause rather than using multiple cause coding, so that each death is attributed to only one cause. In ICD-6 and −7 (ICD=International Classification of Deaths and Diseases), the category accidental deaths includes diagnosis codes in the interval E800-E962, whereas in ICD-8 and −9, it covers diagnoses E800 to E949. In ICD-10, the diagnoses included are V01-X59. In addition to analysing all accidents, a few subcategories in which alcohol is a risk factor were also examined. These are motor vehicle accidents, falling accidents and the residual category “other accidents” consisting mainly of fatal drowning and poisonings as well as accidents connected to fires and flames. The average prevalence rates by gender and age for these categories are presented in Table 1. For men, motor vehicle accidents represent on average 45 per cent of all accidental deaths, and falls and other accidents 18 and 37 per cent, respectively. Motor vehicle accidents constitute a lower fraction among women (36%) as well as other accidents (27%), whereas falls constitute a larger share (37%). These portions differ across age groups, for instance motor vehicle accidents represent the highest proportion (64%) among younger men.
Table 1.
Accident mortality per 100,000. Average 1950–2002
| Total accidents | Motor vehicle accidents | Falling accidents | Other accidents | |
|---|---|---|---|---|
| Men | ||||
| Total 15+ | 86.8 | 38.9 | 16.0 | 31.8 |
| 15–34 | 76.6 | 48.9 | 2.1 | 25.5 |
| 35–54 | 62.5 | 28.8 | 5.2 | 28.4 |
| 55–74 | 83.1 | 32.8 | 16.6 | 33.7 |
| 75+ | 265.4 | 57.5 | 134.1 | 73.8 |
| Women | ||||
| Total 15+ | 36.9 | 13.3 | 13.7 | 9.9 |
| 15–34 | 19.2 | 14.2 | 0.33 | 4.7 |
| 35–54 | 18.9 | 10.3 | 1.4 | 7.2 |
| 55–74 | 35.9 | 14.6 | 9.4 | 12.0 |
| 75+ | 213.5 | 21.4 | 149.9 | 42.2 |
Annual figures on alcohol consumption include beer, wine, and spirits sales figures from the Alcohol Epidemiologic Data System for the years 1970 to 2002 (Nephew, 2004) and US beer, wine and spirits industry statistics for the years 1950 to 1969. Data on the population 15 years and older in each state were obtained from the US Census Bureau. Estimates of the percentage alcohol by volume for each beverage type and year were developed from a variety of industry and government alcohol monopoly sources. These estimates utilized data on the percentage alcohol by volume (ABV) of specific brands and their share of the market in the US or a specific state to estimate the mean %ABV of beer, wine and spirits sub-types such as light beer or vodka for each year. The market shares of these sub-types were then used to estimate the mean %ABV for each beverage in each year (Kerr et al., 2004a; Kerr et al., 2006a; Kerr et al., 2006b).
With respect to the link between alcohol and fatal motor vehicle accidents, traffic density is a potential confounder, as both alcohol consumption and traffic volume could be related to a common factor such as income. In order to control for changes in traffic intensity, we included annual data from the Federal Highway Administration on the total number of miles driven in the US for the period 1950–2002 (see http://www.fhwa.dot.gov/ohim/summary95).
The technique for time series analyses suggested by Box and Jenkins (1976) was used to estimate the relationship between per capita alcohol consumption and accidental deaths partly motivated by the fact that most previous studies have applied this technique.
This approach, often called ARIMA modelling, relies on the temporal co-variation between annual changes in the series to avoid the risk of obtaining a spurious correlation between series that have non-stationary trends (e.g., Skog, 1988). Further, this technique enables modelling of any systematic impact of measurement errors and factors not included in the model on the dependent series, which increases the reliability of the estimates. This is accomplished by including moving average (MA) or autoregressive (AR) terms in the statistical model. The impact of per capita consumption on accidents will be estimated for the whole adult male and female population (15+) as well as in different age groups. The age-specific results will be pooled into an overall estimate excluding the oldest category in order to compare with previous studies of Europe and Canada in which this calculation has been carried out.
There is no theoretical reason for assuming a time lag in the relationship between drinking and accidents, as an alcohol-related accident is likely to happen in connection with a single drinking occasion. Further, there is no evidence in the literature that would cause us to expect a non-linear risk function. Thus, linear models were estimated in accordance with previous studies (Skog, 2001a; 2003). The model can be written as follows:
Where ▽ refers to the differencing operator, M represents the output series (gender- and age-specific accident mortality rates), a is the constant (which marks average annual changes in M due to other causes), A is the input series (per capita alcohol consumption 15+), b is the effect parameter, i.e., the absolute change in M due to a 1-litre increase in A. The parameter c is the potential effect on M due to dummy variables (D), and finally, N refers to the noise term in which other casual factors are included. The Box-Ljung statistic was used to test for residual autocorrelation.
RESULTS
The link between per capita consumption and fatal accidents in the US
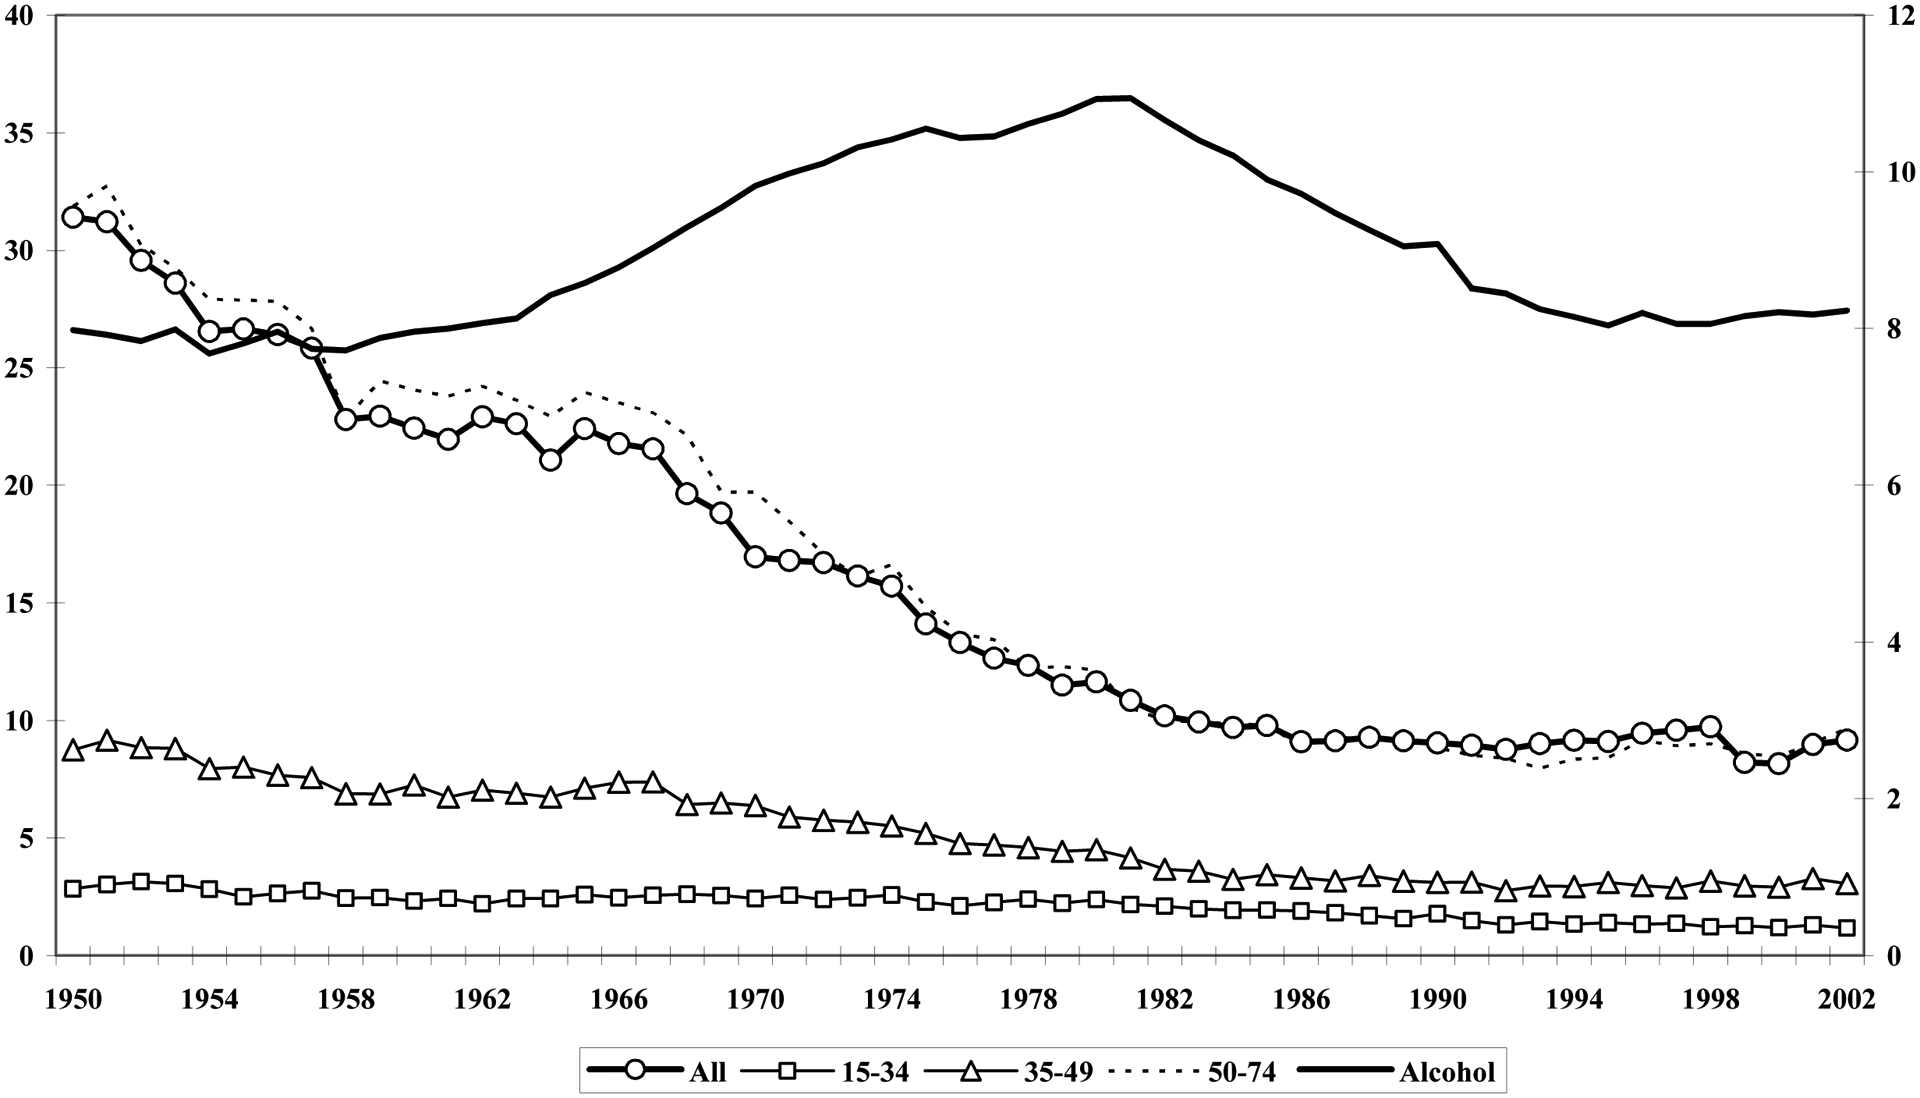
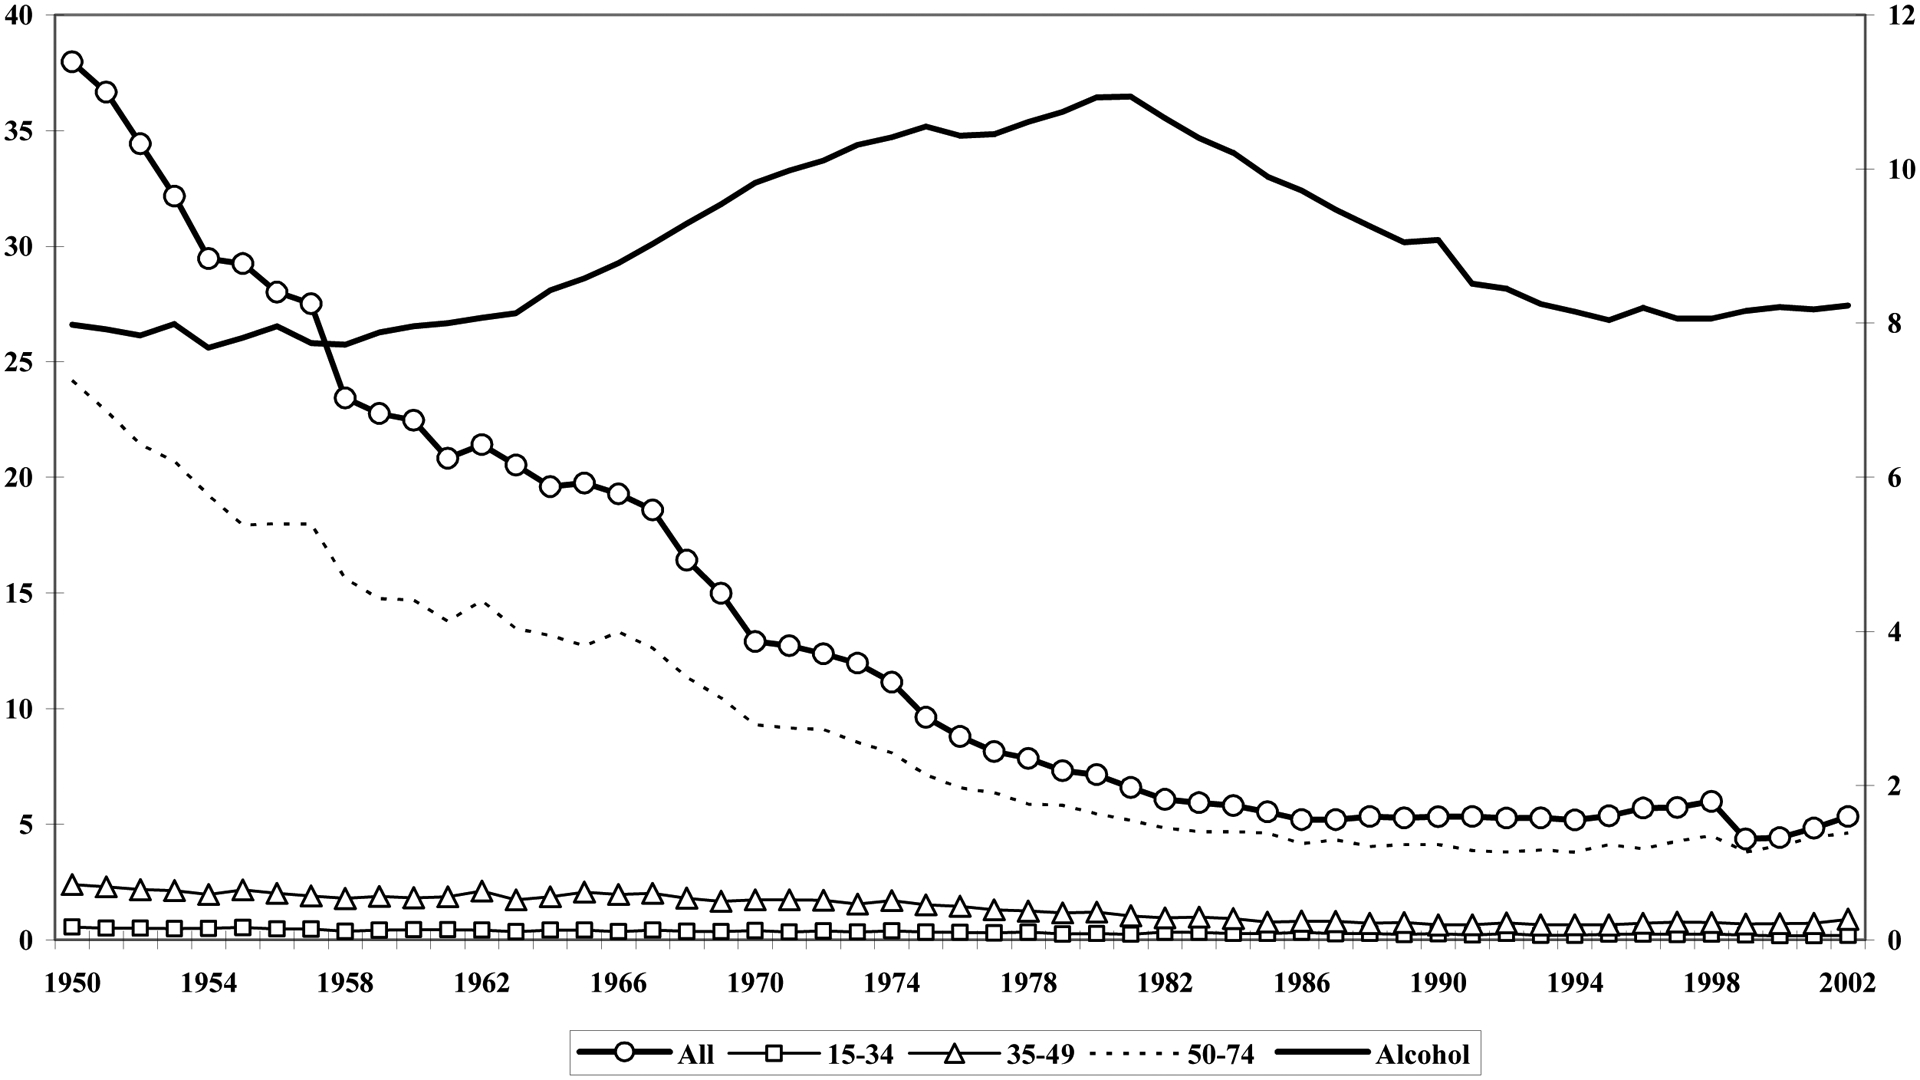
Trends in alcohol consumption and male and female fatal accidents in different age groups are presented in Figures 1 and 2. Male mortality trends and per capita consumption decline and level off in a similar way from 1980 onwards, but there is less convergence during the earlier part of the study period, particularly during the 1970s. For women, fatal accidents almost consistently decline in the whole population up to the 1980s when they level out, whereas for the two younger age groups, there is a minor increase up to the 1970s and then a fairly stable level.
Figure 1.
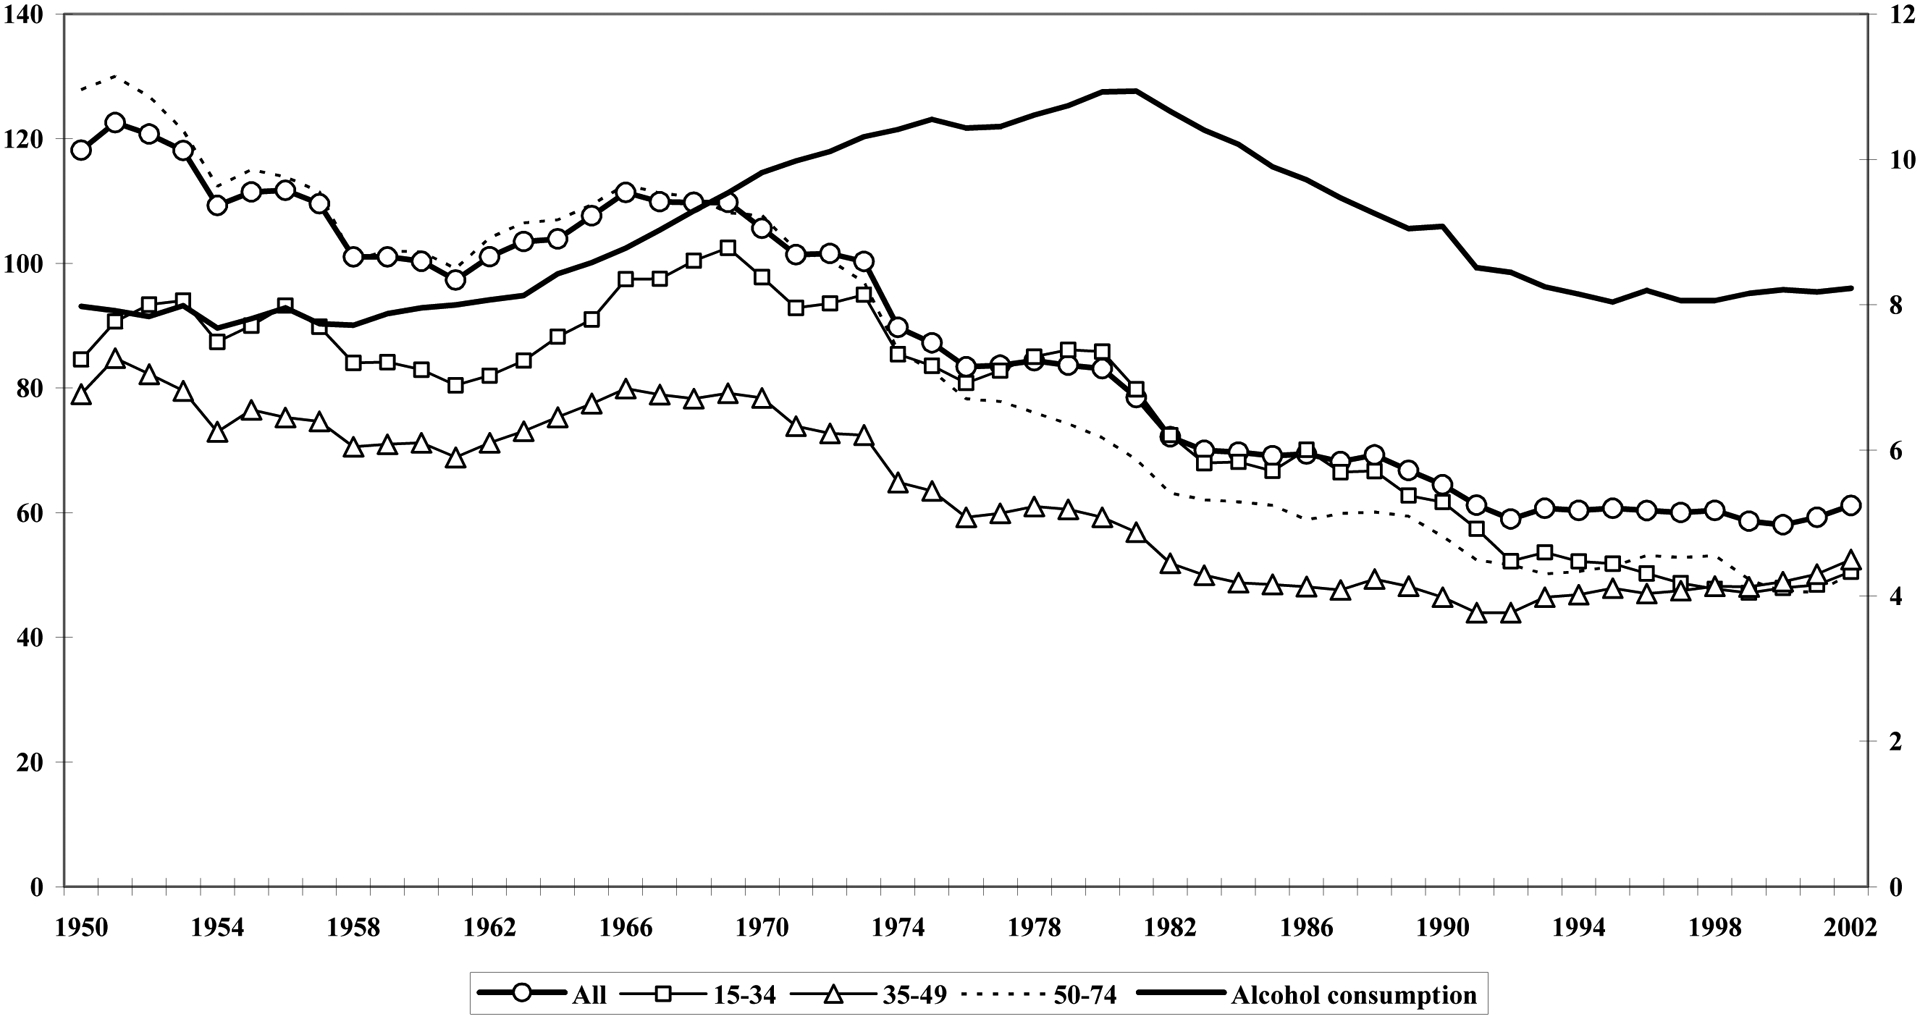
Trends in age-specific male accident mortality per 100 000 inhabitants (left axis) and alcohol consumption (100%) per inhabitant 15 years and older (right axis) in the Unites states 1950–2002.
Figure 2.
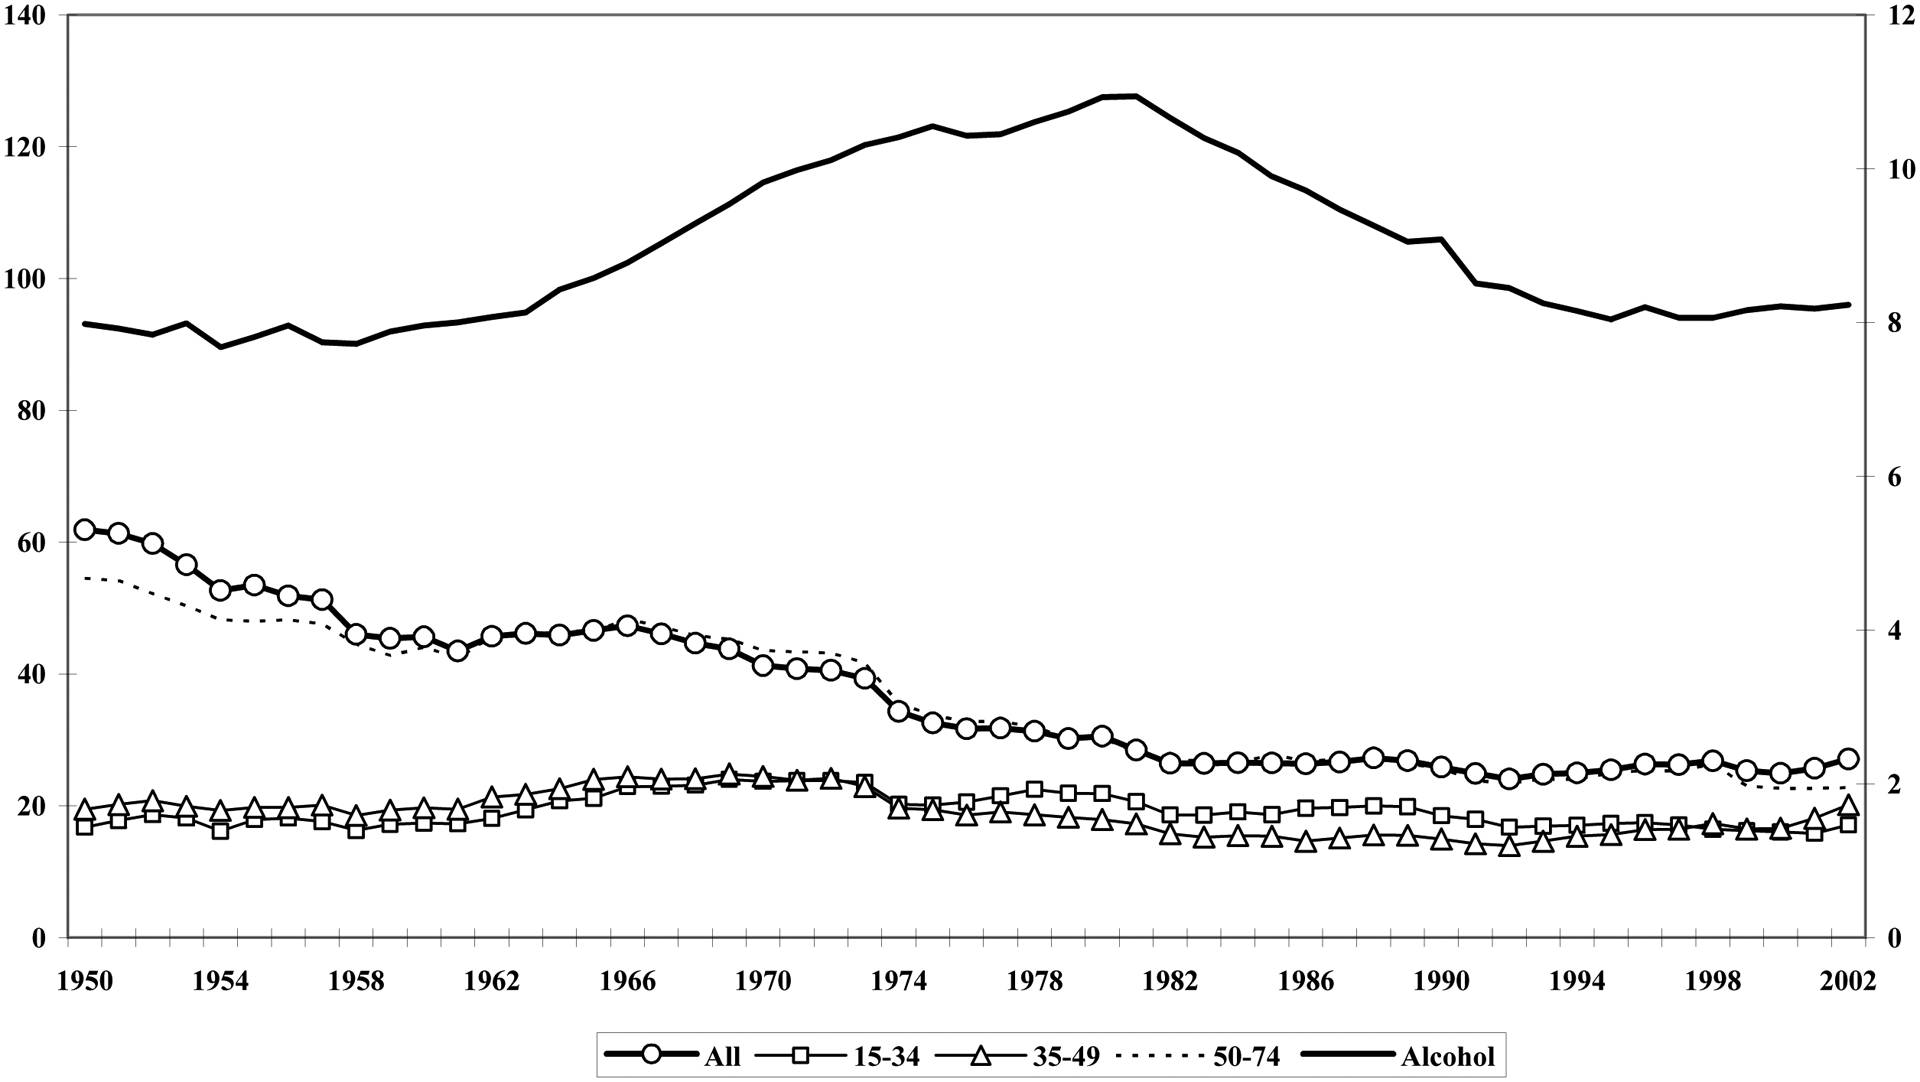
Trends in age-specific female accident mortality per 100 000 inhabitants (left axis) and alcohol consumption (100%) per inhabitant 15 years and older (right axis) in the Unites states 1950–2002.
Results of the time series analyses of overall accidents by gender and age are presented in Table 2. Estimates are presented for the whole male and female population above 15 years and for the age groups 15–34, 35–54 and 55–74 years. These age-specific estimates are also pooled into a measure of the overall effect in the age group 15–74 years, which thus excludes the oldest age group (75+). In addition to parameter estimates and their standard errors, the structure of the ARIMA model fitted to the data is reported as well as the Box-Ljung test for uncorrelated residuals in each model (at lag 10).
Table 2.
Effect estimates of per capita alcohol consumption (litres of alcohol 100% per inhabitant 15 years and above) on age-specific male and female accidents rates (per 100,000) in the United States. Models estimated on differenced data.
| Males | Females | |||||||
|---|---|---|---|---|---|---|---|---|
| Estimate | SE | Model | Q(10) | Estimate | SE | Model | Q(10) | |
| Total accidents | ||||||||
| Total 15+ | 4.04(*) | 2.23 | 0,1,1 | 5.57 | 0.08 | 1.08 | 1,1,0 | 6.61 |
| 15–34 | 7.25** | 2.49 | 0,1,1 | 8.21 | 1.36(*) | 0.69 | 0,1,1 | 8.21 |
| 35–54 | 2.62 | 1.82 | 0,1,0 | 6.14 | 0.49 | 0.70 | 1,1,0 | 7.80 |
| 55–74 | 3.94(*) | 2.32 | 1,1,0 | 8.39 | −0.15 | 1.03 | 0,1,0 | 9.95 |
| Pooled 15–74 | 4.42 * | 1.34 | 0.56 | 0.47 | ||||
| Motor vehicle accidents # | ||||||||
| Total 15+ | 3.19* | 1.28 | 1,1,0 | 9.22 | 0.52 | 0.50 | 1,1,0 | 8.87 |
| 15–34 | 5.22** | 1.94 | 0,1,1 | 8.41 | 1.10(*) | 0.65 | 0,1,0 | 9.35 |
| 35–54 | 2.57* | 0.97 | 0,1,1 | 5.96 | 0.40 | 0.51 | 1,1,0 | 8.39 |
| 55–74 | 1.75 | 1.09 | 0,1,1 | 12.67^ | 0.69 | 0.60 | 1,1,0 | 8.44 |
| Pooled 15–74 | 3.18 ** | 0.81 | 0.73 * | 0.34 | ||||
| Accidental falls | ||||||||
| Total 15+ | −0.26 | 0.52 | 0,1,0 | 10.0 | 0.10 | 0.59 | 2,1,0 | 9.33 |
| 15–34 | 0.18* | 0.08 | 1,1,0 | 10.0 | 0.01 | 0.02 | 2,1,0 | 10.2 |
| 35–54 | 0.03 | 0.22 | 0,1,0 | 12.7 | 0.09 | 0.06 | 2,1,0 | 10.12 |
| 55–74 | −0.20 | 0.61 | 0,1,0 | 8.4 | −0.20 | 0.47 | 1,1,0 | 8.0 |
| Pooled 15–74 | 0.00 | 0.21 | −0.03 | 0.03 | ||||
| Other accidents | ||||||||
| Total 15+ | 0.93 | 0.83 | 0,1,0 | 1.89 | 0.07 | 0.76 | 2,1,0 | 15.1^ |
| 15–34 | 1.81* | 0.86 | 0,1,0 | 5.9 | 0.28 | 0.18 | 0,1,0 | 5.3 |
| 35–54 | 0.21 | 0.91 | 0,1,0 | 6.4 | 0.06 | 0.37 | 0,1,0 | 9.4 |
| 55–74 | 1.29 | 1.28 | 0,1,0 | 0.63 (*) | 0.39 | 0,1,0 | 8.9 | |
| Pooled 15–74 | 1.10 (*) | 0.59 | 0.32 | 0.19 | ||||
p<0.10,
p<0.05,
p<0.01,
p<0.001.
Q-tests for uncorrelated residuals do not suggest unsystematic variation p<0.20
results estimated in models controlling for miles driven.
The findings suggest that total accident mortality among men 15 years and older is positively associated with per capita alcohol consumption. The male parameter estimate of 4 implies that a one-litre increase in per capita consumption is associated with a rise of 4 male fatal accidents per 100,000 inhabitants, although the effect is only marginally significant (p=0.07). The age-specific effects are positive, but statistical significance is only found in the youngest age group with a parameter estimate of 7.2. The average effect for men in the three age groups is 4.4, which is statistically significant (p<0.01). For women, the overall estimate is 0.08 and non-significant, but a nearly significant effect of 1.4 is reached in the youngest age group, 15–34 (p=0.07). Estimates in the other age groups as well as the pooled effects across age groups are not significant.
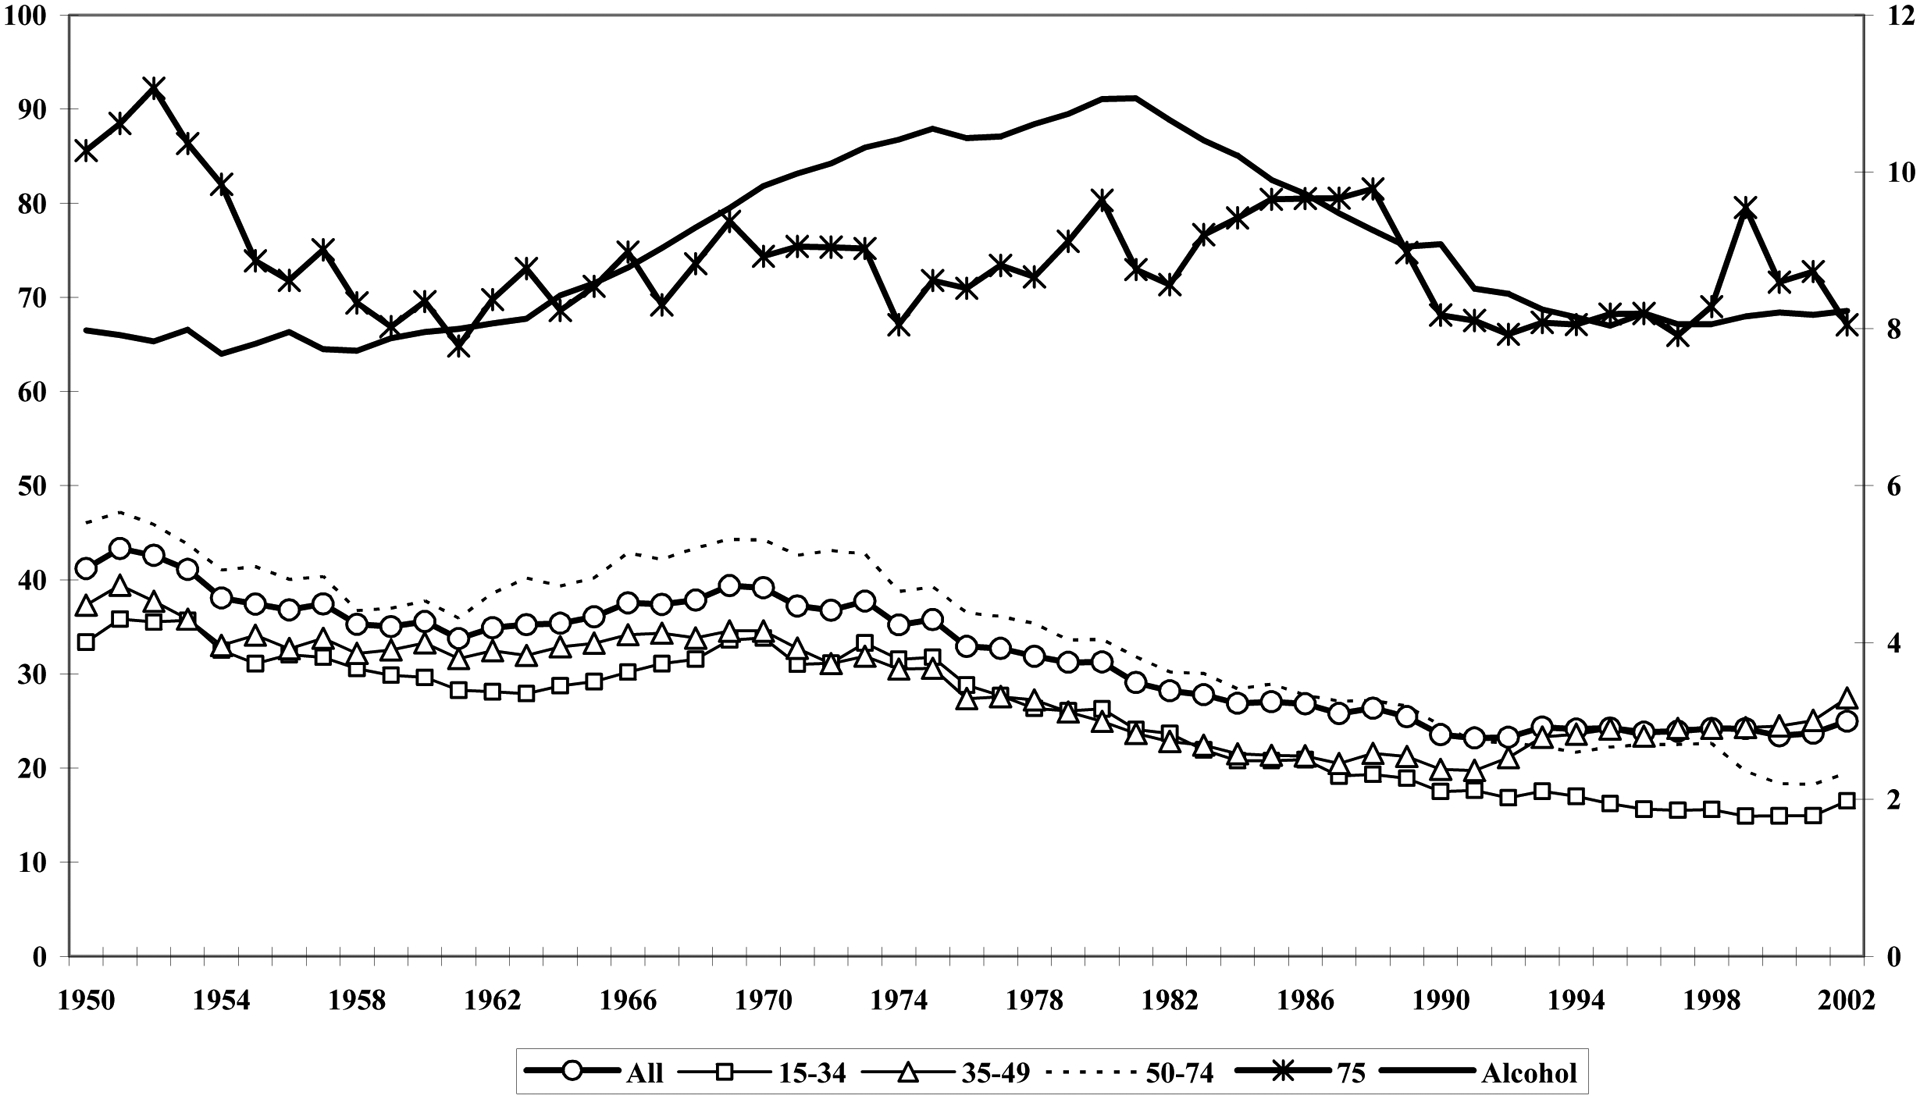
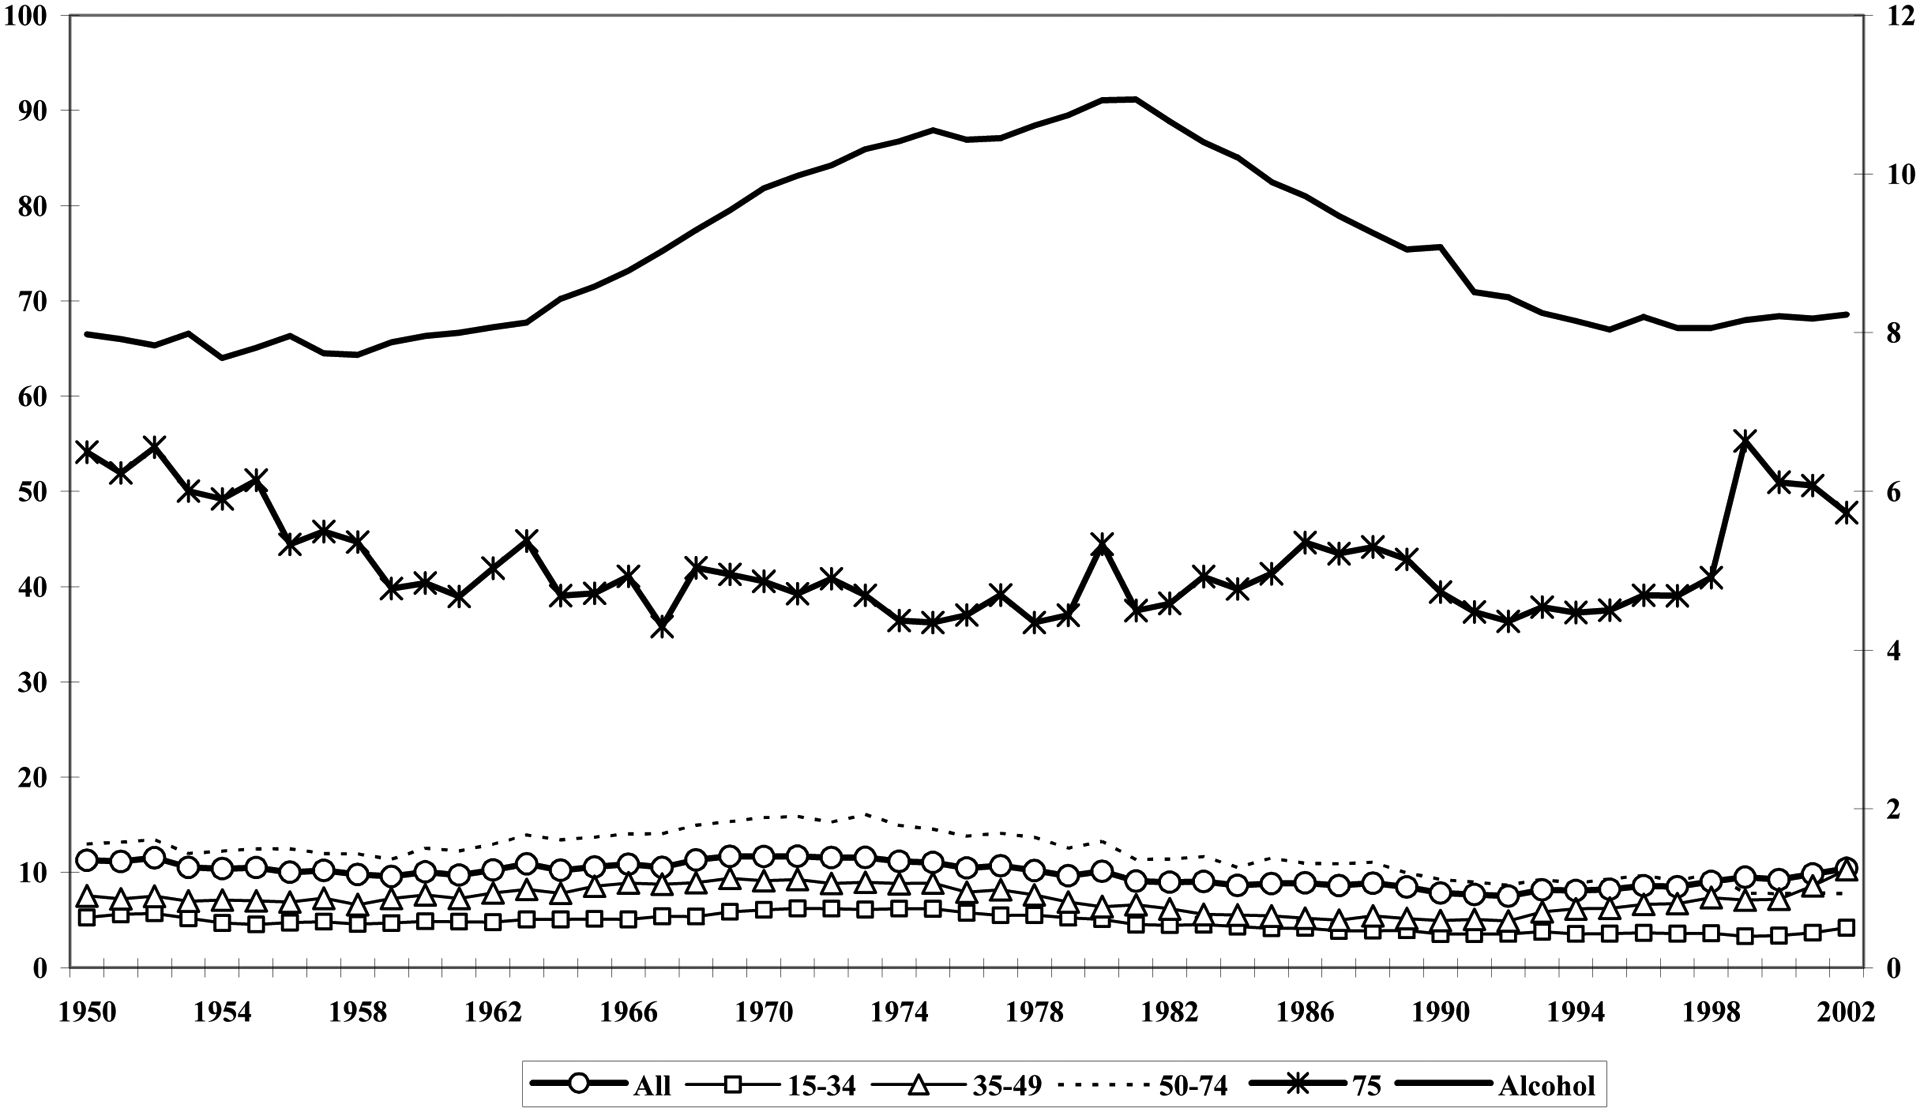
Based on visual inspection, it seems that male and female fatal motor vehicle accidents develop more in line with per capita consumption, although mortality rates peak somewhat earlier (in the late 1960s) than does alcohol consumption (1980) (Figures 3–4). Estimation of time series models, controlling for the number of miles driven, reveals a positive and significant association for men, with an estimated effect of 3.2, and for the age groups 15–34 and 35–54, with alcohol effects of 5.2 and 2.6, respectively. Without controlling for the number of miles driven, stronger effects were established, with 3.8 for all men, 5.7 in the age group 15–34, and 3.0 in the age group 35–54. In addition, the alcohol effect in the age group 55–74 years became larger and almost significant when number of miles driven was not included in the model (2.4, p=0.06). The average alcohol effect across the three age groups was 3.2 and statistically significant (p<0.01).
Figure 3.
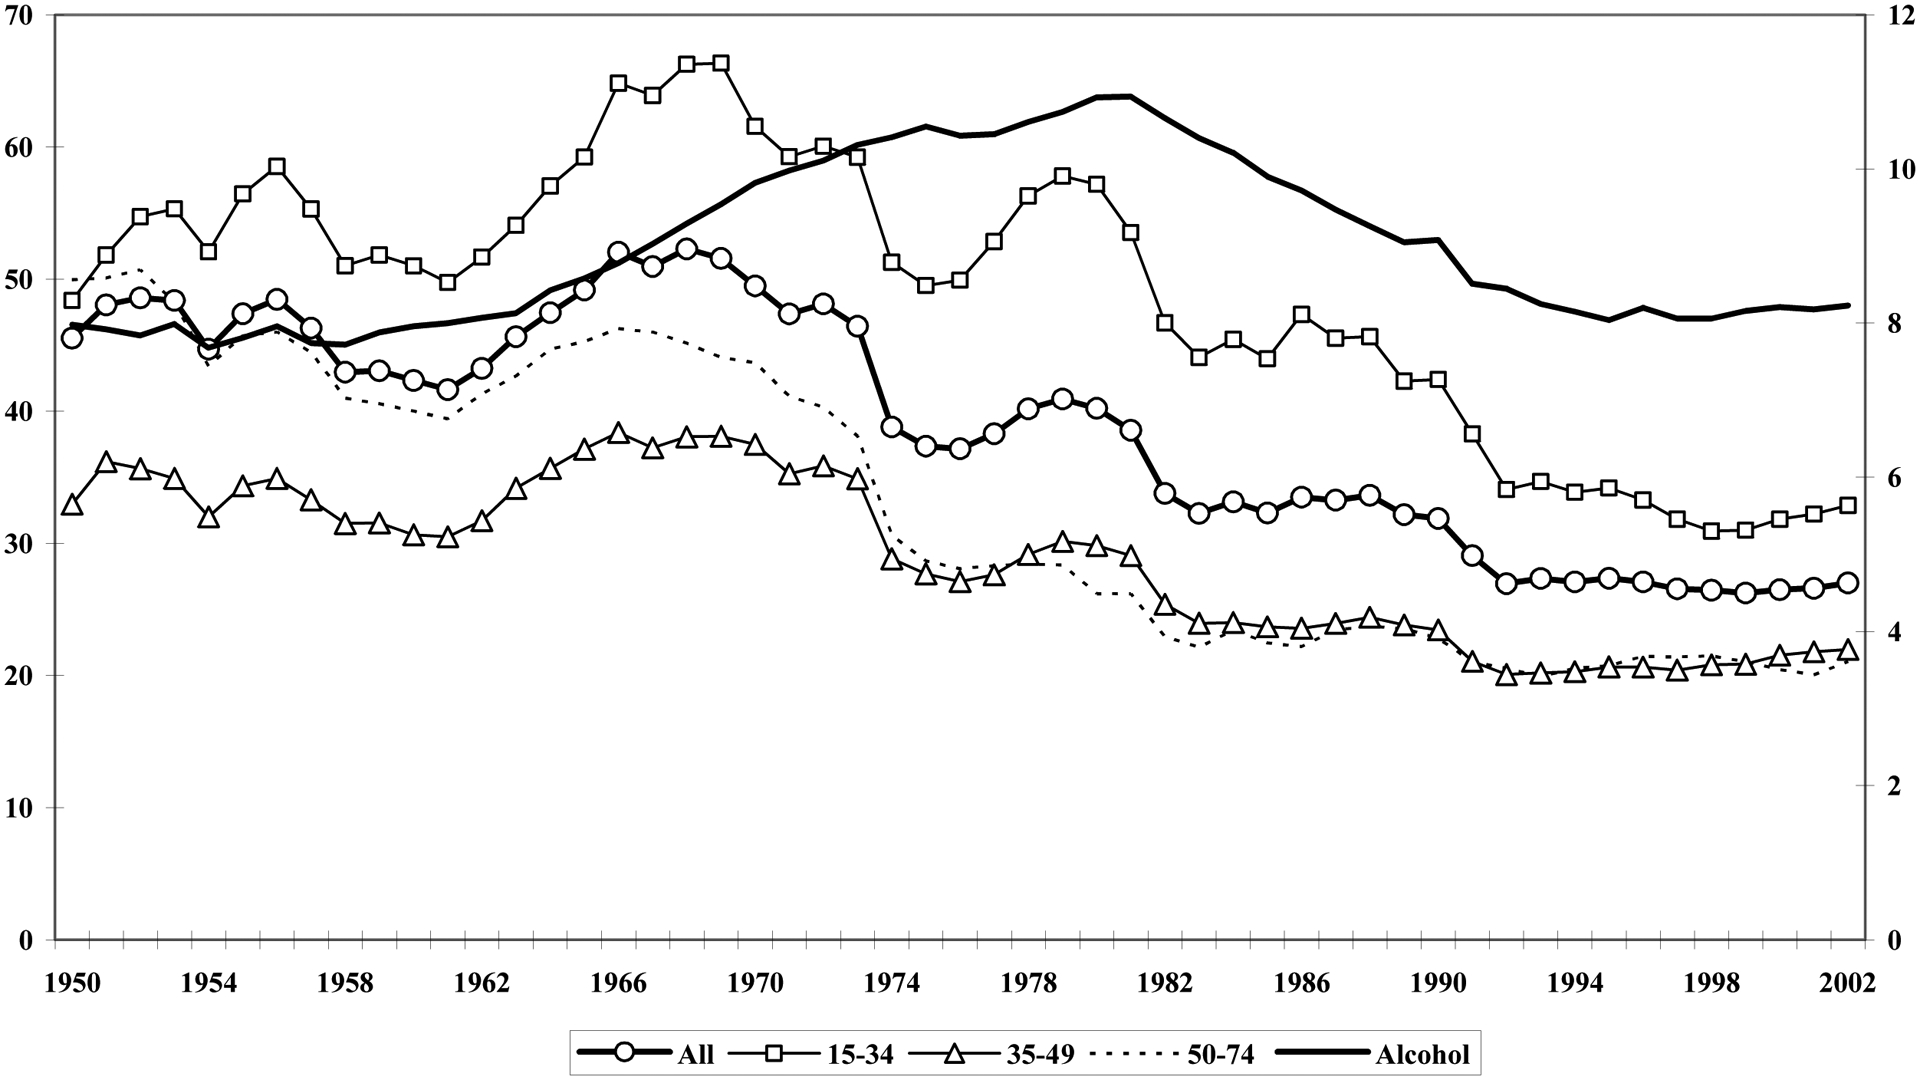
Trends in age-specific male motor vehicle accident mortality per 100 000 inhabitants(left axis) and alcohol consumption (100%) per inhabitant 15 years and older (right axis) in the Unites states 1950–2002.
Figure 4.
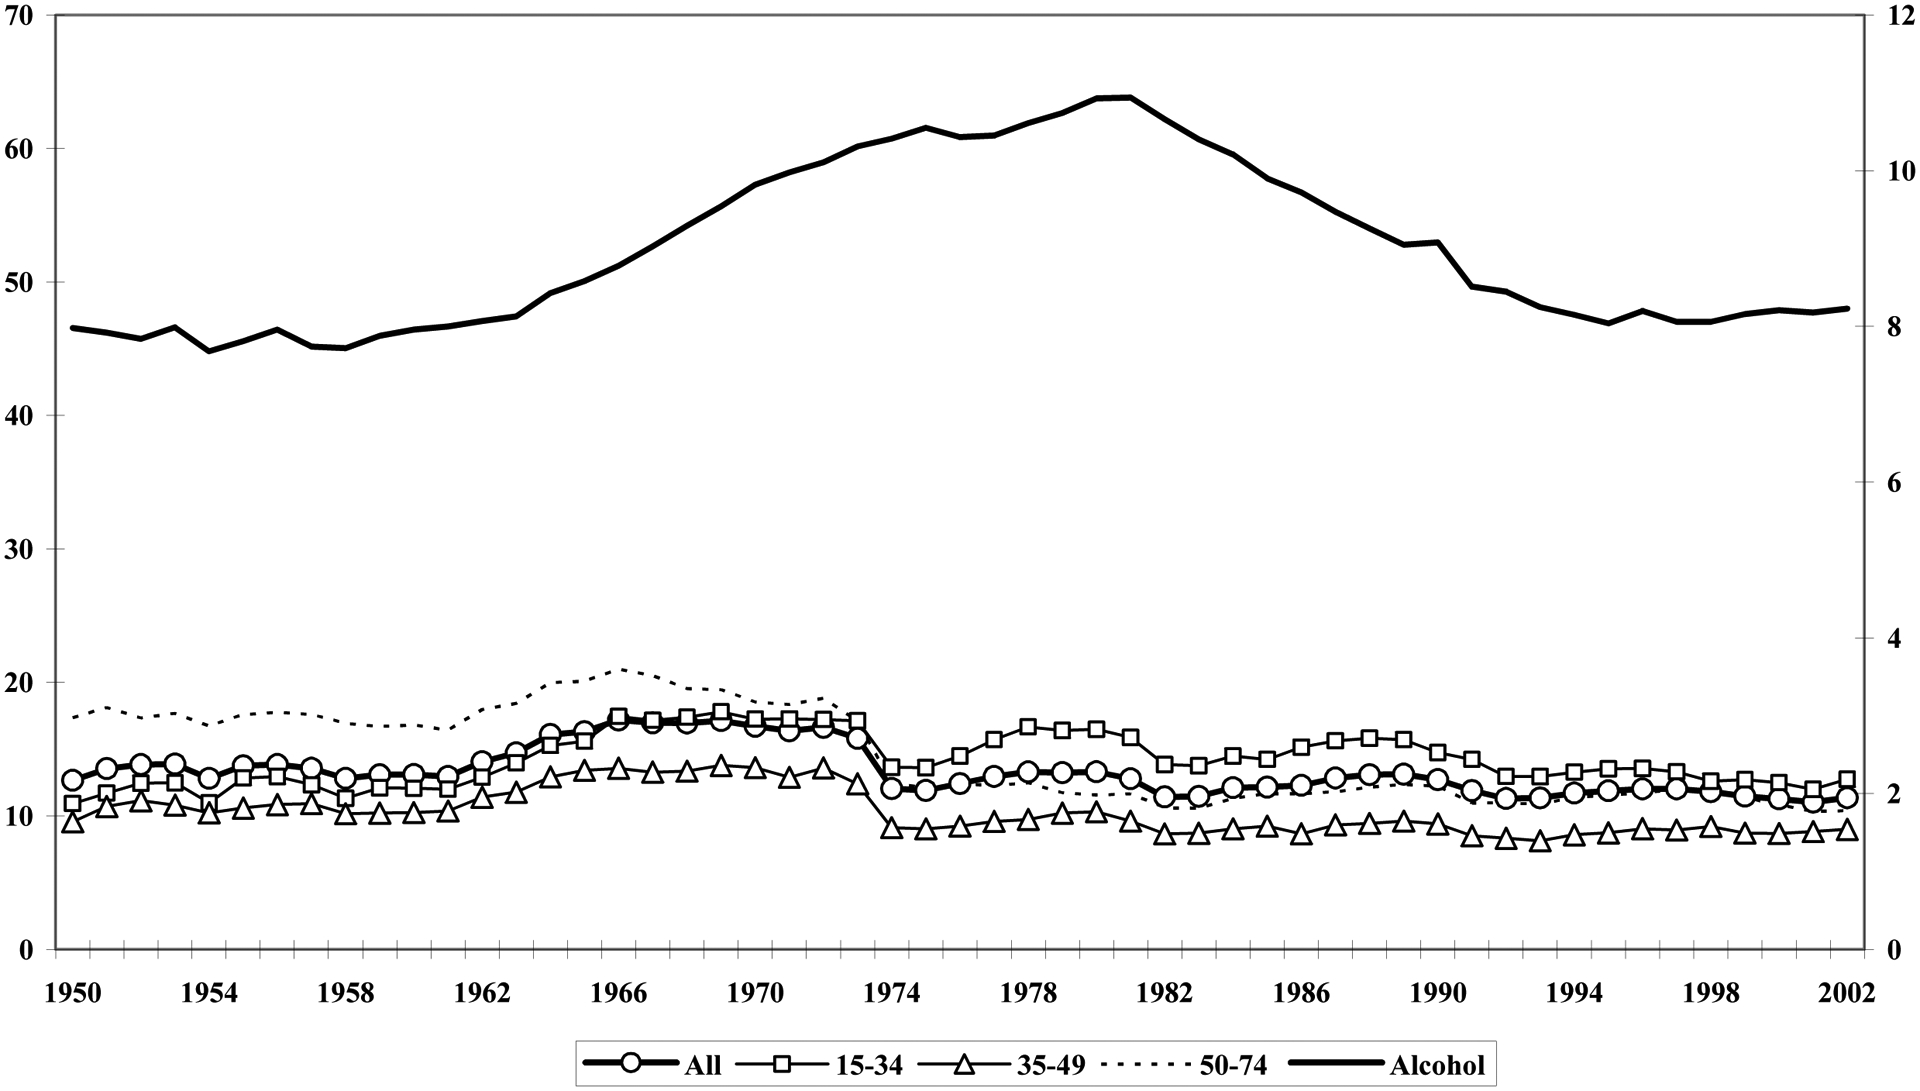
Trends in age-specific female motor vehicle accident mortality per 100 000 inhabitants(left axis) and alcohol consumption (100%) per inhabitant 15 years and older (right axis) in the Unites states 1950–2002.
For women, the overall parameter estimate of 0.5 was not statistically significant and the only age-specific effect nearing significance was in the age group 15–34 (1.4, p=0.07).
The average female alcohol effect across the three age groups was, however, statistically significant (0.7, p<0.05). (In the case of female motor vehicle accidents, control for traffic density only marginally affected the estimates).
As to accidental falls, the development does not correspond with per capita consumption trends, and both male and female rates decline during the study period, particularly up to around 1990 (Figures 5–6). This pattern of mismatch is echoed in the time series analyses, where a positive significant effect is only found among men in the age group 15–34 years and not in any other male or female age group.
Figure 5.
Trends in age-specific male falling accident mortality per 100 000 inhabitants(left axis) and alcohol consumption (100%) per inhabitant 15 years and older (right axis) in the Unites states 1950–2002.
Figure 6.
Trends in age-specific female falling accident mortality per 100 000 inhabitants (left axis) and alcohol consumption (100%) per inhabitant 15 years and older (right axis) in the Unites states 1950–2002.
Male trends for the remaining subgroup of fatal accidents denoted “other accidents” show declining rates during the 1950s, upward trends in the 1960s followed by declining rates during the 1970s and 1980s. For women, a similar development was revealed. As with falling accidents, the only significant effect was revealed among males aged 15–34 with an estimate of 1.8.
US findings in comparison with Europe and Canada
Table 3, which includes similar gender-specific estimates from Western Europe and Canada, shows the present US findings in an international perspective. An age-specific comparison restricted to the youngest age category is also presented for overall accidents in Western Europe (not available in Canada).
Table 3.
Effect estimates of per capita alcohol consumption (litres of alcohol 100% per inhabitant 15 years and above) on male and female fatal accidents rates (per 100,000), Results for the US in comparison with Canada and Europe.
| Males | Females | |||||||||
|---|---|---|---|---|---|---|---|---|---|---|
| United States | Canada | Northern Europe | Central Europe | Southern Europe | United States | Canada | Northern Europe | Central Europe | Southern Europe | |
|
Total accidents Total 15+ |
4.4* | 5.9* | 5.2* | 2.1* | 1.6* | 0.6 | 2.0* | 1.3* | 0.5* | 0.4* |
| 15–34 | 7.2* | n.a. | 4.5* | 2.9* | 1.8* | 1.4(*) | n.a. | 1.3* | 0.5* | 0.3* |
|
Motor vehicle accidents# Total 15+ |
3.2*, | 3.6* | 0.05 | 2.1* | 0.8* | 0.7* | 2.0* | 0.6* | 0.4* | 0.2* |
|
Falls Total 15+ |
0.0 | 0.3* | 1.2* | 0.3* | −0.03 | −0.0 | 0.1 | 0.1 | 0.1* | 0.04 |
|
Other accidents Total 15+ |
1.1(*) | 1.9* | 2.2* | −0.07 | 0.4 | 0.3 | 1.0* | 0.5 | 0.0 | 0.1 |
p<0.05,
=results for the US and Canada estimated in models controlling for miles driven.
With regard to overall male fatal accidents, the US effect estimate of 4.4 is not significantly different from the effect found in Northern Europe (5.2) or Canada (5.9), but significantly stronger than that found in central and Southern Europe (2.1 and 1.6, respectively). The estimated effect for women of 0.6 was weaker than in Northern Europe (1.3) and Canada (2.0), but similar to the effect revealed in central and Southern Europe (0.5 and 0.4, respectively). However, the female parameter estimate in the US was not statistically significant, in contrast to that in Canada and Western Europe. Another result was that the relatively strong impact on fatal accidents in the age group 15–34 years in the US was not found in European countries.
With respect to alcohol and fatal motor vehicle accidents, the association for men of 3.2 was stronger than in Northern Europe (0.05, not significant), central Europe (2.1) and Southern Europe (0.8) and more similar to the Canadian finding (3.6). For women, on the other hand, the effect of 0.7 was weaker than in Canada (2.0), similar to Northern Europe (0.6) and stronger than in central and Southern Europe (0.4 and 0.2, respectively). It should be mentioned that, in contrast to the European analyses, the models estimated in Canada and the US included control for number of miles driven, which reduced the alcohol effect in the US by about 15%. Without this control variable, the difference to Europe would most likely have been even larger.
As concerns accidental falls, the association with per capita consumption in the US was comparatively weak. In particular the results for men form a contrast to the significant alcohol effects demonstrated in Northern Europe, central Europe and Canada. For women, on the other hand, weak and non-significant effects were generally found also in the other regions. An additional pattern was discovered concerning the category “other accidents”, such that the nearly significant effect of 1.1 (p=0.07) found for men, was somewhat lower than in Northern Europe (2.2) and Canada (1.9), but stronger than in other parts of Europe where no significant effect was demonstrated. As regards the impact of per capita consumption on female “other accidents”, the only significant effect was found in Canada (1.0).
Discussion
The main goal of the present paper was to estimate to what extent a change in per capita consumption has influenced the number of fatal accidents in the US during the postwar period (1950–2002) on the basis of time series analysis. A second aim was to put the US results in an international perspective by comparing the outcome with results from similar studies from Europe and Canada.
The findings suggest that the strongest impact on overall accidents rates of a change in population-level consumption in the US is in relation to male accidents and particularly in the age group 15–34 years whereas no significant effect on overall female accident mortality was established. Regarding specific categories of accidents, the effect on fatal motor vehicle accidents accounted for a large part of the overall effect for men in total as well as in the age groups 15–34 and 35–49. Also for women was a significant effect established in total and the effect for the age group 15–34 years reached barely statistical significance. With respect to fatal falling accidents and other accidents, the only significant effects were found among young males (15–34 years), whereas no significant relationship was found for men or women in total or in any other age group.
The results revealed some similarities with previous research from Europe and Canada, but also some notable differences. With respect to overall male fatal accidents, the impact of per capita consumption was relatively strong in the US, similar to Northern Europe and Canada, and stronger than in central and Southern Europe. A relatively strong impact was particularly seen in the age group 15–34 years, where the effect was stronger than in European countries. However, the impact of per capita consumption on overall female fatal accidents was relatively weak in the US and not statistically significant in contrast to Canada and Europe.
A thought-provoking outcome was that the effect on fatal motor vehicle accidents was stronger than in Europe but similar to the previous results for Canada. One possible explanation for the relatively strong association between per capita consumption and motor vehicle accidents is the high number of motor vehicles per capita in the US in combination with a permissive view on drunken driving. In 2001, for instance, the US had the highest number of motor vehicles per capita, with 776 per 1000 inhabitants, as compared with 450 in Western Europe and 550 in Canada (UNECE, 2003). Consider also the fact that the US and Canada have relatively high blood alcohol concentration limits (BAC) for drunken driving (minimum 0.08 in 2003), whereas few Western European countries have limits higher than 0.05 (www.driveandstayalive.com).
It is difficult to determine whether the different results across gender and age groups is related to differences in the fraction of alcohol-related cases in these accidents or whether drinking in these groups more closely follows changes in per capita consumption. In the case of traffic accidents, however, individual-level data from the US reveal a similar pattern of alcohol involvement with respect to gender and age (Smith et al., 1999). For instance, the highest proportion of intoxicated drivers (51%) was found in the age group 25–34 years, and this proportion gradually declines in the older age groups. Further, that a significant effect more often was found in younger male age groups, also for other types of accidents, accords with international findings showing that alcohol accounts for many accidents in these age groups (e.g., Mäkelä, 1998). Thus, the present findings seem to at least partly reflect differences in the extent to which alcohol accounts for various accidents in different groups.
It should be noted that these estimated relationships do not tell us to what degree the fraction of alcohol-related accidents in the US is different from that in other countries owing to variations in drinking levels. Assuming that the linear model used in these estimations is valid over the whole range (for a discussion of such methods see Norström (1987)), it is possible to estimate an alcohol attributable fraction (AAF) for accidents, as has been done for male overall accident mortality in Europe (Skog, 2001a). The AAF for Northern Europe was estimated to 45%, and corresponding estimates for central Europe and Southern Europe were 40 and 35 %, respectively. By applying the same method to the US, it is estimated that the annual total of alcohol-related fatal accidents amounts to 35.9 per 100,000 inhabitants or 41% of all accidents. This suggests that that the importance of alcohol in male fatal accidents in Western Europe and the US is fairly similar. Furthermore, the US estimate corresponds well with the individual results reported previously, suggesting that around 39% of all fatal accidents are alcohol related.
These AAF-estimates also verify what is well-known; that many other factors besides alcohol consumption influence the development in fatal accidents. This was also clearly demonstrated through the occurrence of a temporal mismatch of trends during several parts of the study period. However, the results of the time series analyses suggest that changing per capita consumption has at least partly explained the development of male fatal accidents in the US, particularly motor vehicle accident rates. Further, it seems that this effect has been most important in the age group 15–34 years. From a policy perspective, these findings suggest that a reduction in per capita consumption would have its most preventive impact in these groups.
Figure 7.
Trends in age-specific male mortality from “other accidents “per 100 000 inhabitants (left axis) and alcohol consumption (100%) per inhabitant 15 years and older (right axis) in the Unites states 1950–2002.
Figure 8.
Trends in age-specific female mortality from “other accidents “ per 100 000 inhabitants (left axis) and per capita alcohol consumption (100% alcohol per adult) in the Unites states 1950–2002.
Acknowledgements
This research was supported by research grant R01 AA014362 from the National Institute on Alcohol Abuse and Alcoholism.
Footnotes
Publisher's Disclaimer: This is a PDF file of an unedited manuscript that has been accepted for publication. As a service to our customers we are providing this early version of the manuscript. The manuscript will undergo copyediting, typesetting, and review of the resulting proof before it is published in its final citable form. Please note that during the production process errors may be discovered which could affect the content, and all legal disclaimers that apply to the journal pertain.
References
- Box GEP & Jenkins GM (1976) Time Series Analysis: Forecasting and Control, (Revised Edition) (San Francisco, Holden-Day: ). [Google Scholar]
- Brismar B & Bergman B (1998) The significance of alcohol for violence and accidents, Alcoholism: Clinical and Experimental Research; 22, 299–306 [DOI] [PubMed] [Google Scholar]
- Hingson R & Howland J (1993) Alcohol and non-traffic unintended injuries. Addiction:88: 877–883 [DOI] [PubMed] [Google Scholar]
- Hingson R & Howland J (1987) Alcohol as a risk factor for injury or death resulting from accidental falls: a review of the literature. Journal of Studies of Alcohol: 54: 441–449 [DOI] [PubMed] [Google Scholar]
- Kerr WC, Brown S, Greenfield TK (2004a) National and state estimate of the mean ethanol content of beer sold in the US and their impact on per capita consumption estimates: 1988 to 2001. Alcohol: Clinical and Experimental Research 28: 1524–1532. [DOI] [PubMed] [Google Scholar]
- Kerr WC, Greenfield TK, Tujague J Brown S. (2006a) The alcohol content of wine consumed in the US and per capita consumption: New estimates reveal different trends. Alcohol: Clinical and Experimental Research 30: 516–522. [DOI] [PubMed] [Google Scholar]
- Kerr WC, Greenfield TK, Tujague J (2006b) Estimates of the mean alcohol concentration of the spirits, wine and beer sold in the US and per capita consumption for 1950 to 2002, submitted. [DOI] [PubMed]
- Nephew TM Nephew H Yi, GD Williams, FS Stinson, (2004) MC Alcohol Epidemiologic Data Reference Manual, Vol. 1, US Apparent Consumption of Alcoholic Beverages [Google Scholar]
- Noland RB. Traffic fatalities and injuries: the effect of changes in infrastructure and other trends. Accid Anal Prev. 2003;35(4):599–611. [DOI] [PubMed] [Google Scholar]
- Norström T, & Ramstedt M (2005). Mortality and population drinking: a review of the literature. Drug and Alcohol Review: 24, 537–547. [DOI] [PubMed] [Google Scholar]
- Rehm J; Room R; Monterio M; Gmel G; Graham K; Rhen N; Sempos CT; Rehn N & Jernigan D. (2004) Alcohol. In Ezzati M; Lopez AD; Rodgers A. & Murray CJL. (eds.) Comparative Quantification of Health Risks. Global and Regional Burden of Disease Attributable to Selected Major Risk Factors: Volume 1. Geneva: World Health Organisation, 2004, pp. 959–1108. [Google Scholar]
- Romelsjö A (1995) Alcohol consumption and unintentional injury, suicide, violence, work performance, and inter-generational effects. In Holder H. & Edwards G. (eds.) Alcohol and public policy – evidence and issues. Oxford University Press. [Google Scholar]
- Roizen R, Kerr WC, Fillmore KM. (1999) Cirrhosis mortality and per capita consumption of distilled spirits, United States, 1949–94: Trend analysis. BMJ: British Medical Journal. [DOI] [PMC free article] [PubMed] [Google Scholar]
- Rossow I Pernanen K. & Rehm J. (2001) Accidents, suicide and violence. In Klingemann H. & Gmel G. (eds.). Mapping the Social Consequences of Alcohol Consumption, pp. 93–112. Dordecht, Netherlands: Kluwer Academic Publishers. [Google Scholar]
- Skog O-J, (2001a) Alcohol consumption and overall accident mortality in 14 European countries. Addiction;96:S35–S47. [DOI] [PubMed] [Google Scholar]
- Skog O-J. (2001b) Alcohol consumption and mortality rates from traffic accidents, accidental falls, and other accidents in 14 European countries. Addiction; 96:S49–S58. [DOI] [PubMed] [Google Scholar]
- Skog O-J. (2003) Alcohol and fatal accidents in Canada 1950–1998. Addiction; 98:883–93. [DOI] [PubMed] [Google Scholar]
- Smith GS, Branas CC, Miller TR (1999). Fatal nontraffic injuries involving alcohol: a metaanalysis. Annuals of Emergency Medicine, 33, 659–668 [PubMed] [Google Scholar]