Correction to: Scientific Reports 10.1038/s41598-021-88887-0, published online 05 May 2021
The original version of this Article contained errors in Figure 5, where data and statistical results shown in panels C and D were based on a previous analysis which did not reflect the aggregation of image data points to individual brain slices.
As a result, the legend of Figure 5
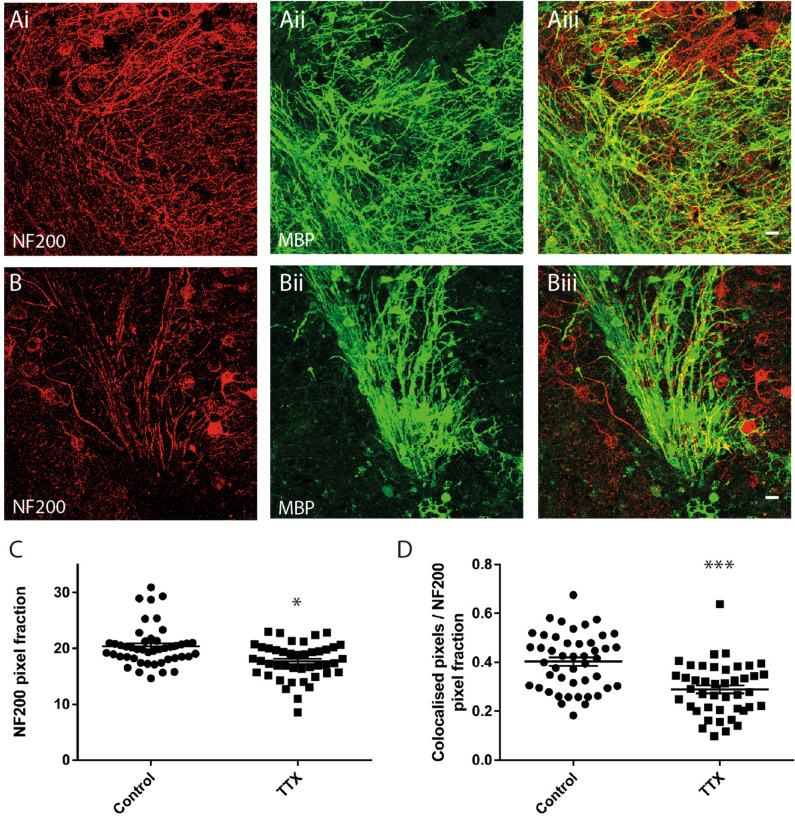
“Sustained inhibition of neuronal activity reduces myelination of cerebellar white matter. (A,B) Maximum projection images from representative control (A) and TTX (B) treated cerebellar slices showing immunofluorescent signals for anti-NF200 (Ai,Bi) anti-MBP (Aii,Bii), and co-localisations used to quantify myelination (Aiii,Biii). (C) Quantification of anti-NF200 signals. Mean NF200 pixel fraction is reduced by TTX (Control 20.4 ± 0.5, TTX 17.7 ± 0.5). (D) Average MBP/NF200 ratios normalized against the NF200 signal are significantly reduced by TTX (Control 0.4 ± 0.02, TTX 0.29 ± 0.02). Scale bars in (A) and (B) 20 µm. * and *** Significance P < 0.05 and P < 0.001, respectively. Data expressed as means ± SEM.”
now reads:
“Sustained inhibition of neuronal activity reduces myelination of cerebellar white matter. (A,B) Maximum projection images from representative control (A) and TTX (B) treated cerebellar slices showing immunofluorescent signals for anti-NF200 (Ai, Bi) anti-MBP (Aii, Bii), and co-localisations used to quantify myelination (Aiii, Biiii). (C) Quantification of anti-NF200 signals. Mean NF200 pixel fraction is reduced by TTX (Control 20.4 ± 0.7, TTX 17.9 ± 0.7). (D) Average MBP/NF200 ratios normalized against the NF200 signal are significantly reduced by TTX (Control 0.4 ± 0.02, TTX 0.29 ± 0.02). Scale bars in (A) and (B) 20 µm. * and ** Significance P < 0.05 and P < 0.01, respectively. Data expressed as means ± SEM.”
In addition, the part label B has been corrected to ‘Bi’.
The original Figure 5 and its accompanying legend appear below.
Figure 5.
Sustained inhibition of neuronal activity reduces myelination of cerebellar white matter. (A,B) Maximum projection images from representative control (A) and TTX (B) treated cerebellar slices showing immunofluorescent signals for anti-NF200 (Ai,Bi) anti-MBP (Aii,Bii), and co-localisations used to quantify myelination (Aiii,Biii). (C) Quantification of anti-NF200 signals. Mean NF200 pixel fraction is reduced by TTX (Control 20.4 ± 0.5, TTX 17.7 ± 0.5. (D) Average MBP/NF200 ratios normalized against the NF200 signal are significantly reduced by TTX (Control 0.4 ± 0.02, TTX 0.29 ± 0.02). Scale bars in (A) and (B) 20 µm. * and *** Significance P < 0.05 and P < 0.001, respectively. Data expressed as means ± SEM.
The original Article has been corrected.


