

Abstract
Background
Emerging evidence suggests that higher circulating levels of inflammatory biomarkers in blood are associated with higher negative affect (NA) and lower positive affect (PA). To our knowledge, the unique associations between NA and PA in daily life and salivary biomarkers of inflammation have not been examined. This study examined these associations in young adults.
Methods
Measures of NA and PA were created from aggregated daily measures of affect (morning and evening ratings averaged across 14 days).We investigated associations between these measures and salivary C-reactive protein (CRP) and interleukin (IL)-6 in a sample of 108 young adults (60% female, mean age = 20.45 ± 1.47), a subset of whom had self-reported chronic back pain (n = 49). CRP and IL-6 were determined from saliva obtained at the end of the daily diary period.
Results
After covarying for age, gender, body mass index, chronic pain status, salivary flow rate, and NA, higher PA was associated with lower salivary CRP (β = − 0.02, 95% CI (− 0.03, − 0.00) sr2 = .06, p = .01) but not IL-6; removing NA from this model did not change results. In a model with the same covariates (and PA), NA was not significantly related to CRP or IL-6. Chronic back pain status and gender did not moderate results.
Conclusions
Findings suggest that higher PA may be associated with lower salivary CRP in young adults, even after accounting for NA and demographic characteristics. Findings highlight the utility of assessing emotional states in relation to salivary markers of inflammation in future biobehavioral research.
Keywords: Saliva, Inflammation, Positive affect, Negative affect, Chronic pain, Young adults
Introduction
A large body of empirical evidence suggests that positive and negative affect (PA and NA, respectively) are linked with a diverse array of health outcomes [6, 36, 69]. Inflammation may be one mechanism linking PA and NA with health. Inflammation can be quantified by measuring concentrations of biomarkers such as interleukin-6 (IL-6) and C-reactive protein (CRP) in peripheral fluids such as blood or saliva. IL-6 is a pro-inflammatory cytokine secreted by T cells and macrophages that stimulate immune responses during infection or injury. CRP is an acute-phase protein synthesized in the liver and is involved with activation of the complement system in response to infection [43]. Both PA and NA activate the autonomic nervous system (ANS), hypothalamic-pituitary-adrenal (HPA)-axis, and cardiovascular system, which in turn modulate inflammatory processes (for a review, see [34, 40]). Thus, there is a reason to believe that affect and inflammation may be causally associated. The value of understanding the association between affect and inflammation is highlighted by the potential to modify affect or emotion regulation to improve health.
Positive and Negative Affect and Blood-Based Markers of Inflammation
Although findings across studies are somewhat inconsistent, in studies using blood-based biomarkers, PA has been linked with lower levels of peripheral inflammation (e.g., [51, 61, 63]), and NA has been linked with higher levels of inflammatory biomarkers (e.g., [25, 42, 63]). However, results appear to differ based on whether affect is assessed using longer-term retrospective measures (i.e., affect recalled over weeks or months) or shorter-term retrospective measures aggregated from multiple daily or momentary-derived measures, as is reviewed below.
Higher PA measured using longer-term retrospective questionnaires has been associated with lower blood-based IL-6 and CRP across six studies of adults [2, 29, 38, 51, 60, 63], but not in four other studies [1, 22, 25, 63]. Similarly, higher longer-term retrospective NA has been associated with higher IL-6 in two studies [42, 63], but not in three others [1, 25, 60]. Two other studies showed no association between retrospective NA and CRP [38, 48]. These findings suggest associations between longer-term retrospective PA and NA with CRP and IL-6 derived from blood are inconsistent across studies.
Other studies have examined associations between levels of inflammatory markers and measures of affect aggregated from daily or momentary assessments. Daily or momentary-derived measures capture affective states in real life over multiple days and therefore may be both more reliable and ecologically valid than retrospective measures that require participants to recall affect over a longer stretch of time [58]. Higher daily PA (aggregated over four-time points across 1 day) has been associated with lower CRP and IL-6 in healthy midlife women but not in men [61]. In another study of adults, higher momentary NA (aggregated across 7 days) was associated with higher levels of a composite measure of inflammatory cytokines including IL-6, and momentary PA was associated with lower levels of the same cytokine composite measure but only among males [25]. In the Midlife in the US (MIDUS) study, neither daily PA nor NA (averaged across 8 days) were significantly associated with IL-6 or CRP [55]. Overall, assessments of affect aggregated over multiple daily or momentary assessments appear to be somewhat more consistently linked to markers of inflammation than longer-term retrospective measures of affect; however, it appears there may be important gender differences in this relationship.
Positive and Negative Affect and Salivary-Based Markers of Inflammation
There is a growing interest in the ability to quantify inflammatory biomarkers in media that are less invasive than blood [15, 27, 57]; a primary example is saliva. Compared to drawing blood, capturing saliva is less invasive, less expensive, and typically more easily accomplished across multiple time points. Both CRP and IL-6 can be derived from whole saliva, which consists of a mixture of fluids secreted from multiple sources (e.g., salivary glands, gingival fold, oral mucosal transudate, mucus from the nasal cavity; [12]). Salivary IL-6 is produced locally within the salivary glands, as well as from other sources, including blood. Salivary CRP is synthesized solely in the liver and enters saliva through intracellular diffusion.
Levels of salivary IL-6 and CRP are influenced by oral health status [57], but may also reflect systemic inflammation. Some studies have shown that at rest, salivary IL-6 demonstrates modest correlations with blood-based IL-6 (r = .29–59; [9, 17, 37, 44, 70]), whereas other studies have not shown such associations [8, 37]. CRP appears to have stronger associations between blood and saliva than IL-6 (r = .20 to 72; [14, 31, 49, 50]), although some studies have found null associations [35]. Salivary CRP and IL-6 are moderately stable in vivo across short periods of time (r = .55 to .96 across 2 days; [32]), although CRP appears to be more stable (r = .77 to .96) than IL-6 (r = .55 to .77; [32]). Both salivary CRP and IL-6 may have predictive utility for diseases such as acute myocardial infarction [14], cardiovascular disease [23], metabolic syndrome [3], and rheumatoid arthritis [54]. Together, this literature suggests that salivary CRP and IL-6 may reflect both oral and systemic inflammation, are moderately stable over short periods of time, and have the potential for understanding disease processes.
Despite the promise of salivary inflammatory markers in behavioral medicine, their association with PA and NA has not been well investigated, nor important potential moderators of these associations explored. To our knowledge, only two laboratory-based studies have examined phenomena similar to those examined in the present research. In one study of women, decreases in PA from pre- to post-laboratory stressor were associated with higher post-stressor salivary IL-1β levels [64]. In a study of women with past and current PTSD symptoms, recent NA was positively associated with salivary IL-6 [44]. However, no research to our knowledge has examined how mean levels of NA and PA captured from daily life relate to salivary inflammation. Research is needed to understand how the associations between affect and salivary levels of inflammation map onto results from studies using blood-based markers.
The Current Study
This study examined associations between recent PA and NA (assessed twice daily over the course of 14 days) and their associations with salivary markers of CRP and IL-6 in a sample of young adults. We hypothesized that higher average PA and lower average NA across 14 days would be associated with lower levels of both salivary CRP and IL-6. On a more exploratory basis, given the striking yet inconsistent gender differences reported in the extant literature relating affect and inflammation, we examined gender as a moderator of these associations. Due to the recruitment strategy of the larger project from which data for the present research were derived (and the strong links between pain, affect, and inflammation, e.g., [13, 24]), we also explored the presence of self-reported chronic pain as a moderator of these associations. An examination of associations between daily PA and NA with salivary inflammatory biomarkers may help determine mechanisms underlying affect and health connections, as well as illuminate the degree to which salivary biomarkers may be useful in such research.
Methods
Participants
University student participants were recruited through campus list services, posters, online research volunteer forums, and in-class announcements as part of a larger longitudinal investigation of daily stress, pain, inflammation, and health in young adults. All participants were required to be 18 or older, to have reported good oral health (e.g., no known gum disease or bleeding), to have not had a dental cleaning in the past week, and to not have recent acute pain due to an injury or dental surgery in the past month. As part of the larger study, two groups of participants were recruited: those who reported chronic back pain and those who reported no ongoing chronic pain. Chronic back pain was defined as back pain that persists continually for 3 months or more, or pain that comes and goes over 6 months or more, including chronic upper or lower back pain due to any cause. The initial sample consisted of 139 participants, 14 of whom (10%) were excluded because they failed to enroll in the daily portion of the study. Only those who completed both the baseline survey and at least six out of the 28 possible daily surveys (i.e., ≥ 25%compliance), as well as those who showed up for the second in-person visit were included in the current analyses. This resulted in an additional 17 people (12%) being excluded for poor compliance. Compliance with surveys in the resulting sample was 83%, as is described further in the “Results” section. Those who completed only the baseline survey or had poor compliance (n = 31 total) were not statistically different from the remaining study participants in terms of sample characteristics (i.e., gender, age, body mass index (BMI), CRP or IL-6 levels, salivary flow rate, average PA or NA, chronic pain). The final sample used for analyses consisted of 108 young adults (Mage 20.45 ± 1.47 years; 60% female; 7.4% Hispanic/Latinx; 72.2% White, 8.3% Black, 13.9% Asian, 5.6% other or not reported), 49 of whom (45%) had chronic back pain (see Table 1 for participant demographics of the entire sample and by chronic pain status, and for participants’ self-reported cause of their chronic back pain).
Table 1.
Descriptive characteristics of the entire sample and by chronic pain status
| Total sample (N = 108) M or n (SD or %) | Chronic pain (n = 49) M or n (SD or %) | No chronic pain (n = 59) M or n (SD or %) | X2 or t | Cohen’s d or OR | p value | ICC | |
|---|---|---|---|---|---|---|---|
|
| |||||||
| Age (years) | 20.45 (1.47) | 20.26 (1.50) | 20.61 (1.45) | 1.21 | 0.23 | 0.23 | n/a |
| BMI | 23.02 (4.41) | 23.04 (5.09) | 23.02 (3.80) | −0.02 | 0.004 | 0.98 | n/a |
| BMI status (% with BMI ≥ 25) | 23 (21.3%) | 8 (16.3%) | 15 (25.4%) | 0.83 | 0.91 | 0.36 | n/a |
| Gender (% female) | 65 (60%) | 35 (71%) | 30 (51%) | 59.13 | 2.04 | < 0.0001 | n/a |
| How much bodily pain have you had during the past 4 weeks? (1, none; 6, very severe) | 2.46 (1.26) | 3.48 (0.76) | 1.55 (0.87) | − 11.40 | 2.35 | < 0.0001 | n/a |
| During the past 4 weeks, how much did pain interfere with your normal work? (1, not at all; 5, extremely) | 1.63 (0.82) | 2.12 (0.83) | 1.22 (0.53) | − 6.57 | 1.32 | < 0.0001 | n/a |
| Salivary CRP (pg/mL) | 17,918.48 (42,821.33) | 12,056.35 (36,921.95) | 22,649.32 (46,834.08) | 1.29 | 0.25 | 0.20 | 0.95 |
| Salivary IL-6 (pg/mL) | 8.79 (28.37) | 5.07 (16.75) | 11.82 (34.97) | 1.31 | 0.24 | 0.19 | 0.46 |
| Salivary flow rate (grams/min) | 0.58 (0.32) | 0.55 (0.31) | 0.60 (0.33) | 0.94 | 0.18 | 0.35 | 0.80 |
| PA | 26.42 (7.89) | 25.17 (6.82) | 27.46 (8.59) | 1.54 | 0.29 | 0.13 | 0.59 |
| NA | 13.41 (3.39) | 13.23 (3.72) | 13.65 (2.97) | − 0.66 | 0.12 | 0.51 | 0.46 |
BMI, body mass index; PA, positive affect aggregated over the 14 days; NA, negative affect aggregated over the 14 days. Gender (0, male; 1, female). BMI status (0, underweight; 1, overweight). CRP, C-reactive protein; IL-6, interleukin 6 (with half the lower limit of detection (0.035) imputed for values below detectable limits); ICC, intraclass correlation coefficient (ratio of between-person variance to total variance for repeated measures constructs). Of the 49 participants reporting chronic back pain, 19 did not report the cause of their back pain or reported non-specific back pain; 11 reported that their back pain was due to an injury or accident; 5 due to a fracture, herniated disk, sciatica, or joint pain; 5 due to another medical condition (adenomyosis, migraines, spondylolisthesis, tendonitis, Tailor’s bunion); 5 due to scoliosis; 3 due to muscle tension; and 1 due to breast and back pain
Procedure
Participants first completed an online baseline survey to assess demographic characteristics, chronic pain, and health behaviors. Participants then completed an in-person training session (i.e., day 0) between 1 and 5 pm for instruction on how to complete the daily diary portion of the study. At this time (hereafter referred to as time 1), they provided a saliva sample collected via passive drool. Informed consent was obtained from all individuals at the training session. On the day after the training session (i.e., day 1), participants began the 14-day daily diary protocol (i.e., days 1–14), which included completion of waking and bedtime surveys administered via Qualtrics software (Qualtrics, Provo, UT, USA). For all participants, the waking survey became available at 5 am, and the bedtime survey became available at 6 pm; both surveys included questions on recent PA and NA. Participants were instructed to self-initiate the waking survey within 30 min after awakening and the bedtime survey within 30 min of when they planned to go to sleep. The waking survey closed at noon, and the bedtime survey closed at 3 am the next day. The day after the 14-day period (day 15 for most individuals; hereafter referred to as time 2), participants came into the lab again between 1 and 5 pm, and a second saliva sample was collected in the same manner as the time 1 visit (see Fig. 1 for a schematic of the study protocol).
Fig. 1.
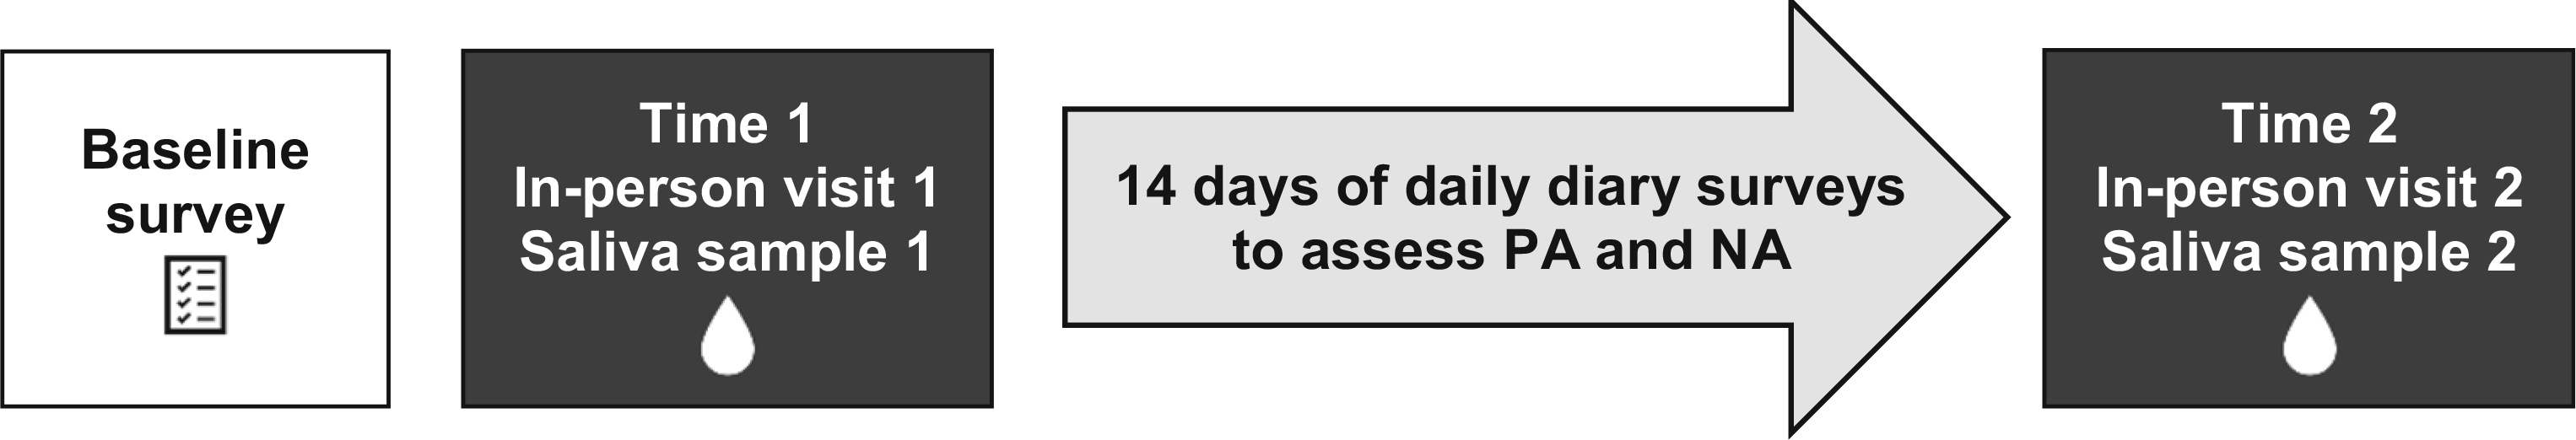
Study protocol schematic. PA, positive affect; NA, negative affect. The first in-person visit and saliva sample (time 1) occurred on day 0, followed by 14 days of daily diary surveys (days 1–14), followed by a second in-person visit and saliva sample on day 15 (time 2). All in-person visits occurred between 1 and 5 pm
Measures
Daily Positive and Negative Affect
Morning and evening PA and NA were assessed daily at waking and bedtime using 10-item composite measures derived from the Positive and Negative Affect Schedule (PANAS; [68]). Participants were asked to rate how much they felt certain emotions over the past 2 h (or since waking in the waking survey) on a scale of 1 (very slightly or not at all) to 5 (extremely). The 10 NA items were scared, afraid, upset, distressed, jittery, nervous, ashamed, guilty, irritable, and hostile; the 10 PA items were enthusiastic, interested, determined, excited, inspired, alert, active, strong, proud, and attentive. The 10 items in each domain were summed to create a NA and a PA scale; no items were missing at the NA or PA scale level within people within days. Total scores on each scale ranged from 10 to 50, with higher scores indicating greater levels of recent morning or evening NA and PA. Individuals’ 14-day aggregate scores for NA and PA were calculated.
Salivary CRP and IL-6
Saliva samples were collected via passive drool methods. All participants were instructed to avoid eating or drinking 1 h prior to saliva sample collection and rinsed their mouth with water 10 min prior to collection. Participants were then instructed to let saliva pool in their mouth for exactly 5 min and drool into the 50-mL collection tube. Participants who were unable to generate a sufficient amount of saliva (≥ 5 mL) were allowed an additional 2 min to collect saliva. One participant was unable to provide a sufficient amount of saliva after 7 min of collection time, so they were given an additional 3 min (i.e., 10 min in total). The salivary flow rate was calculated by taking the weight of sample obtained (in grams, after the weight of the tube was subtracted) and dividing by the collection time (in minutes), to obtain a rate of grams per minute. All saliva samples were immediately refrigerated at − 20 °C and then centrifuged for 15 min at 3000 rpm, aliquoted into cryovials, and stored at − 80 °C within 1.5 h of sample collection. Samples were assayed for CRP and IL-6 using enzyme-linked immunosorbent assay kits specifically designed for assaying saliva (Salimetrics LLC, State College, PA, USA). All samples were run in duplicate according to kit instructions. The IL-6 kit lower limit of detection was 0.07 pg/mL, and the CRP kit lower limit of detection was 10 pg/mL. For CRP, the intra-assay coefficients of variations (CV) were between 2 and 3%; the inter-assay CV was 3.4%. For IL-6, the intra-assay CVs were between 4 and 6%; the inter-assay CV was 3.5%.
Baseline Covariates
Age, gender (male, 0; female, 1), BMI, and chronic pain (0, no chronic pain; 1, chronic pain) were assessed at baseline and included as covariates in all analyses, as they have been shown to relate to differences in affect and inflammation [11, 18]. As per recommendations from previous research [27], the salivary flow rate was included as a covariate in all analyses. Although smoking and antidepressant usage are commonly recommended covariates in models to predict inflammation [47], we did not control for these variables given the low frequencies in our sample (4.6% and 7.4%, respectively) and because adding these as covariates did not change results. None of our sample was taking tumor necrosis factor inhibitors (e.g., Humira, Enbrel), but 38 people (35.2%) were taking some sort of pain medication. Pain medication usage was marginally associated with lower CRP and IL-6, but covarying for it did not change the general pattern of results. Therefore, reported results do not include pain medication usage as a covariate.
Analytic Strategy
Multiple regression analyses were run in R, an open source statistical program [53] using R base packages and the package apaTables [59]. All analyses were bootstrapped using 1000 samples. Semi-partial correlation coefficient squared (sr2) was used as a measure of effect size, where sr2 = .02 was considered a small effect, sr2 = .13 was considered a medium effect, and sr2 = .26 was considered a large effect [5]. A post hoc power analysis conducted in G*Power [16] revealed that for linear regression with 9 variables, a sample size of 108 (α = .05) yielded 78% power to detect a medium effect size.
Given high correlations between time 1 and time 2 salivary CRP and IL-6 values (CRP r = 0.95, p < .00001; IL-6 r = 0.46, p < .00001), and so that recent affect could be used to prospectively predict inflammatory markers, only the second time point (i.e., the sample obtained after the 14-day daily diary period) was used for the current analyses. However, the general pattern of results held when using only time 1 data (Supplementary Tables 1–2) or aggregated time 1 and time 2 data (Supplementary Tables 3–4). Forty-two of the 108 samples assayed for IL-6 at time 2 (39%) had IL-6 levels below detectable limits; in alignment with previous research [45, 64], values of half the lower limit of detection (i.e., 0.035 pg/mL) were imputed for these individuals, given that non-detectability was expected and data were missing not at random (i.e., indicative of very small IL-6 values). All CRP samples were within detectable ranges. Given the expected non-normal distribution of CRP (skewness = 3.66, kurtosis = 15.85) and IL-6 (skewness = 5.48, kurtosis = 34.09), and in alignment with previous research [45, 55, 56], all values were log-10 transformed for analysis, which resolved skewness and kurtosis for both CRP (skewness = 1.11, kurtosis = 3.95) and IL-6 (skewness = 0.18, kurtosis = 1.65).
Results
Descriptive Results
Participants completed an average of 23.12 (SD = 4.08) out of a total 28 daily surveys, for an average compliance rate of 83%. Nearly 76% of the sample (n = 82) completed at least 21 out of the 28 daily surveys (i.e., at least 75% compliance), and only 4% of the sample (n = 4) completed fewer than 12 daily surveys (but at least 6 surveys, given the inclusion criteria). There were no differences in daily diary compliance by chronic back pain status (M = 23.88 surveys completed for chronic back pain group compared to M = 22.49 survey completed for no chronic back pain group, respectively, t = − 1.51, p = 0.13). Daily diary compliance (i.e., percentage of surveys completed) was also not associated with any of the other variables.
The chronic pain sample reported relatively low levels of pain interference (M = 1.07, SD = 0.84, on a scale of 0, none; 6, extreme) and moderate levels of pain control (M = 17.87, SD = 6.61, on a scale of 0, no control; 40, total control). In response to the question: “How strong is your pain right now?” 16 (32.7%) said “mild,” 28 (57.1%) said “discomforting,” and 5 (10.2%) said “distressing.” The chronic back pain group was more likely to be female and have higher levels of pain severity and pain interference than the group without chronic pain, but was not different in terms of any other characteristics (Table 1). Dummy coded chronic pain status (0, no chronic pain; 1, chronic pain) was associated with lower IL-6 and lower CRP (Table 2). Log-10 IL-6 and log-10 CRP were weakly but significantly correlated (r = .26, p < .01).
Table 2.
Bivariate correlations
| Variable | 1 | 2 | 3 | 4 | 5 | 6 | 7 | 8 |
|---|---|---|---|---|---|---|---|---|
|
| ||||||||
| 1. Chronic pain | ||||||||
| 2. Age | − .12 (− .30, .07) | |||||||
| 3. Gender | .21* (.02, .39) | .15 (− .35, .05) | ||||||
| 4. BMI | − .05 (− .24, .15) | .18 (.01, .35) | − .31** (− .48, − .13) | |||||
| 5. PA | − .12 (− .31, .06) | − .04 (− .23, .15) | − .25** (− .43, − .06) | .12 (− .07, .32) | ||||
| 6. NA | .14 (− .06, .31) | − .07 (− .25, .12) | .18 (− .02, .37) | − .12 (− .30, .10) | − .19* − .37, − .01 | |||
| 7. Salivary flow rate | − .10 (− .28, .08) | .18 (− .01, .36) | − .23* (− .42, − .04) | .23* (.04, .40) | .17 (− .02, .35) | .02 (− .17, .21) | ||
| 8. Log-10 CRP (pg/mL) | − .24* (− .41, − .05) | − .09 (− .28, .10) | − .05 (− .27, .17) | .02 (− .17, .22) | − .16 (− .35, .03) | − .10 (− .29, .09) | − .06 (− .25, .14) | |
| 9. Log-10 IL-6 (pg/mL) | − .21* (− .38, − .03) | .07 (− .12, .26) | − .12 (− .33, .07) | .04 (− .15, .23) | − .04 (− .23, .15) | − .07 (− .25, .12) | − .08 (− .27, .11) | .26** (.07, .44) |
p < .05
p < .01
N = 108; M, mean; SD, standard deviation. Values in square brackets indicate the 95% confidence interval (CI) for each correlation. Chronic pain (0, no chronic pain; 1, chronic pain). Gender (0, male; 1, female). BMI, body mass index; PA, positive affect aggregated over the 14 days; NA, negative affect aggregated over the 14 days. Log-10 CRP, log-10 transformed C-reactive protein at time 2. Log-10 IL-6, log-10 transformed interleukin 6 at time 2 (with half the lower limit of detection imputed for samples below detectable limits). For BMI, gender, and chronic pain, all correlations represent Spearman’s correlations. For all other variables, correlations represent Pearson’s correlations
Main Effects of PA and NA on Salivary CRP and IL-6
Controlling for gender, chronic pain, salivary flow rate, BMI, and NA, higher PA was associated with lower salivary CRP (pg/mL, β = − 0.02, 95% CI (− 0.03, − 0.00), sr2 = .06, p = .01; Table 3 and Fig. 2), but not with salivary IL-6 (pg/mL, β = − 0.03, 95% CI (− 0.13, 0.07); sr2 = .00, p = .37; Table 4). Controlling for gender, chronic pain, salivary flow rate, BMI, and PA, NA was not associated with either salivary CRP (Table 3) or IL-6 (Table 4). Results remained unchanged when PA and NA were examined separately.
Table 3.
Main effects of positive and negative affect on log-10 salivary CRP (pg/mL) and moderation by gender and chronic pain
| Model | Predictor | b |
b 95% CI (LL, UL) |
sr 2 |
sr2 95% CI (LL, UL) |
r | Fit |
|---|---|---|---|---|---|---|---|
|
| |||||||
| Main effects of PA and NA | (Intercept) | 5.97** | (4.08, 8.39) | ||||
| PA | − 0.02* | (− 0.03, − 0.00) | .06 | (.00, .17) | − .16 | ||
| NA | − 0.02 | (− 0.06, 0.01) | .02 | (.00, .08) | −.10 | ||
| Gender | − 0.10 | (− 0.34, 0.16) | .01 | (.00, .07) | − .06 | ||
| Chronic pain | − 0.33** | (− 0.55, − 0.11) | .08 | (.01, .19) | − .26** | ||
| BMI | 0.01 | (− 0.03, 0.03) | .00 | (.00, .06) | − .02 | ||
| Age | − 0.06 | (− 0.17, 0.02) | .02 | (.00, .13) | − .09 | R2 = .152* | |
| Salivary flow rate | − 0.04 | (− 0.45, 0.32) | .00 | (.00, .05) | − .06 | 95% CI (.11, .35) | |
| PA and NA × chronic pain interaction | (Intercept) | 5.77** | (3.94, 8.32) | ||||
| PA | − 0.02 | (− 0.04, 0.01) | .03 | (.00, .12) | − .16 | ||
| NA | − 0.02 | (− 0.07, 0.01) | .01 | (.00, .06) | − .10 | ||
| Gender | − 0.10 | (− 0.39, 0.18) | .01 | (.00, .07) | − .06 | ||
| Chronic pain | 0.15 | (− 1.33, 1.46) | .00 | (.00, .05) | − .26** | ||
| BMI | 0.01 | (− 0.03, 0.03) | .00 | (.00, .06) | −.02 | ||
| Age | − 0.06 | (− 0.18, 0.02) | .02 | (.00, .14) | − .09 | ||
| Salivary flow rate | − 0.05 | (− 0.42, 0.32) | .00 | (.00, .05) | − .06 | ||
| PA × chronic pain | − 0.01 | (− 0.04, 0.02) | .00 | (.00, .06) | −.30** | R2 = .157 | |
| NA × chronic pain | − 0.02 | (− 0.07, 0.06) | .00 | (.00, .04) | − .27** | 95% CI (.00, .37) | |
| PA and NA × gender interaction | (Intercept) | 5.47** | (3.07, 8.75) | ||||
| PA | − 0.01 | (− 0.04, 0.02) | .01 | (.00, .08) | − .16 | ||
| NA | − 0.02 | (− 0.11, 0.04) | .01 | (.00, .08) | − .10 | ||
| Gender | 0.45 | (− 1.28, 2.26) | .00 | (.00, .07) | − .06 | ||
| Chronic pain | − 0.30* | (− 0.52, − 0.07) | .06 | (.00, .15) | − .26** | ||
| BMI | 0.01 | (− 0.02, 0.04) | .00 | (.00, .06) | − .02 | ||
| Age | − 0.06 | (− 0.18, 0.03) | .02 | (.00, .13) | − .09 | ||
| Salivary flow rate | − 0.04 | (− 0.46, 0.39) | .00 | (.00, .05) | − .06 | ||
| PA × gender | − 0.02 | (− 0.05, 0.01) | .02 | (.00, .10) | − .17 | R2 = .170* | |
| NA × gender | 0.00 | (− 0.07, 0.09) | .00 | (.00, .05) | − .08 | 95% CI (.13, .39) | |
p < .05
p < .01.
N = 102. A significant b weight indicates the beta-weight and semi-partial correlation is also significant. b represents unstandardized regression weights. Beta indicates the standardized regression weights. sr2 represents the semi-partial correlation squared. r represents the zero-order correlation. LL and UL indicate the lower and upper limits of a confidence interval, respectively. All models were bootstrapped using 1000 samples. PA, positive affect aggregated over 14 days. NA, negative affect aggregated over 14 days. BMI, body mass index
Fig. 2.
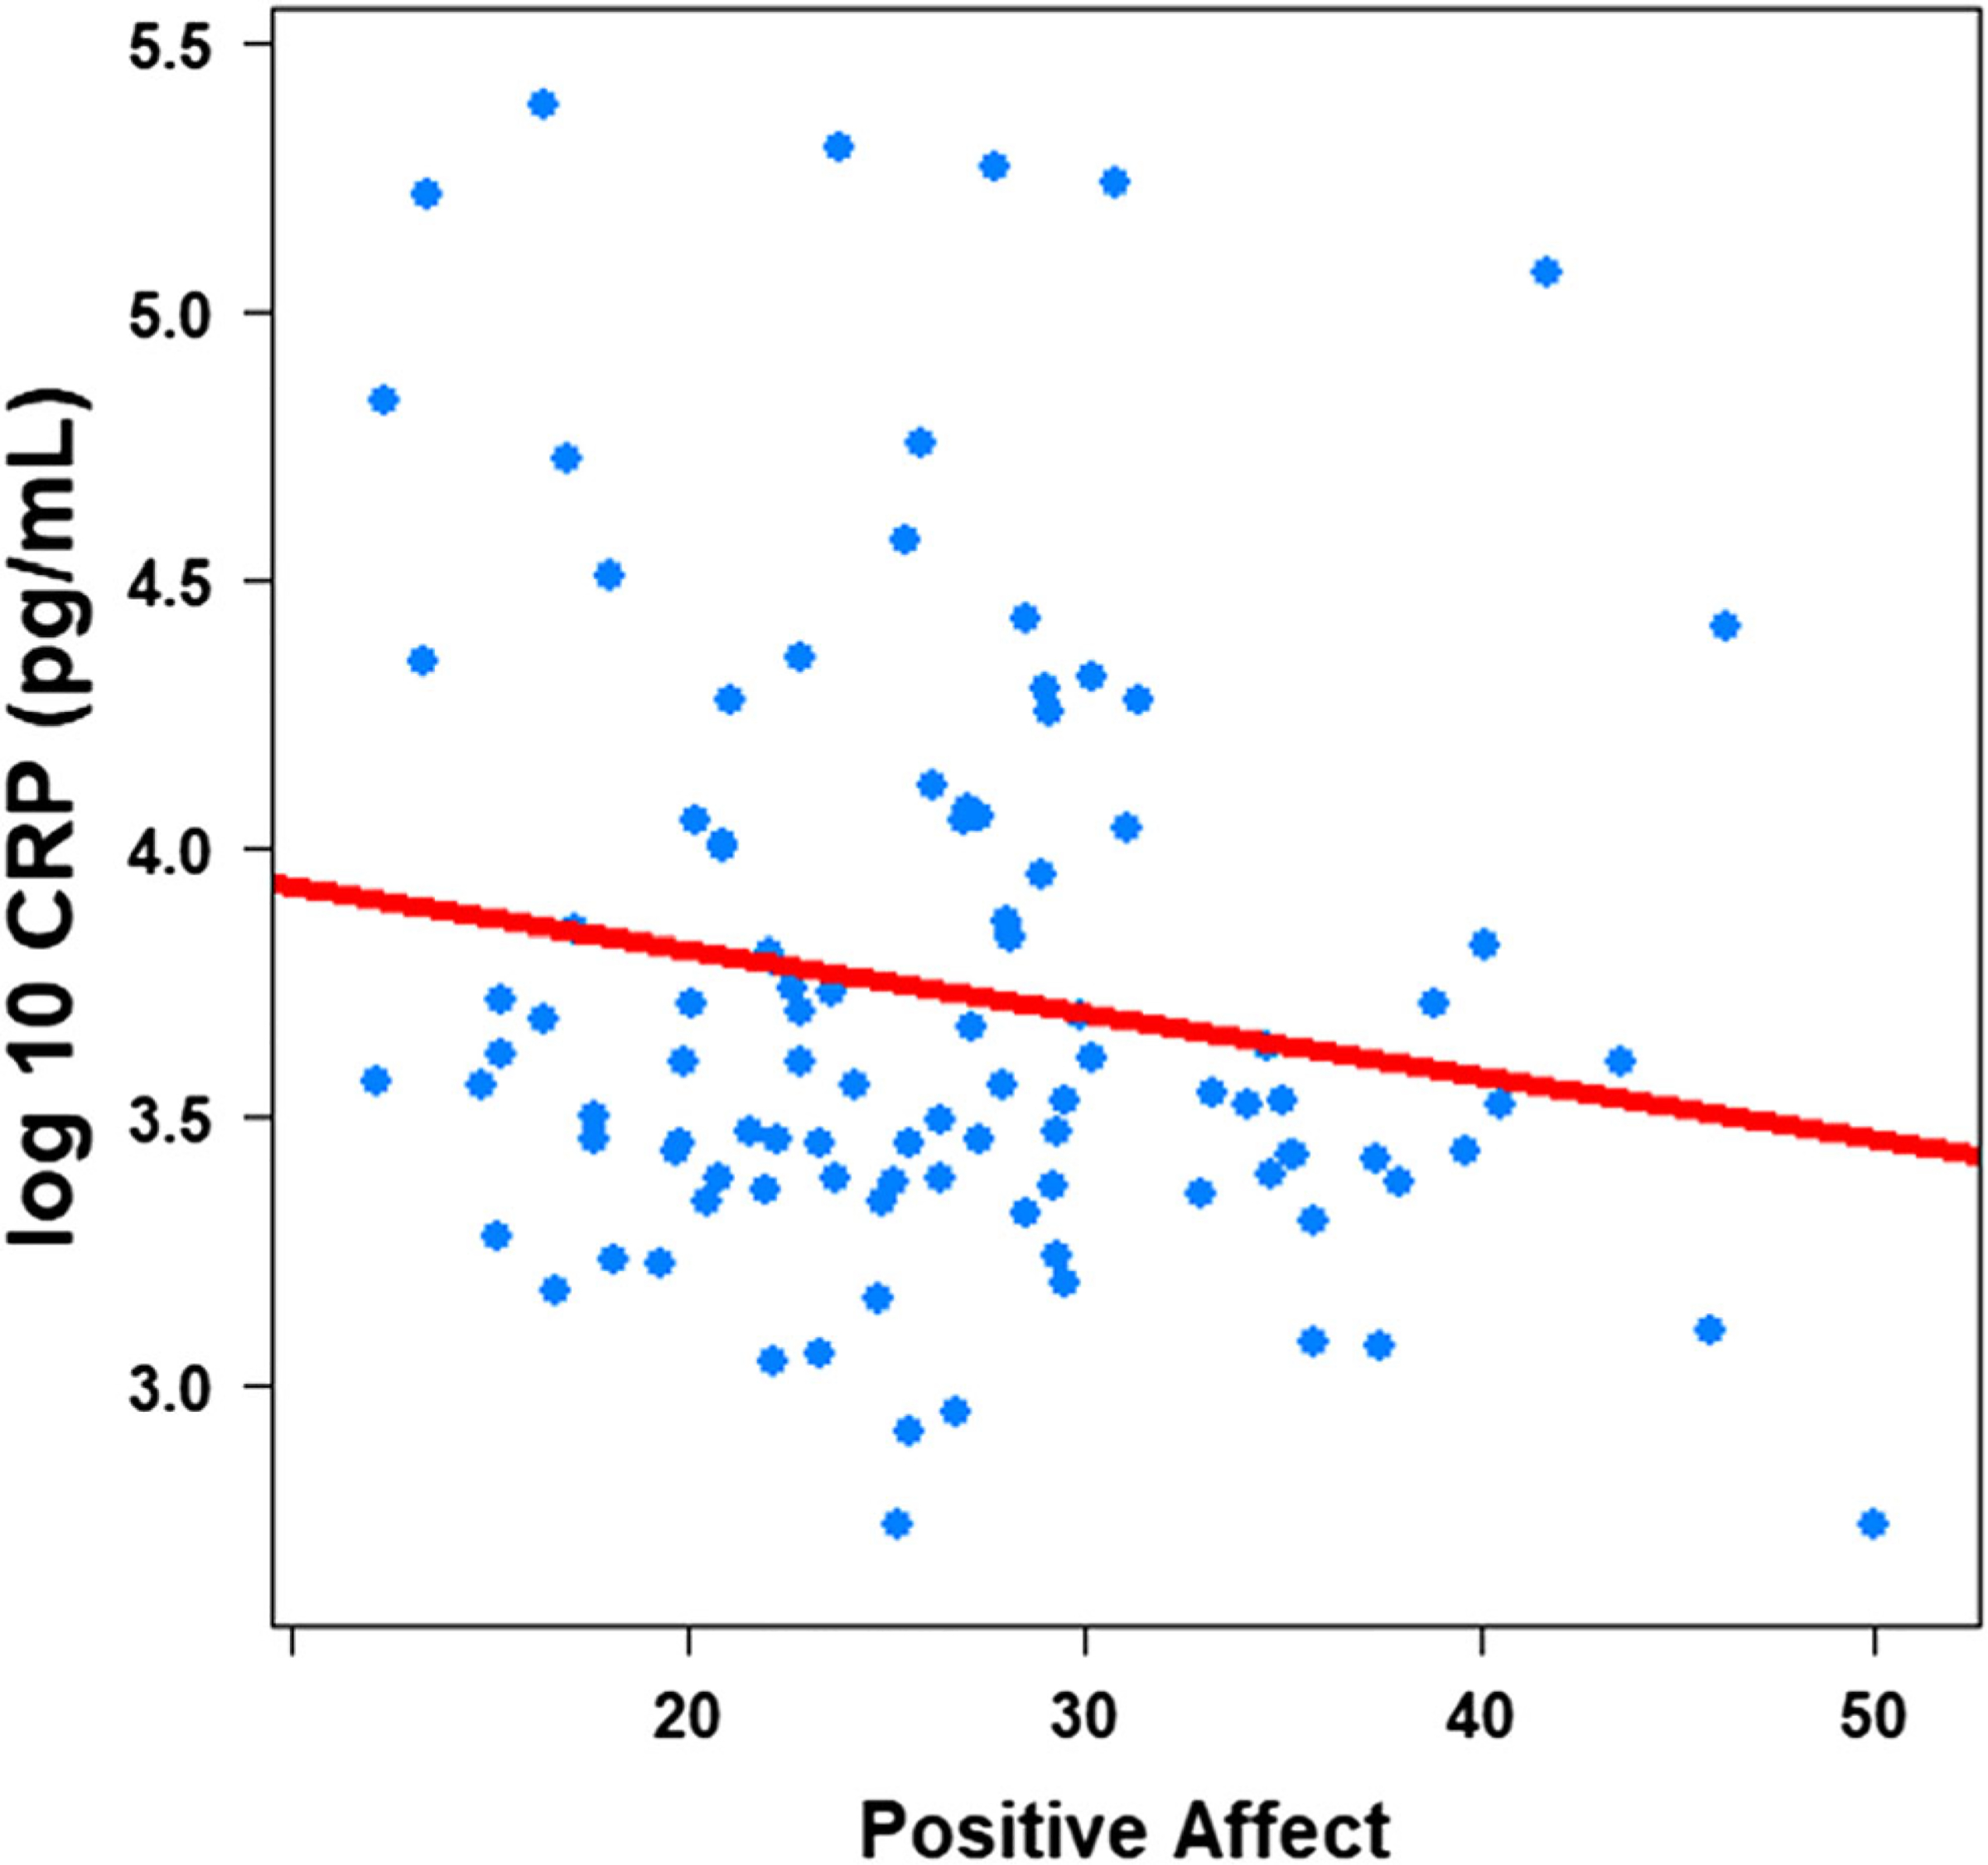
Positive affect and log-10 salivary C-Reactive Protein
Table 4.
Main effects of positive and negative affect on log-10 salivary IL-6 (pg/mL) and moderation by gender and chronic pain
| Model | Predictor | b |
b 95% CI (LL, UL) |
sr 2 |
sr2 95% CI (LL, UL) |
r | Fit |
|---|---|---|---|---|---|---|---|
|
| |||||||
| Main effects of PA and NA | (Intercept) | 0.12 | (− 3.36, 4.05) | ||||
| PA | − 0.01 | (− 0.04, 0.02) | .01 | (.00, .06) | − .04 | ||
| NA | − 0.02 | (− 0.11, 0.05) | .00 | (.00, .07) | − .07 | ||
| Gender | − 0.25 | (− 0.76, 0.28) | .01 | (.00, .08) | − .12 | ||
| Chronic pain | − 0.47* | (− 0.96, 0.01) | .04 | (.00, .14) | − .21* | ||
| BMI | 0.01 | (− 0.05, 0.06) | .00 | (.00, .05) | .05 | ||
| Age | 0.03 | (− 0.13, 0.18) | .00 | (.00, .05) | .08 | R2 = .078 | |
| Salivary flow rate | − 0.44 | (− 1.12, 0.31) | .01 | (.00, .08) | − .08 | 95% CI (.00, .27) | |
| PA and NA × chronic pain interaction | (Intercept) | 0.13 | (− 3.49, 4.80) | ||||
| PA | − 0.01 | (− 0.05, 0.03) | .00 | (.00, .05) | − .04 | ||
| NA | − 0.02 | (− 0.16, 0.07) | .00 | (.00, .07) | − .07 | ||
| Gender | − 0.24 | (− 0.77, 0.25) | .01 | (.00, .08) | − .12 | ||
| Chronic pain | − 0.59 | (− 3.78, 2.25) | .00 | (.00, .06) | − .21* | ||
| BMI | 0.01 | (− 0.05, 0.07) | .00 | (.00, .05) | .05 | ||
| Age | 0.03 | (− 0.16, 0.18) | .00 | (.00, .04) | .08 | ||
| Salivary flow rate | − 0.44 | (− 1.19, 0.32) | .01 | (.00, .09) | − .08 | ||
| PA × chronic pain | − 0.00 | (− 0.07, 0.06) | .00 | (.00, .05) | − .21* | R2 = .078 | |
| NA × chronic pain | 0.01 | (− 0.14, 0.20) | .00 | (.00, .05) | − .21* | 95% CI (.00, .29) | |
| PA and NA × gender interaction | (Intercept) | 0.12 | (− 4.98, 4.70) | ||||
| PA | − 0.00 | (− 0.04, 0.05) | .00 | (.00, .05) | − .04 | ||
| NA | − 0.04 | (− 0.14, 0.11) | .00 | (.00, .05) | −.07 | ||
| Gender | − 0.08 | (− 2.71, 3.58) | .00 | (.00, .05) | − .12 | ||
| Chronic pain | − 0.42 | (−0.87, 0.05) | .03 | (.00, .12) | − .21* | ||
| BMI | 0.02 | (− 0.04, 0.06) | .00 | (.00, .05) | .05 | ||
| Age | 0.02 | (− 0.16, 0.18) | .00 | (.00, .05) | .08 | ||
| Salivary flow rate | − 0.45 | (− 1.20, 0.36) | .01 | (.00, .08) | − .08 | ||
| PA × gender | − 0.03 | (− 0.10, 0.03) | .01 | (.00, .07) | − .17 | R2 = .092 | |
| NA × gender | 0.04 | (− 0.16, 0.16) | .00 | (.00, .05) | − .10 | 95% CI (.00, .30) | |
p < .05
p < .01
N = 106. A significant b weight indicates the beta-weight and semi-partial correlation is also significant. b represents unstandardized regression weights. Beta indicates the standardized regression weights. sr2 represents the semi-partial correlation squared. r represents the zero-order correlation. LL and UL indicate the lower and upper limits of a confidence interval, respectively. All models were bootstrapped using 1000 samples. PA, positive affect aggregated over 14 days. NA, negative affect aggregated over 14 days. BMI, body mass index. For IL-6 values below detectable limits, half the lower limit of detection (0.035) values was imputed
Interaction Between Chronic Pain and Affect on Salivary CRP and IL-6
Controlling for the same covariates as above, chronic pain did not moderate the associations between either PA or NA on CRP (Table 3) or IL-6 (Table 4). Results remained unchanged when PA and NA were examined separately.
Interaction Between Gender and Affect on Salivary CRP and IL-6
Controlling for the same covariates as above, gender did not moderate the associations between either PA or NA on CRP (Table 3) or IL-6 (Table 4). Results remained unchanged when PA and NA were examined separately.
Discussion
Despite robust evidence linking global reports of affect to health indicators, less is known about the role of daily PA and NA on salivary markers of inflammation. This study examined associations between aggregated daily PA and NA with salivary CRP and IL-6 in young adults. Partially consistent with our predictions, our results showed higher PA was uniquely associated with lower salivary CRP in the overall sample, although this effect size was small. Contrary to our expectations, NA was not associated with salivary CRP, and neither PA nor NA were associated with salivary IL-6. Neither gender nor chronic pain status moderated these associations. Overall, the results of the present research highlight the potential value of assessing positive affective states in relation to inflammatory markers in everyday life.
Novelty of the Present Design
The present study utilized novel methods of assessing both affect and inflammatory markers that advance research in this domain. First, we used an ecologically valid measure of affect by aggregating twice-daily measures of PA and NA (i.e., over 28 measurement occasions across a total of 14 days). Most previous studies on affect and inflammation have relied on global long-term retrospective measures of affect, which are more prone to recall bias and use of availability heuristics. We also evaluated the unique contributions of PA and NA, including controlling for potentially confounding variables (age, gender, BMI, salivary flow rate). In doing so, we demonstrated that lower recent daily PA is uniquely associated with higher salivary CRP. These findings are broadly consistent with other studies using retrospective measures of PA that have shown PA may be associated with beneficial health outcomes independently of the effects of NA [4, 61].
This work was also innovative in the use of salivary inflammation markers; no previous studies to our knowledge have examined associations between daily PA and salivary CRP, although one study showed that higher recent PA (i.e., ratings of PA since awakening that morning) was associated with lower IL-6 derived from nasal wash fluid [33]. Overall, our findings in saliva are in concordance with a few studies that have found significant associations between higher PA and lower CRP derived from blood [2, 29, 38].
Broadly speaking, there is still poor understanding of how associations between affect and salivary markers of inflammation may differ from associations with blood-based markers, as no study to our knowledge has reported associations between affect and markers of inflammation derived from both saliva and blood in the same sample. Salivary markers of inflammation may be particularly indicative of oral health, but also still may have predictive utility for some broader health outcomes (e.g., cardiovascular disease, metabolic syndrome, rheumatoid arthritis; [3, 50, 54]). This is likely particularly true for salivary CRP, as CRP is produced in the liver (i.e., there is no local production in the mouth). Hence, the correspondence of salivary- and blood-derived CRP may be higher than for salivary IL-6; several studies have confirmed this [17, 49].
To gain a clearer sense of relationships between affect and inflammation, future studies should control for level of oral hygiene and dental health (ideally determined by a clinician) and chronic medical conditions, in addition to salivary flow rate, as all of these factors may confound assessments (for reviews on best practices when collecting salivary biomarkers, see [15, 27, 57]). Further, when measuring inflammatory biomarkers in oral fluid, the type of oral fluid collected (e.g., oral mucosal transudate, whole saliva) and how it is collected (e.g., passive drool, Salivette) can influence results [46, 57]. Although previous studies have shown that passive drool of whole saliva may lead to less interference than other methods (for a review, see [26]), it is still unclear if whole saliva collected by passive drool is the optimal oral fluid sample when measuring inflammatory biomarkers.
Null Findings with NA
In the current study, we found that PA but not NA was associated with salivary CRP. This was not surprising given that no studies to our knowledge (including with blood-based markers) have shown significant associations between NA and CRP, although some have shown significant findings with related constructs (e.g., depression, trait hostility) and CRP [19, 24, 29], and with NA and IL-6 [42, 63]. In line with our findings, other studies examining both NA and PA have shown that PA may have a unique influence on inflammation and health, above the influence of NA [21, 25, 56, 61]. The null findings with NA (relative to PA) in the present research may relate to lower between-person variability in mean NA compared to PA (PA ICC = 0.59, NA ICC = 0.46).
Null Findings with IL-6
Neither PA nor NA were associated with salivary IL-6 in the current study. It is possible that the measure of aggregated affect over 2 weeks we created may be more strongly related to CRP, which is relatively more stable in saliva than IL-6 across short and long periods of time [32, 50]. As noted earlier, salivary CRP may also be more indicative of systemic inflammation than salivary IL-6; furthermore, the latter may be more confounded by oral health. The null findings with IL-6 may be driven by the numerous low and non-detectable values of IL-6, which likely resulted in a restriction of range in possible IL-6 values. As with many salivary markers of inflammation, it can be difficult to obtain detectable levels in relatively healthy samples. Values below detectable limits are data missing not at random (MNAR), which poses a unique challenge for data analysis. Multiple imputation techniques are not recommended for MNAR [62]. Therefore, we chose to impute data below half the lower limit of detection and to log-10 transform IL-6 data, which is a common strategy when examining salivary markers of inflammation [45, 64] and capitalizes on using all available information. Notably, however, when we treated these data as “missing” and ran analyses (or used multiple imputations), the pattern of results was similar.
It is also possible the specific assay kits we used may have been responsible for the high frequency of non-detectable IL-6 values. We chose the Salimetrics IL-6 kits because they have been validated specifically for saliva, but other brands of assay kits and measurement platforms may be more sensitive to detecting low levels of salivary IL-6. Finally, an additional explanation for the null results with IL-6 may be that saliva collection occurred in the afternoon between 1 and 5 pm, when IL-6 levels are relatively low. IL-6 tends to peak around 5 am and 7 pm with nadirs at 8 am and 9 pm [66], whereas CRP does not have a strong diurnal rhythm in healthy adults [41]. It is therefore possible that PA and IL-6 covary differently across the day, something which could not be determined from the present research. Future studies with multiple assessments of affect and inflammation per day should examine how these associations may shift over the course of the day.
Exploratory Moderation by Gender and Chronic Pain Status
On an exploratory basis, we examined gender and chronic pain status as moderators of the association between affect and salivary inflammation. We found no evidence of gender or chronic pain differences in any of these associations. The lack of moderation by gender in the current research is in contrast with previous studies showing gender differences in associations between affect and blood-based markers of inflammation [25, 28, 39]. For men, higher emotional expression and depressive symptoms (a construct conceptually distinct from but related to high aggregated NA) have each been associated with higher blood-based IL-6 and CRP [28, 39], and higher aggregated daily PA has been associated with lower levels of a cytokine composite measure among men but not women [25]. Despite the null gender moderation results in the current study, it still may be important to examine gender in future research on salivary inflammation.
Surprisingly, chronic pain also did not moderate our results, and chronic pain was associated with lower IL-6 and CRP. This is in contrast to previous research indicating chronic pain is typically associated with higher levels of systemic inflammation [13, 67]. These counterintuitive findings may be attributed to the fact that our chronic pain subsample was experiencing moderately low levels of pain severity and interference and likely was relatively healthy.
Potential Biobehavioral Mechanisms Linking Positive Affect and Inflammation
There are several biobehavioral mechanisms that may explain the associations we observed between PA and salivary CRP. First, higher PA may be directly associated with increases in endogenous opioids and alterations in ANS and HPA-axis activity. PA may indirectly alter ANS and HPA-axis activity by reducing blood pressure and heart rate which, in turn, can modulate systemic inflammation [7]. Secondly, PA may improve health by enhancing social ties [52], and cultivating PA may broaden modes of thinking, counteract NA, and build personal resources for coping with stressors [20]. A recent meta-analysis showed that increased social support and better social integration are associated with lower levels of circulating IL-6 and CRP [65]. Finally, PA may lead to engagement in more healthful behaviors [52], such as longer sleep duration and better quality sleep, or engaging in more physical activity [30, 71]. These and other potential mediators between affect and health could be examined in future research using salivary markers of inflammation.
Limitations and Future Directions
Although the current study has many unique strengths, there are some methodological issues that warrant discussion. First, it is possible that the relationship between inflammation and PA may be cyclical or bidirectional. Inflammation itself can induce increases in fatigue, pain, depressive symptoms, and sickness-like behavior [10], which in turn may reduce PA levels. Experimental and longer-term longitudinal studies are needed to better understand the directionality of these relationships. Future studies using repeated daily measures of both affect and inflammation could examine lagged associations between these variables. Saliva is an ideal medium in which to examine these types of associations in naturalistic settings, as it is non-invasive and relatively easy to collect across multiple time points.
An additional limitation of the current study is the use of a self-report measure of chronic pain, which may not map onto chronic pain pathophysiology or clinical diagnosis. In general, our descriptive results suggest the chronic group was experiencing moderately low levels of pain severity and pain interference, which limited our ability to test chronic pain status as a moderator of the connection between affect and salivary inflammatory markers. This may explain why those with chronic pain had somewhat lower levels of salivary inflammation compared to the group without chronic pain. Future studies examining the impact of chronic pain on inflammation should aim to recruit those with physician-diagnosed or more pronounced levels of chronic pain.
Further, although the current study had 28 potential affect measurement occasions, we did not assess affect across the entire day; the morning and evening surveys assessed recent affect (i.e., since awakening or in the past 2 h, respectively). However, strengthening our current findings, we found that lower levels of longer-term retrospective PA assessed in the baseline survey via the full PANAS also was associated with higher salivary CRP, as was lower PA the night before the second saliva sample was taken. Comprehensive (i.e., covering the day) or more granular assessments (e.g., repeated assessments throughout the day) of affect and inflammation would extend this work.
Conclusion
Our findings demonstrate that higher levels of aggregated daily PA may be uniquely associated with lower levels of salivary CRP in young adults. In contrast, findings from the current study did not indicate a similar unique association between aggregated daily NA and salivary CRP or between aggregated daily NA and PA with salivary IL-6. These associations did not appear to differ by chronic pain status or gender. Further investigation of these associations longitudinally and experimentally will complement the current findings to better understand the degree to which affect and salivary inflammation are connected across time. Overall, our results highlight the importance of examining positive affect in relation to inflammation in future research and signal the potential value of examining affect or emotion regulation as intervention targets to improve health.
Supplementary Material
Acknowledgments
The authors would like to thank Matthew Ulrich for his assistance running the inflammatory assays.
Funding
This study was funded in part by the Social Science Research Institute at the Penn State University (PI: Graham-Engeland). Jones was supported by National Institutes of Aging T32AG049676 to the Pennsylvania State University. Song was supported by the National Research Foundation of Korea’s Brain Korea 21 PLUS (Embodiment: Health and Society Interaction) to Korea University.
Footnotes
Conflict of Interest The authors declare that they have no conflict of interest.
Compliance with Ethical Standards
Electronic supplementary material The online version of this article (https://doi.org/10.1007/s12529-019-09795-2) contains supplementary material, which is available to authorized users.
References
- 1.Andreasson AN, Szulkin R, Undén A-L, von Essen J, Nilsson L-G, Lekander M. Inflammation and positive affect are associated with subjective health in women of the general population. J Health Psychol. 2013;18(3):311–20. [DOI] [PubMed] [Google Scholar]
- 2.Brouwers C, Mommersteeg PMC, Nyklíček I, Pelle AJ, Westerhuis BLWJJM, Szabó BM, et al. Positive affect dimensions and their association with inflammatory biomarkers in patients with chronic heart failure. Biol Psychol. 2013;92(2):220–6. [DOI] [PubMed] [Google Scholar]
- 3.Chauhan A, Yadav SS, Dwivedi P, Lal N, Usman K, Khattri S. Correlation of serum and salivary cytokines level with clinical parameters in metabolic syndrome with periodontitis. J Clin Lab Anal. 2016;30(5):649–55. [DOI] [PMC free article] [PubMed] [Google Scholar]
- 4.Chida Y, Steptoe A. Positive psychological well-being and mortality: a quantitative review of prospective observational studies. Psychosom Med. 2008;70(7):741–56. [DOI] [PubMed] [Google Scholar]
- 5.Cohen J Statistical power analysis for the behavioral sciences. 2nd ed. Hillsdale: Lawrence Earlbaum Associates; 1988. [Google Scholar]
- 6.Consedine NS, Moskowitz JT. The role of discrete emotions in health outcomes: a critical review. Appl Prev Psychol. 2007;12(2):59–75. [Google Scholar]
- 7.Cooper TM, McKinley PS, Seeman TE, Choo T-H, Lee S, Sloan RP. Heart rate variability predicts levels of inflammatory markers: evidence for the vagal anti-inflammatory pathway. Brain Behav Immun. 2015;49:94–100. [DOI] [PMC free article] [PubMed] [Google Scholar]
- 8.Cullen T, Thomas AW, Webb R, Hughes MG. The relationship between interleukin-6 in saliva, venous and capillary plasma, at rest and in response to exercise. Cytokine. 2015;71(2):397–400. [DOI] [PubMed] [Google Scholar]
- 9.Dan H, Liu W, Wang J, Wang Z, Wu R, Chen Q, et al. Elevated IL-10 concentrations in serum and saliva from patients with oral lichen planus. Quintessence Int. 2011;42(2):157–63. [PubMed] [Google Scholar]
- 10.Dantzer R, O’Connor JC, Freund GG, Johnson RW, Kelley KW. From inflammation to sickness and depression: when the immune system subjugates the brain. Nat Rev Neurosci. 2008;9(1):46–56. [DOI] [PMC free article] [PubMed] [Google Scholar]
- 11.Darnall BD, Suarez EC. Sex and gender in psychoneuroimmunology research: past, present and future. Brain Behav Immun. 2009;23(5):595–604. [DOI] [PMC free article] [PubMed] [Google Scholar]
- 12.Desai GS, Mathews ST. Saliva as a non-invasive diagnostic tool for inflammation and insulin-resistance. World J Diabetes. 2014;5(6): 730–8. [DOI] [PMC free article] [PubMed] [Google Scholar]
- 13.DeVon HA, Piano MR, Rosenfeld AG, Hoppensteadt DA. The association of pain with protein inflammatory biomarkers: a review of the literature. Nurs Res. 2014;63(1):51–62. [DOI] [PubMed] [Google Scholar]
- 14.Ebersole JL, Kryscio RJ, Campbell C, Kinane DF, McDevitt J, Christodoulides N, et al. Salivary and serum adiponectin and C-reactive protein levels in acute myocardial infarction related to body mass index and oral health. J Periodontal Res. 2017;52(3):419–27. [DOI] [PMC free article] [PubMed] [Google Scholar]
- 15.Engeland C, Bosch J, Rohleder N. Salivary biomarkers in psychoneuroimmunology. Curr Opin Behav Sci. 2019;28:58–65. [DOI] [PMC free article] [PubMed] [Google Scholar]
- 16.Faul F, Erdfelder E, Lang A-G, Buchner A. G*Power 3: a flexible statistical power analysis program for the social, behavioral, and biomedical sciences. Behav Res Methods. 2007;39:175–91. [DOI] [PubMed] [Google Scholar]
- 17.Fernandez-Botran R, Miller JJ, Burns VE, Newton TL. Correlations among inflammatory markers in plasma, saliva and oral mucosal transudate in post-menopausal women with past intimate partner violence. Brain Behav Immun. 2011;25:314–21. [DOI] [PMC free article] [PubMed] [Google Scholar]
- 18.Fillingim RB, King CD, Ribeiro-Dasilva MC, Rahim-Williams B, Riley JL. Sex, gender, and pain: a review of recent clinical and experimental findings. J Pain. 2009;10(5):447–85. [DOI] [PMC free article] [PubMed] [Google Scholar]
- 19.Ford DE, Erlinger TP. Depression and C-reactive protein in US adults: Data from the Third National Health and nutrition examination survey. Arch Intern Med. 2004;164(9):1010–4. [DOI] [PubMed] [Google Scholar]
- 20.Fredrickson BL. The broaden-and-build theory of positive emotions. Philos Trans R Soc B Biol Sci. 2004;359(1449):1367–78. [DOI] [PMC free article] [PubMed] [Google Scholar]
- 21.Fredrickson BL, Levenson RW. Positive emotions speed recovery from the cardiovascular sequelae of negative emotions. Cognit Emot. 1998;12:191–220. [DOI] [PMC free article] [PubMed] [Google Scholar]
- 22.Friedman EM, Hayney M, Love GD, Singer BH, Ryff CD. Plasma interleukin-6 and soluble IL-6 receptors are associated with psychological well-being in aging women. Health Psychol. 2007;26(3): 305–13. [DOI] [PubMed] [Google Scholar]
- 23.Gohel V, Jones JA, Wehler CJ. Salivary biomarkers and cardiovascular disease: a systematic review. Clin Chem Lab Med. 2018;56(9):1432–42. [DOI] [PubMed] [Google Scholar]
- 24.Graham JE, Robles TF, Kiecolt-Glaser JK, Malarkey WB, Bissell MG, Glaser R. Hostility and pain are related to inflammation in older adults. Brain Behav Immun. 2006;20:389–400. [DOI] [PubMed] [Google Scholar]
- 25.Graham-Engeland JE, Sin NL, Smyth JM, Jones DR, Knight EL, Sliwinski MJ, et al. Negative and positive affect as predictors of inflammation: timingmatters. Brain Behav Immun. 2018;74:222–30. [DOI] [PMC free article] [PubMed] [Google Scholar]
- 26.Granger DA, Kivlighan KT, Fortunato C, Harmon AG, Hibel LC, Schwartz EB, et al. Integration of salivary biomarkers into developmental and behaviorally-oriented research: problems and solutions for collecting specimens. Physiol Behav. 2007;92(4):583–90. [DOI] [PubMed] [Google Scholar]
- 27.Granger DA, Johnson SB, Szanton SL, Out D, Schumann LL. Incorporating salivary biomarkers into nursing research: an overview and review of best practices. Biol Res Nurs. 2012;14(4):347–56. [DOI] [PMC free article] [PubMed] [Google Scholar]
- 28.Hoyt MA, Stanton AL, Bower JE, Thomas KS, Litwin MS, Breen EC, et al. Inflammatory biomarkers and emotional approach coping in men with prostate cancer. Brain Behav Immun. 2013;32:173–9. [DOI] [PMC free article] [PubMed] [Google Scholar]
- 29.Ironson G, Banerjee N, Fitch C, Krause N. Positive emotional wellbeing, health behaviors, and inflammation measured by C-reactive protein. Soc Sci Med. 2018;197:235–43. [DOI] [PubMed] [Google Scholar]
- 30.Irwin MR, Olmstead R, Carroll JE. Sleep disturbance, sleep duration, and inflammation: a systematic review and meta-analysis of cohort studies and experimental sleep deprivation. Biol Psychiatry. 2016;80(1):40–52. [DOI] [PMC free article] [PubMed] [Google Scholar]
- 31.Iyengar A, Paulus JK, Gerlanc DJ, Maron JL. Detection and potential utility of C-reactive protein in saliva of neonates. Front Pediatr. 2014;2:131. [DOI] [PMC free article] [PubMed] [Google Scholar]
- 32.Izawa S, Miki K, Liu X, Ogawa N. The diurnal patterns of salivary interleukin-6 and C-reactive protein in healthy young adults. Brain Behav Immun. 2013;27:38–41. [DOI] [PubMed] [Google Scholar]
- 33.Janicki-Deverts D, Cohen S, Doyle WJ, Turner RB, Treanor JJ. Infection-induced proinflammatory cytokines are associated with decreases in positive affect, but not increases in negative affect. Brain Behav Immun. 2007;21(3):301–7. [DOI] [PMC free article] [PubMed] [Google Scholar]
- 34.Kiecolt-Glaser JK, McGuire L, Robles TR, Glaser R. Emotions, morbidity, and mortality: new perspectives from psychoneuroimmunology. Annu Rev Psychol. 2002;53:83–107. [DOI] [PubMed] [Google Scholar]
- 35.Kopanczyk R, Opris DC, Lickliter J, Bridges EG, Nazar AM, Bridges KG. C-reactive protein levels in blood and saliva show no correlation in young, healthy adults. FASEB J. 2010;24:lb409. [DOI] [PMC free article] [PubMed] [Google Scholar]
- 36.Kubzansky LD, Kawachi I. Going to the heart of the matter: do negative emotions cause coronary heart disease? J Psychosom Res. 2000;48(4–5):323–37. [DOI] [PubMed] [Google Scholar]
- 37.La Fratta I, Tatangelo R, Campagna G, Rizzuto A, Franceschelli S, Ferrone A, et al. The plasmatic and salivary levels of IL-1β, IL-18 and IL-6 are associated to emotional difference during stress in young male. Sci Rep. 2018;8(1):3031. [DOI] [PMC free article] [PubMed] [Google Scholar]
- 38.Lin C, Michopoulos V, Powers A, Wingo AP, Schwartz A, Bradley B, et al. Affect, inflammation, and health in urban at-risk civilians. J Psychiatr Res. 2018;104:24–31. [DOI] [PMC free article] [PubMed] [Google Scholar]
- 39.Majd M, Graham-Engeland JE, Smyth JM, Sliwinski MJ, Lipton RB, Katz MJ, et al. Distinct inflammatory response patterns are evident among men and women with higher depressive symptoms. Physiol Behav. 2018;184:108–15. [DOI] [PMC free article] [PubMed] [Google Scholar]
- 40.Marsland AL, Pressman S, Cohen S. Positive affect and immune function. Psychoneuroimmunology. 2007:261–79. [Google Scholar]
- 41.Meier-Ewert HK, Ridker PM, Rifai N, Price N, Dinges DF, Mullington JM. Absence of diurnal variation of C-reactive protein concentrations in healthy human subjects. Clin Chem. 2001;47(3): 426–30. [PubMed] [Google Scholar]
- 42.Miyamoto Y, Boylan JM, Coe CL, Curhan KB, Levine CS, Markus HR, et al. Negative emotions predict elevated interleukin-6 in the United States but not in Japan. Brain Behav Immun. 2013;34:79–85. [DOI] [PMC free article] [PubMed] [Google Scholar]
- 43.Mortensen RF. C-reactive protein, inflammation, and innate immunity. Immunol Res. 2001;24(2):163–76. [DOI] [PubMed] [Google Scholar]
- 44.Newton TL, Fernandez-Botran R, Miller JJ, Burns VE. Interleukin-6 and soluble interleukin-6 receptor levels in posttraumatic stress disorder: associations with lifetime diagnostic status and psychological context. Biol Psychol. 2014;99:150–9. [DOI] [PMC free article] [PubMed] [Google Scholar]
- 45.Newton TL, Fernandez-Botran R, Lyle KB, Szabo YZ, Miller JJ, Warnecke AJ. Salivary cytokine response in the aftermath of stress: an emotion regulation perspective. Emotion. 2017;17(6):1007–20. [DOI] [PubMed] [Google Scholar]
- 46.Nishanian P, Aziz N, Chung J, Detels R, Fahey JL. Oral fluids as an alternative to serum for measurement of markers of immune activation. Clin Diagn Lab Immunol. 1998;5(4):507–12. [DOI] [PMC free article] [PubMed] [Google Scholar]
- 47.O’Connor MF, Bower JE, Cho HJ, Creswell JD, Dimitrov S, Hamby ME, et al. To assess, to control, to exclude: effects of biobehavioral factors on circulating inflammatory markers. Brain Behav Immun. 2009;23(7):887–97. [DOI] [PMC free article] [PubMed] [Google Scholar]
- 48.Ong AD, Benson L, Zautra AJ, Ram N. Emodiversity and biomarkers of inflammation. Emotion. 2018;18(1):3–14. [DOI] [PMC free article] [PubMed] [Google Scholar]
- 49.Ouellet-Morin I, Danese A, Williams B, Arseneault L. Validation of a high-sensitivity assay for C-reactive protein in human saliva. Brain Behav Immun. 2011;25:640–6. [DOI] [PubMed] [Google Scholar]
- 50.Out D, Hall RJ, Granger DA, Page GG, Woods SJ. Assessing salivary C-reactive protein: longitudinal associations with systemic inflammation and cardiovascular disease risk in women exposed to intimate partner violence. Brain Behav Immun. 2012;26(4): 543–51. [DOI] [PMC free article] [PubMed] [Google Scholar]
- 51.Prather AA, Marsland AL, Muldoon MF, Manuck SB. Positive affective style covaries with stimulated IL-6 and IL-10 production in a middle-aged community sample. Brain Behav Immun. 2007;21(8):1033–7. [DOI] [PMC free article] [PubMed] [Google Scholar]
- 52.Pressman SD, Cohen S. Does positive affect influence health? Psychological Bulletin. 2005;131(6):925–971. [DOI] [PubMed] [Google Scholar]
- 53.R Core Team. R: a language and environment for statistical computing. Vienna: R Foundation for Statistical Computing; 2013. Retrieved from http://www.R-project.org/.Accessed 1 March 2019 [Google Scholar]
- 54.Silvestre-Rangil J, Bagán L, Silvestre FJ, Martinez-Herrera M, Bagán J. Periodontal, salivary and IL-6 status in rheumatoid arthritis patients. A cross-sectional study. Med Oral Patol Oral Cir Bucal. 2017;22(5):e595–600. Retrieved from. 10.4317/medoral.21937. [DOI] [PMC free article] [PubMed] [Google Scholar]
- 55.Sin NL, Graham-Engeland JE, Almeida DM. Daily positive events and inflammation: findings from the National Study of Daily Experiences. Brain Behav Immun. 2015a;43:130–8. [DOI] [PMC free article] [PubMed] [Google Scholar]
- 56.Sin NL, Graham-Engeland JE, Ong AD, Almeida DM. Affective reactivity to daily stressors is associated with elevated inflammation. Health Psychol. 2015b;34(12):1154–65. [DOI] [PMC free article] [PubMed] [Google Scholar]
- 57.Slavish DC, Graham-Engeland JE, Smyth JM, Engeland CG. Salivary markers of inflammation in response to acute stress. Brain Behav Immun. 2014;44:253–69. [DOI] [PMC free article] [PubMed] [Google Scholar]
- 58.Smyth JM, Stone AA. Ecological momentary assessment research in behavioral medicine. J Happiness Stud. 2003;4(1):35–52. [Google Scholar]
- 59.Stanley D apaTables: create American Psychological Association (APA) Style Tables (Version 1.5.1) [R package]; 2017. Retrieved from https://github.com/dstanley4/apaTables.Accessed 1 March 2019
- 60.Stellar JE, John-Henderson N, Anderson CL, Gordon AM, McNeil GD, Keltner D. Positive affect and markers of inflammation: discrete positive emotions predict lower levels of inflammatory cytokines. Emotion. 2015;15(2):129–33. [DOI] [PubMed] [Google Scholar]
- 61.Steptoe A, Leigh Gibson E, Hamer M, Wardle J. Neuroendocrine and cardiovascular correlates of positive affect measured by ecological momentary assessment and by questionnaire. Psychoneuroendocrinology. 2007;32(1):56–64. [DOI] [PubMed] [Google Scholar]
- 62.Sterne JAC, White IR, Carlin JB, Spratt M, Royston P, Kenward MG, et al. Multiple imputation for missing data in epidemiological and clinical research: potential and pitfalls. BMJ. 2009;338:b2393. [DOI] [PMC free article] [PubMed] [Google Scholar]
- 63.Sturgeon JA, Arewasikporn A, Okun MA, Davis MC, Ong AD, Zautra AJ. The psychosocial context of financial stress: implications for inflammation and psychological health. Psychosom Med. 2016;78(2):134–43. [DOI] [PMC free article] [PubMed] [Google Scholar]
- 64.Szabo YZ, Fernandez-Botran R, Newton TL. Cumulative trauma, emotion reactivity and salivary cytokine levels following acute stress in healthy women. Anxiety Stress Coping. 2018;20:1–13. [DOI] [PubMed] [Google Scholar]
- 65.Uchino BN, Trettevik R, Kent de Grey RG, Cronan S, Hogan J, Baucom BRW. Social support, social integration, and inflammatory cytokines: a meta-analysis. Health Psychol. 2018;37(5):462–71. [DOI] [PubMed] [Google Scholar]
- 66.Vgontzas AN, Bixler EO, Lin HM, Prolo P, Trakada G, Chrousos GP. IL-6 and its circadian secretion in humans. Neuroimmunomodulation. 2005;12(3):131–40. [DOI] [PubMed] [Google Scholar]
- 67.Watkins LR, Maier SF, Goehler LE. Immune activation: the role of pro-inflammatory cytokines in inflammation, illness responses and pathological pain states. Pain. 1995;63:289–302. [DOI] [PubMed] [Google Scholar]
- 68.Watson D, Clark LA, Tellegen A. Development and validation of brief measures of positive and negative affect: the PANAS scales. J Pers Soc Psychol. 1988;54:1063–70. [DOI] [PubMed] [Google Scholar]
- 69.Weiser EB. Associations between positive and negative affect and 12-month physical disorders in a national sample. J Clin Psychol Med Settings. 2012;19(2):197–210. [DOI] [PubMed] [Google Scholar]
- 70.Williamson S, Munro C, Pickler R, Grap MJ, Elswick R. Comparison of biomarkers in blood and saliva in healthy adults. Nurs Res Pract. 2012;2012. [DOI] [PMC free article] [PubMed] [Google Scholar]
- 71.Woods JA, Vieira VJ, Keylock KT. Exercise, inflammation, and innate immunity. Neurol Clin. 2009;29(2):381–93. [DOI] [PubMed] [Google Scholar]
Associated Data
This section collects any data citations, data availability statements, or supplementary materials included in this article.