

Abstract

The bis(trifluoromethanesulfonyl)amide anion (Tf2N), which is a common component of ionic liquids, often exhibits disorder in the solid state. In this study, the phase transitions and crystal structures of the Tf2N salts of 1,1‴-dineopentyl-1′,1″-biferrocene (=npBifc), 1′,1″-biferrocene (=Bifc), ferrocene, and cobaltocene (1–4, respectively) were compared. All the salts exhibited phase transitions at low temperatures, which are accompanied by anion ordering, though the ordering was not complete in 2 and 3. X-ray crystallographic investigation revealed that the cations and anions in 1 and 2 adopted alternating arrangements and segregated columnar arrangements, respectively. The cation in 1 exhibited a symmetrical, average-valence structure in the room-temperature phase owing to rapid valence tautomerization, whereas the cation exhibited an unsymmetrical structure in the low-temperature phase. The cation in 2 exhibited an unsymmetrical, trapped-valence structure in both phases. The cation valence states in these salts were accounted for by the electrostatic interactions between the cations and anions. The crystal structures and phase behavior of the ferrocenium salt 3 were very different from those of 4.
Introduction
Biferrocenyl compounds exhibit intriguing redox properties and valence states.1−4 In particular, the valence tautomerization of biferrocenium cations containing Fe(II) and Fe(III) (Figure 1) has attracted significant attention in terms of mixed-valency and crystal engineering.5−12 The biferrocenium cation has an inherently unsymmetrical structure. However, rapid electron exchange in the biferrocenium cation leads to the observation of an average-valence structure on the time scales of X-ray diffraction and Mössbauer spectroscopy. In a symmetrical crystal environment, the cation exhibits a dynamically averaged, symmetric structure owing to valence tautomerization. The asymmetry of the crystal environment can cause differences in the energy levels and equilibrium ratios of the tautomers, resulting in unsymmetrical structures with intermediate valence states.6−12 In a sufficiently large unsymmetrical crystal environment, a trapped valence state is observed owing to the absence of tautomerization, where the positive charge is fully localized on one of the two ferrocenyl units. We have previously investigated the valence states of biferrocenium salts with planar π-conjugated acceptors13−17 and found unique valence transitions including charge-transfer transitions18−21 and spin-Peierls-coupled charge ordering.22
Figure 1.

Valence tautomerization of the mixed-valence biferrocenium cation.
The bis(trifluoromethanesulfonyl)amide (Tf2N–) anion tends to form salts with low melting points owing to its bent structure and conformational flexibility and is hence commonly used as a component of ionic liquids.23 We have synthesized many salts comprising ferrocene derivatives and Tf2N and demonstrated that they produce ionic liquids24−27 and ionic plastic crystals.28 Ferrocenium salts often exhibit a plastic phase owing to the globular shape of the cation.29−32 In addition, the Tf2N anion typically exhibits disorder in the solid state, which causes an order–disorder transition concomitant with a symmetry change at low temperatures.28,33−36 As described above, the valence state of the biferrocenium cation is susceptible to the crystal environment. Therefore, we gained interest in the effects of the Tf2N anion on the melting points and valence states of biferrocenium salts. Herein, we report on the synthesis, thermal properties, and X-ray crystal structures of [npBifc]Tf2N (1) and [Bifc]Tf2N (2) (Bifc = 1′,1″-biferrocene, npBifc = 1,1‴-dineopentyl-1′,1″-biferrocene; Figure 2). Both salts exhibited phase transitions at low temperatures, which are accompanied by anion ordering, wherein 1 exhibited a cation valence-state change in conjunction with anion ordering. In addition, X-ray structure analysis of the ferrocenium salt [FeCp2]Tf2N (3, Cp = C5H5) was conducted. The low-temperature phase transition of this salt was also accompanied by anion ordering, as was observed in [CoCp2]Tf2N (4).36
Figure 2.

Structural formulas of npBifc, Bifc, FeCp2, CoCp2, and Tf2N–.
Results and Discussion
Preparation and Thermal Properties
Both compounds 1 and 2 were synthesized by the reaction of biferrocenes and AgTf2N in acetonitrile. The preparation of 3 has been reported previously.24 Single crystals of 1–3 suitable for X-ray crystallography were prepared via recrystallization from dichloromethane–pentane.
The phase sequences of 1 and 2, determined by differential scanning calorimetry (DSC), are shown in Figure 3, together with those of 3 and 4.24,36 The DSC traces of 1 and 2 are presented in Figure S1 (Supporting Information). All the salts melted at around 400 K, despite the differences in their cation sizes. The melting points of 1 and 2 were 421.3 K (ΔS = 94.5 J mol–1 K–1) and 392.5 K (ΔS = 70.8 J mol–1 K–1), respectively, which are comparable to those of 3 (Tm = 404.7 K)24 and 4 (Tm = 439.1 K).36
Figure 3.

Phase sequences of 1, 2, 3,24 and 4.36 The phase number and space group of each phase are presented in the bar chart. The phase transition temperature (K) and transition entropy (J mol–1 K–1) of each phase transition are presented above and below the bar charts, respectively.
All these salts exhibited phase transitions involving the order–disorder of the anion at low temperatures (see below). Compounds 1 and 2 exhibited phase transitions at 147.7 K (ΔS = 1.0 J mol–1 K–1) and ∼223 K (ΔS = 1.3 J mol–1 K–1), respectively (Figure 3). The latter transition was broad, spanning a temperature range of ∼20 K. Similarly, 3 and 4 exhibited phase transitions at 198.8 K (ΔS = 2.2 J mol–1 K–1)24 and 255.4 K (ΔS = 8.5 J mol–1 K–1),36 respectively. The transition entropies for 1–3 were somewhat smaller than the ideal value for an order–disorder transition (R ln 2 = 5.76 J mol–1 K–1).
General Structural Features
Table 1 summarizes the general structural features and valence states of 1–3, as revealed by X-ray structure analysis, together with those of 4.36 The packing structures of 1 and 2 were strikingly different; the cations and anions formed an alternating arrangement in 1, whereas they formed segregated columns in 2. The large neopentyl substituent in 1 prevents columnar stacking of the cations, whereas the tendency of unsubstituted biferrocene to form columnar structures has also been observed in other salts.16,17 The packing structures of 3 and 4 were complicated.
Table 1. Summary of Structural Features of 1–4.
| compound | [npBifc]Tf2N (1) | [Bifc]Tf2N (2) | [FeCp2]Tf2N (3) | [CoCp2]Tf2N (4) |
|---|---|---|---|---|
| cation–anion arrangement | segregated stack | alternating | a | a |
| transition temperatureb | 147.7 | 223 | 198.8c | 255.4d |
| RT phase cation valence state | averaged | trapped | ||
| anion ordering | disordered | disordered | disordered | disorderedd |
| LT phase cation valence state | intermediate | trapped | ||
| anion ordering | ordered | mostly ordered | mostly ordered | ordered |
| VLT phase/VRT phasee | 2 | 6 | 2 | 2d |
The structure analysis revealed that anion ordering occurs at the low-temperature phase transition, though the ordering was not complete in 2 and 3. The anion ordering affected the valence state of the cation in 1; the cation exhibited a symmetrical, average-valence structure in the room-temperature (RT) phase but exhibited an unsymmetrical structure in the low-temperature (LT) phase. The latter structure is the intermediate between the average- and trapped-valence structures. In contrast, the cation in 2 exhibited an unsymmetrical, trapped-valence structure in both phases. The structural changes accompanying the phase transition in each salt are discussed in detail in the following sections.
Crystal Structures of 1
X-ray structure analysis of 1 revealed that anion ordering occurs with the phase transition at 147.7 K. The unit cell volume of the LT phase was twice that of the RT phase. The cation structure changed from symmetrical in the RT phase to unsymmetrical in the LT phase.
The crystal structure of the RT phase of 1 is illustrated in Figure 4. Compound 1 crystallized in the Cmca (Z = 4) space group, where one cation and one anion were crystallographically independent. The C5 axis of each ferrocenyl moiety is aligned along the b axis. The cations and anions are arranged alternately in the crystal, where one cation is surrounded by eight anions and vice versa (Figure 4b). The cations and anions are alternately arranged along the b axis, and no π–π contacts exist between the cations. The cation exhibits a symmetrical structure, where two Fe atoms are crystallographically equivalent. The anion presents a trans conformation, and the central N(SO2)2 moiety is disordered over two sites, with a 0.5:0.5 occupancy (Figure S2a, Supporting Information). Such disorder is often observed in Tf2N salts.33−36
Figure 4.

Packing diagrams of the RT phase of [npBifc]Tf2N (1) projected along the (a) a and (b) b axes (Cmca, Z = 4). Only the molecules in one layer are illustrated to avoid molecule overlap. Hydrogen atoms are omitted for clarity.
The packing diagram of the LT phase is shown in Figure 5. The molecular arrangements were almost identical to those in the RT phase, but the unit cell volume was twice that of the RT phase owing to cell-doubling along the a axis. The LT phase belongs to the P212121 (Z = 8) space group, and there are two cations and two anions that were crystallographically independent (cations I, II and anions I, II). The anions were fully ordered. The cations exhibit unsymmetrical structures, where two Fe atoms are crystallographically inequivalent. The dihedral angles between the Cp rings of the fulvalene moieties of the cations are 6.6 and 6.7° for cations I and II, respectively. The valence states of the cation are discussed in detail in the next section.
Figure 5.

Packing diagram of the LT phase of [npBifc]Tf2N (1) projected along the c axis (P212121, Z = 8). Only the molecules in one plane are presented to avoid molecule overlap. Hydrogen atoms are omitted for clarity.
Valence States of 1
The correlation between the cation structure and the crystal environment of 1 above and below the phase transition was investigated in detail. The valence localization of the cation in the LT phase is ascribed to the unsymmetrical cation–anion interactions derived from anion ordering.
The intramolecular Fe–Cp(centroid) distances of the cationic and neutral moieties in the valence-trapped biferrocenium cations are approximately 1.70 and 1.65 Å, respectively, and are reliable indicators of the valence state of biferrocenes.15 The bond lengths in the ferrocenium cation are longer than those in ferrocene because the former is a 17-electron species. The Fe–Cp(centroid) distances in 1 are presented in Table 2 and Figure 6. The Fe–Cp(centroid) distance in the RT phase of 1 is 1.671 Å, which is the intermediate between those of the cationic and neutral moieties. This is consistent with the symmetric, average-valence structure of the RT phase of 1. The cation structures were unsymmetrical in the LT phase, where the Fe–Cp(centroid) distances were 1.684 and 1.660 Å (for Fe1 and Fe2, respectively) for cation I. The distances were 1.680 and 1.667 Å (for Fe3 and Fe4, respectively) for cation II. The longer bond lengths for Fe1 in cation I and Fe3 in cation II indicate that the positive charge was primarily localized on these Fe atoms. These bond lengths are the intermediate between those of the average- and trapped-valence states (Figure 6) and correspond to an averaged structure of energetically different tautomers in an approximately 2:1 ratio. The equilibrium ratio of the tautomers should be temperature-dependent, where a more unsymmetrical structure would be observed at lower temperatures. This result indicates that the valence-state change does not originate from the charge ordering of the cation but is a consequence of anion ordering.
Table 2. Intramolecular Fe–Cp(centroid) and Fe–C(Cp) Distances, and Intermolecular Fe···O Distances Shorter than 4.5 Å in [npBifc]Tf2N (1) and [Bifc]Tf2N (2).
| compound | cation | Fe site | Fe–Cp(centroid)/Åa | Fe–C(Cp)/Åb | Fe···O distances/Å | ||
|---|---|---|---|---|---|---|---|
| 1 (RT phase, 273 K) | Fe1 | 1.671 | 2.062 [2.043–2.105] | 4.20 | 4.20 | 4.43 | |
| 1 (LT phase, 100 K) | I | Fe1 | 1.684 | 2.077 [2.050(7)–2.116(4)] | 4.03 | 4.14 | 4.21 |
| Fe2 | 1.660 | 2.058 [2.042(7)–2.087(4)] | 4.09 | 4.17 | 4.27 | ||
| II | Fe3 | 1.680 | 2.071 [2.050(7)–2.102(5)] | 4.06 | 4.11 | 4.17 | |
| Fe4 | 1.667 | 2.061 [2.038(7)–2.097(5)] | 4.09 | 4.16 | 4.31 | ||
| 2 (RT phase, 273 K) | I | Fe1 | 1.699 | 2.067 [2.044–2.130] | 4.20 | ||
| Fe2 | 1.654 | 2.038 [2.022–2.051] | 4.35 | 4.35 | |||
| 2 (LT phase, 100 K) | I | Fe1 | 1.700 | 2.081 [2.044(7)–2.143(7)] | 3.93 | ||
| Fe2 | 1.654 | 2.046 [2.031(7)–2.056(7)] | 4.22 | 4.30 | |||
| II | Fe3 | 1.698 | 2.084 [2.038(7)–2.153(7)] | 4.00 | |||
| Fe4 | 1.654 | 2.047 [2.02(1)–2.068(7)] | 4.39 | 4.46 | |||
| III | Fe5 | 1.697 | 2.078 [2.047(7)–2.132(7)] | 3.95 | |||
| Fe6 | 1.653 | 2.046 [2.037(7)–2.063(7)] | 4.35 | 4.38 | |||
Distance between Fe and centroid of the Cp ring (average value).
Average value. Distance range is listed in square brackets.
Figure 6.

Intramolecular Fe–Cp(centroid) distances in [npBifc]Tf2N (1) and [Bifc]Tf2N (2). The dashed lines represent the distances in the neutral (Fc0) and cationic (Fc+) moieties of the valence-trapped biferrocenium cation.
The observed change in the cation valence state is attributed to cation–anion electrostatic interactions. Previously, we reported that the cation charge tended to reside on the Fe atom closer to the electronegative atoms of the anions.22,37Figure 7a,b shows the structures of the cation and four surrounding anions for the RT and LT phases, respectively, where the order–disorder of the anions was also observed. The negative charge of the Tf2N anion is delocalized over the N(SO2)2 moiety, and several O atoms of the anions are located near the Fe atoms at distances shorter than 4.5 Å in both phases, as indicated by the dashed lines in Figure 7. The Fe···O distances are also summarized in Table 2. In the RT phase, the anion arrangements around the two Fe atoms of the cations are equivalent (Figure 7a). However, anion ordering causes the crystal environment around the cations to become slightly unsymmetrical in the LT phase: the three Fe···O intermolecular distances for Fe1 (or Fe3) are 0.03–0.06 Å shorter than the corresponding distances for Fe2 (or Fe4), as seen in Figure 7b. The structures and crystal environments of cations I and II are almost the same. Thus, the tendency toward charge localization on Fe1 (or Fe3) is consistent with the stronger electrostatic interaction of this atom with the anions. The slightly greater asymmetry of cation I than cation II, as seen in Figure 6, may be attributed to the short intermolecular Fe···O distance of 4.03 Å for Fe1.
Figure 7.

Structures of cations and neighboring anions in the (a) RT and (b) LT phases (top: cation I, bottom: cation II) of [npBifc]Tf2N (1). The dashed lines indicate intermolecular Fe······O distances (Å) shorter than 4.5 Å.
We have previously reported a biferrocenium salt in which anion dimerization at the spin-Peierls phase transition causes valence localization.22 The current case is similar in that the phase transition originating from the anion induces the formation of an unsymmetrical crystal environment, which affects the cation valence state. However, the current case is a first-order phase transition, and its physical origin is essentially different from that of the second-order spin-Peierls transition.
Crystal Structures of 2
X-ray structure analysis of 2 revealed that anion ordering occurs with the phase transition at 223 K. The unit cell volume of the LT phase was six times larger than that of the RT phase. In both phases, the cations exhibited unsymmetrical structures.
The crystal structure of the RT phase of 2 is illustrated in Figure 8a. The space group was P21/m (Z = 2), and one cation and anion were crystallographically independent. The cations form a columnar stacking structure along the direction of the a axis through π–π interactions, with intermolecular Cp–Cp distances (centroids) of 3.98 and 3.91 Å. The anions are arranged one-dimensionally along the same direction, and their arrangement resembles that of the cations. The cations adopt an unsymmetrical structure in which the two iron atoms are crystallographically nonequivalent. The Cp rings of the fulvalene moiety are planar. The anion presents trans conformation, the central N(SO2)2 moiety is disordered over four sites, and the CF3 groups exhibit rotational disorder (Figure S3a, Supporting Information).
Figure 8.

Packing diagrams of (a) RT phase (P21/m, Z = 2) and (b) LT phase (P21/n, Z = 12) of [Bifc]Tf2N (2). Only the molecules in one layer are illustrated to avoid molecule overlap. Hydrogen atoms are omitted for clarity.
The LT phase of 2 (Figure 8b) crystallized in the P21/n (Z = 12) space group. The molecular arrangements of this phase were almost the same as those of the RT phase, though the stacking period of the cation and unit cell volume were three and six times larger, respectively, compared with the RT phase structure. The cation column contains three crystallographically independent molecules (cations I–III), which are stacked almost regularly via π–π interactions, with intermolecular Cp–Cp distances (centroids) of 3.76–3.87 Å. The dihedral angles between the Cp rings of the fulvalene moiety of the cation are 7.9, 4.2, and 2.6°, for cations I–III, respectively. Three crystallographically independent anions presenting trans conformation (anions I–III) are observed, where anion II is fully ordered, but a slight disorder is still detected for anions I and III. In these anions, the N(SO2)2 moiety is disordered, with occupancies of 0.88:0.12 and 0.82:0.18 (anions I and III, respectively; Figure S3b, Supporting Information). The CF3 groups of these anions exhibit rotational disorder over two sites. The extent of the residual disorder may depend on the cooling rate during X-ray measurements because the phase transition occurred over a wide temperature range.
Valence States of 2
The cation in 2 exhibited a trapped-valence structure in both the RT and LT phases. The valence localization is ascribed to unsymmetrical cation–anion electrostatic interactions.
The Fe–Cp(centroid) distances for the two ferrocenyl units in the cation are unequal at approximately 1.65 and 1.70 Å, both in the RT and LT phases (Table 2), where the distances correspond to the values for a typical valence-trapped biferrocenium cation (Figure 6). The structure of cation I and its neighboring anions in the LT phase is illustrated in Figure 9. One O atom of the anion approaches Fe1 at a short distance of 3.93 Å, where this interaction induces charge localization on the Fe atom via electrostatic interaction. In comparison, the separation between the Fe2 and O atoms is longer at 4.22 and 4.30 Å. The intermolecular Fe···O distances and anion arrangements for cations II and III are similar to those for cation I, and the cation environments in the RT phases are also similar (Figures S4 and S5, Supporting Information). Thus, the trapped-valence state of this salt is consistent with the local cation–anion electrostatic interactions for both phases.
Figure 9.
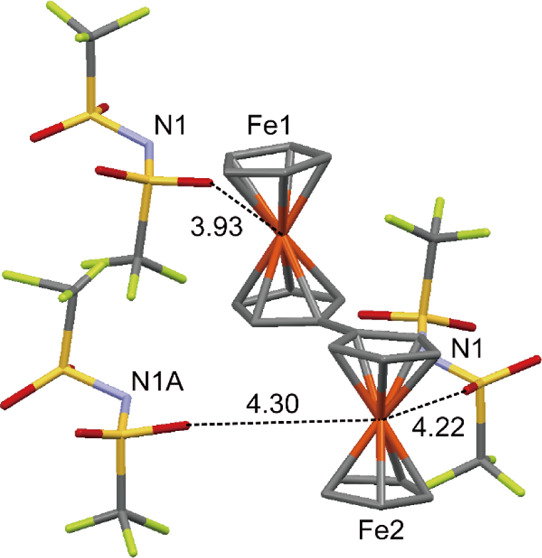
Structure of cation I and neighboring anions in the LT phase of [Bifc]Tf2N (2). The dashed lines indicate intermolecular Fe···O distances (Å) shorter than 4.5 Å. Only the major components of the disordered moieties are illustrated for each anion.
Crystal Structures of 3
X-ray structure analysis of 3 revealed that anion ordering occurs with the phase transition at 198.8 K. The RT phase structure of this salt is isomorphous with the LT phase structure of 4 but extensively disordered.
The structure of the RT phase (phase II, Figure 3) of 3 was elucidated at 223 K, but a detailed discussion is not attempted herein because the analysis was incomplete (R = 14.7%) owing to extensive disorder of the anion. The packing diagram is presented in Figure S6 (Supporting Information). This phase crystallized in the C2/c (Z = 8) space group, where one cation is surrounded by eight anions and vice versa. The C5 axis of each cation is aligned nearly along the c axis. There are two crystallographically independent anions, of which anion I adopts the trans conformation. The anion exhibits two-fold disorder of the N(SO2)2 moiety, with 0.5:0.5 occupancy, and the CF3 groups exhibit rotational disorder. The other anion (anion II) adopts a twisted trans conformation and is extensively disordered. Although this phase (phase II) exhibited a monoclinic, anisotropic crystal structure, phase I might be an isotropic plastic phase or a rotator phase, considering the small entropy of melting.
The packing diagram of the LT phase (phase III) determined at 100 K is illustrated in Figure 10. The LT phase of 3 crystallized in the P21 (Z = 16) space group; hence the structure was converted to a noncentrosymmetric one, compared with that of the RT phase. The unit cell volume was twice that of the RT phase. The molecular arrangements in both phases were similar, but the LT structure was highly complicated, consisting of eight crystallographically independent cations and anions each. One of the Cp rings of the cation containing Fe3 presents rotational disorder with an occupancy ratio of 0.74:0.26. The anions adopt the trans conformation. Although the anions are mostly ordered, one of the eight independent anions presents two-fold disorder of the central N(SO2)2 moiety, with an occupancy ratio of 0.85:0.15. Thus, a very slight degree of anion disorder remained in the LT phase.
Figure 10.

Packing diagram of the LT phase of [FeCp2]Tf2N (3) (P21, Z = 16).
The phase behavior of 3 was different from that of corresponding cobaltocenium salt 4 (Figure 3),36 despite the almost identical molecular structures of both compounds. In both salts, anion ordering occurs at the transitions from the RT phase to LT phase, accompanied by cell-doubling, but the structures of the corresponding phases were different. The highly disordered RT phase of 3 was isomorphic with the LT phase of 4. At the phase transition in 4, the anion became fully ordered and the crystal environment around the cations changed from symmetric to unsymmetric.36 Notably, the phase transition of 1 had essentially the same character, where anion-ordering rendered the environment around the cation unsymmetrical, leading to a change in the valence state of the cation.
Conclusions
The crystal structures, valence states, and phase transitions of the Tf2N salts of npBifc, Bifc, ferrocene, and cobaltocene (1–4) were compared. All the salts melted at around 400 K and exhibited order–disorder phase transitions of Tf2N at low temperatures, though the ordering was not complete in 2 and 3. In the crystal, the cations and anions in 1 and 2 adopted alternating arrangements and segregated columnar arrangements, respectively. The crystal structures and phase sequence of the ferrocenium salt 3 were very different from those of the cobaltocenium salt 4, despite both compounds having almost identical molecular structures.
The valence states of the cations in 1 and 2 were evaluated and were reasonably accounted for by local cation–anion electrostatic interactions. The cation in 1 changed from an averaged valence state to an intermediate valence state at low temperatures as a consequence of anion ordering, which renders the crystal environment around the cation unsymmetrical. The symmetry-lowering phenomenon via anion ordering was also observed in 4. In contrast, the cation in 2 exhibited a trapped-valence state owing to the unsymmetrical crystal environment.
Experimental Section
Preparation
1,1″-Dineopentyl-1′,1′-biferrocene,22 biferrocene,38 AgTf2N,39 and 3(24) were synthesized according to the methods reported in the literature. AgTf2N (7.5 × 10⁻⁵ mol) was added to an acetonitrile solution of 1,1‴-dineopentyl-1′,1″-biferrocene or biferrocene (5 × 10⁻⁵ mol), and the solution was stirred for 1 h. The solution was filtered, and the filtrate was evaporated to obtain the desired product as a black/violet solid. Single crystals were obtained in fair yields via vapor diffusion of pentane into dichloromethane solutions of the solids. 1: Anal. Calcd for C32H38F6Fe2N1O4S2 C, 48.62; H, 4.85; N, 1.77. Found: C, 48.81; H, 5.07; N, 1.78. 2: Anal. Calcd for C22H18F6Fe2N1O4S2: C, 40.64; H, 2.79; N, 2.15. Found: C, 40.39; H, 2.94; N, 2.10.
Instrumentation
DSC measurements were conducted at a rate of 10 K min–1 using a TA Instruments Q100 differential scanning calorimeter, and other rates were applied as required. Single crystal XRD data were collected using a Bruker APEX II Ultra CCD diffractometer with Mo Kα radiation (λ = 0.71073 Å). The structures were determined by employing the direct method using the SHELXL software.40 The crystallographic parameters are summarized in Tables S1 and S2 (Supporting Information).
Acknowledgments
We thank Dr. Yusuke Funasako (National Institute of Technology, Wakayama College) for his help with X-ray structure determination. This work was supported financially by KAKENHI (grant number 20H02756) from the Japan Society for the Promotion of Science (JSPS).
Supporting Information Available
The Supporting Information is available free of charge at https://pubs.acs.org/doi/10.1021/acsomega.1c03059.
DSC traces; ORTEP drawings of cations and anions; structures of cations and neighboring anions; packing diagram; and crystallographic parameters (PDF)
CCDC-1882752 (1, 273 K) (CIF)
CCDC-1882753 (1, 100 K) (CIF)
CCDC-1882754 (2, 273 K) (CIF)
CCDC-1882755 (2, 100 K) (CIF)
CCDC-1062863 (3, 100 K) (CIF)
Accession Codes
CCDC-1882752 (1, 273 K), 1882753 (1, 100 K), 1882754 (2, 273 K), 1882755 (2, 100 K), and 1062863 (3, 100 K) contain the supplementary crystallographic data for this paper. These data can be obtained free of charge from The Cambridge Crystallographic Data Centre via www.ccdc.cam.ac.uk/data_request/cif.
The authors declare no competing financial interest.
Supplementary Material
References
- Wilson L. E.; Hassenrück C.; Winter R. F.; White A. J. P.; Albrecht T.; Long N. J. Functionalised Biferrocene Systems towards Molecular Electronics. Eur. J. Inorg. Chem. 2017, 496–504. 10.1002/ejic.201601036. [DOI] [Google Scholar]
- Wilson L. E.; Hassenrück C.; Winter R. F.; White A. J. P.; Albrecht T.; Long N. J. Ferrocene- and Biferrocene-Containing Macrocycles towards Single-Molecule Electronics. Angew. Chem., Int. Ed. 2017, 56, 6838–6842. 10.1002/anie.201702006. [DOI] [PMC free article] [PubMed] [Google Scholar]
- Chen J.; Tagne Kuate A. C.; Alain C.; Lalancette R. A.; Jakle F. Heteroatom-Bridged ortho-Biferrocenes: Stereoselective Synthesis, Structural Features, and Electrochemical Properties. Organometallics 2016, 35, 1964–1972. 10.1021/acs.organomet.6b00272. [DOI] [Google Scholar]
- Tahara K.; Terashita N.; Akita T.; Katao S.; Kikuchi J.-i.; Tokunaga K. Electrochemistry, Charge Transfer Properties, and Theoretical Investigation of a Macrocyclic Boronate Dimer of 1′,1‴-Biferrocenediboronic Acid and Related Ferrocenyl Boronate Complexes. Organometallics 2015, 34, 299–308. 10.1021/om501129a. [DOI] [Google Scholar]
- Hendrickson D. N.Electron Transfer in Mixed-Valence Complexes in the Solid State. In Mixed Valency Systems: Applications in Chemistry, Physics, and Biology; Nato Science Series; Prassides C. K., Ed.; Kluwer: Dordrecht, 1991; Vol. 343, pp 67–90. [Google Scholar]
- Oda T.; Nakashima S.; Okuda T. Mixed-Valence State of Optically Active 1’,1’ ’’-Bis(2-phenylbutyl)-1,1’ ’-biferrocenium Pentaiodide: Effects of Cation Symmetry and Intermolecular Interaction on Trapped-/Detrapped-Valence States. Inorg. Chem. 2003, 42, 5376–5383. 10.1021/ic0343455. [DOI] [PubMed] [Google Scholar]
- Dong T.-Y.; Chang L.-S.; Lee G.-H.; Peng S.-M. Pronounced Effects of Zero-Point Energy Difference on Intramolecular Electron Transfer in Asymmetric Mixed-Valence Biferrocenium Cations: Structural, EPR, and 57Fe Mössbauer Characteristics. Organometallics 2002, 21, 4192–4200. 10.1021/om0203476. [DOI] [Google Scholar]
- Sano H. Mixed-valence states of iron in binuclear ferrocene compounds. Hyperfine Interact. 1990, 53, 97–112. 10.1007/bf02101042. [DOI] [Google Scholar]
- Nakashima S.; Masuda Y.; Motoyama I.; Sano H. Mössbauer and ESR Spectroscopic Studies on the Mixed-Valence States of 1′,1’″-Dialkyl- and 1′,1’″-Bis(methylbenzyl)biferrocenium Triiodides in Crystalline and Dispersed State. Bull. Chem. Soc. Jpn. 1987, 60, 1673–1680. 10.1246/bcsj.60.1673. [DOI] [Google Scholar]
- Sorai M.; Nishimori A.; Hendrickson D. N.; Dong T. Y.; Cohn M. J. Heat Capacity and Phase Transition of the Mixed-Valence Compound Biferrocenium Triiodide. J. Am. Chem. Soc. 1987, 109, 4266–4275. 10.1021/ja00248a022. [DOI] [Google Scholar]
- Dong T. Y.; Hendrickson D. N.; Iwai K.; Cohn M. J.; Geib S. J.; Rheingold A. L.; Sano H.; Motoyama I.; Nakashima S. Mixed-Valence Dialkylbiferrocenium Salts: An Explanation for the Observed Temperature Dependence of Electron-Transfer Rates. J. Am. Chem. Soc. 1985, 107, 7996. 10.1021/ja00312a034. [DOI] [Google Scholar]
- Morrison W. H.; Hendrickson D. N. Electron transfer in oxidized biferrocene, biferrocenylene, and [1.1]ferrocenophane systems. Inorg. Chem. 1975, 14, 2331–2346. 10.1021/ic50152a007. [DOI] [Google Scholar]
- Mochida T.; Nagabuchi E.; Takahashi M.; Mori H. Biferrocenium salts with magnetite-like mixed-valence iron: coexistence of Fe3+ and Fe2.5+ in the crystal. Chem. Commun. 2014, 50, 2481–2483. 10.1039/c3cc49568j. [DOI] [PubMed] [Google Scholar]
- Mochida T.; Funasako Y.; Takahashi K.; Inokuchi M.; Sakurai T.; Ikeda S.; Ohta H.; Mori H.; Uruichi M. A biferrocenium salt containing paramagnetic tetracyanoquinodimethane hexamers: charge disproportionation via donor-acceptor interactions. Chem. Commun. 2014, 50, 13370–13372. 10.1039/c4cc06888b. [DOI] [PubMed] [Google Scholar]
- Mochida T.; Funasako Y.; Nagabuchi E.; Mori H. Charge-Transfer Salts of Biferrocene Derivatives with F2- and F4-Tetracyanoquinodimethane: Correlation Between Donor–Acceptor Ratios and Cation Valence States. Cryst. Growth Des. 2014, 14, 1459–1466. 10.1021/cg500006e. [DOI] [Google Scholar]
- Mochida T.; Funasako Y.; Yamazaki S.; Mori H. Mixed-Valence Biferrocenium Salts of Xn-TCNQ (X = F, Cl;n= 1, 2): Correlation between Molecular Structures and Assembled Structures. Eur. J. Inorg. Chem. 2014, 3920–3926. 10.1002/ejic.201400093. [DOI] [Google Scholar]
- Mochida T.; Yamazaki S.; Suzuki S.; Shimizu S.; Mori H. Structure and Electronic Properties of Biferrocene-TCNQ Charge-Transfer Complexes: Effects of Acceptors and Crystal Environment on the Mixed-Valence States. Bull. Chem. Soc. Jpn. 2003, 76, 2321–2328. 10.1246/bcsj.76.2321. [DOI] [Google Scholar]
- Mochida T.; Funasako Y.; Akasaka T.; Uruichi M.; Mori H. Valence engineering of ionic molecular crystals: monovalent-divalent phase diagram for biferrocene-tetracyanoquinodimethane salts. CrystEngComm 2017, 19, 1449–1453. 10.1039/c7ce00134g. [DOI] [Google Scholar]
- Mochida T.; Funasako Y.; Takazawa K.; Takahashi M.; Matsushita M. M.; Sugawara T. Chemical control of the monovalent–divalent electron-transfer phase transition in biferrocenium–TCNQ salts. Chem. Commun. 2014, 50, 5473–5475. 10.1039/c4cc01296h. [DOI] [PubMed] [Google Scholar]
- Uruichi M.; Yue Y.; Yakushi K.; Mochida T. Two-Phase Coexistence in the Monovalent-to-Divalent Phase Transition of Dineopentylbiferrocene-Fluorotetracyanoquinodimethane [npBifc-(F1TCNQ)3], Charge-Transfer Salt. J. Phys. Soc. Jpn. 2007, 76, 124707. 10.1143/jpsj.76.124707. [DOI] [Google Scholar]
- Mochida T.; Takazawa K.; Takahashi M.; Takeda M.; Nishio Y.; Sato M.; Kajita K.; Mori H.; Matsushita M.; Sugawara T. Transformation between Monovalent and Divalent Ionic Solids: An Ionic(I)–Ionic(II) Phase Transition in a Biferrocene–F1TCNQ Charge-Transfer Complex. J. Phys. Soc. Jpn. 2005, 74, 2214–2216. 10.1143/jpsj.74.2214. [DOI] [Google Scholar]
- Mochida T.; Takazawa K.; Matsui H.; Takahashi M.; Takeda M.; Sato M.; Nishio Y.; Kajita K.; Mori H. Biferrocene–M(mnt)2 Charge-Transfer Complexes (M = Ni, Co; mnt = Maleonitriledithiolate). Structure, Valence States, and Magnetic Properties. Inorg. Chem. 2005, 44, 8628–8641. 10.1021/ic048285u. [DOI] [PubMed] [Google Scholar]
- Stark A.; Seddon K. R.. Kirk-Othmer Encyclopedia of Chemical Technology,; Wiley-Interscience: New York, 5th ed., 2007; Vol. 26, pp 836–919. [Google Scholar]
- Inagaki T.; Mochida T.; Takahashi M.; Kanadani C.; Saito T.; Kuwahara D. Ionic Liquids of Cationic Sandwich Complexes. Chem.—Eur. J. 2012, 18, 6795–6804. 10.1002/chem.201200151. [DOI] [PubMed] [Google Scholar]
- Inagaki T.; Mochida T. Metallocenium Ionic Liquids. Chem. Lett. 2010, 39, 572–573. 10.1246/cl.2010.572. [DOI] [Google Scholar]
- Funasako Y.; Inagaki T.; Mochida T.; Sakurai T.; Ohta H.; Furukawa K.; Nakamura T. Organometallic ionic liquids from alkyloctamethylferrocenium cations: thermal properties, crystal structures, and magnetic properties. Dalton Trans. 2013, 42, 8317–8327. 10.1039/c3dt00084b. [DOI] [PubMed] [Google Scholar]
- Funasako Y.; Mochida T.; Inagaki T.; Sakurai T.; Ohta H.; Furukawa K.; Nakamura T. Magnetic memory based on magnetic alignment of a paramagnetic ionic liquid near room temperature. Chem. Commun. 2011, 47, 4475–4477. 10.1039/c0cc05820c. [DOI] [PubMed] [Google Scholar]
- Mochida T.; Funasako Y.; Ishida M.; Saruta S.; Kosone T.; Kitazawa T. Crystal Structures and Phase Sequences of Metallocenium Salts with Fluorinated Anions: Effects of Molecular Size and Symmetry on Phase Transitions to Ionic Plastic Crystals. Chem.—Eur. J. 2016, 22, 15725–15732. 10.1002/chem.201603170. [DOI] [PubMed] [Google Scholar]
- Braga D.; Grepioni F. Organometallic polymorphism and phase transitions. Chem. Soc. Rev. 2000, 29, 229–238. 10.1039/a909042h. [DOI] [Google Scholar]
- Tominaga T.; Ueda T.; Mochida T. Effect of substituents and anions on the phase behavior of Ru(II) sandwich complexes: exploring the boundaries between ionic liquids and ionic plastic crystals. Phys. Chem. Chem. Phys. 2017, 19, 4352–4359. 10.1039/c6cp08308k. [DOI] [PubMed] [Google Scholar]
- Kimata H.; Sakurai T.; Ohta H.; Mochida T. Phase Transitions, Crystal Structures, and Magnetic Properties of Ferrocenium Ionic Plastic Crystals with CF3 BF3 and Other Anions. ChemistrySelect 2019, 4, 1410–1415. 10.1002/slct.201900141. [DOI] [Google Scholar]
- Kimata H.; Mochida T. Effects of Molecular Structure on Phase Transitions of Ionic Plastic Crystals Containing Cationic Sandwich Complexes. Cryst. Growth Des. 2018, 18, 7562–7569. 10.1021/acs.cgd.8b01390. [DOI] [Google Scholar]
- Henderson W. A.; Herstedt M.; Young V. G.; Passerini S. Jr; De Long H. C.; Trulove P. C. New Disordering Mode for TFSI-Anions: The Nonequilibrium, Plastic Crystalline Structure of Et4NTFSI. Inorg. Chem. 2006, 45, 1412–1414. 10.1021/ic0513742. [DOI] [PubMed] [Google Scholar]
- Henderson W. A.; Young V. G.; Passerini S. Jr.; Trulove P. C.; De Long H. C. Plastic Phase Transitions in N-Ethyl-N-methylpyrrolidinium Bis(trifluoromethanesulfonyl)imide. Chem. Mater. 2006, 18, 934–938. 10.1021/cm051936f. [DOI] [Google Scholar]
- Lauw Y.; Rüther T.; Horne M. D.; Wallwork K. S.; Skelton B. W.; Madsen I. C.; Rodopoulos T. Structural Studies on the Basic Ionic Liquid 1-Ethyl-1,4-diazabicyclo[2.2.2]octanium Bis(trifluoromethylsulfonyl)imide and Its Bromide Precursor. Cryst. Growth Des. 2012, 12, 2803–2813. 10.1021/cg201592u. [DOI] [Google Scholar]
- Mochida T.; Funasako Y.; Inagaki T.; Li M.-J.; Asahara K.; Kuwahara D. Crystal Structures and Phase-Transition Dynamics of Cobaltocenium Salts with Bis(perfluoroalkylsulfonyl)amide Anions: Remarkable Odd-Even Effect of the Fluorocarbon Chains in the Anion. Chem.—Eur. J. 2013, 19, 6257–6264. 10.1002/chem.201300186. [DOI] [PubMed] [Google Scholar]
- Mochida T.; Kobayashi T.; Akasaka T. Preparation and structures of biferrocenes with alicyclic substituents: Order-disorder of substituents in the crystal structures of cyclohexenylbiferrocene and its charge-transfer salt. J. Organomet. Chem. 2013, 741–742, 72–77. 10.1016/j.jorganchem.2013.05.041. [DOI] [Google Scholar]
- Vij A.; Zheng Y. Y.; Kirchmeier R. L.; Shreeve J. M. Electrophilic Addition and Substitution Reactions of Bis((trifluoromethyl)sulfonyl)amide and Its N-Chloro Derivative. Inorg. Chem. 1994, 33, 3281–3288. 10.1021/ic00093a015. [DOI] [Google Scholar]
- Raush M. D. Ferrocene and Related Organometallic π-Complexes. IV. Some Ullmann Reactions of Haloferrocenes. J. Org. Chem. 1961, 26, 1802. 10.1021/jo01065a026. [DOI] [Google Scholar]
- Sheldrick G. M. A short history of SHELX. Acta Crystallogr., Sect. A: Found. Crystallogr. 2008, 64, 112–122. 10.1107/s0108767307043930. [DOI] [PubMed] [Google Scholar]
Associated Data
This section collects any data citations, data availability statements, or supplementary materials included in this article.