

Abstract
A whispering-gallery mode (WGM) optical resonance sensor for volatile organic compounds (VOCs) is developed from polystyrene (PS) microspheres doped with fluorescent β-cyano-appended oligo(p-phenylenevinylene) (β-COPV). The β-COPV-doped PS microspheres (MSCOPV) are formed by the miniemulsion method in a binary solvent. MSCOPV expand upon permeation of VOCs into the PS matrix and exhibit a spectral shift of the WGM resonance peak. The permeation efficiency is highly dependent on the chemical affinity between the analyte and the polymer matrix, with exceptionally high selectivity toward aromatic hydrocarbons such as benzene, toluene, and xylenes (BTXs). The high selectivity and sensitivity of MSCOPV are in clear contrast to those of conventional WGM sensors that just detect VOCs nonpreferentially through adsorption onto the surface.
Introduction
Volatile organic compounds (VOCs) are organic chemicals that are emitted from natural and artificial products such as cleaning detergents, cosmetics, paints, adhesives, and cigarette smoke.1,2 Although the concentration of VOCs is strictly regulated to a low level by global consensuses and national laws, the residual amount of VOCs in the atmosphere causes health problems. For instance, toluene vapor is emitted from paints, adhesives, and printers with an average concentration of 31.5 μg m–3.3,4 Acetone is found in wallpaper and furniture polish, and its typical concentration in indoor air is around 60 μg m–3.5,6 These VOCs are known to cause headaches, nausea, and even more severe diseases like cancers.7−9
Among a series of electronic,10,11 colorimetric,12 and optical sensors13,14 that can detect physical and chemical stimuli, whispering-gallery mode (WGM) optical microresonators have attracted great interest owing to their remote sensing capability and excellent sensitivity.15−17 A WGM resonator entraps light via total internal reflection at its outermost surface. In a simple approximation, the wavelength of the WGM resonance peak is proportional to the optical path length and refractive index of the matrix.15 Thus, any physical or chemical stimuli that cause an expansion or contraction of the resonator as well as a change in the refractive index can be detected as the spectral shift of the resonance peaks. WGM resonator sensors reported so far detect VOCs through physical adsorption of the VOC molecules onto the surface of the resonator, which causes a slight change in the refractive index via an evanescent field.18−21 However, sensitive and selective detection of a particular VOC among others has not yet been achieved with WGM microresonators, plausibly because most of the VOCs feature analogous surface adhesion properties and thus cause nearly similar changes in the refractive index of the resonators at a given vapor concentration.
In this work, we develop a polymer WGM microresonator, into which analyte VOCs can permeate. Since the permeation efficiency is strongly related to the chemical affinity of the analyte to the host cavity matrix, the WGM resonator made of polystyrene (PS) can efficiently detect simple aromatic hydrocarbons such as benzene, toluene, and xylenes (BTXs). This research demonstrates its potential utility toward the selective sensing of harmful petroleum vapors.
Results and Discussion
For preparing a fluorescent microresonator (FM) in the present research, β-cyano-appended oligo(p-phenylenevinylene) (β-COPV) is used as a fluorescent dopant (Figure 1a).22 The electronic absorption spectrum of a CHCl3 solution of β-COPV shows two bands at 348 and 432 nm, which are attributed to π-π* and intramolecular charge-transfer transitions, respectively (Figure 1b). The CHCl3 solution of β-COPV exhibits green photoluminescence (PL) with a unimodal band at 517 nm and a PL quantum yield (ϕ) of 0.41 (Figure 1b,c, left). The crystalline β-COPV shows reddish-orange emission with a ϕ of 0.95 (Figure 1c, right). The emission efficiency of the crystal is enhanced in comparison with its solution state due to the suppression of nonradiative processes from its excited state, which is referred to as aggregation-induced enhanced emission.23
Figure 1.

(a) Molecular structure of β-COPV. (b) Absorption (black) and PL spectra (red) of the CHCl3 solution of β-COPV (λex = 355 nm). (c) Photographs of the CHCl3 solution and crystals of β-COPV under UV-light illumination at 365 nm. (d) Scanning electron microscopy (SEM) image of MSCOPV. (e) Optical and (f) fluorescence microscopic images of MSCOPV.
We choose PS as a matrix with moderate affinity toward common VOCs.24 As a typical synthetic procedure for the β-COPV-doped PS microspheres (hereafter abbreviated as MSCOPV),25 0.2 mL of the CHCl3 solution containing β-COPV (0.05 mg) and PS (1 mg) was poured into 2 mL of an aqueous solution of sodium dodecyl sulfate (SDS, 1.0 × 10⁻² M). The binary mixture was vigorously stirred with a homogenizer (20 krpm, 3 min), and the resultant suspension was allowed to stand at 25 °C for 2 days with its cap open for complete evaporation of CHCl3 (Figure S2). The incubated suspension was washed with H2O three times to remove the excess SDS to obtain MSCOPV with an average diameter of 4.2 μm (Figure S3). A scanning electron microscopy (SEM) image of the precipitate shows micrometer-scale spherical particles with a smooth surface morphology (Figure 1d). An FM image of MSCOPV displays green PL under photoillumination at 350–390 nm, indicating that β-COPV is molecularly dispersed in the PS matrix (Figures 1e,f and S4a,b). It should be noted that when the concentration of β-COPV is increased to 10 wt%, β-COPV tends to aggregate and undergoes phase separation 24 h after self-assembly (Figure S4b,c).
A microscopic PL (μ-PL) spectrum from a single MSCOPV with a diameter (d) of 4.9 μm, upon excitation with a focused pulsed laser in air (λex = 355 nm, pulse duration; 7 ns), features an intense emission band with a series of periodic sharp peaks (Figure 2a). As the excitation energy (P) increases, selected resonance peaks around 530 nm are amplified (Figure 2b). This feature is characteristic of laser oscillation, where the lasing threshold is 130.1 μJ cm–2. As displayed in Figure 2d–g, the free spectral range (FSR) of MSCOPV decreases from 21.4 to 10.4 nm with the increase in d from 2.6 to 6.3 μm. According to eq 1 for a WGM resonator,26
| 1 |
where n is the refractive index and FSR is inversely proportional to the d of the microcavity (Figure 2c). The Q factor of MSCOPV calculated based on the linewidth of the resonance peaks is 1080, which is sufficient for utilizing the lasing peaks for precise sensing of VOCs.
Figure 2.

(a) PL spectra of a single MSCOPV (d = 4.9 μm) upon excitation with a pulsed laser (λex = 355 nm, Δ = 7 ns) with increased P. (b) Plot of PL intensity of MSCOPV versus P, showing a lasing threshold at 130.1 μJ cm–2. (c) Plot of the FSR of MSCOPV versus d–1. The red line represents least-squares fitting. (d–g) Lasing spectra of a single MSCOPV with d of (d) 2.6, (e) 3.4, (f) 4.8, and (g) 6.3 μm. Red arrows indicate the FSR.
Hydrophobic organic polymers tend to take up VOCs in the atmosphere via a van der Waals interaction as an attractive driving force and expand to a certain extent.27,28 Although the expansion is too small to observe microscopically, the WGM peak shift due to the change in size is typically large enough to be detected by a spectrometer. The change in the peak wavelength of the WGM resonators (Δλ) is approximately expressed as eq 2
| 2 |
where r represents the radius of the cavity and Δr and Δn represent changes in the radius and refractive index, respectively.26 When MSCOPV are exposed to VOCs, PS is supposed to swell the organic vapor and expand, leading to a shift of the resonance wavelength.
We applied MeOH, EtOH, tetrahydrofuran (THF), acetone, methyl ethyl ketone (MEK), benzene, toluene, o-xylene, m-xylene, and p-xylene as analyte VOCs. PL spectra of a single MSCOPV upon exposure to VOCs are measured with an optical microscope and a homemade chamber with a volume of 96.25 cm3 (Figure 3a). A suspension of MSCOPV is drop-cast on a quartz substrate, and the substrate is then set upside down on the top face of the chamber that has a small window. A known amount of an organic solvent is injected from one hole with a micropipette, and the injected solvent is allowed to evaporate in the chamber. Before and after the exposure to VOCs, the chamber is purged with N2 gas that flows from the other hole for the complete drying of MSCOPV.
Figure 3.

(a) Experimental setup for VOC sensing. (b) PL spectra of a single MSCOPV before (black) and after (red) exposure to MeOH vapor, followed by removal of MeOH with N2 (blue). (c) Plot of Δλ versus exposure time to MeOH vapor. (d) PL spectra of a single MSCOPV upon exposure to toluene vapor (10 μL injection). (e) Plots of Δλ versus exposure time upon injection of 1, 2, 4, 6, 8, and 10 μL of toluene. (f) Plot of Δλ versus volume of the injected toluene.
By an injection of 10 μL of MeOH, WGM resonance peaks of a single MSCOPV (d = 4.1 μm) in the PL spectra show a red shift (Figures 3b and S5) and hit a plateau in 180 s with a Δλ of 0.88 nm (Figure 3c). Subsequently, N2 is purged into the chamber, which triggers a backward shift of the WGM peaks toward a shorter wavelength (Δλ = −0.88 nm), demonstrating the complete reversibility of the peak shift after 170 s of purging (Figure 3b,c).
Toluene vapor displays a much greater WGM peak shift. When 10 μL of toluene is injected into the chamber, the WGM peaks monotonically shift toward the longer wavelength with a peak shift as large as ∼16 nm at 800 s after the injection (Figure 3d). According to the peak shift upon injection with various amounts of toluene (Figure 3e and Table S1), the sensitivity of MSCOPV to toluene is evaluated as 1.49 nm μL–1 (Figure 3f).
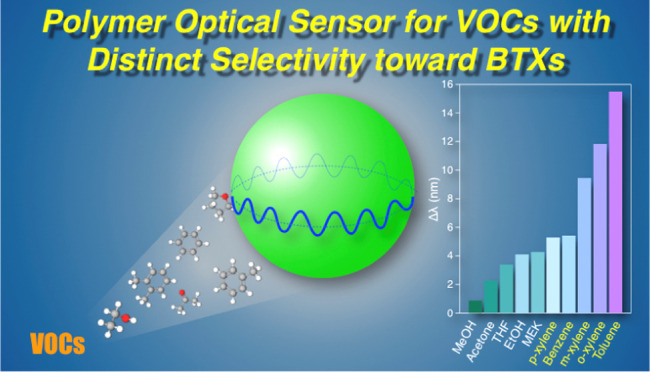
Then, the sensitivity toward other organic solvents (10 μL) is investigated using MSCOPV with d of ∼4 μm (Figure S6 and Table S2). The WGM peak shifts for MeOH, EtOH, acetone, THF, MEK, benzene, toluene, o-xylene, m-xylene, and p-xylene are summarized in Figure 4a. Experimental results such as Δλ and time required for the saturation as well as some physical parameters of the solvents utilized are summarized in Table 1. The change in the refractive index (Δn) and radius (ΔR) of a single MSCOPV upon exposure to the organic vapor is calculated and tabulated in Table 1 for reference (see the Supporting Information, SI for details of calculation). The longer saturation time (tsat) required for xylenes is attributed to their low saturated vapor pressure and associated slow evaporation rate. Even xylenes, which feature the largest tsat among the VOCs tested, show reversible peak shifts upon purging with N2, although the time taken for complete vapor removal is much longer (Figure S6). It is worth noting that Δλ and the saturation time are hardly dependent on the d of MSCOPV (Figure S7).
Figure 4.

(a) Bar chart of Δλ upon exposure to vapors of MeOH, acetone, THF, EtOH, MEK, p-xylene, benzene, m-xylene, o-xylene, and toluene. (b) Plot of Δλ versus Ra.
Table 1. Summary of WGM Peak Shift (Δλ), Time Required for the Saturation (tsat), Saturation Vapor Pressure of the Analyte (Psat), Ra, and Changes in the Refractive Index (Δn) and Radius (Δr) Evaluated Using Equations 2 and S1–S3.
| Δλ/nm | tsat/s | Psat/atm | Ra/(MPa)1/2 | Δn × 103 | Δr/μm | |
|---|---|---|---|---|---|---|
| MeOH | 0.97(8) | 180 | 0.167 | 22.2 | –3.1 | 8.1 |
| acetone | 2.1(2) | 462 | 0.302 | 9.4 | –5.8 | 18.6 |
| THF | 3.4(5) | 748 | 0.213 | 6.2 | –5.6 | 22.6 |
| EtOH | 3.9(1) | 700 | 0.077 | 17.9 | –10.1 | 29.3 |
| MEK | 5.4(6) | 528 | 0.124 | 7.1 | –9.0 | 31.3 |
| p-xylene | 5.3(3) | 4320 | 0.012 | 4.1 | –3.6 | 32.6 |
| benzene | 5.6(5) | 593 | 0.125 | 4.6 | –3.2 | 25.1 |
| m-xylene | 8.8(6) | 4200 | 0.011 | 4.1 | –6.1 | 55.5 |
| o-xylene | 10.7(10) | 2280 | 0.011 | 3.8 | –6.8 | 70.4 |
| toluene | 16.4(10) | 814 | 0.037 | 3.4 | –9.7 | 76.2 |
All of the VOCs tested herein show detectable WGM peak shifts, demonstrating the utility of MSCOPV as a versatile VOC sensor. The values of the peak shifts are in the order of MeOH < acetone < THF < EtOH < MEK < p-xylene < benzene < m-xylene < o-xylene < toluene. The trend in peak shifts can be reasonably understood based on Hansen solubility parameters (HSPs), which are the empirical values of hydrogen-bonding cohesion force, dipole cohesion force, and dispersion cohesion force.29 Hansen solubility parameters have been conventionally utilized for the prediction of the solubility or affinity of two given substances based on the geometric distance between the compounds in the Hansen space (Ra); that is, when the HSP of a given VOC is close to that of PS, the VOC is prone to be adsorbed onto PS to a large extent.
Figure 4b shows a plot of Δλ against Ra of the tested VOC, exhibiting an inverse proportional correlation. Benzene, toluene, and xylenes display high sensitivity among other VOCs, which is plausibly because of their high affinity to PS and high refractive index. It is noteworthy that the sensitivity of toluene is higher than those of benzene and xylenes. The high affinity of MSCOPV toward toluene is possibly due to the structural analogy with PS. For comparison, the sensitivity of MSCOPV toward H2O vapor is almost negligible, displaying negligible WGM spectral shift even by immersing MSCOPV in water, possibly because of the hydrophobic nature of PS (Figure S8).
The high affinity of MSCOPV toward toluene enables its preferential detection in a mixture of VOCs. We inject three kinds of solvents (MeOH, acetone, and toluene) in a sequence with a certain interval to ensure the swelling equilibrium and observe the time-course change in the PL from a single MSCOPV (d = 5.6 μm). As shown in Figure 5a, the WGM peak exhibits a stepwise spectral change with peak shifts of 0.9, 1.0, and 6.1 nm upon the injection of MeOH, acetone, and toluene, respectively, in this order. An analogous experiment is conducted with an injection order of toluene, MeOH, and acetone. A remarkable spectral shift is observed after the injection of toluene (Δλ = 12.6 nm), while no obvious peak shift is observed by further injections of MeOH and acetone. These results indicate the preferential absorption of toluene into the PS matrix by replacing the other VOCs that are adsorbed prior to toluene, which is highly desirable for the selective detection of toluene in practical conditions.
Figure 5.

Plots of the WGM peak wavelength upon sequential exposure to organic vapors (a) in the order of MeOH, acetone, and toluene and (b) in the order of toluene, MeOH, and acetone.
Conclusions
In summary, we demonstrate a WGM microresonator sensor based on β-COPV-doped polystyrene microspheres for VOC sensing. The spectral shift of the WGM resonance peaks upon absorption of VOC vapor can be utilized for the detection of common organic vapors of alcohols, ketones, furane, and especially with high sensitivity for aromatic hydrocarbons such as BTXs. The sensitivity for VOCs is strongly correlated with Hansen solubility parameters for PS. The significant sensitivity toward toluene enables its preferential detection even in a mixture of organic vapors. Simple, highly sensitive, and selective detection of VOCs is valuable as health-care sensors.
Acknowledgments
This work was supported by JST CREST (JPMJCR20T4) and ACT-X (JPMJAX201J) from the Japan Science and Technology Agency (JST), Grant-in-Aid for Scientific Research on Innovative Areas “π-System Figuration” (JP17H05142 and JP17H05171) and “Soft Crystal” (JP20H04684), and Scientific Research (A) (JP16H02081) from the Japan Society for the Promotion of Science (JSPS) and Ogasawara Foundation.
Supporting Information Available
The Supporting Information is available free of charge at https://pubs.acs.org/doi/10.1021/acsomega.1c02749.
Synthesis details, characterization, and measurement data (PDF)
Author Present Address
⊥ Research Center for Molecular Design, Kochi University of Technology, Kami, Kochi, 782-8502, Japan
Author Contributions
A.Q., H.Y., and Y.Y. designed experiments and analyzed the data, S.H. conducted the organic synthesis, A.Q. conducted the self-assembly and characterization, and A.Q., H.Y., and Y.Y. prepared the manuscript with feedback from S.H.
The authors declare no competing financial interest.
Supplementary Material
References
- Kim Y. M.; Harrad S.; Harrison R. M. Concentrations and Sources of VOCs in Urban Domestic and Public Microenvironments. Environ. Sci. Technol. 2001, 35, 997–1004. 10.1021/es000192y. [DOI] [PubMed] [Google Scholar]
- Rösch C.; Kohajda T.; Röder S.; von Bergen M.; Schlink U. Relationship between Sources and Patterns of VOCs in Indoor Air. Atmos. Pollut. Res. 2014, 5, 129–137. 10.5094/APR.2014.016. [DOI] [Google Scholar]
- Cruz S. L.; Rivera-García M. T.; Woodward J. J. Review of Toluene Action: Clinical Evidence, Animal Studies and Molecular Targets. J. Drug Alcohol Res. 2014, 3, 235840 10.4303/jdar/235840. [DOI] [PMC free article] [PubMed] [Google Scholar]
- Plaisance H.; Mocho P.; Desauziers V. Comparative Analysis of Formaldehyde and Toluene Sorption on Indoor Floorings and Consequence on Indoor Air Quality. Indoor Air 2020, 30, 1256–1267. 10.1111/ina.12704. [DOI] [PubMed] [Google Scholar]
- Liu Q.; Liu Y.; Zhang M. Personal Exposure and Source Characteristics of Carbonyl Compounds and BTEXs within Homes in Beijing, China. Build. Environ. 2013, 61, 210–216. 10.1016/j.buildenv.2012.12.014. [DOI] [Google Scholar]
- Diodiu R.; Galaon T.; Bucur E.; Stefan D. S.; Pascu L. F. Aldehydes, Acetone, Formic and Acetic Acids in Indoor Air of an Office Building. Rev. Chim. 2016, 67, 2396–2399. [Google Scholar]
- Inamdar A. A.; Morath S.; Bennett J. W. Fungal Volatile Organic Compounds: More Than Just a Funky Smell?. Annu. Rev. Microbiol. 2020, 74, 101–116. 10.1146/annurev-micro-012420-080428. [DOI] [PubMed] [Google Scholar]
- Wickliffe J. K.; Stock T. H.; Howard J. L.; Frahm E.; Simon-Friedt B. R.; Montgomery K.; Wilson M. J.; Lichtveld M. Y.; Harville E. Increased Long-Term Health Risks Attributable to Select Volatile Organic Compounds in Residential Indoor Air in Southeast Louisiana. Sci. Rep. 2020, 10, 21649 10.1038/s41598-020-78756-7. [DOI] [PMC free article] [PubMed] [Google Scholar]
- Lin N.; Rosemberg M. A.; Li W.; Meza-Wilson E.; Godwin C.; Batterman S. Occupational Exposure and Health Risks of Volatile Organic Compounds of Hotel Housekeepers: Field Measurements of Exposure and Health Risks. Indoor Air 2021, 31, 26–39. 10.1111/ina.12709. [DOI] [PMC free article] [PubMed] [Google Scholar]
- Wang J.; Zhou Q.; Peng S.; Xu L.; Zeng W. Volatile Organic Compounds Gas Sensors Based on Molybdenum Oxides: A Mini Review. Front. Chem. 2020, 8, 339 10.3389/fchem.2020.00339. [DOI] [PMC free article] [PubMed] [Google Scholar]
- Liu B.; Wu X.; Kam K. W. L.; Cheung W.; Zheng B. Cuprous Oxide Based Chemiresistive Electronic Nose for Discrimination of Volatile Organic Compounds. ACS Sens. 2019, 4, 3051–3055. 10.1021/acssensors.9b01697. [DOI] [PubMed] [Google Scholar]
- Johnson B. J.; Malanoski A. P.; Erickson J. S. Development of a Colorimetric Sensor for Autonomous, Networked, Real-Time Application. Sensors 2020, 20, 1–21. 10.3390/s20205857. [DOI] [PMC free article] [PubMed] [Google Scholar]
- Khan S.; Le Calvé S.; Newport D. A Review of Optical Interferometry Techniques for VOC Detection. Sens. Actuators, A 2020, 302, 111782 10.1016/j.sna.2019.111782. [DOI] [Google Scholar]
- Yeom S. H.; Kang B. H.; Seo C. T.; Lee D. I.; Shin H. J.; Lim S. C.; An M. C.; Lee S. W.; Lee J. S.; Kim S. H.; Kang S. W. VOCs Detection Based on Evanescent Wave Coupling of Dye-Coated Optical Fiber. IEEE Sens. J. 2015, 15, 3021–3025. 10.1109/JSEN.2014.2385894. [DOI] [Google Scholar]
- Qiagedeer A.; Yamagishi H.; Sakamoto M.; Hasebe H.; Ishiwari F.; Fukushima T.; Yamamoto Y. A Highly Sensitive Humidity Sensor Based on an Aggregation-Induced Emission Luminogen-Appended Hygroscopic Polymer Microresonator. Mater. Chem. Front. 2021, 5, 799–803. 10.1039/D0QM00722F. [DOI] [Google Scholar]
- Gao M.; Wei C.; Lin X.; Liu Y.; Hu F.; Zhao Y. S. Controlled Assembly of Organic Whispering-Gallery-Mode Microlasers as Highly Sensitive Chemical Vapor Sensors. Chem. Commun. 2017, 53, 3102–3105. 10.1039/C6CC08094D. [DOI] [PubMed] [Google Scholar]
- Xu X.; Chen W.; Zhao G.; Li Y.; Lu C.; Yang L. Wireless Whispering-Gallery-Mode Sensor for Thermal Sensing and Aerial Mapping. Light: Sci. Appl. 2018, 7, 62 10.1038/s41377-018-0063-4. [DOI] [PMC free article] [PubMed] [Google Scholar]
- Ta V. D.; Chen R.; Nguyen D. M.; Sun H. D. Application of Self-assembled Hemispherical Microlasers as Gas Sensors. Appl. Phys. Lett. 2013, 102, 031107 10.1063/1.4788751. [DOI] [Google Scholar]
- Wang H.; Yuan L.; Kim C. W.; Han Q.; Wei T.; Lan X.; Xiao H. Optical Microresonator Based on Hollow Sphere with Porous Wall for Chemical Sensing. Opt. Lett. 2012, 37, 94–96. 10.1364/OL.37.000094. [DOI] [PubMed] [Google Scholar]
- Mallik A. K.; Farrell G.; Liu D.; Kavungal V.; Wu Q.; Semenova Y. Detection of Ammonia Gas Concentration in Air. Sci. Rep. 2018, 8, 1620 10.1038/s41598-018-20025-9. [DOI] [PMC free article] [PubMed] [Google Scholar]
- Zhu N.; Shi B.; Guo Y.; Han B.; Zhang Y. Polydimethylsiloxane Self-assembled Whispering Gallery Mode Microbottle Resonator for Ethanol Sensing. Opt. Mater. 2020, 107, 110024 10.1016/j.optmat.2020.110024. [DOI] [Google Scholar]
- Hayashi S.Facile Investigation of Reversible Nanostructure Changes in Flexible Crystals; Research Square, 2020. [Google Scholar]
- Gierschner J.; Park S. Y. Luminescent Distyrylbenzenes: Tailoring Molecular Structure and Crystalline Morphology. J. Mater. Chem. C. 2013, 1, 5818–5832. 10.1039/c3tc31062k. [DOI] [Google Scholar]
- Okada D.; Nakamura T.; Braam D.; Dao T. D.; Ishii S.; Nagao T.; Lorke A.; Nabeshima T.; Yamamoto Y. Color-Tunable Resonant Photoluminescence and Cavity-Mediated Multistep Energy Transfer Cascade. ACS Nano 2016, 7, 7058–7063. 10.1021/acsnano.6b03188. [DOI] [PubMed] [Google Scholar]
- Kushida S.; Okada D.; Sasaki F.; Lin Z. -H.; Huang J. -S.; Yamamoto Y. Low-Threshold Whispering Gallery Mode Lasing from Self-Assembled Microspheres of Single-Sort Conjugated Polymers. Adv. Opt. Mater. 2017, 5, 1700123 10.1002/adom.201700123. [DOI] [Google Scholar]
- Cai L.; Pan J.; Zhao Y.; Wang J.; Xiao S. Whispering Gallery Mode Optical Microresonators: Structures and Sensing Applications. Phys. Status Solidi A 2020, 217, 1900825 10.1002/pssa.201900825. [DOI] [Google Scholar]
- George S. C.; Thomas S. Transport Phenomena through Polymeric Systems. Prog. Polym. Sci. 2001, 26, 985–1017. 10.1016/S0079-6700(00)00036-8. [DOI] [Google Scholar]
- Ali A. R.; Elias C. M. Ultra-Sensitive Optical Resonator for Organic Solvents Detection Based on Whispering Gallery Modes. Chemosensors 2017, 5, 19 10.3390/chemosensors5020019. [DOI] [Google Scholar]
- Hansen C. M.Hansen Solubility Parameters: A User’s Handbook; CRC Press, 2007. [Google Scholar]
Associated Data
This section collects any data citations, data availability statements, or supplementary materials included in this article.