Abstract
Recently, dual frequency transducers have enabled high-spatial resolution and high-contrast imaging of vasculature with minimal tissue artifacts by transmitting at a low frequency and receiving broadband superharmonic echoes scattered by microbubble contrast agents. In this work, we examine the imaging parameters for optimizing contrast-to-tissue ratio for dual-frequency imaging and the relationship with spatial resolution. Confocal piston transducers are used in a water bath setup to measure the signal-to-noise ratio (SNR), contrast-to-tissue ratio (CTR), and axial resolution for ultrasound imaging of non-linear scattering of microbubble contrast agents when transmitting at a lower frequency (1.5 – 8 MHz) and receiving at a higher frequency (7.5 – 25 MHz). Parameters varied include the frequency and peak negative pressure of transmitted waves, center frequency of the receiving transducer, microbubble concentration, and microbubble size. CTR is maximized at the lowest transmission frequencies but would be acceptable for imaging in the 1.5–3.5 MHz range. At these frequencies, CTR is optimized when a receiving transducer with a center frequency of 10 is used, with the maximum CTR of 25.5 dB occurring when transmitting at 1.5 MHz with a peak negative pressure of 1600 kPa and receiving with a center frequency of 10 MHz. Axial resolution is influenced more heavily by receiving center frequency, with a weak decrease in measured pulse lengths associated with increasing transmit frequency. A microbubble population containing predominately 4 μm-diameter bubbles yielded the greatest CTR, followed by 1 and then 2 μm bubbles. Varying concentration showed little effect over the tested parameters. CTR dependence on transmit frequency and peak pressure were confirmed through in vivo imaging in two rodents. These findings may lead to improved imaging of vascular remodeling in superficial or luminal cancers such as those of the breast, prostate, and colon.
Keywords: contrast imaging, dual frequency, broadband harmonic, superharmonic
I. Introduction
Ultrasound contrast agents (UCAs) are gas bubbles having a diameter of 1–10 μm which oscillate when excited by acoustic waves at ultrasonic frequencies. While the first ultrasound contrast agents were unshelled air bubbles [1, 2], modern contrast agents consist of a heavy gas with a stabilizing shell [3, 4]. The most commonly used agents clinically have phospholipid shells [3], though some agents have a polymeric shell, which provides increased stability relative to lipid-shelled agents at the cost of decreased echogenicity and more difficult bubble synthesis, or a protein shell (i.e. albumin), which is typically more rigid than a lipid shell and produces strong echoes over time as the shell destabilizes [5], [6]. At the present time, only Definity (phospholipid shell) and Optison (albumin shell) are FDA-approved for use in the United States.
It was later discovered that these microbubble contrast agents produced a highly non-linear response—in contrast to the predominantly linear response of human soft tissue to ultrasound [7, 8]. That is, the degree to which a microbubble expands when subjected to a negative half-cycle pressure waveform is not equal to the degree of contraction when subjected to a positive half-cycle pressure waveform, causing the bubble to produce signals at harmonics of the excitation frequency. Researchers subsequently demonstrated that second harmonic [9, 10] or subharmonic echoes [11, 12] could be received within the bandwidth of the ultrasound transducer to form images of contrast agent-scattered signals alone. This separation of microbubble and tissue echoes within the bandwidth of a single transducer was maximized by signal processing techniques which generally transmitted ultrasound waves with varying amplitudes and phases and performed weighted sums of received echoes in order to isolate the contrast agent response from the tissue response at the expense of frame rate [13–17]. These pulse sequences typically assume that the UCA response is a weighted sum of harmonics of the insonation frequency, then select one or more harmonic to isolate using echoes within the bandwidth of a single transducer. Such contrast-specific imaging algorithms are currently available on clinical ultrasound systems.
In addition to the non-linear signals produced by UCAs, tissue itself also produces non-linear echoes via nonlinear propagation rather than non-linear scattering. Generation of non-linear energy accumulates over propagation distance in media such as tissue or water and increases with transmit pressure [18]. Tissue harmonic imaging is widely used clinically and is preferred to fundamental imaging in many patients due to higher contrast resulting from reduced side and grating lobes, improved lateral and axial resolution, and reduced clutter [19–24]. While dependent on tissue type, propagation distance, frequency, and transmitted pressure, [25, 26], at distances and pressures relevant for diagnostic ultrasound imaging, tissue harmonic energy has been shown to be confined largely to the first few harmonics [27].
The resonance frequency of a single microbubble depends directly on bubble diameter but is also influenced by its shell [28–31]. Resonance frequency has also been shown to shift due to the external environment (typically blood), proximity to a vessel wall, or influence of multiple bubbles in close proximity to one another [32–36]. Commercial contrast agents typically have a distribution of sizes—i.e. they are polydisperse—which produces a range of resonant frequencies from 2–10 MHz, within the typical frequency range for diagnostic ultrasound [36–38].
Bouakaz et al. first demonstrated the feasibility of forming images of broadband harmonic echoes, transmitting at 0.8 MHz and receiving with a center frequency of 2.8 MHz [39]. Kruse and Ferrara extended this to higher frequencies, demonstrating high resolution images formed using harmonic signals received at several times the insonifying frequency [40]. This effect is illustrated in Fig. 1, in which we display unfiltered spectra acquired from insonifying a polydisperse microbubble population with a single cycle, 4 MHz pulse and receiving echoes at 20 MHz (59% bandwidth) using two confocal piston transducers. As peak negative pressure increases, broadband signal content in the amplitude spectrum above 12 MHz increases by a factor of two between 500 and 1000 kPa.
Figure 1.
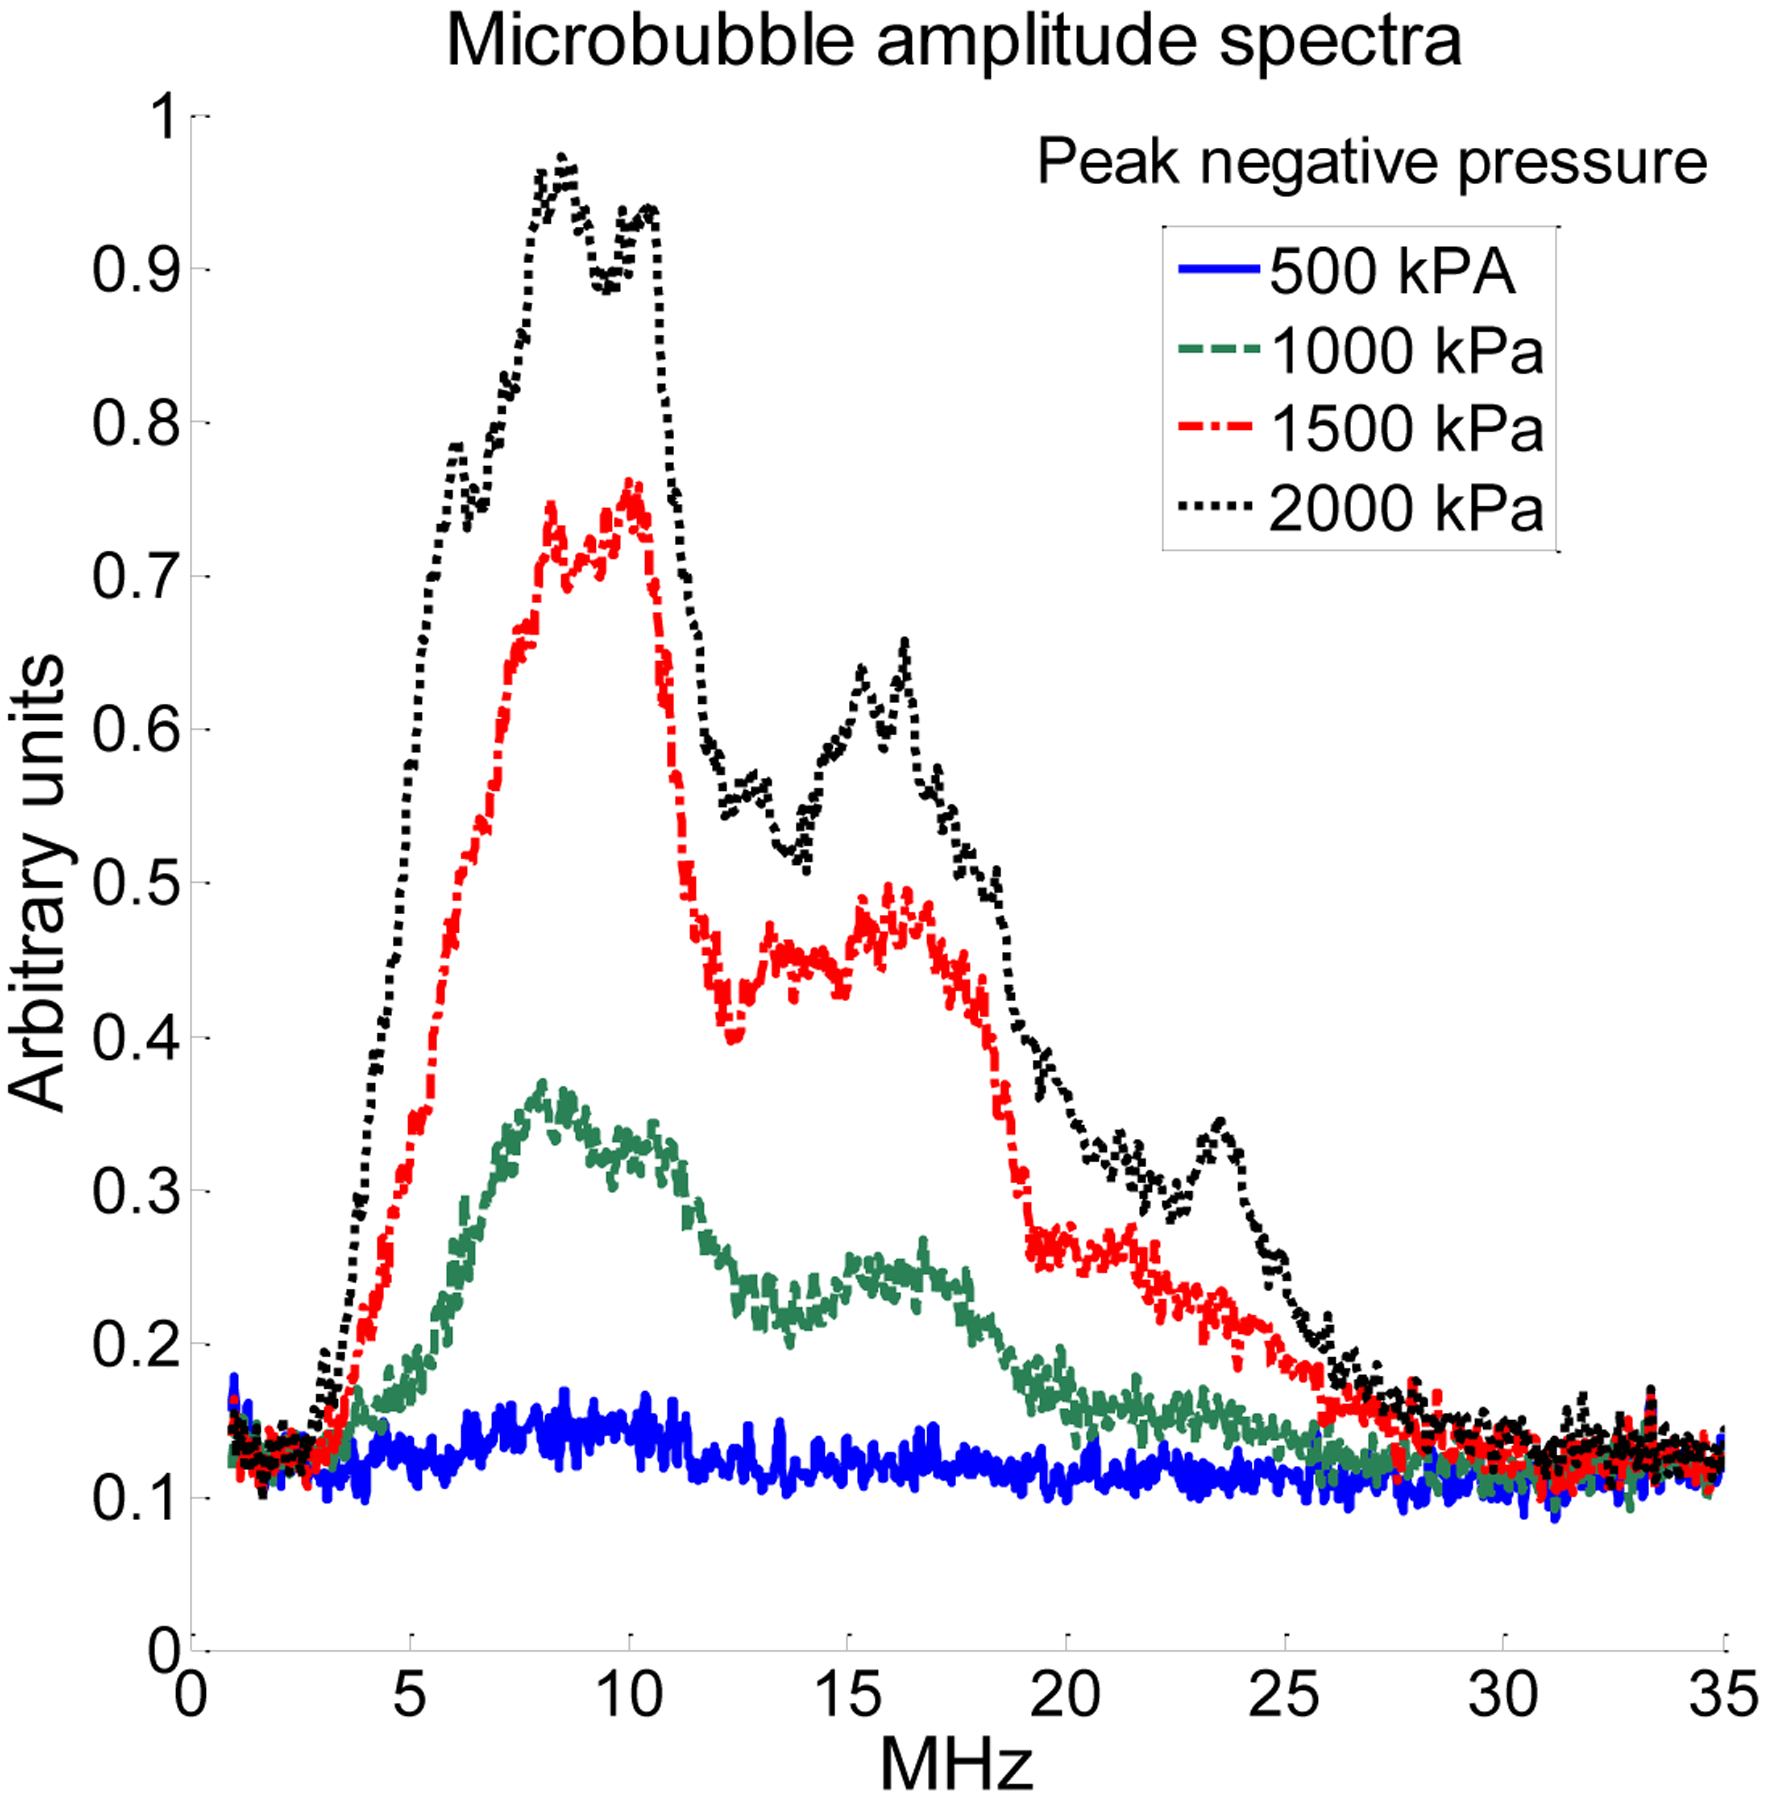
Unfiltered microbubble amplitude spectra when transmitting a single-cycle pulse at 4 MHz and receiving with a center frequency of 20 MHz (59% bandwidth) with separate, confocal piston transducers indicated the presence of a broadband signal content from the first few harmonics (5–12 MHz, upwardly biased by the bandwidth of the receiving transducer), as well as broadband signal content at higher harmonics (15–25 MHz).
More recently, Gessner et al. have demonstrated the application of such an approach to imaging by utilizing a mechanically-scanned transducer with a low frequency element to excite bubbles close to their resonance frequencies and a separate high frequency element to receive only the higher harmonics of the non-linear microbubble response [41]. In this and subsequent studies, this group has demonstrated that this dual frequency approach can be used to produce images of vasculature having both high resolution and high contrast due to the high receive frequencies and the low tissue response relative to contrast agents at these frequencies [41, 42] [43]. Images obtained with this method illustrate microvascular structure with such clarity (Figure 2) that it resembles x-ray angiography, and thus we refer to this technique as “acoustic angiography”. It is worth noting that this imaging technique is real time (per frame) and not a persistence based contrast imaging method.
Figure 2.
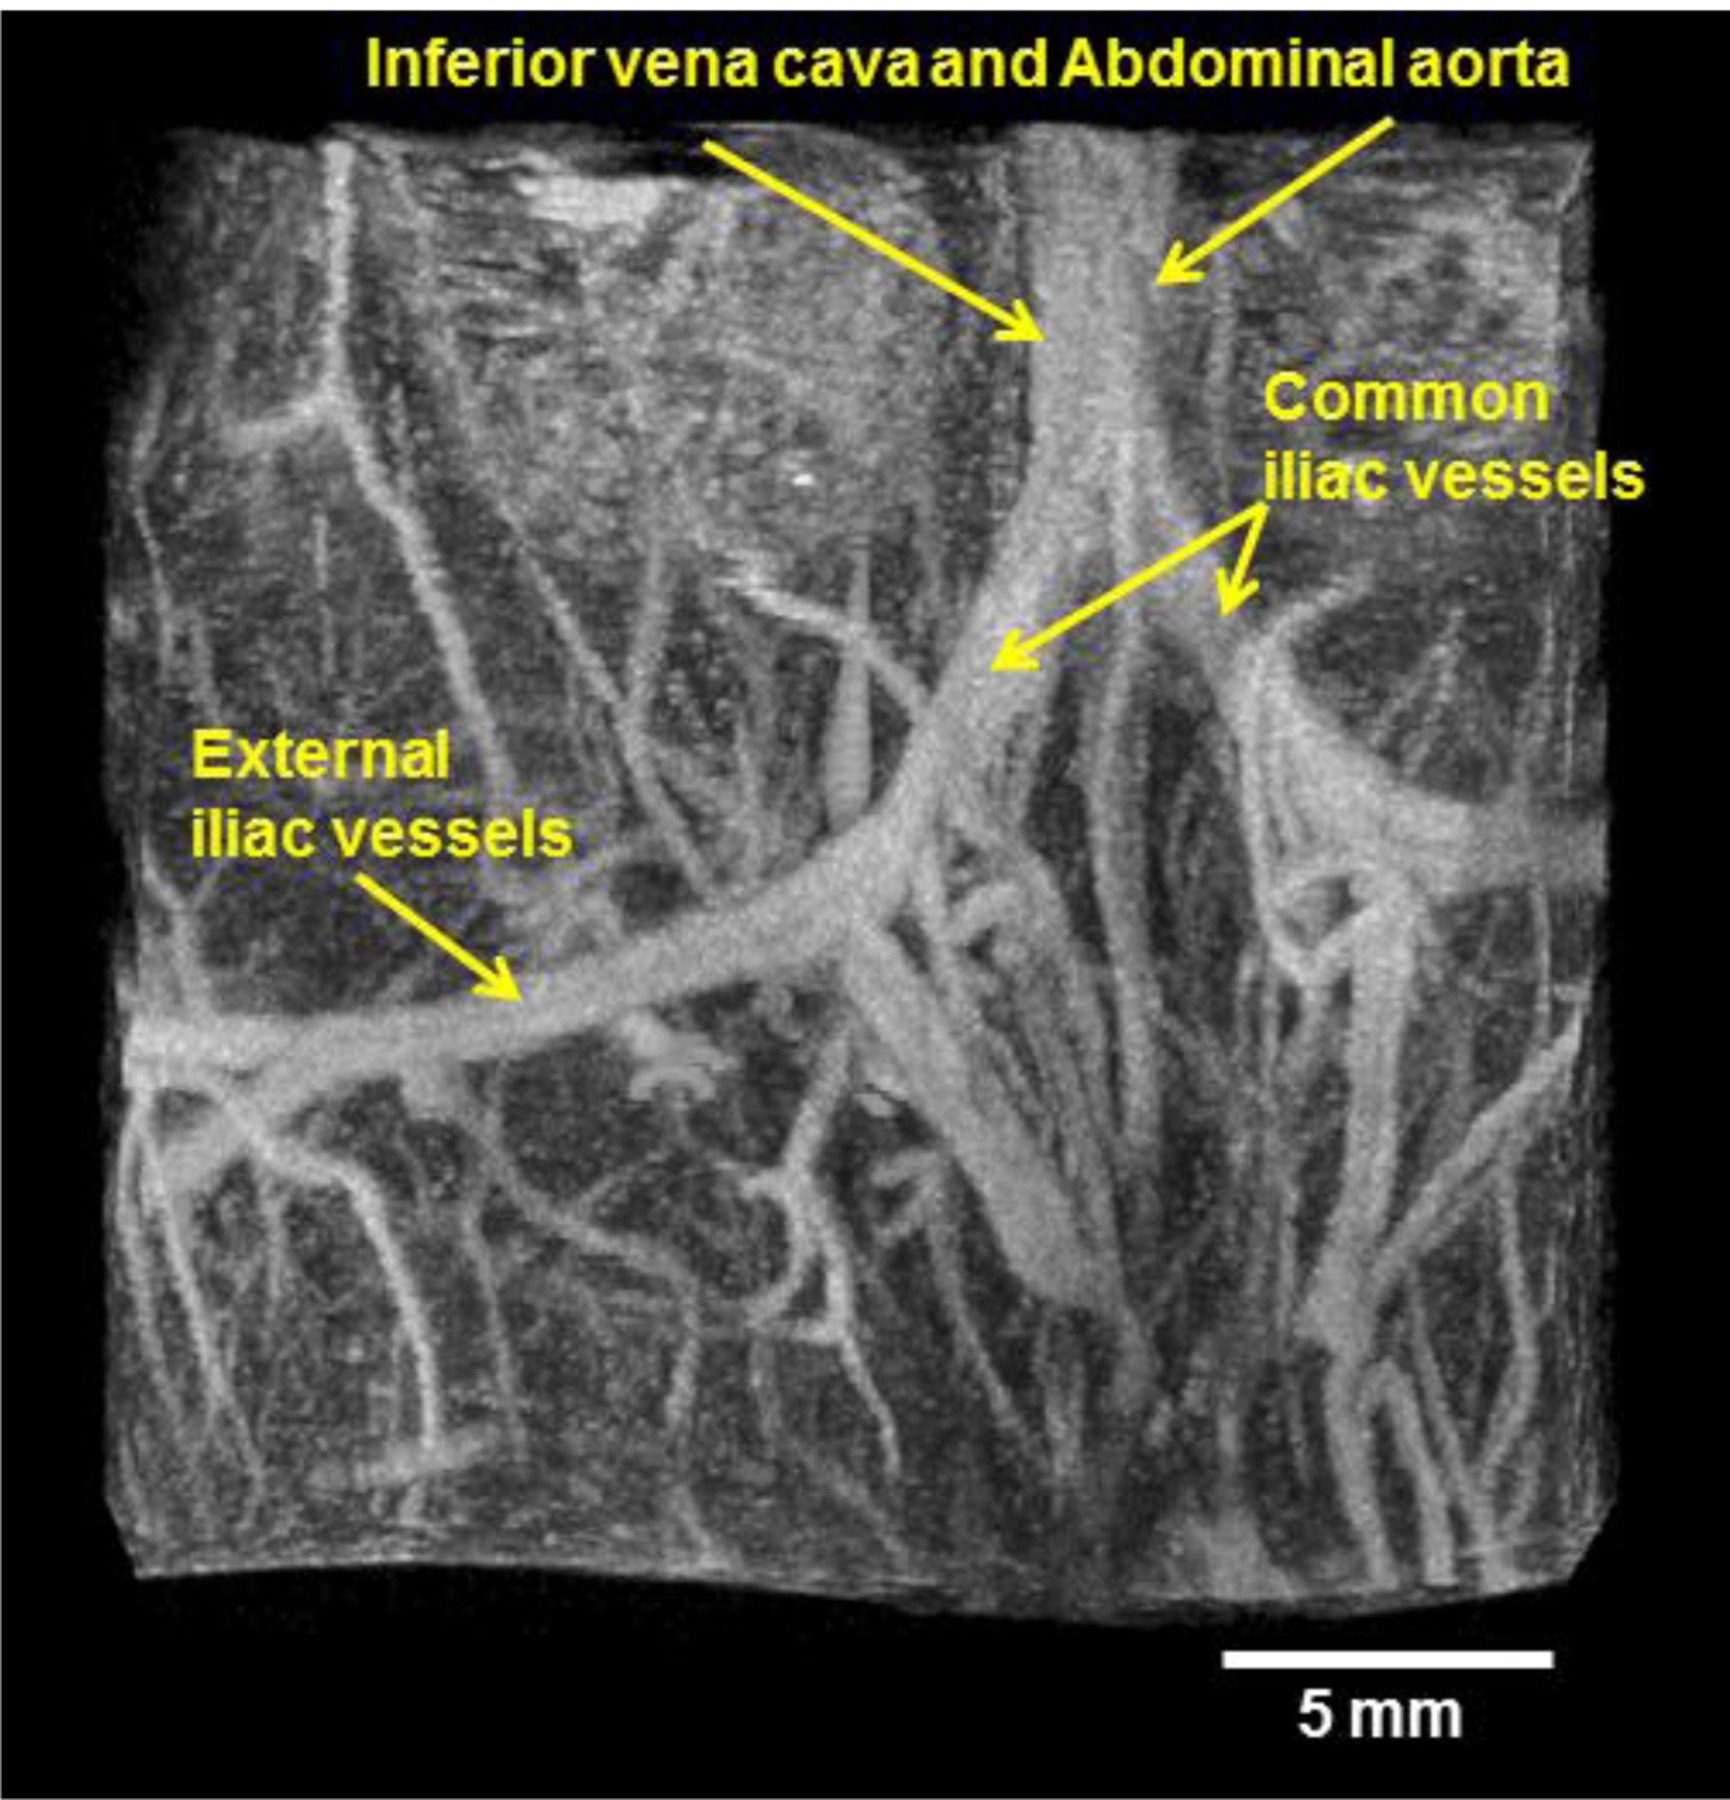
Representative acoustic angiography image formed using a mechanically-steered dual frequency transducer transmitting at 4 MHz and receiving with a center frequency of 30 MHz in abdominal imaging of a 3-month-old C3(1)/Tag mouse. The image shows the bifurcation of the inferior vena cava and abdominal aorta into two iliac vessels, which further bifurcates into internal and external iliac vessels.
Several previous studies have investigated the scattering properties of microbubble contrast agents with respect to pressure and frequency [44–47], though none have optimized parameters for dual-frequency imaging or made a direct comparison with tissue scattering measurements. For pressures under 150 kPa, Chen et al. reported that Definity exhibits peak attenuation at approximately 1.5 MHz and that harmonic content is dependent on driving pressure [48]. Sboros et al. investigated Definity and Quantison (albumin-shelled) at 3 MHz over pressures from 270 to 1520 kPa and compared the results to existing bubble models, finding a linear increase in scattering cross section with increasing frequency in both agents [45]. In investigating the non-linear response of single Definity bubbles at four peak negative pressures using optical techniques, Hsu et al. found that harmonic signal content initially increases with peak negative pressure but falls off between 200 and 700 kPa [46].
Other studies have investigated resonance frequencies of commercial contrast agents, which are expected to be the same frequencies with greatest harmonic content [49]. Tang and Eckersley measured the acoustic response of SonoVue (phospholipid shell) to transmit frequencies in the 1–5 MHz range and pressures from 1 kPa to 100 kPa, reporting attenuation peaks at 1.5 MHz in these bubbles and a linear relationship between pressure and scattering at low pressures [47, 50]. Studies by Goertz et al. characterizing unmodified Definity at single frequencies from 2 to 50 MHz at 25 kPa indicate that peak attenuation occurs at 10 MHz and remains significant until 50 MHz. The same group also examined the effect of bubble size on non-linear microbubble scattering, demonstrating increased relative harmonic and ultraharmonic signal content resulted when larger microbubbles were excluded [31]. The feasibility of nonlinear imaging with Definity when transmitting at high frequencies up to 30 MHz was also demonstrated [51].
The goal of the present study is to determine optimal imaging parameters for future applications of this acoustic angiography technique. Bubble destruction and cavitation is one important consideration in microbubble-based diagnostic imaging. Mechanical index (MI), expressed as peak negative pressure (PNP) in MPa divided by the square root of the transmitted frequency (in MHz), is a quantity which is related to the likelihood of causing cavitation in vivo in a bubble of resonant diameter. Bouakaz et al. have previously found that higher mechanical index-pulses increase tissue distortion in dual-frequency ultrasound imaging [52]. The FDA limits mechanical index to 1.9, and the package insert on Definity, an FDA approved contrast agent in the United States, indicates the use of mechanical indices with Definity contrast imaging in patients to a value of 0.8. Previous dual-frequency imaging studies performed in our lab used maximum MIs of 0.62 (PNP: 1230 kPa)[42, 43] and 0.65 (PNP: 1030 kPa) [41], and the highest MI evaluated in the present work is 1.63. Thus, we believe that dual-frequency imaging can be utilized within parameter ranges which are safe for use in humans [53]. It should also be noted that while microbubble destruction reduces frame-to-frame persistence, in this study we are interested in optimizing imaging parameters at the focus within a single imaging frame. Because the goal of this work is to determine optimum imaging parameters for high resolution imaging, single cycle-pulses are used as in imaging studies.
In this work, we have characterized the response of polydisperse, lipid-shelled microbubbles (similar to Definity) to transmitted ultrasound pulses of varying frequencies and peak rarefactional pressures. We have also subjected tissue (animal muscle) to the same settings and compared the responses in order to optimize the contrast-to-tissue ratio (CTR) as a function of transmitted pressure, transmitted frequency, receiving frequency, microbubble concentration, and mean microbubble diameter. Finally, we analyze the effects of these parameters on sensitivity and spatial resolution and discuss the effects of measured sensitivity and resolution on in vivo imaging using a dual frequency approach.
II. Methods
A. Experimental setup for acoustic measurements
In the experiments presented in this work, two focused annular transmitting transducers (Olympus Panametrics, Waltham, MA) were used: one with a center frequency of 2.25 MHz (71% bandwidth) and a focus at 2 cm, and one with a center frequency of 5 MHz (90% bandwidth) and a focus at 1.5 cm. At the start of each experiment, a calibrated needle hydrophone (ONDA HNA-0400, Sunnyvale, CA) mounted on a three-axis computer-controlled motion stage (Newport XPS, Irvine, CA) in a degassed water bath was used to locate the spatial focus of the transducer and determine the voltages necessary for desired peak negative pressures (100–2000 kPa) at each transmission frequency (1.5–8 MHz). Parameters varied are described in Table 1. At each transmit frequency, measured pressures were interpolated via piecewise cubic spline interpolation to determine the input voltage required to produce peak negative pressures in 100 kPa increments from 100 kPa to 2 MPa (Matlab, The Mathworks, Natick, MA). Pulses having the characteristics described in Table 1 were transmitted using an arbitrary waveform generator (Tektronix AWG2021, Beaverton, OR) connected to a 55 dB radiofrequency (RF) power amplifier (ENI 3200L, Rochester, NY). Single cycle pulses were used in both calibration and data acquisition, which is consistent with previous imaging studies. Thus while increasing frequency decreases pulse length and modulates absolute bandwidth, use of single-cycle pulses ensures maximum resolution. For each frequency/pressure combination, 10 lines were saved via custom acquisition program (LabView, National Instruments, Austin, TX).
Table 1.
Parameters tested in described experiments
| Transmit peak negative pressure (PNP) | 100–2000 kPa in 100 kPa increments |
| Transmit frequency | 1.5–8.0 MHz in 0.25 MHz increments |
| Receiving transducer center frequency | 7.5 MHz, 10 MHz, 15 MHz, 20 MHz, 25 MHz |
| Receiving transducer fractional bandwidths for above center frequencies | 64%, 68%, 45%, 59%, 63% |
| Microbubble distribution peak diameters | 0.8 μm, 1.7 μm, 4.4 μm |
With the hydrophone still in place, a second “receiving” transducer was positioned in the opening of the larger transmitting transducer with its focus aligned to the hydrophone. Because no single transducer possesses sufficient bandwidth to acquire signals over the entire frequency range of interest, five different receiving transducers were used in succession in order to record broadband superharmonic echoes at varying frequencies. These transducers are described in Table 1 (Parts V320, V311, V319, V317, V324, Olympus Panametrics, Waltham, MA). As this study is interested in higher harmonics rather than subharmonics, the 7.5 MHz receiving transducer was only used with the 2.25 MHz transmitting transducer. The transmitting and receiving transducers were coaxial and shared a common focus.
After calibration and alignment were completed, a 200 μm-diameter cellulose tube (Spectrum Laboratories, Inc., Rancho Dominguez, CA) was positioned immediately in front of the hydrophone using a micromanipulator (Edmund Industrial Optics, Barrington, NJ), then slowly advanced to replace the hydrophone at the dual focus as the hydrophone was removed. The tube was positioned at an angle of approximately 45° relative to the receiving transducer to minimize specular reflections from the tube. For each combination of transmitting and receiving transducers, water without microbubbles was first flowed through the tube to measure noise level.
B. Contrast agent preparation
Microbubbles were formed from lipid solutions as previously described [54] using a 9:1 molar ratio of 1,2-distearoyl-sn-glycero-3-phosphocholine (DSPC-Powder, Avanti Polar Lipids, Alabaster, AL) and polyoxyethylene 40-stearate (PEG40S, Sigma, St. Louis, MO) in a 90 mL solution of phosphate-buffered saline (Fisher Scientific, Pittsburg, PA). Using a sonic dismembrator (Model 500, Fisher Scientific, Hampton, NH) for 15 seconds at 70% power in the presence of decafluorobutane (Fluoromed L.P, Round Rock, TX), microbubbles were generated via acoustic emulsification by mechanical agitation via tip sonication, sorted via centrifugation [55], and sized via optical scattering (Accusizer 780A, PSS-NICOMP, Port Richey, FL). Populations of microbubbles with peak diameters occurring at approximately 1 μm, 2 μm, and 4 μm were formed (Fig. 3). For 1 μm bubbles, dilutions of 1.0% (8.4 × 10⁷ bubbles/mL), 0.5% (4.2 × 10⁷ bubbles/mL), 0.1% (8.4 × 10⁶ bubbles/mL), and 0.025% (2.1 × 10⁶ bubbles/mL) were prepared. This range of dilutions was selected because a 1% dilution was previous used in dual-frequency animal imaging studies [41, 42] and 0.025% is similar to the in vivo concentration for a bolus injection of Definity in a 175 lb. human having 3 L of blood plasma (5 L of whole blood):
| (1) |
Based on the results of initial experiments (Section III C), experiments with 2 and 4 μm bubbles were performed using only the 0.1% dilution.
Figure 3.
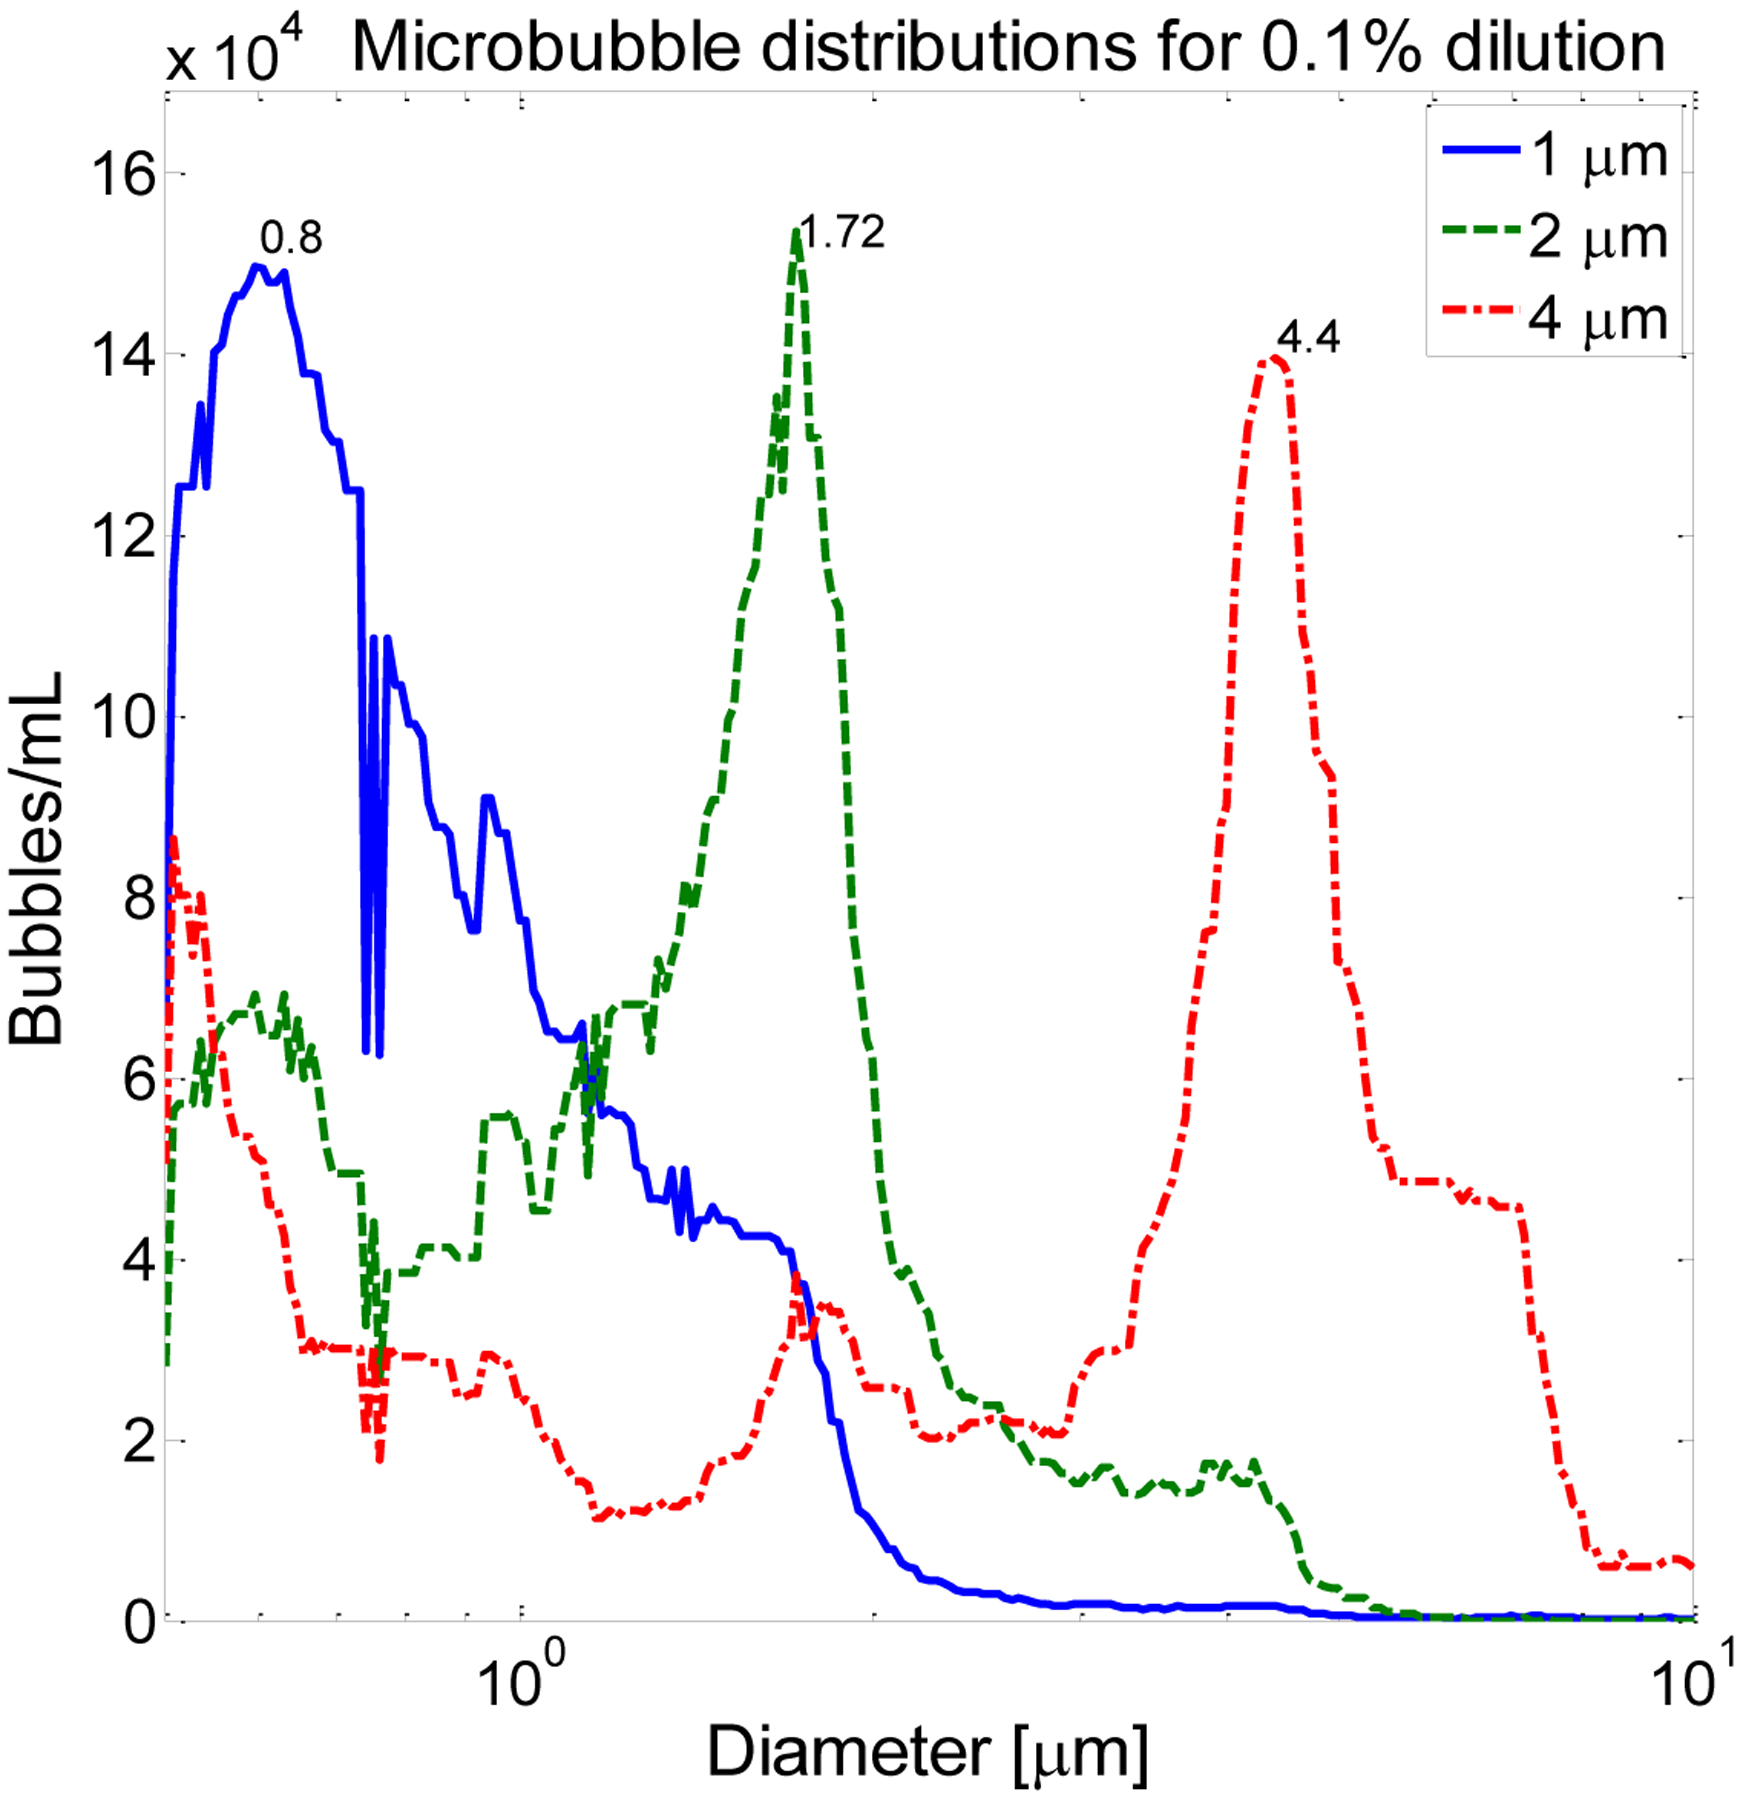
Microbubble size distributions used in this work include populations with peak diameters at 0.80, 1.72, and 4.4 μm, nominally referred to as 1, 2, and 4 μm populations. Data shown are for a 0.1% dilution.
Lipid-shelled microbubbles were pumped through the nearly acoustically transparent cellulose tubing at a velocity of 18 mm/s with a calibrated syringe injector (Harvard Apparatus PHD2000, Holliston, MA). For each pressure-frequency combination, 50 lines of RF data were acquired at a pulse repetition frequency (PRF) of 50 Hz (total acquisition time: 1 sec) via a 14 bit digitizing board at sampling frequency of 100 MHz (Signatec PDA14, Corona, CA) installed in a computer (Dell, Round Rock, TX) running LabView. The tube was flushed between acquisitions of different dilutions or sizes by flowing water through the tube at 10 mL/hr while transmitting at maximum pressure until microbubble echoes were no longer visible.
C. Tissue measurements
In order to determine contrast-to-tissue ratio (CTR), an identical setup was used to acquire echoes from a 2.5 × 3.8 × 7.6 cm3 sample of degassed beef muscle. The depth to the center of the tissue (1.25 cm) is similar to the typical thickness of tissues through which acoustic waves must propagate in order to reach contrast agents during in vivo imaging of peripheral vasculature [56]. Briefly, after hydrophone calibration, the center of the beef muscle sample was positioned at the double focus of the transmitting and receiving transducers. For each pressure-frequency combination, 50 lines of RF data were acquired from the tissue sample at 5 unique locations separated by 1 mm to ensure unique speckle patterns. Fig. 4 shows the peak correlation coefficient of RF data [57](i.e. normalized cross correlation between signals at different spatial locations, indicative of spatial coherence) received from the degassed beef muscle as a function of distance, indicating that signals acquired from distances separated by 1 mm are incoherent, as explained by the well-known van Cittert-Zernike theorem [58]. Thus acquisitions separated by 1 mm represent unique speckle patterns. These data differ from typical plots of correlation versus distance in that the receiving frequency was 10 MHz for either 2.25 or 5 MHz transmission. Dahl et al. previously explained that tissue harmonic echoes show greater coherence with respect to distance due to reduced reverberation clutter in the harmonics relative to the fundamental [59]; thus the coherence does not decrease fully to zero as would be expected in the case of echoes received at the transmission frequency.
Figure 4.
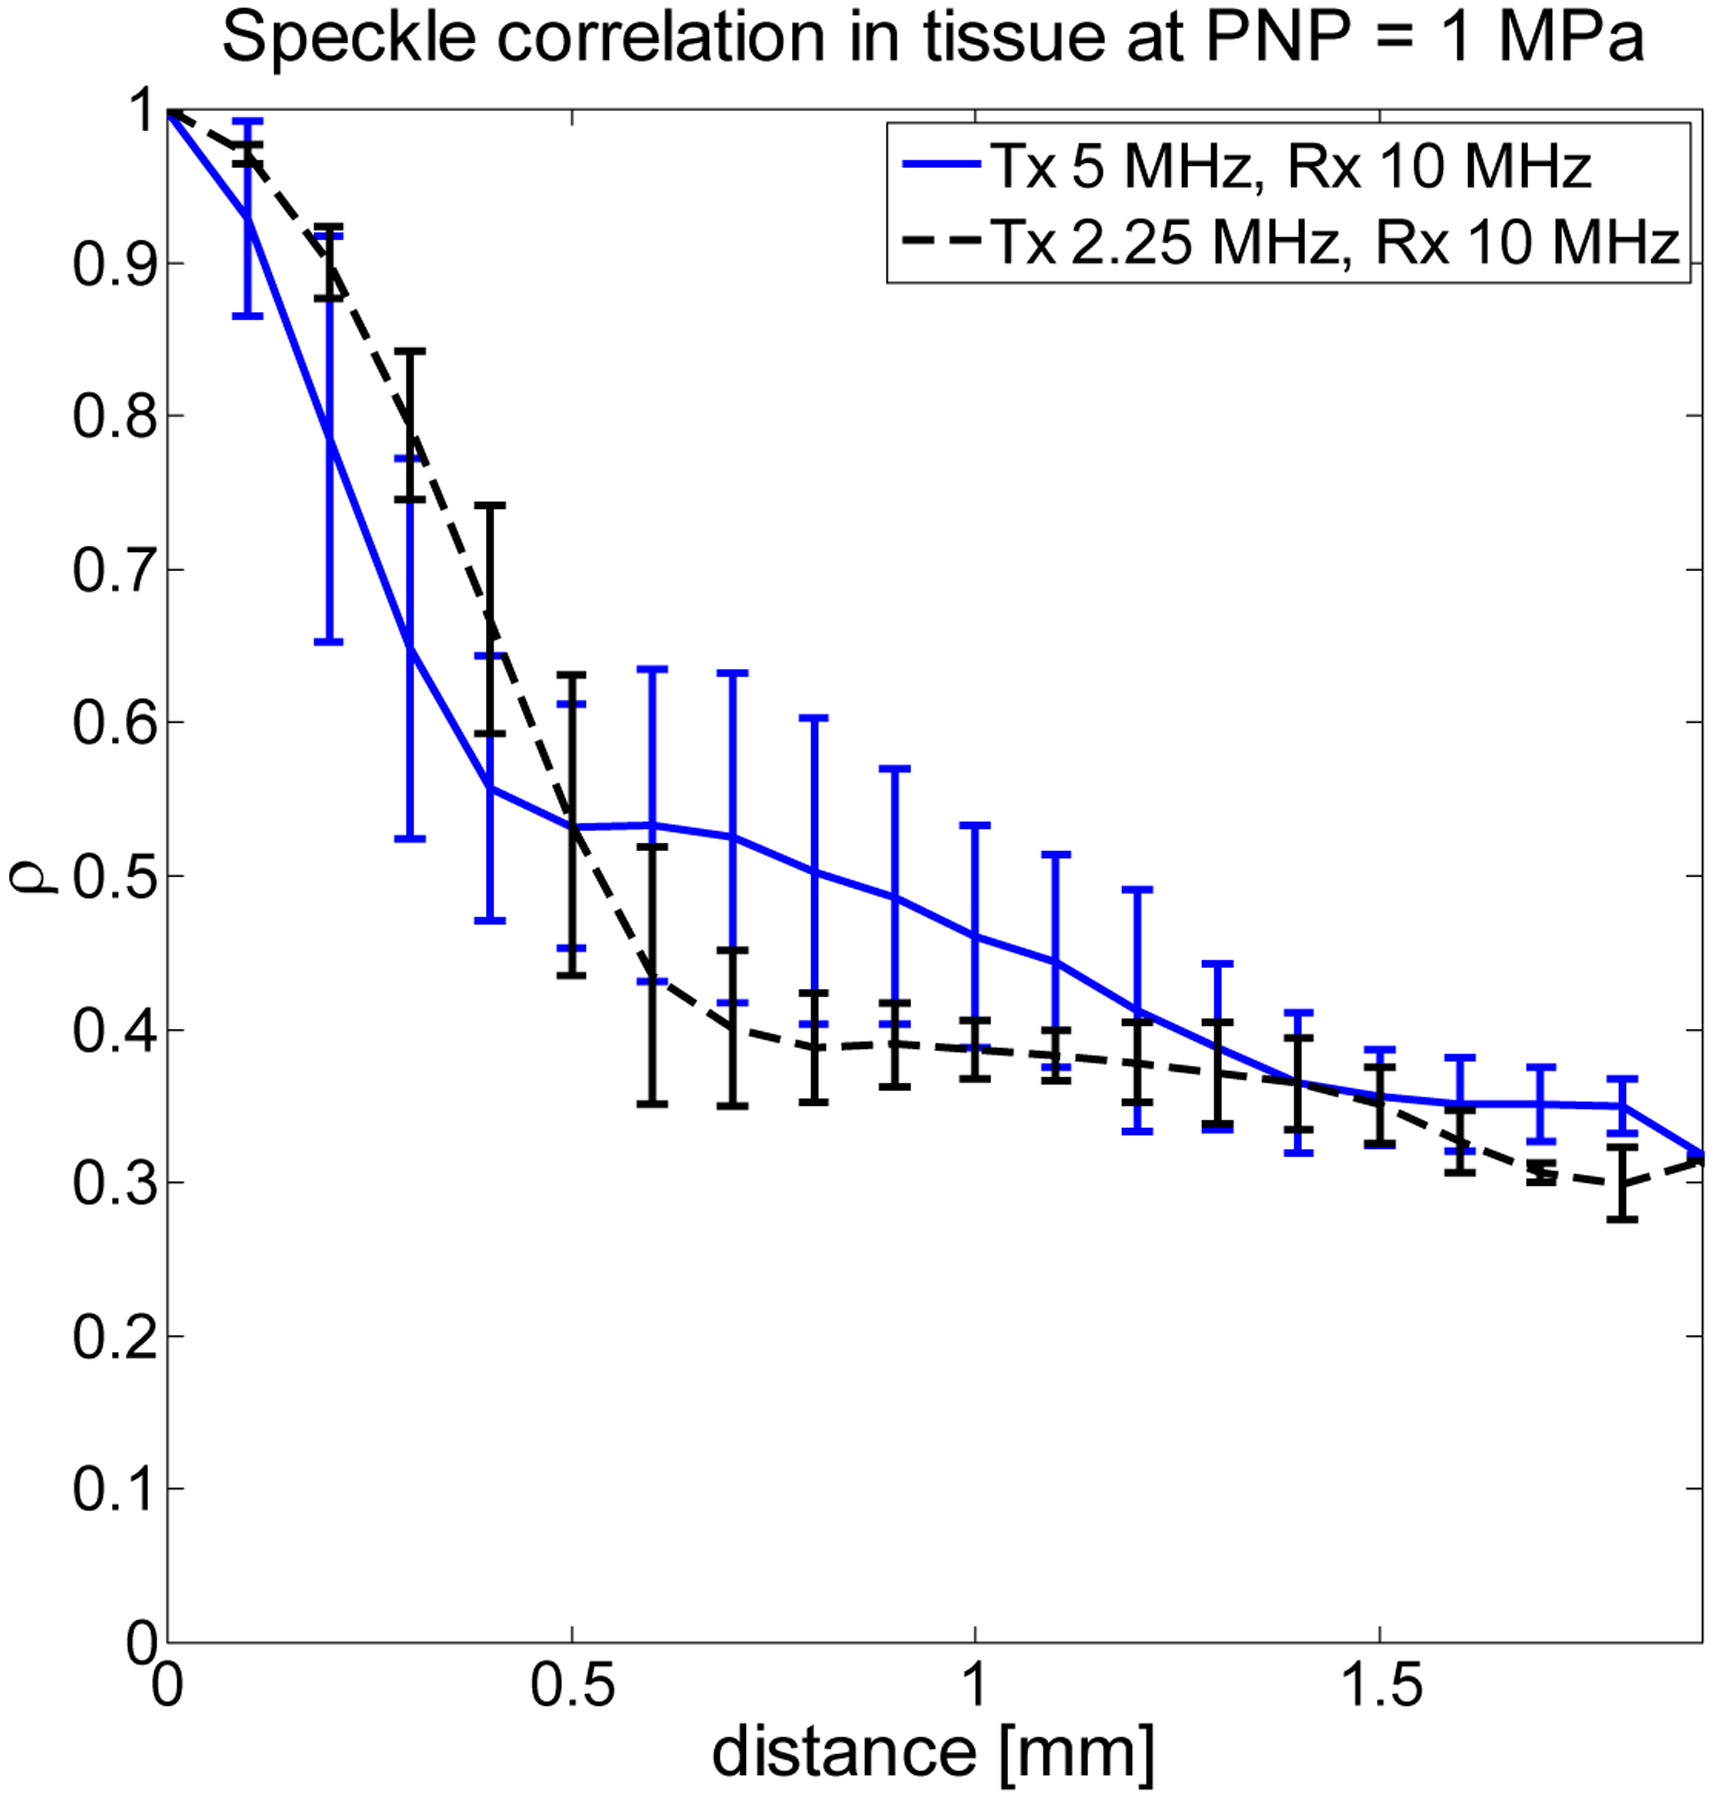
Peak correlation coefficient as function of distance for tissue echoes indicates that by stepping the tissue sample through the dual focus, signals separated by 1 mm are weakly correlated.
D. Data analysis
Acquired data were normalized by the measured frequency response of the receiving transducer to remove the influence of system-dependent parameters [44, 60–63]. Reference spectra were acquired with an ideal reflector at the transducer focus. Amplitude spectra of acquired tissue or microbubble data were then divided by the amplitude spectra from the ideal reflector.
Next, data were processed by wall filtering (FIR [1 −1]) to remove any stationary echoes from the cellulose tube, then filtering with a bandpass filter (7th order Butterworth) centered at the receiving transducer’s center frequency and having 50% bandwidth. Use of relative bandwidth filters having increasing absolute bandwidths preserves the broadband nature of the acquired signals. The frequency response of each receive transducer was divided from each line of voltage data in the frequency domain to remove frequency-dependent weighting. Microbubble signal-to-noise ratio (SNR) was computed for each acquired line of microbubble data using the following equation:
| (2) |
where Vnoise is acquired with water flowing through the tube. Similarly, for each acquired line of microbubble data, contrast-to-tissue ratio (CTR) was computed using the following equation:
| (3) |
where Vtissue is data acquired from beef muscle. All voltages are peak values. Pulse length was determined by performing envelope detection on each line of filtered data, fitting a parabola to the envelope, and determining the zero-crossings of the parabola. Axial resolution for these pulse-echo experiments was taken to be half the pulse length. It is important to note that axial resolution in these experiments is limited by several physical effects. First, the tube itself has an inner diameter of 200 μm, enabling bubbles to fill this entire volume. Secondly, the tube is positioned at an angle relative to the transducer, and the receiving transducers have focal spot sizes of 222 μm (7.5 MHz), 190 μm (10 MHz), 163 μm (15 MHz), 86.2 μm (20 MHz), and 70.8 μm (25 MHz) according to manufacturer-supplied information. Thus the signals used in measuring axial resolution arise from any microbubbles located within a volume defined by the intersection of the tube. Also, there exists on lower limit on the measurable resolution due to the tube diameter and focal spot size.
E. Animal study
In order to visualize the effect of the observed results on in vivo imaging, an animal study was performed while varying transmit frequency and pressure within the limitations of a custom dual frequency transducer with a transmit element having a center frequency of 4 MHz and a receive element having a center frequency of 30 MHz [41]. While the constraints of this highly specialized custom probe do not permit imaging across all parameters tested in vitro, they provide opportunity for in vivo validation of the trends observed in vitro. This custom mechanically-swept probe was connected to the VisualSonics Vevo 770 (Toronto, Canada) for imaging the kidney in two healthy Fischer 344 rats. Animals were depilated and scanned at a frame rate of 4 Hz while under isofluorane anesthesia according to a protocol approved by the Animal Care and Use Committee of the University of North Carolina. Contrast agent (109 bubbles/mL) was infused continuously at a rate of 40 μL/min. Transmit frequency was varied from 3.5 to 4.5 MHz, and peak negative pressure was varied up to 1300 kPa, ensuring MI remained below 0.7.
III. Results
Illustrative received spectra from microbubble scattering for each transducer after filtering and bandwidth compensation when transmitting at 1.5 MHz with a peak negative pressure of 1 MPa are shown in Fig. 5A for a 1% dilution and 1 μm bubbles. This figure indicates that for the selected parameters, the greatest microbubble harmonic signal content was present at 15 MHz, with content rapidly decreasing as the frequency of the receiving transducer increased. In Fig. 5B, spectra from tissue scattering are illustrated under the same parameters, showing greatest harmonic signal content for the transducer centered at 20 MHz with decreasing signal content at transducers centered at frequencies lower than 20 MHz. For illustrative spectra before filtering, the reader is referred to Fig. 1.
Figure 5.
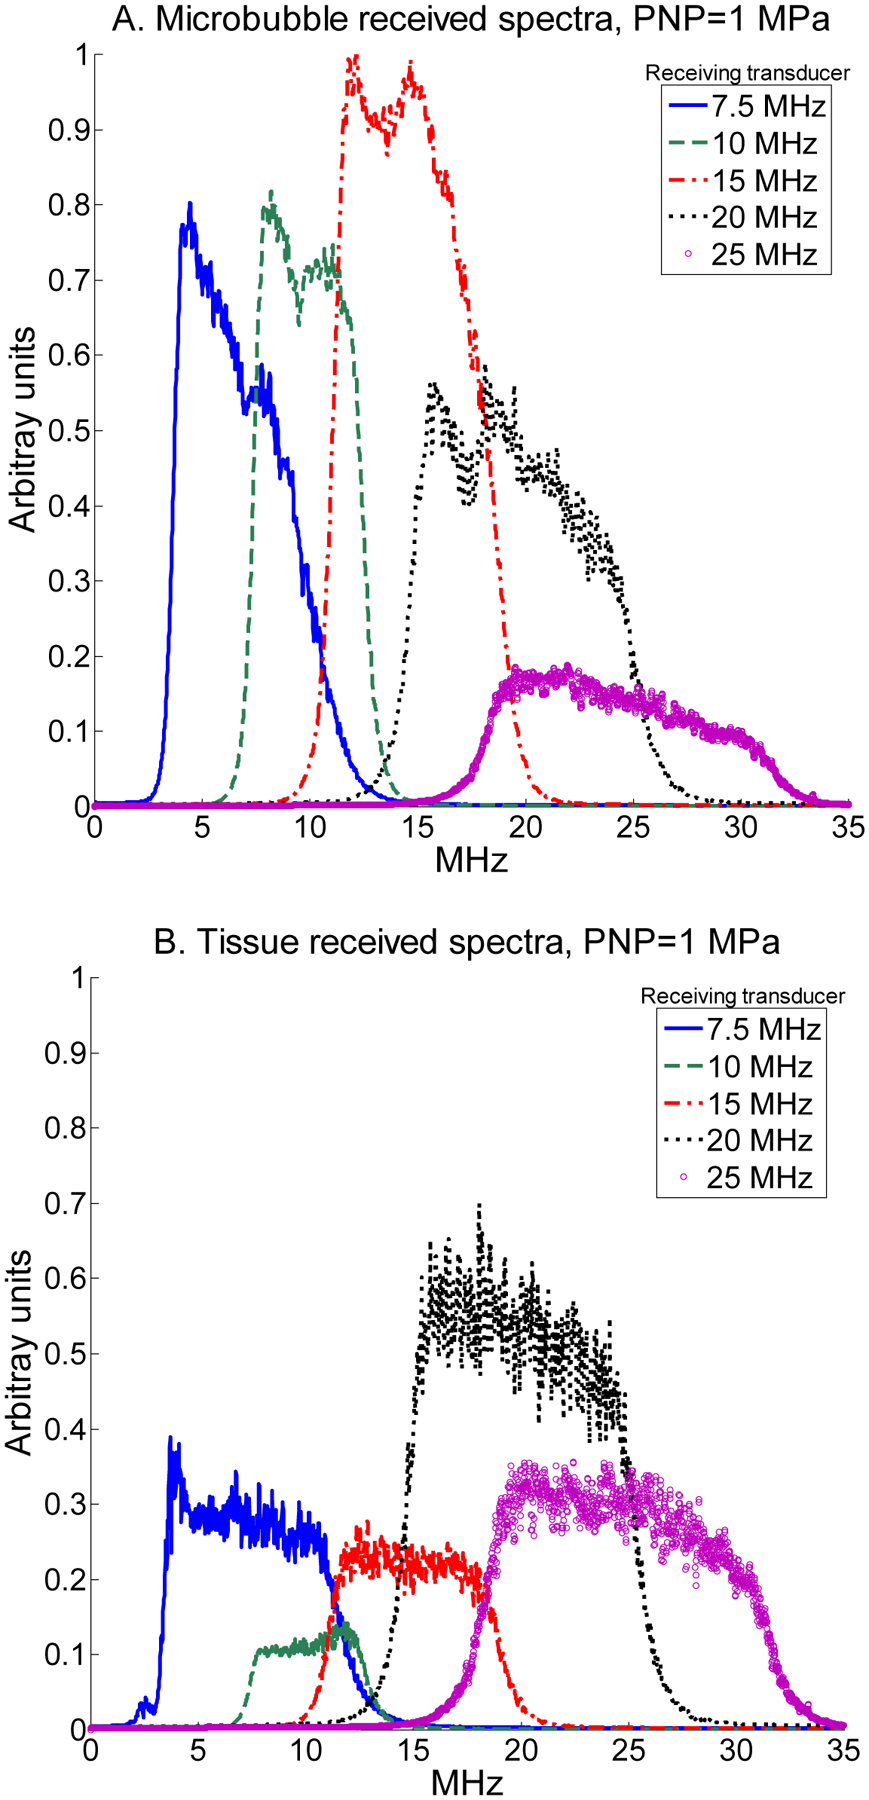
Received spectra backscattered by microbubbles when transmitting at 1.5 MHz with a peak negative pressure of 1 MPa for a (A) 1 μm -diameter microbubbles at 1% dilution, and (B) tissue for receiving transducers centered at 7.5, 10, 15, 20, and 25 MHz. Spectra are normalized to the maximum microbubble spectrum.
A. SNR and CTR
For a 1% dilution of 1 μm bubbles, mean SNR as a function of both transmission pressure and frequency is displayed as an image with a dynamic range of 0 to 30 dB (Fig. 6). This display format allows visualization of SNR as both parameters are varied across all tested values. Similarly, in Fig. 7, mean CTR as a function of both transmission pressure and frequency for a 1% dilution of 1 μm bubbles is displayed (0 to 26 dB). Data acquired for peak negative pressures less than 400 kPa is dominated by noise and is thus omitted. The highest SNR was observed at a receiving frequency of 15 MHz and the highest CTR at 10 MHz.
Figure 6.
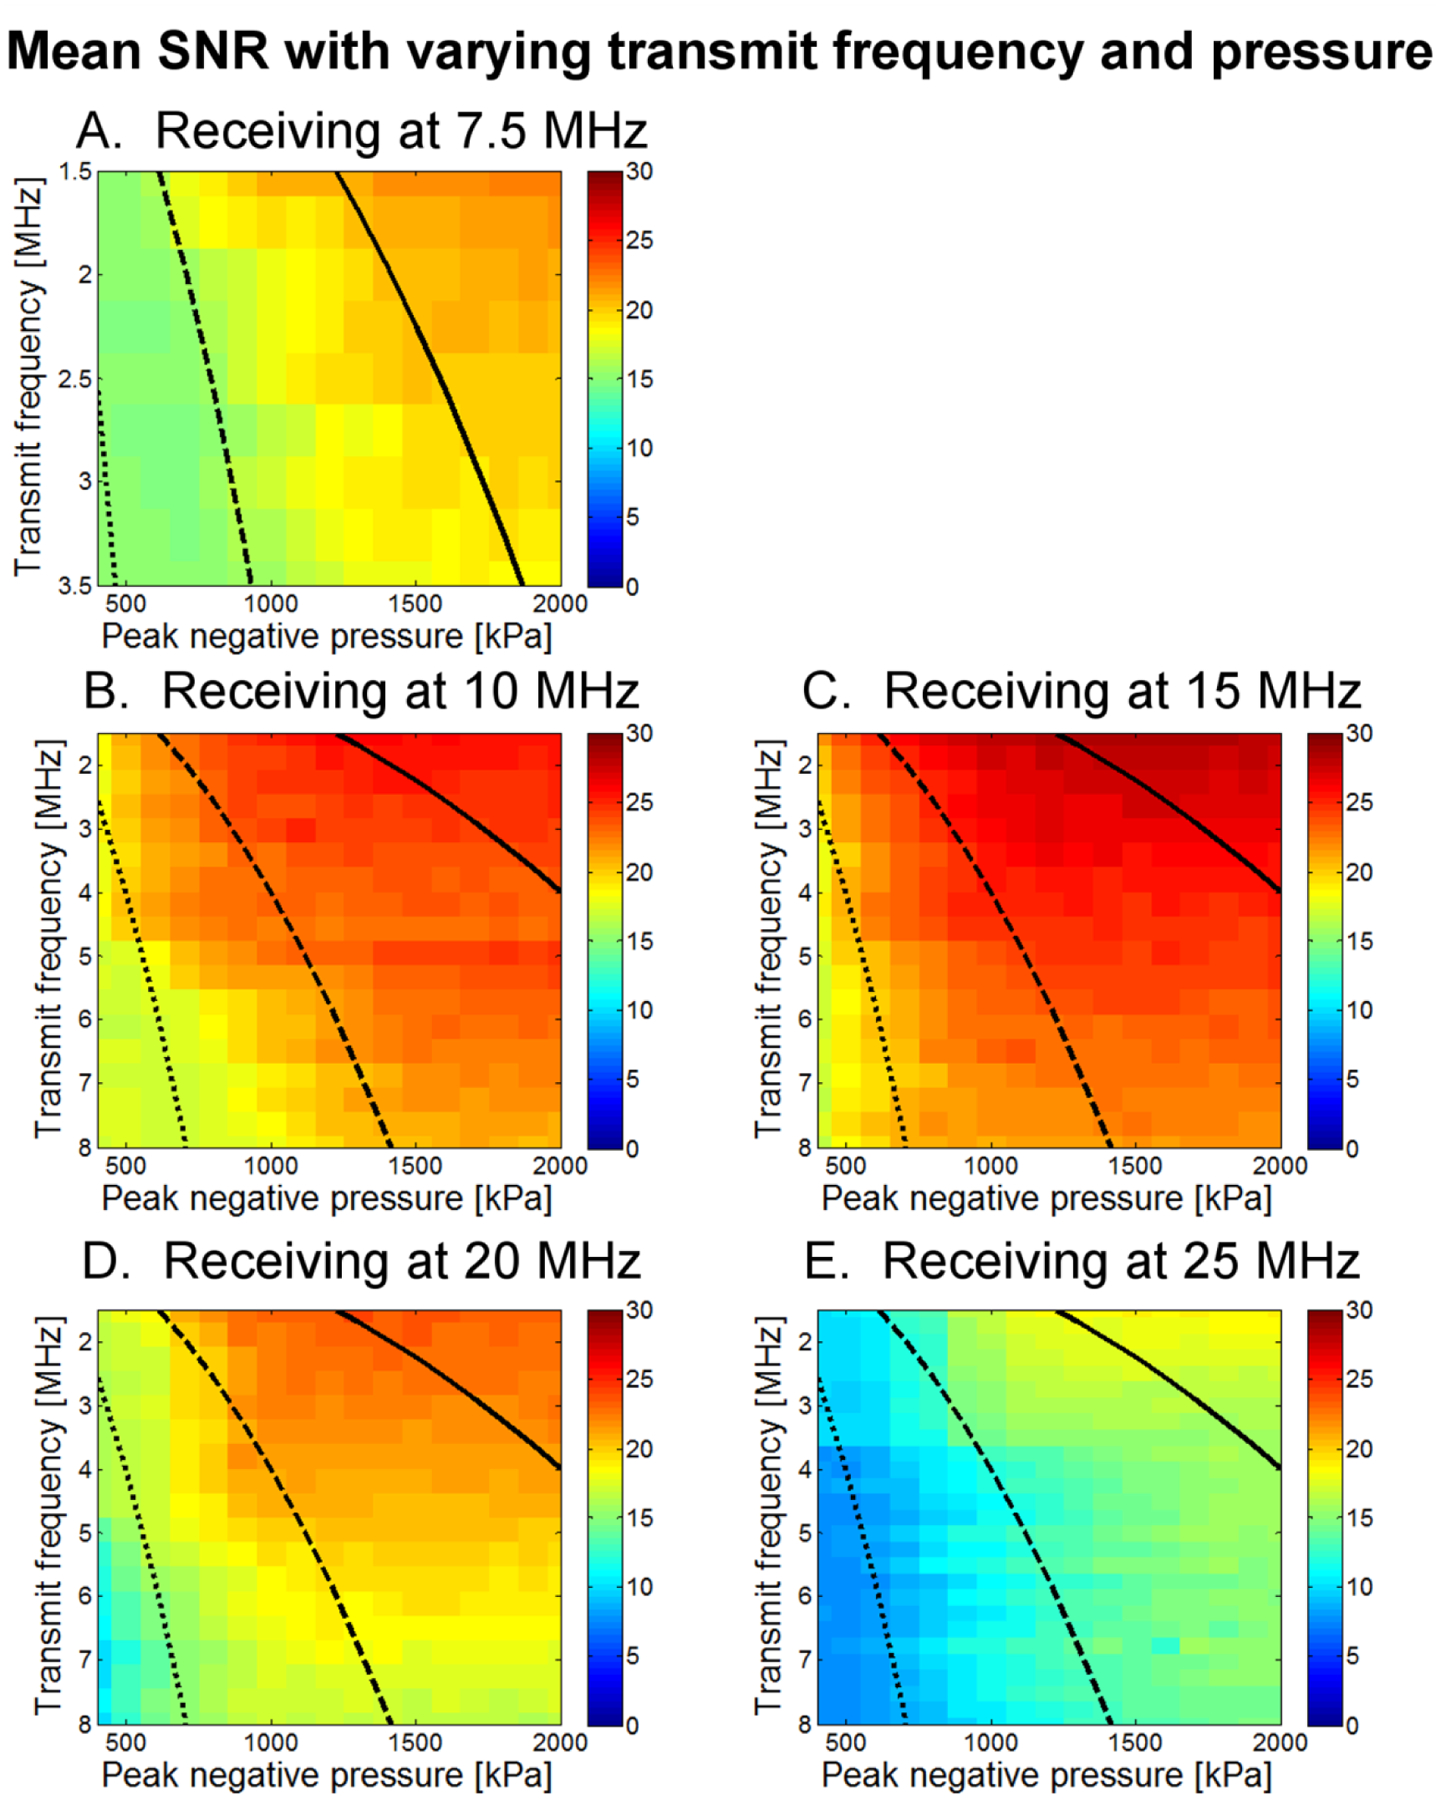
Mean SNR as a function of both transmit frequency and peak negative pressure for (A) 7.5 MHz, (B) 10 MHz, (C) 15 MHz, (D) 20 MHz, and (E) 25 MHz receiving transducers. Each square contains data from 50 microbubble acquisitions; display range is 0 to 30 dB. Lines delineate MI regimes, with the dotted line indicating MI=0.25, the dashed line indicating MI=0.5, and the solid line indicating MI=1.0.
Figure 7.
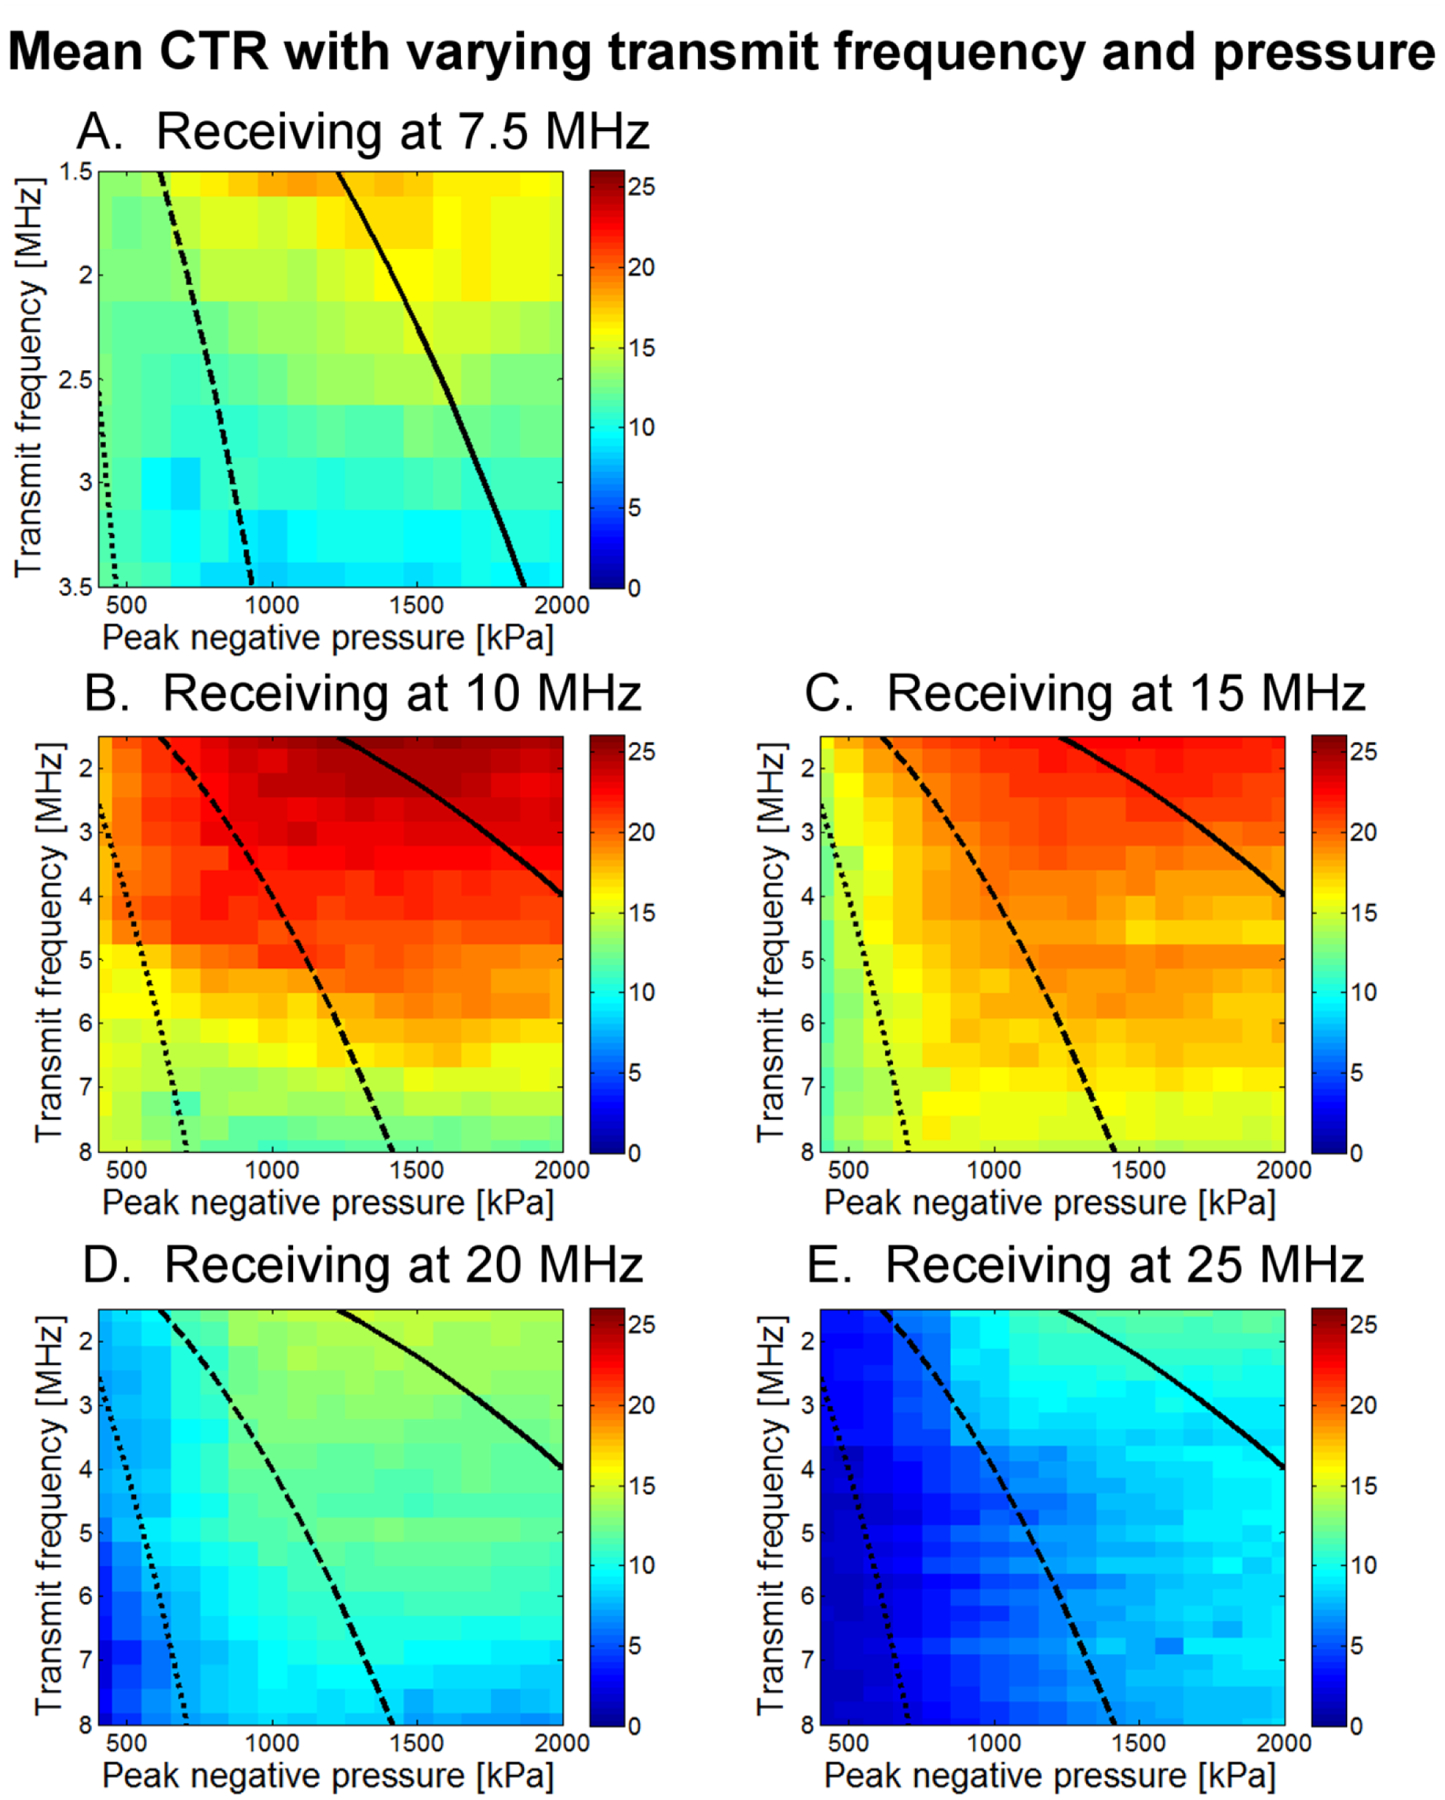
Mean CTR as a function of both transmit frequency and peak negative pressure for (A) 7.5 MHz, (B) 10 MHz, (C) 15 MHz, (D) 20 MHz, and (E) 25 MHz receiving transducers. Each square contains data from 50 microbubble acquisitions, as well as 50 tissue acquisitions at each of 5 spatial locations. Display range is 0 to 26 dB. Lines delineate MI regimes, with the dotted line indicating MI=0.25, the dashed line indicating MI=0.5, and the solid line indicating MI=1.0.
While SNR was highest at a receiving frequency of 15 MHz and showed only a weak decrease with increasing transmission frequency, dividing by the tissue response to compute CTR yielded a maximum CTR at a receiving frequency of 10 MHz with a strong decrease in CTR as transmission frequency increases. The highest CTRs occurred at the lowest transmission frequencies but exhibited only gradual decline for transmit frequencies up to approximately 4 MHz.
Within a single receiving frequency, as peak negative pressure is increased, CTR increases rapidly to near-maximum levels once a minimum pressure threshold (typically at least 500 kPa) is reached for that specific combination of transmit-receive frequencies. As peak negative pressure increases beyond that threshold, increase in CTR is minimal and in fact decreases at the highest pressures. Because of this decrease, highest CTRs are found between 1000 and 1600 kPa. This effect is discussed in greater detail in Section III C, where the results of CTR as a function of peak negative pressure are shown for four different dilutions. Considering only a single receiving center frequency, the pressure amplitude required to attain the threshold for rapid increase in CTR is observed to increase with transmitted frequency, as indicated by the negative slope between green and red-colored regions in Figs. 6 and 7. This result occurs at all receiving frequencies but is more pronounced at less sensitive frequencies. If in fact bubble destruction is the main contributor to high CTR, this would be consistent with previous observations that microbubbles break less easily at higher frequencies [64, 65]. This will be examined in greater detail in the discussion section.
Overall, the maximum CTR of 25.5 dB occurred when transmitting at 1.5 MHz with a peak negative pressure of 1600 kPa, and receiving with a center frequency of 10 MHz.
B. Axial resolution
Axial resolution—half the length of the received pulse—was found to show weak dependence on transmission frequency but strong dependence on receiving frequency. Dependence of axial resolution on peak negative pressure can be divided into three regimes and was relatively homogeneous within each regime. In Fig. 8A, axial resolution is displayed as a function of 5 receiving frequencies when averaging over peak negative pressures from 200 to 500 kPa for the same parameters (1% dilution of 1 μm bubbles). In Fig. 8B, averaging over peak negative pressures from 600 to 1600 kPa indicates a significant decrease in resolution, suggesting that peak negative pressures of at least 600 kPa are required for high-resolution imaging. In Fig. 8C, averaging over peak negative pressures from 1700 to 2000 kPa reveals a change in the shape of the curve, as resolution is now on the order of 400 μm or less at all receiving frequencies but is highest at intermediate receiving frequencies, which are most sensitive to slowly decaying echoes. In addition to the aforementioned limitations on acoustically measurable resolution, it should also be noted that in Fig. 8, axial resolutions are averaged across all transmit frequencies. In Fig. 9, the dependence of axial resolution on transmission frequency for peak negative pressures in the range of 600 to 1600 μm is examined, providing a more accurate measure of attainable axial resolution in these experiments given the discussed limitations imposed by the tube. Axial resolution is thus approximately 200 to 350 μm at 10 MHz, approximately 225 μm at 15 MHz and approximately 100–200 μm at 20 and 25 MHz receiving frequencies, generally decreasing slightly with increasing transmit frequency.
Figure 8.
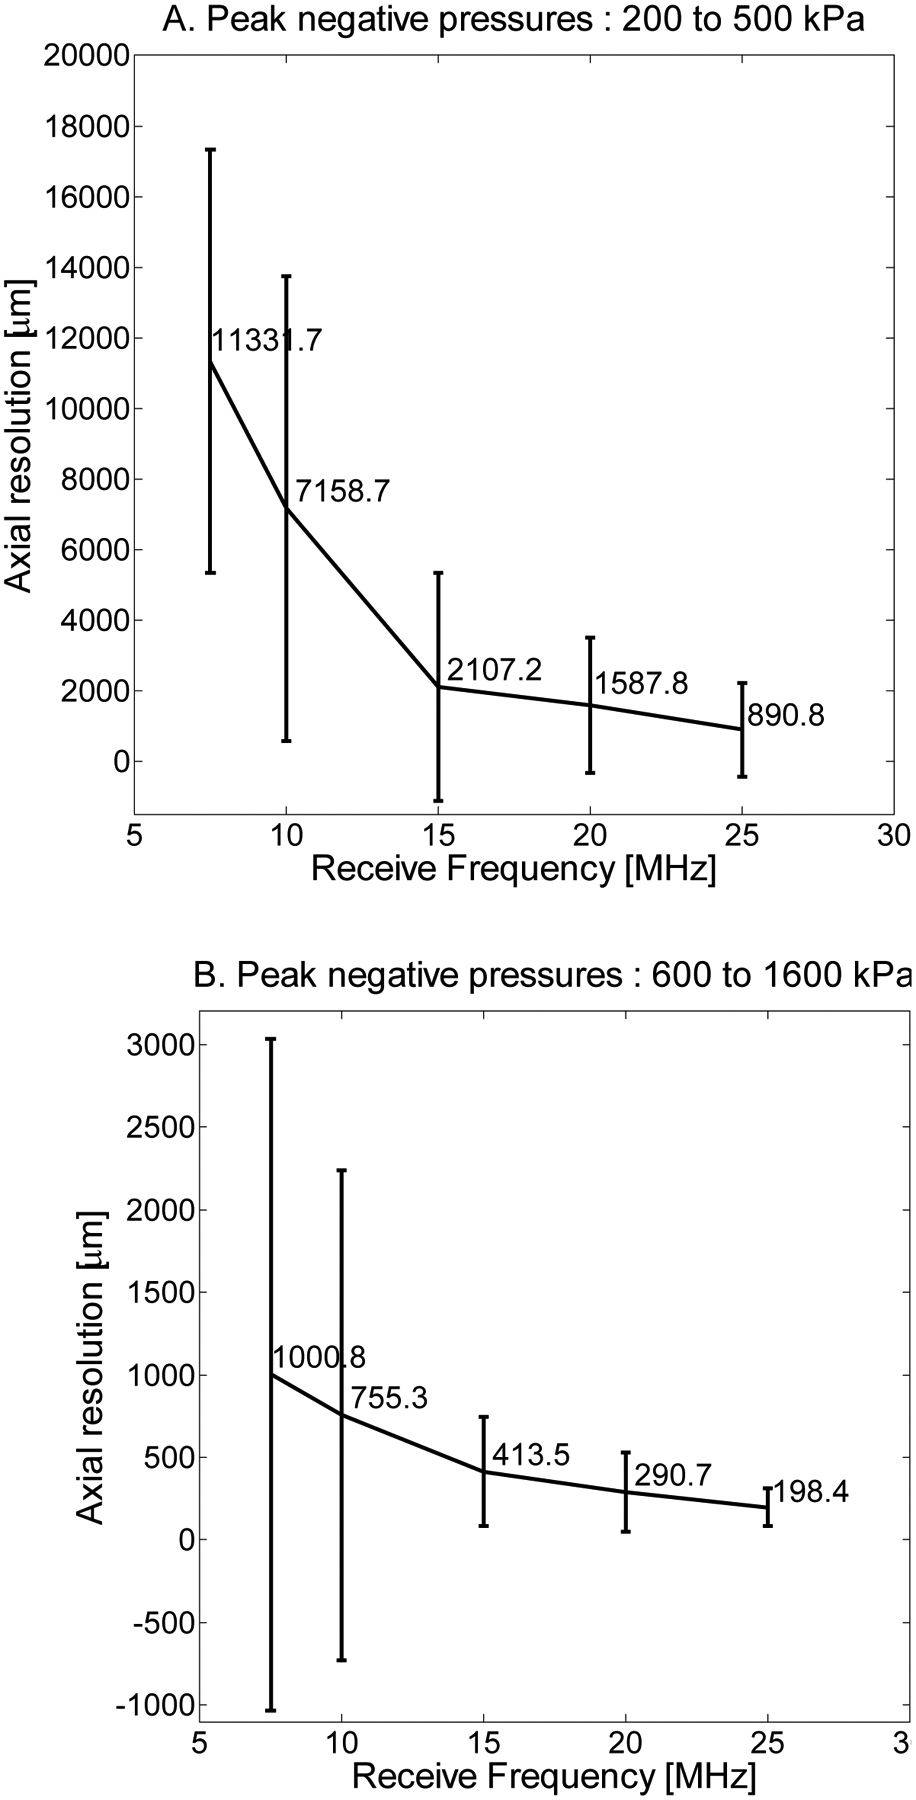
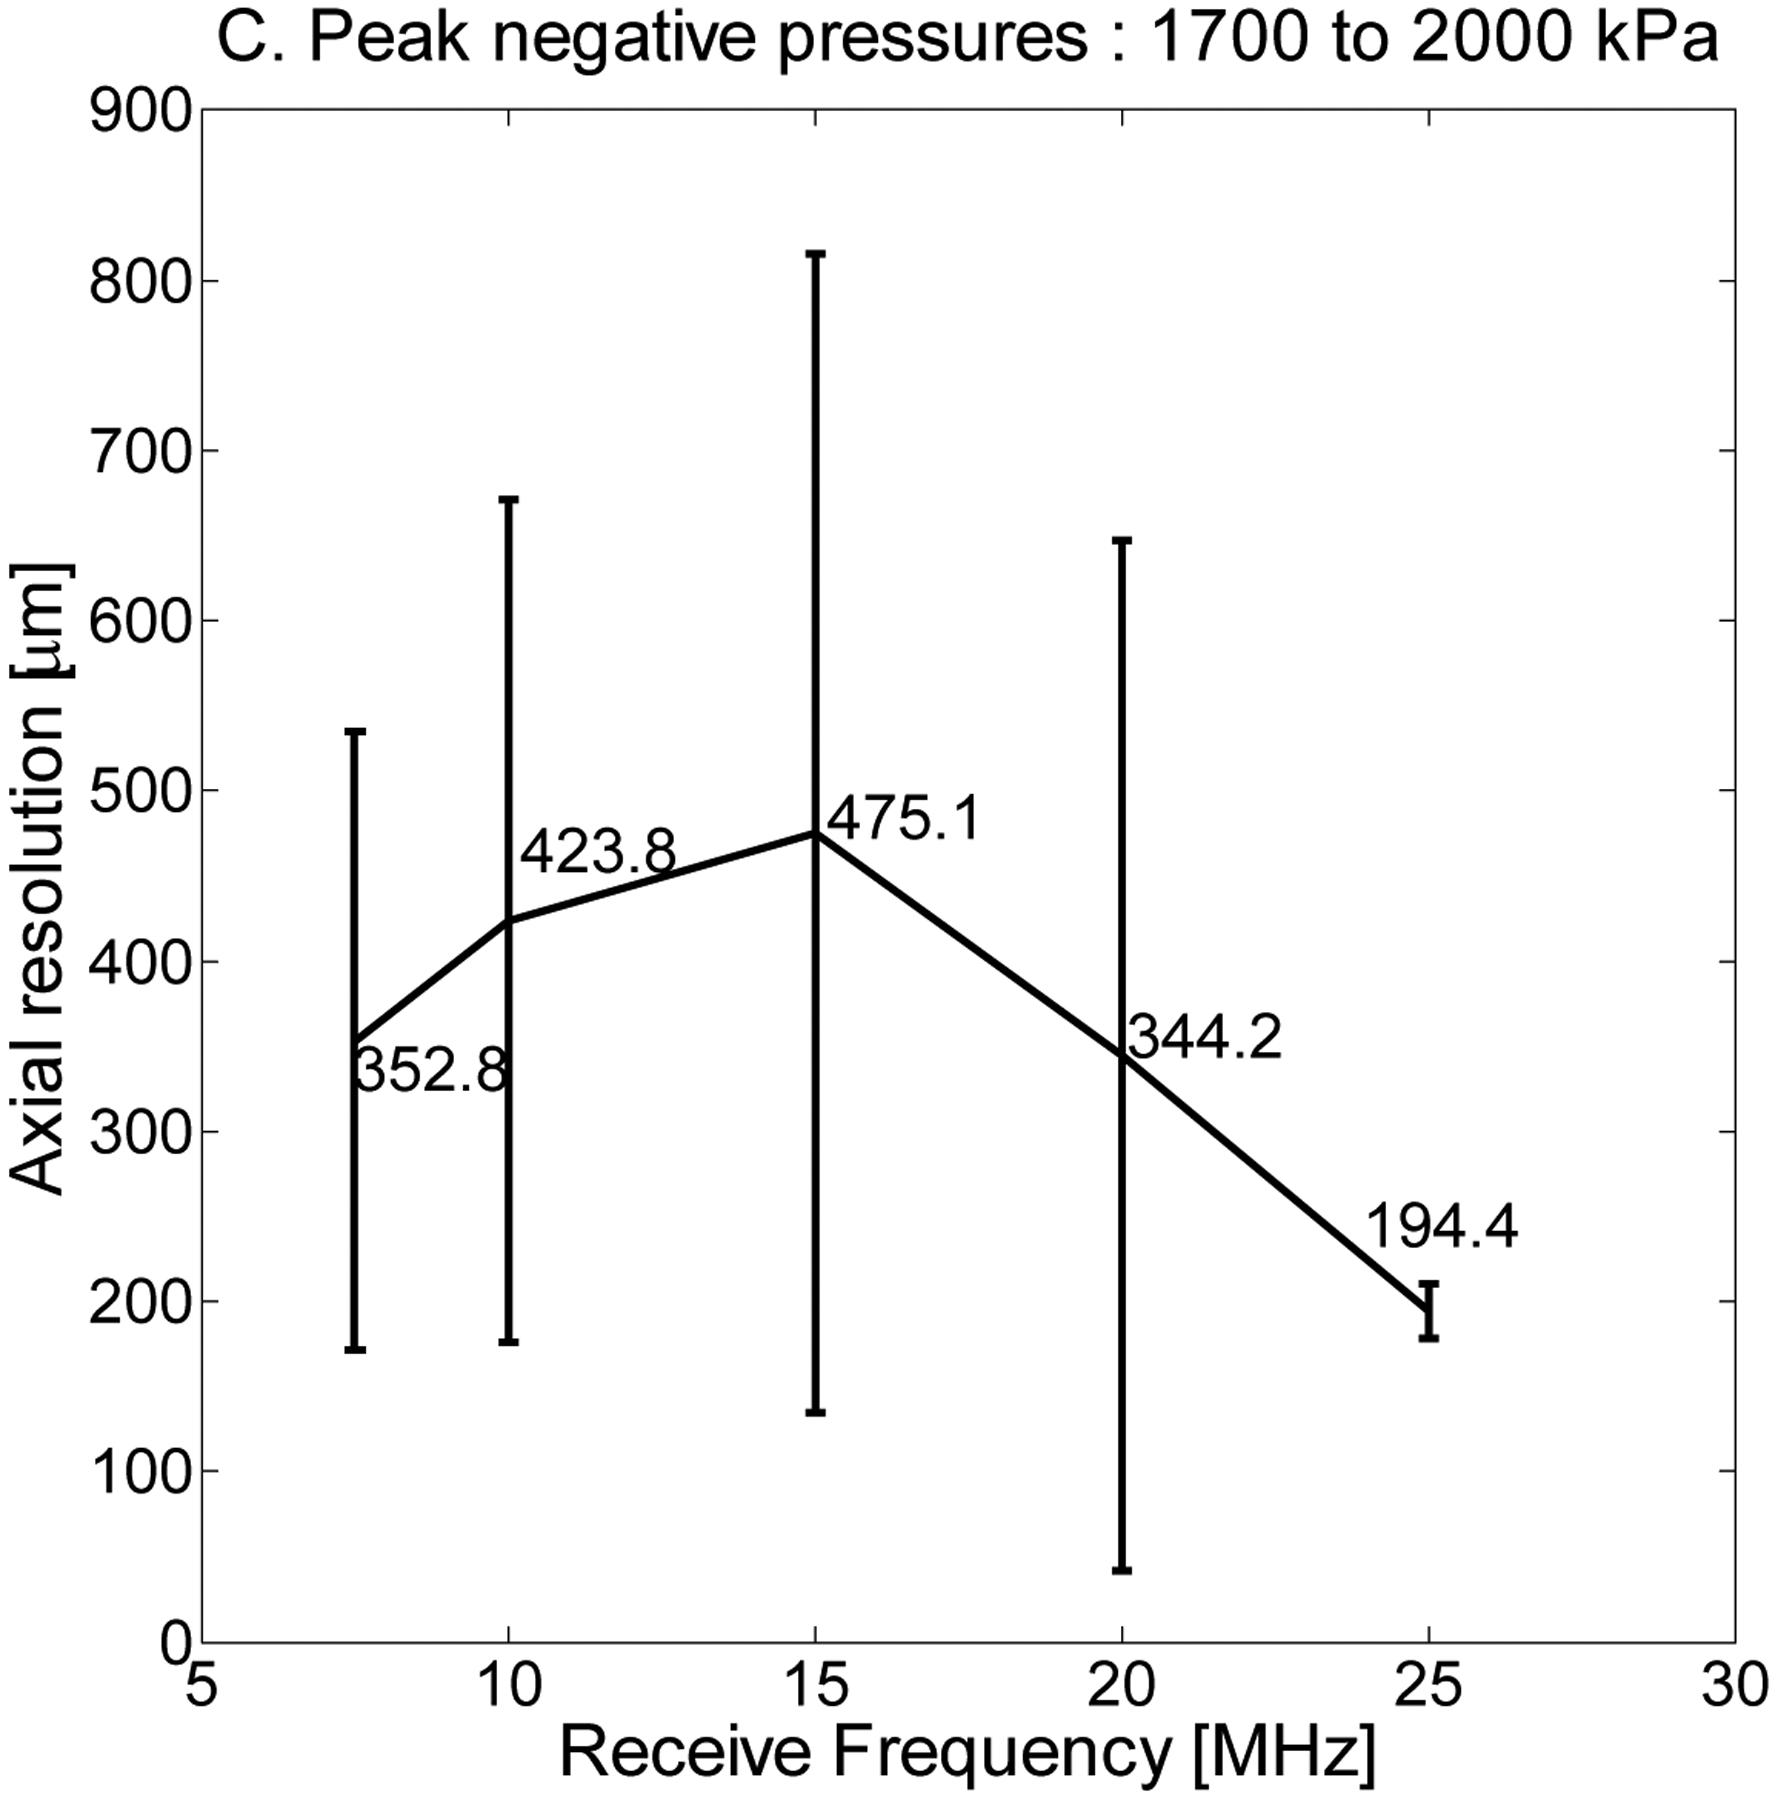
Axial resolution (half the pulse length) as a function of receive frequency at 7.5, 10, 15, 20, and 25 MHz for a 1% dilution and peak negative pressures averaged (A) over the range of 200 to 500 kPa, (B) 600 to 1600 kPa, and (C) 1700 to 2000 kPa.
Figure 9.
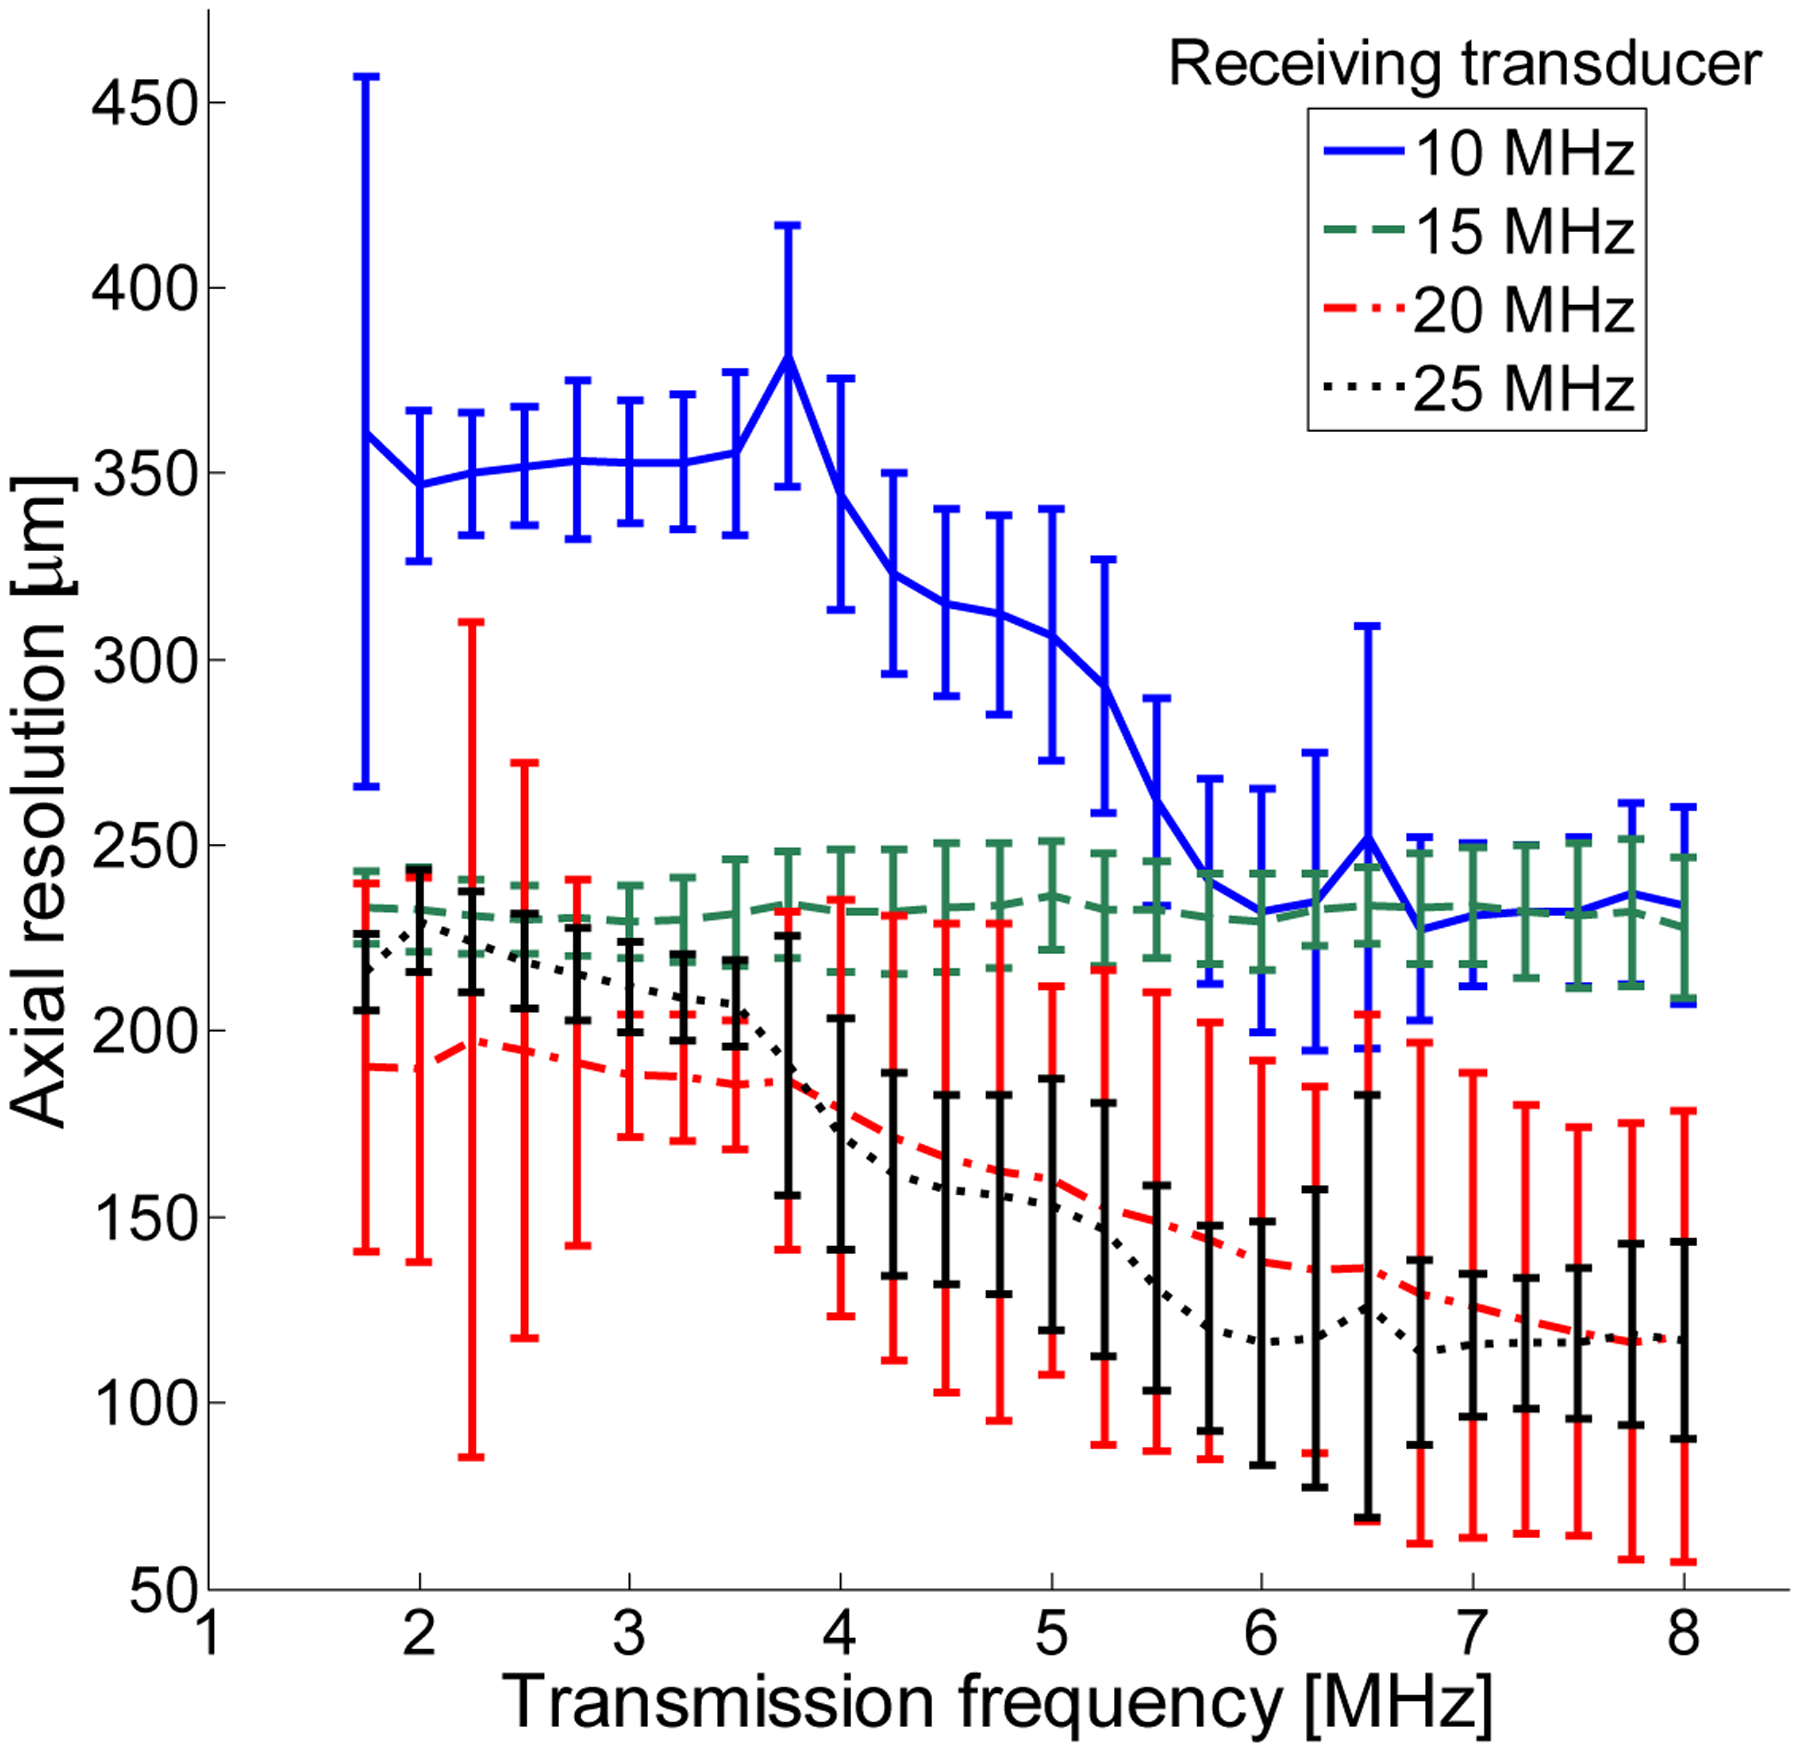
Axial resolution (half the pulse length) as a function of transmitted frequency for a 1% dilution of microbubbles and pressures in the 600 to 1600 kPa range (Figure 8B).
C. Effect of varying microbubble concentration
In Fig. 10, CTR as a function of transmitted pressure for 4 microbubble dilutions is presented for 1 μm bubbles and a transmission frequency of 1.5 MHz. In Fig. 11, the same results are presented for a transmission frequency of 3.5 MHz. These results indicate that dilutions of 1% and 0.5% produce nearly identical results for the majority of sets of parameters. For lower receiving frequencies (7.5, 10, and 15 MHz), a dilution of 0.1% also yields a similar CTR, while for higher receiving frequencies, this dilution tends to produce a lower CTR. The lowest concentration tested (0.025%) consistently produces low CTR values which would be insufficient for many in vivo imaging scenarios. The primary difference between transmission at 1.5 and 3.5 MHz, aside from the overall decrease in CTR observed previously, is that at 3.5 MHz, the difference in CTR due to varying concentration is muted, with lower concentrations sometimes having CTR exceeding that of higher concentrations, as in Fig. 11A. This may be due to shielding effects as well as the overall lower sensitivity at higher transmission frequencies.
Figure 10.
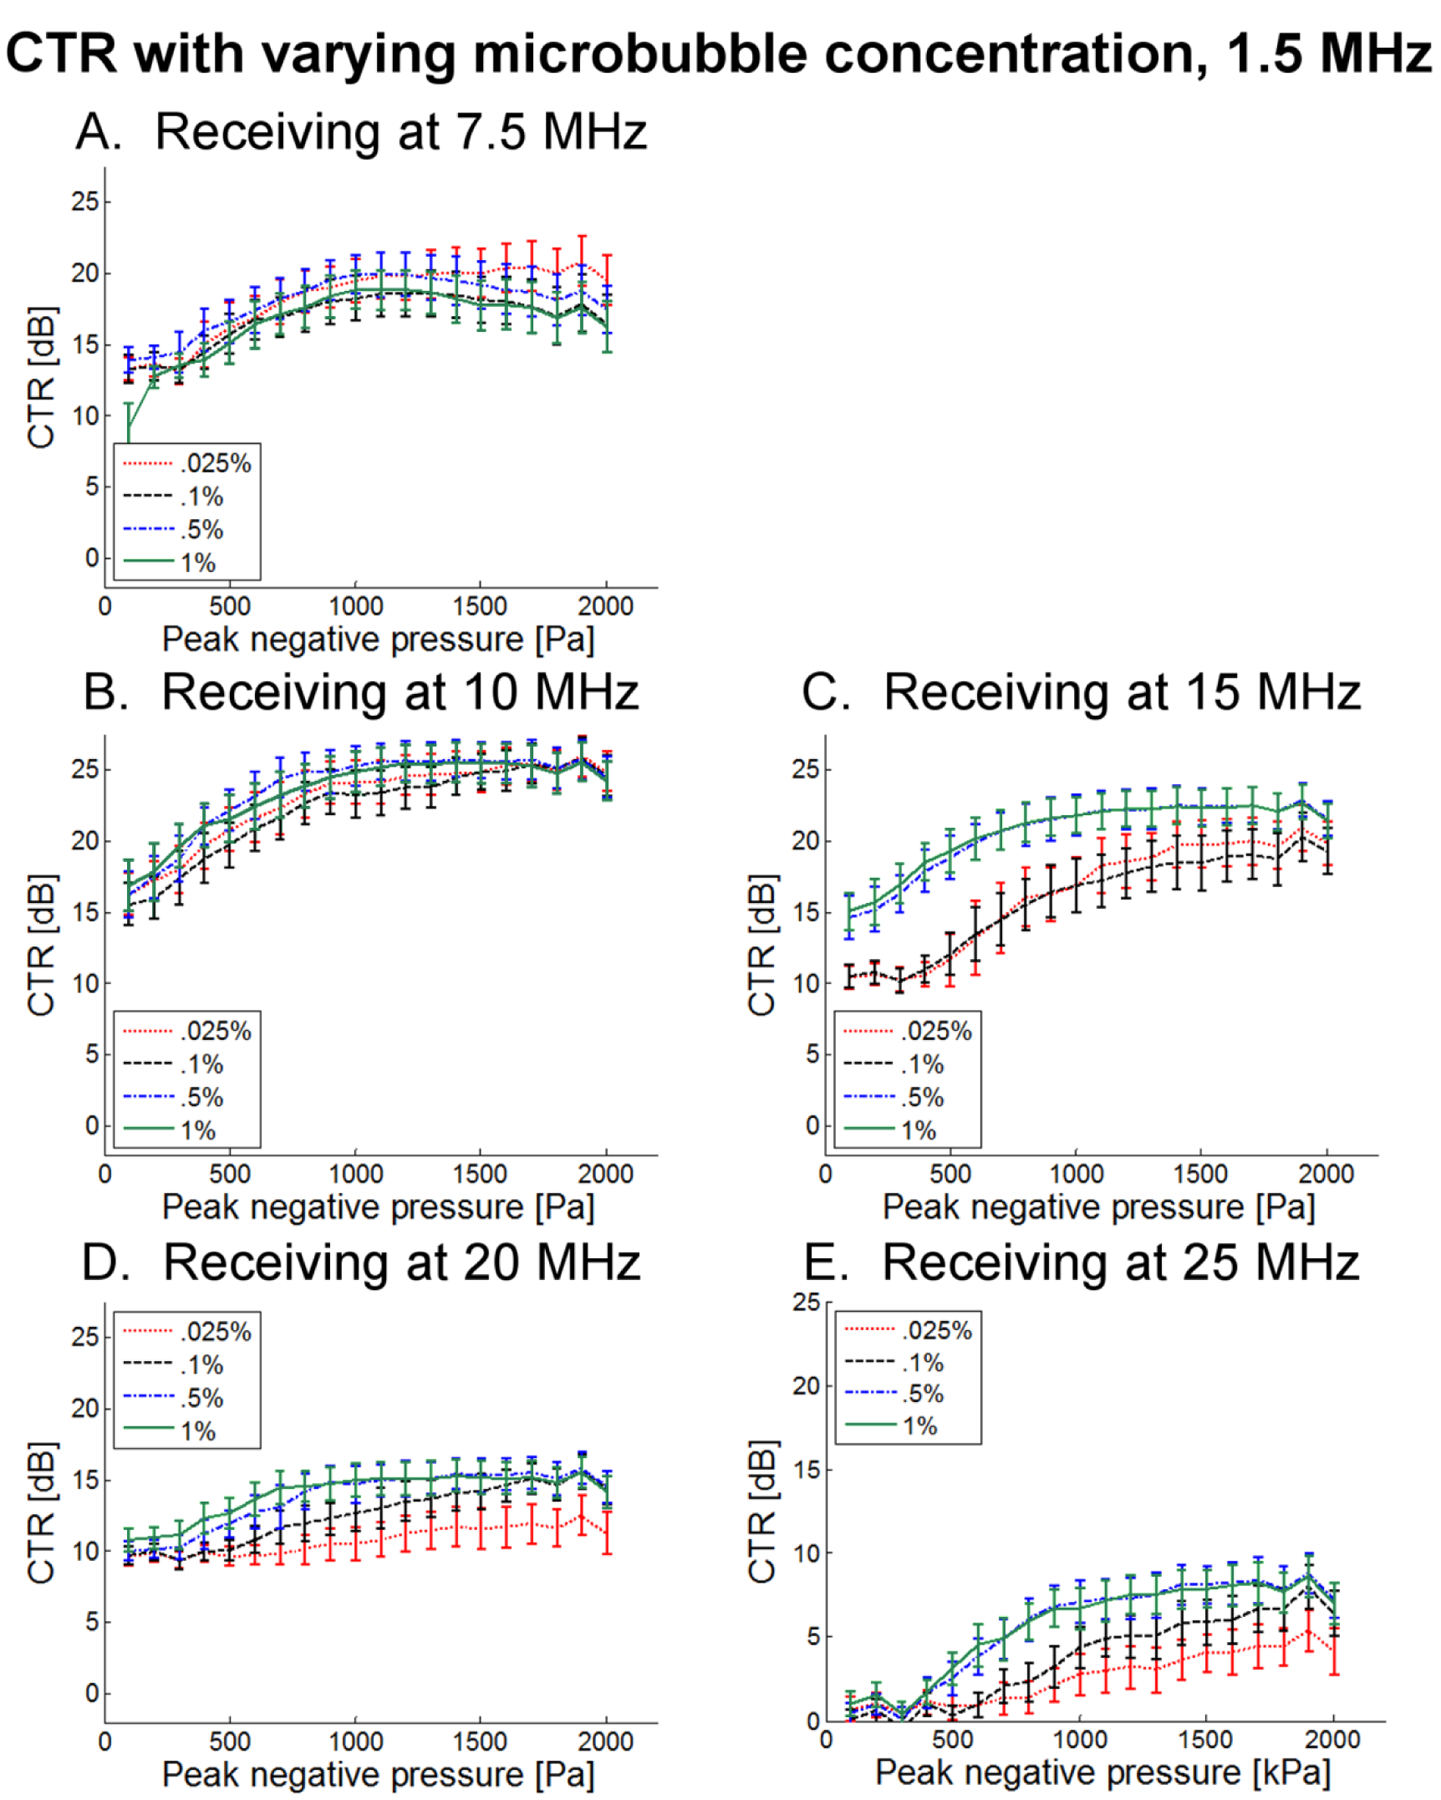
CTR as a function of peak negative pressure for 4 unique dilutions when transmitting at 1.5 MHz and receiving with transducers centered at (A) 7.5 MHz, (B) 10 MHz, (C) 15 MHz, (D) 20 MHz, and (E) 25 MHz.
Figure 11.
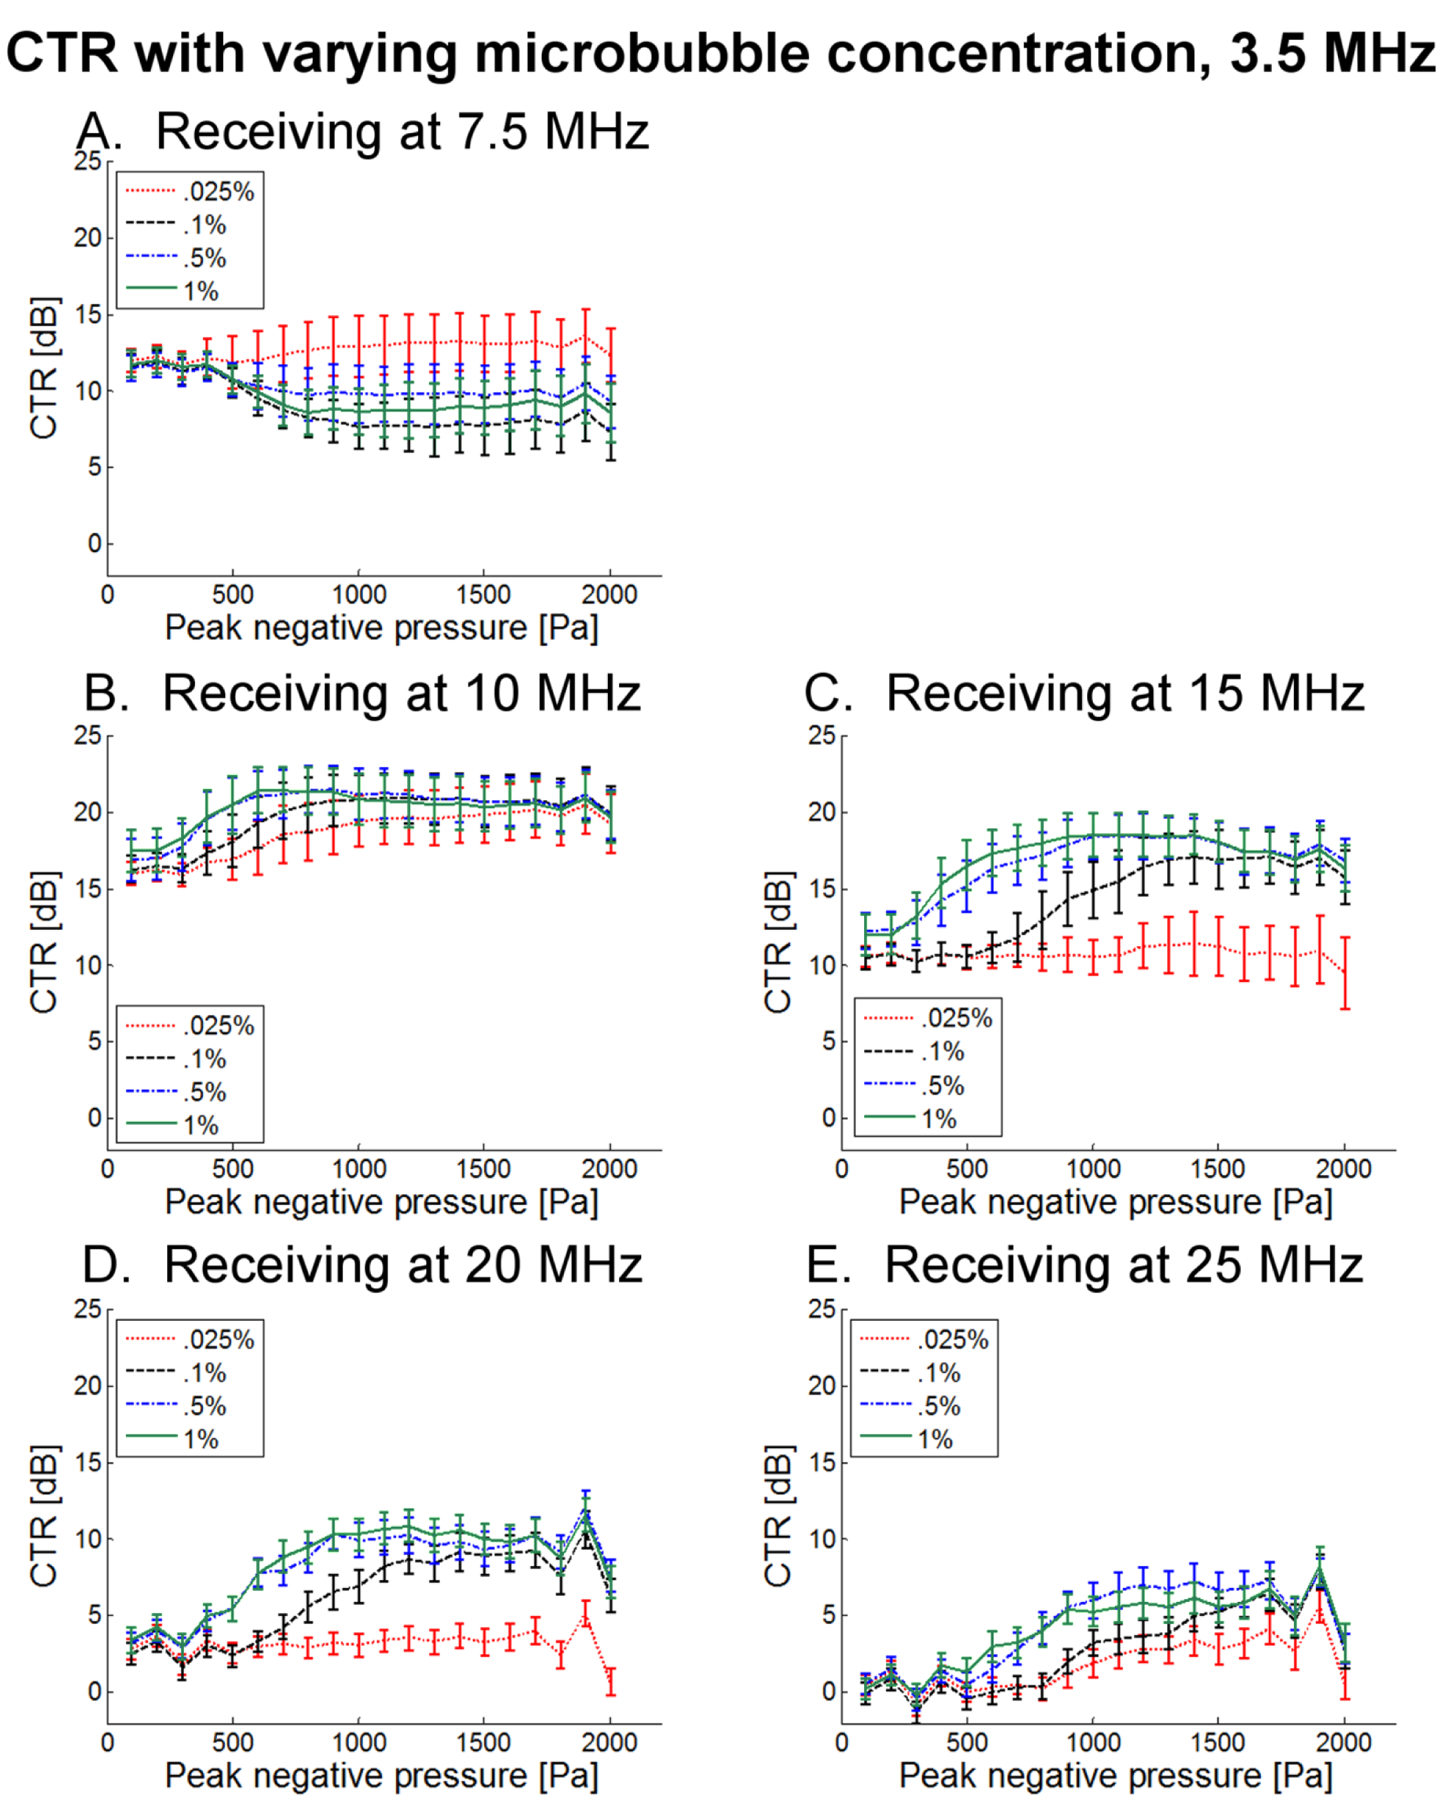
CTR as a function of peak negative pressure for 4 unique dilutions when transmitting at 3.5 MHz and receiving with transducers centered at (A) 7.5 MHz, (B) 10 MHz, (C) 15 MHz, (D) 20 MHz, and (E) 25 MHz.
D. Effect of varying microbubble size
In Fig. 12, CTR as a function of transmitted pressure for three microbubble diameters (0.1% dilution) is presented for a transmission frequency of 1.5 MHz. 4 μm bubbles consistently exhibit the greatest CTR, followed by 1 μm and then 2 μm bubbles. At lower receiving frequencies (7.5 and 10 MHz), 4 μm bubbles exhibit an increase in CTR and lower transmission pressures (~500 kPa), than 1 or 2 μm bubbles. In Fig. 13, CTR as a function of transmit pressure for three microbubble diameters (0.1% dilution) is presented for a transmission frequency of 3.5 MHz, showing similar trends at overall reduced CTR levels. Overall, these results suggest that increased scattering due to larger bubbles may be useful for maximizing CTR.
Figure 12.
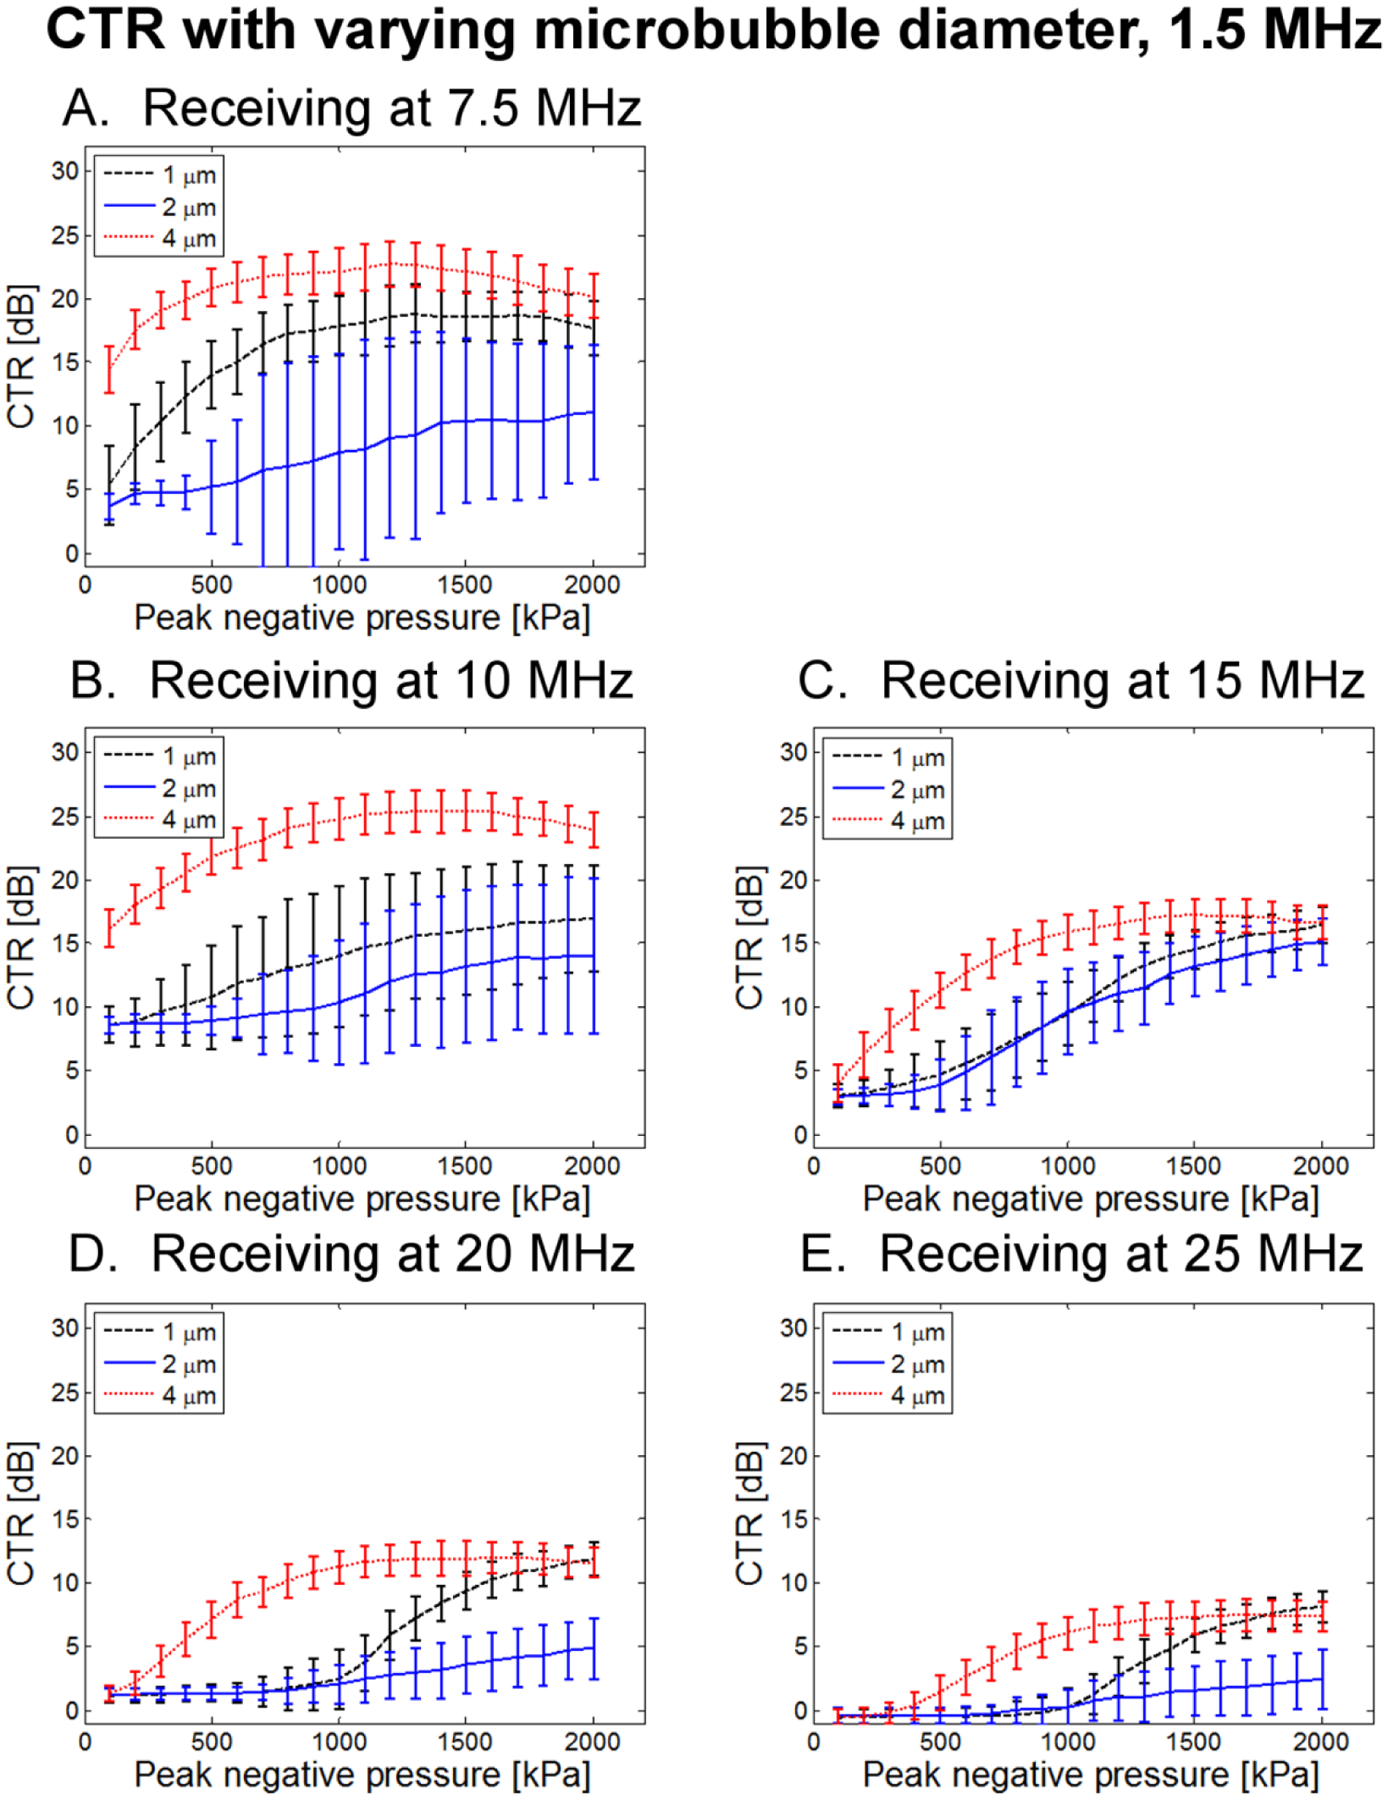
CTR as a function of peak negative pressure for 3 bubble diameters at 0.1% dilution when transmitting at 1.5 MHz and receiving with (A) 7.5 MHz, (B) 10 MHz, (C) 15 MHz, (D) 20 MHz, and (E) 25 MHz receiving transducers.
Figure 13.
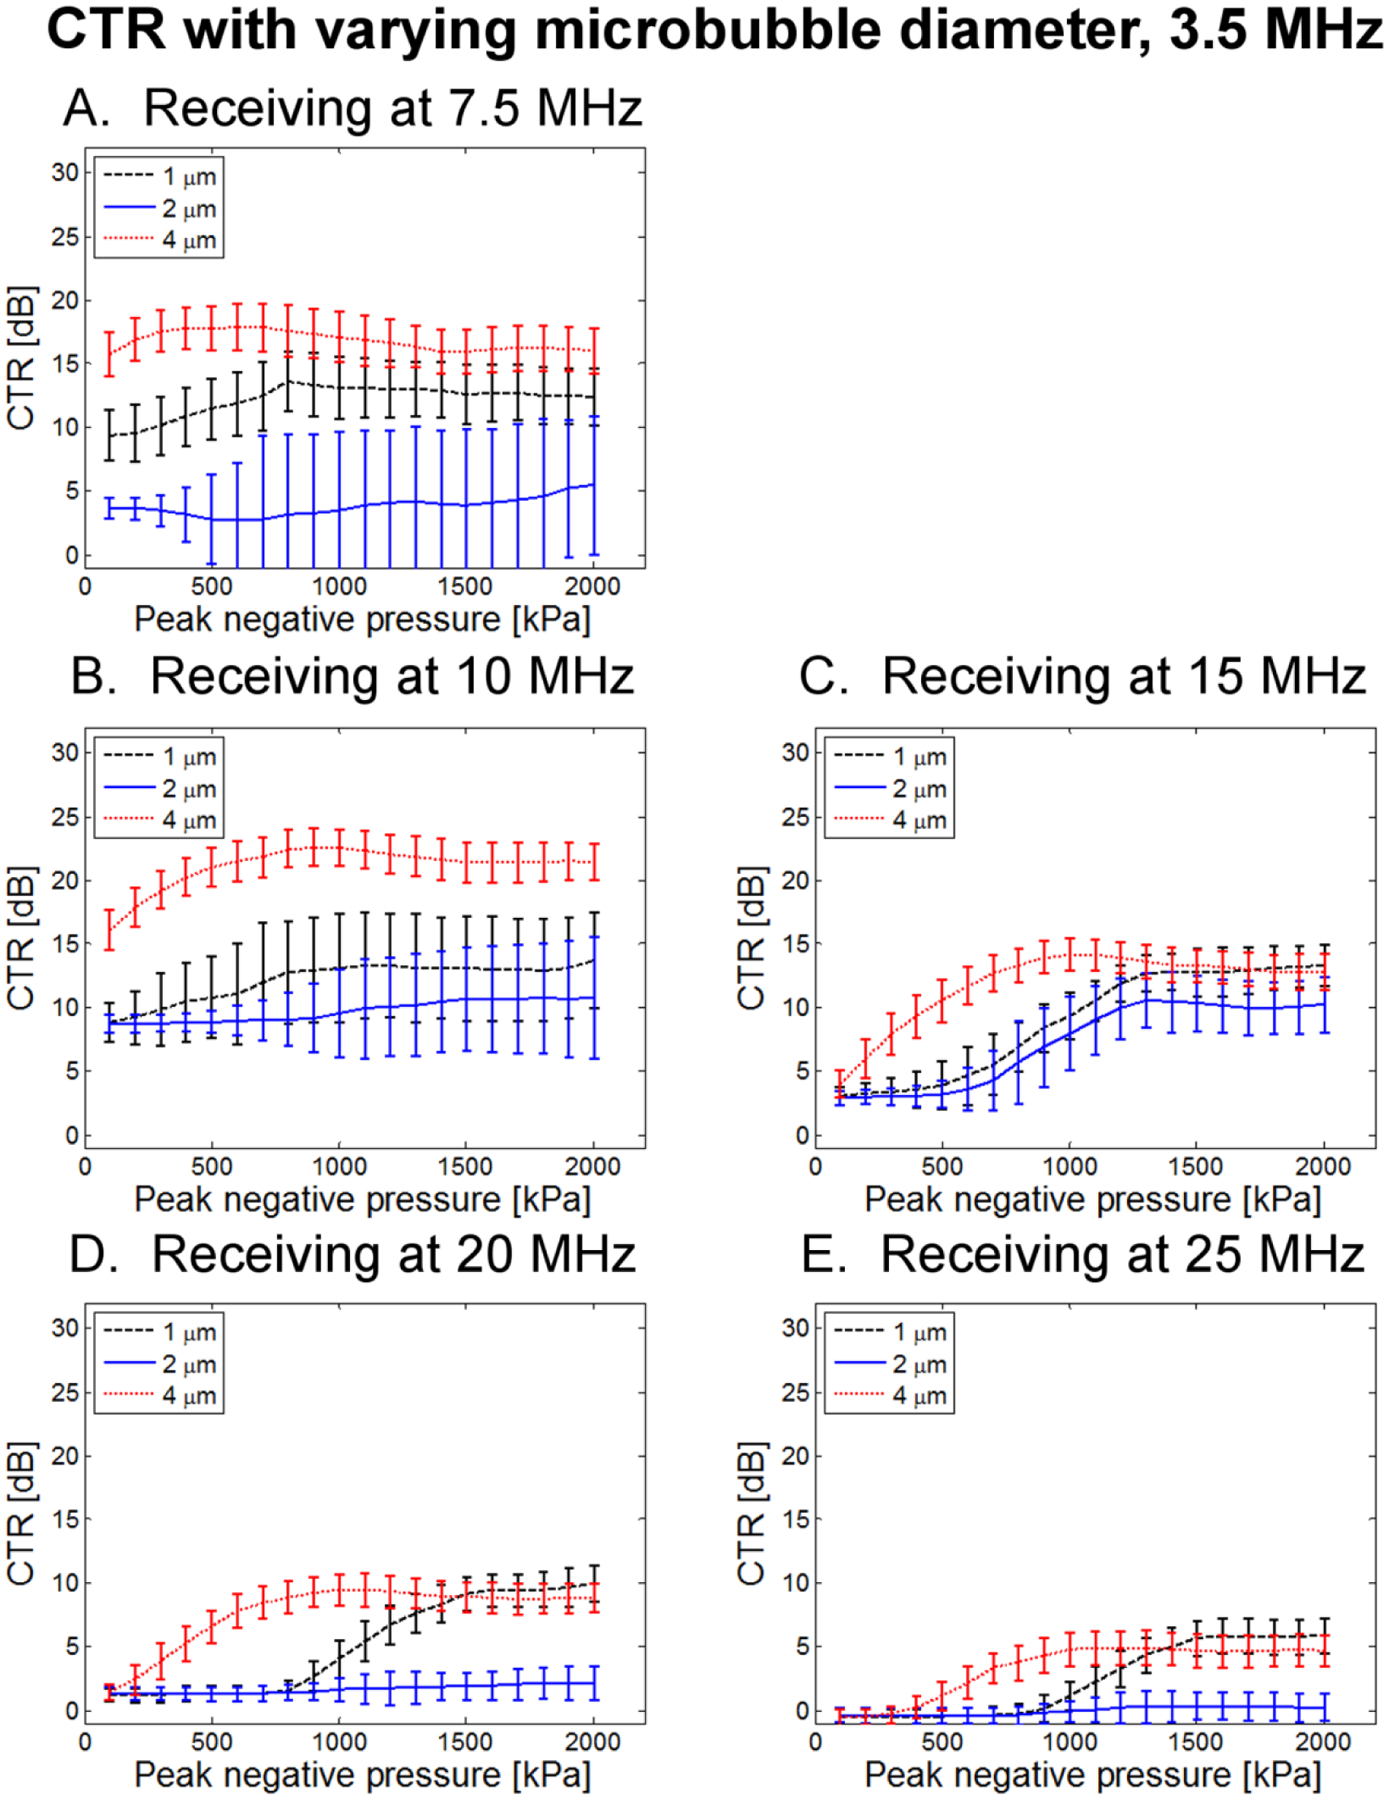
CTR as a function of peak negative pressure for 3 bubble diameters at 0.1% dilution when transmitting at 3.5 MHz and receiving with (A) 7.5 MHz, (B) 10 MHz, (C) 15 MHz, (D) 20 MHz, and (E) 25 MHz receiving transducers.
E. Animal study
In Figs. 14–15, single frames from animal studies acquired at peak negative pressures of 700 kPa, 1000 kPa, and 1300 are displayed. In each case, care was taken to select the second frame after initiation of imaging to avoid any bright artifacts that may result from bubble destruction on the first pulse. These images provide visual confirmation for findings in tube experiments. Within the range of transmit frequencies for the transducer, CTR in kidney vasculature visibly increases with decreasing frequency. CTR also increases with peak negative pressure. In the second animal (Fig. 15), the body wall is increasingly visible as transmit frequency increased to 4.5 MHz, indicative of increased tissue scattering at higher frequencies.
Figure 14.
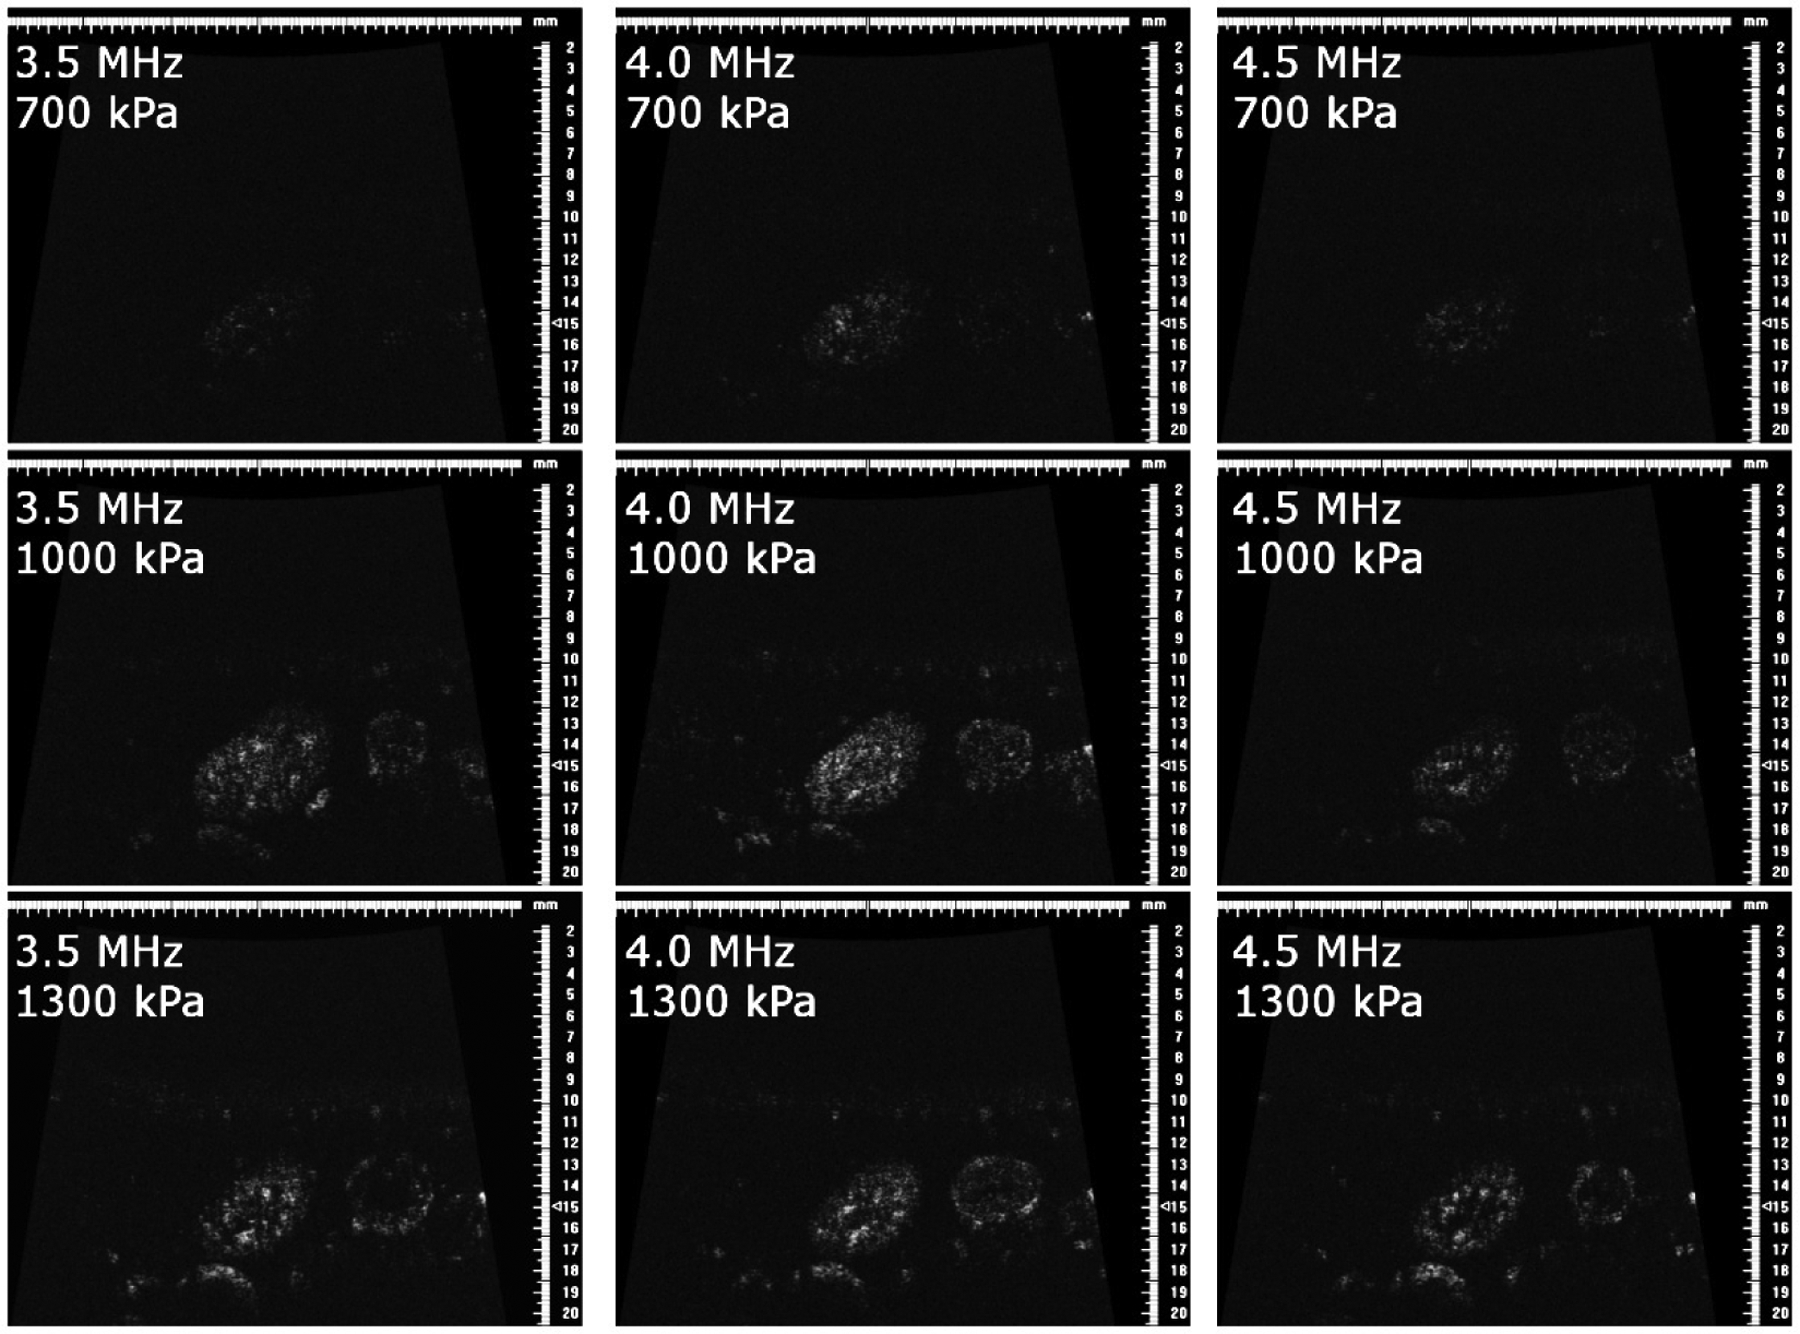
In vivo rat kidney images in animal 1 at 700 kPa (top row), 1000 kPa (middle row), and 1300 kPa (bottom row) for transmit frequencies of 3.5 MHz (left column), 4.0 MHz (middle column), and 4.5 MHz (right column).
Figure 15.
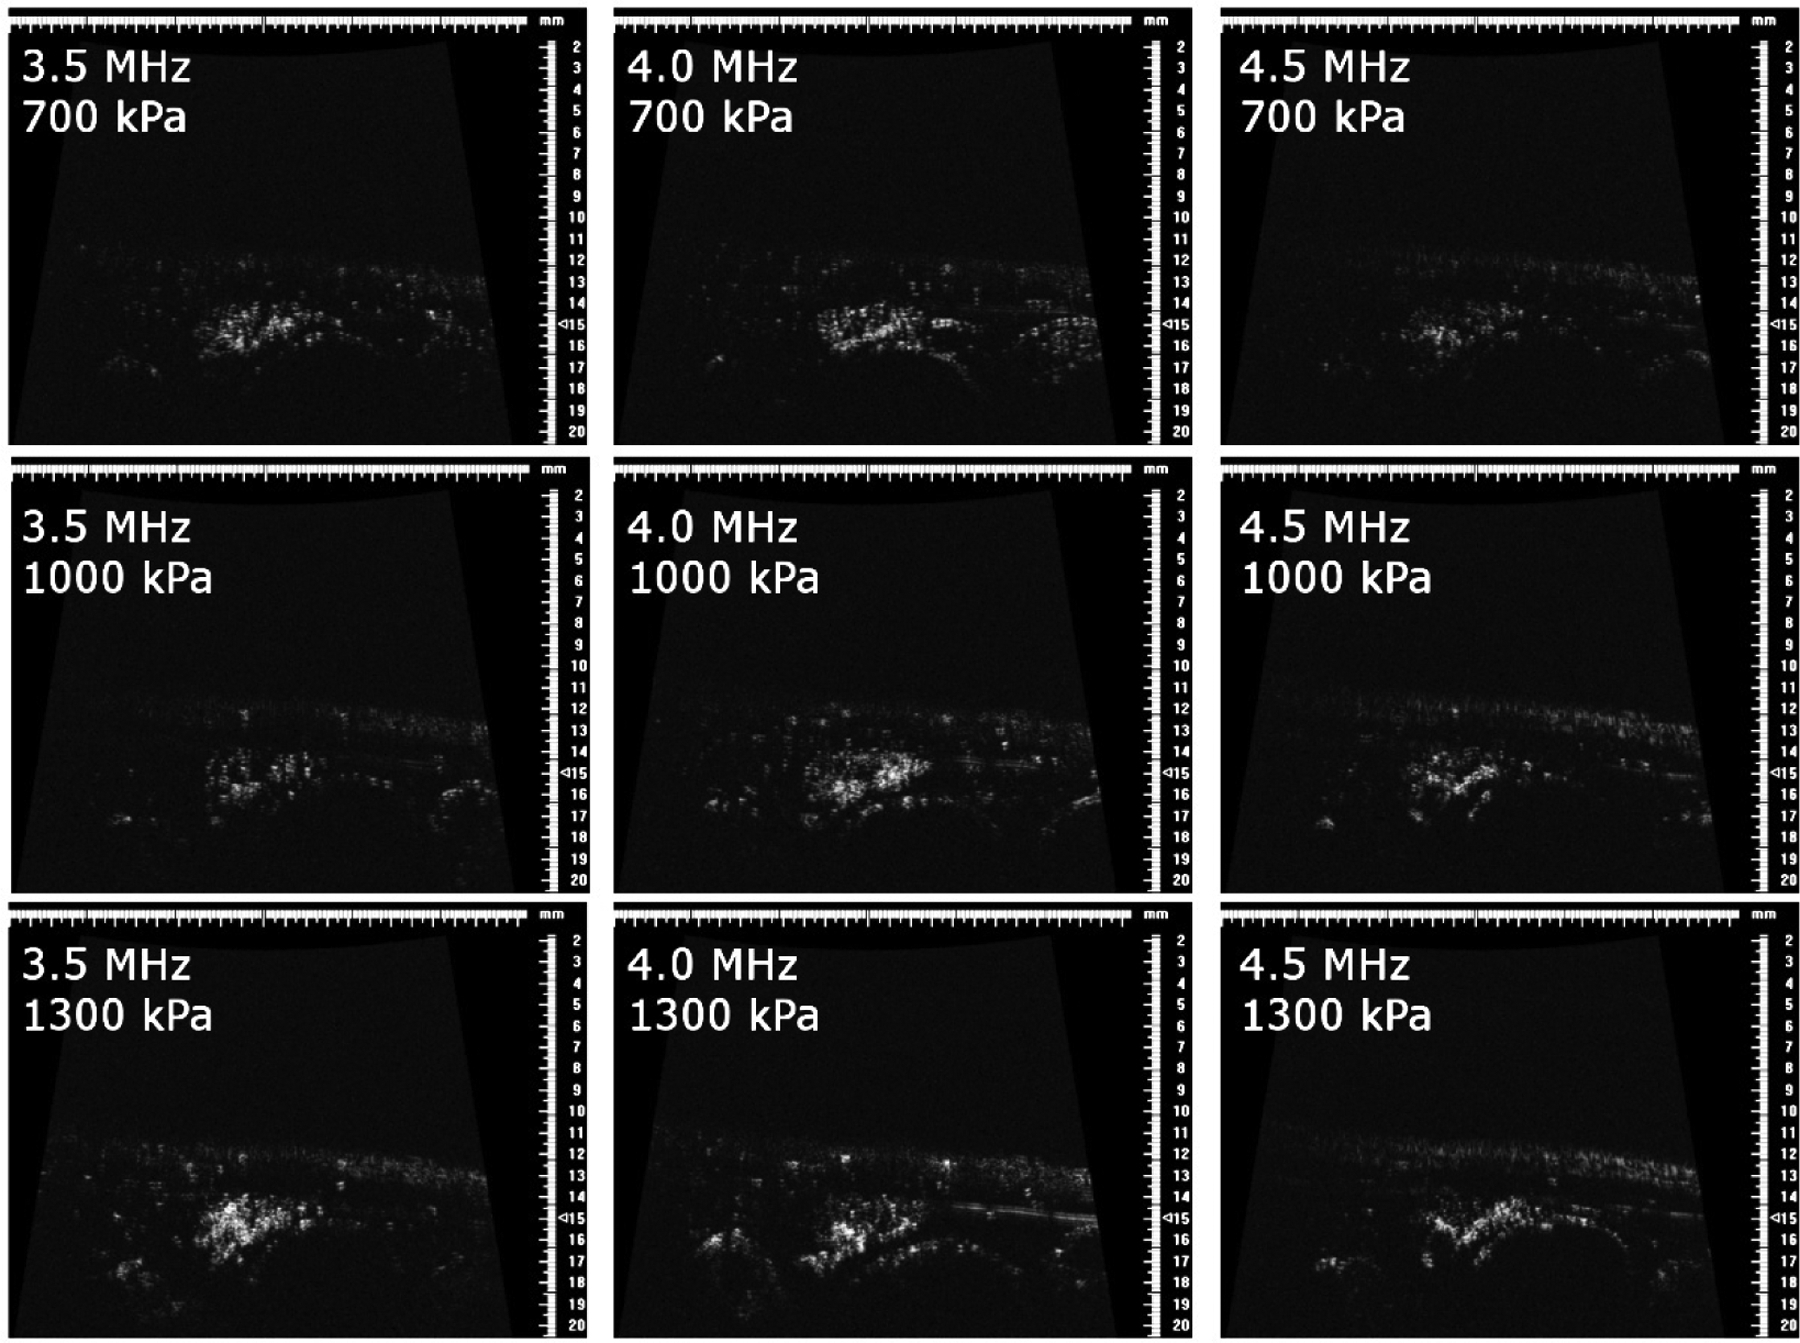
In vivo rat kidney images in animal 2 at 700 kPa (top row), 1000 kPa (middle row), and 1300 kPa (bottom row) for transmit frequencies of 3.5 MHz (left column), 4.0 MHz (middle column), and 4.5 MHz (right column).
IV. Discussion
A. SNR and CTR
Results show that for imaging of non-linear microbubble scattering, contrast-to-tissue ratio is optimized at the lowest transmission frequencies. The presented results indicated that in order to achieve optimal CTR for in vivo imaging of the higher harmonics produced by ultrasound contrast agents, a lower transmission frequency (1–3 MHz) should be chosen. Physical basis for these findings will be discussed in this section. It should also be noted that in using a consistent color scale which accommodates the highest SNR levels, it becomes difficult to visualize increases in SNR at lower levels. For example, in Fig. 6, at 7.5 MHz, SNR decreases by 3 dB between 400 and 700 kPa at 1.5 MHz and CTR increases by 2.6 dB over the same range in Fig. 7. These changes become clearer when individual frequencies are examined as in Fig. 10–13. Lines of constant mechanical index (MI) have been superimposed on Figs. 6 and 7 to as a reference to mechanical indices of 0.25 (dotted line), 0.5 (dashed), and 1.0 (solid). MI is defined as peak negative pressure divided by the square root of the transmitted frequency.
CTR was observed to increase as peak negative pressure increased up to approximately 1600 kPa, which is higher than previously observed [46]. This may be due to the use of populations of flowing bubbles, which provided a shielding effect, whereas single bubbles were used in the study of Hsu et al [46].
While this study examined optimal imaging parameters for flowing microbubbles located at the focus in a single frame, some tested pulse parameters may be expected to be destructive to microbubbles and would thus produce single-frame high resolution images which are not regained until microbubbles at the focus are replenished. While previous studies indicate that larger microbubbles are more resistant to shell fragmentation [65], this would also reduce resolution. Additional studies will be required to examine bubble destruction and the accompanying effects on temporal and spatial resolution. The weak dependence of received frequency on transmit frequency (Fig. 9, Fig. 16) suggests that bubble destruction may be the underlying mechanism of harmonic signal production.
Figure 16.
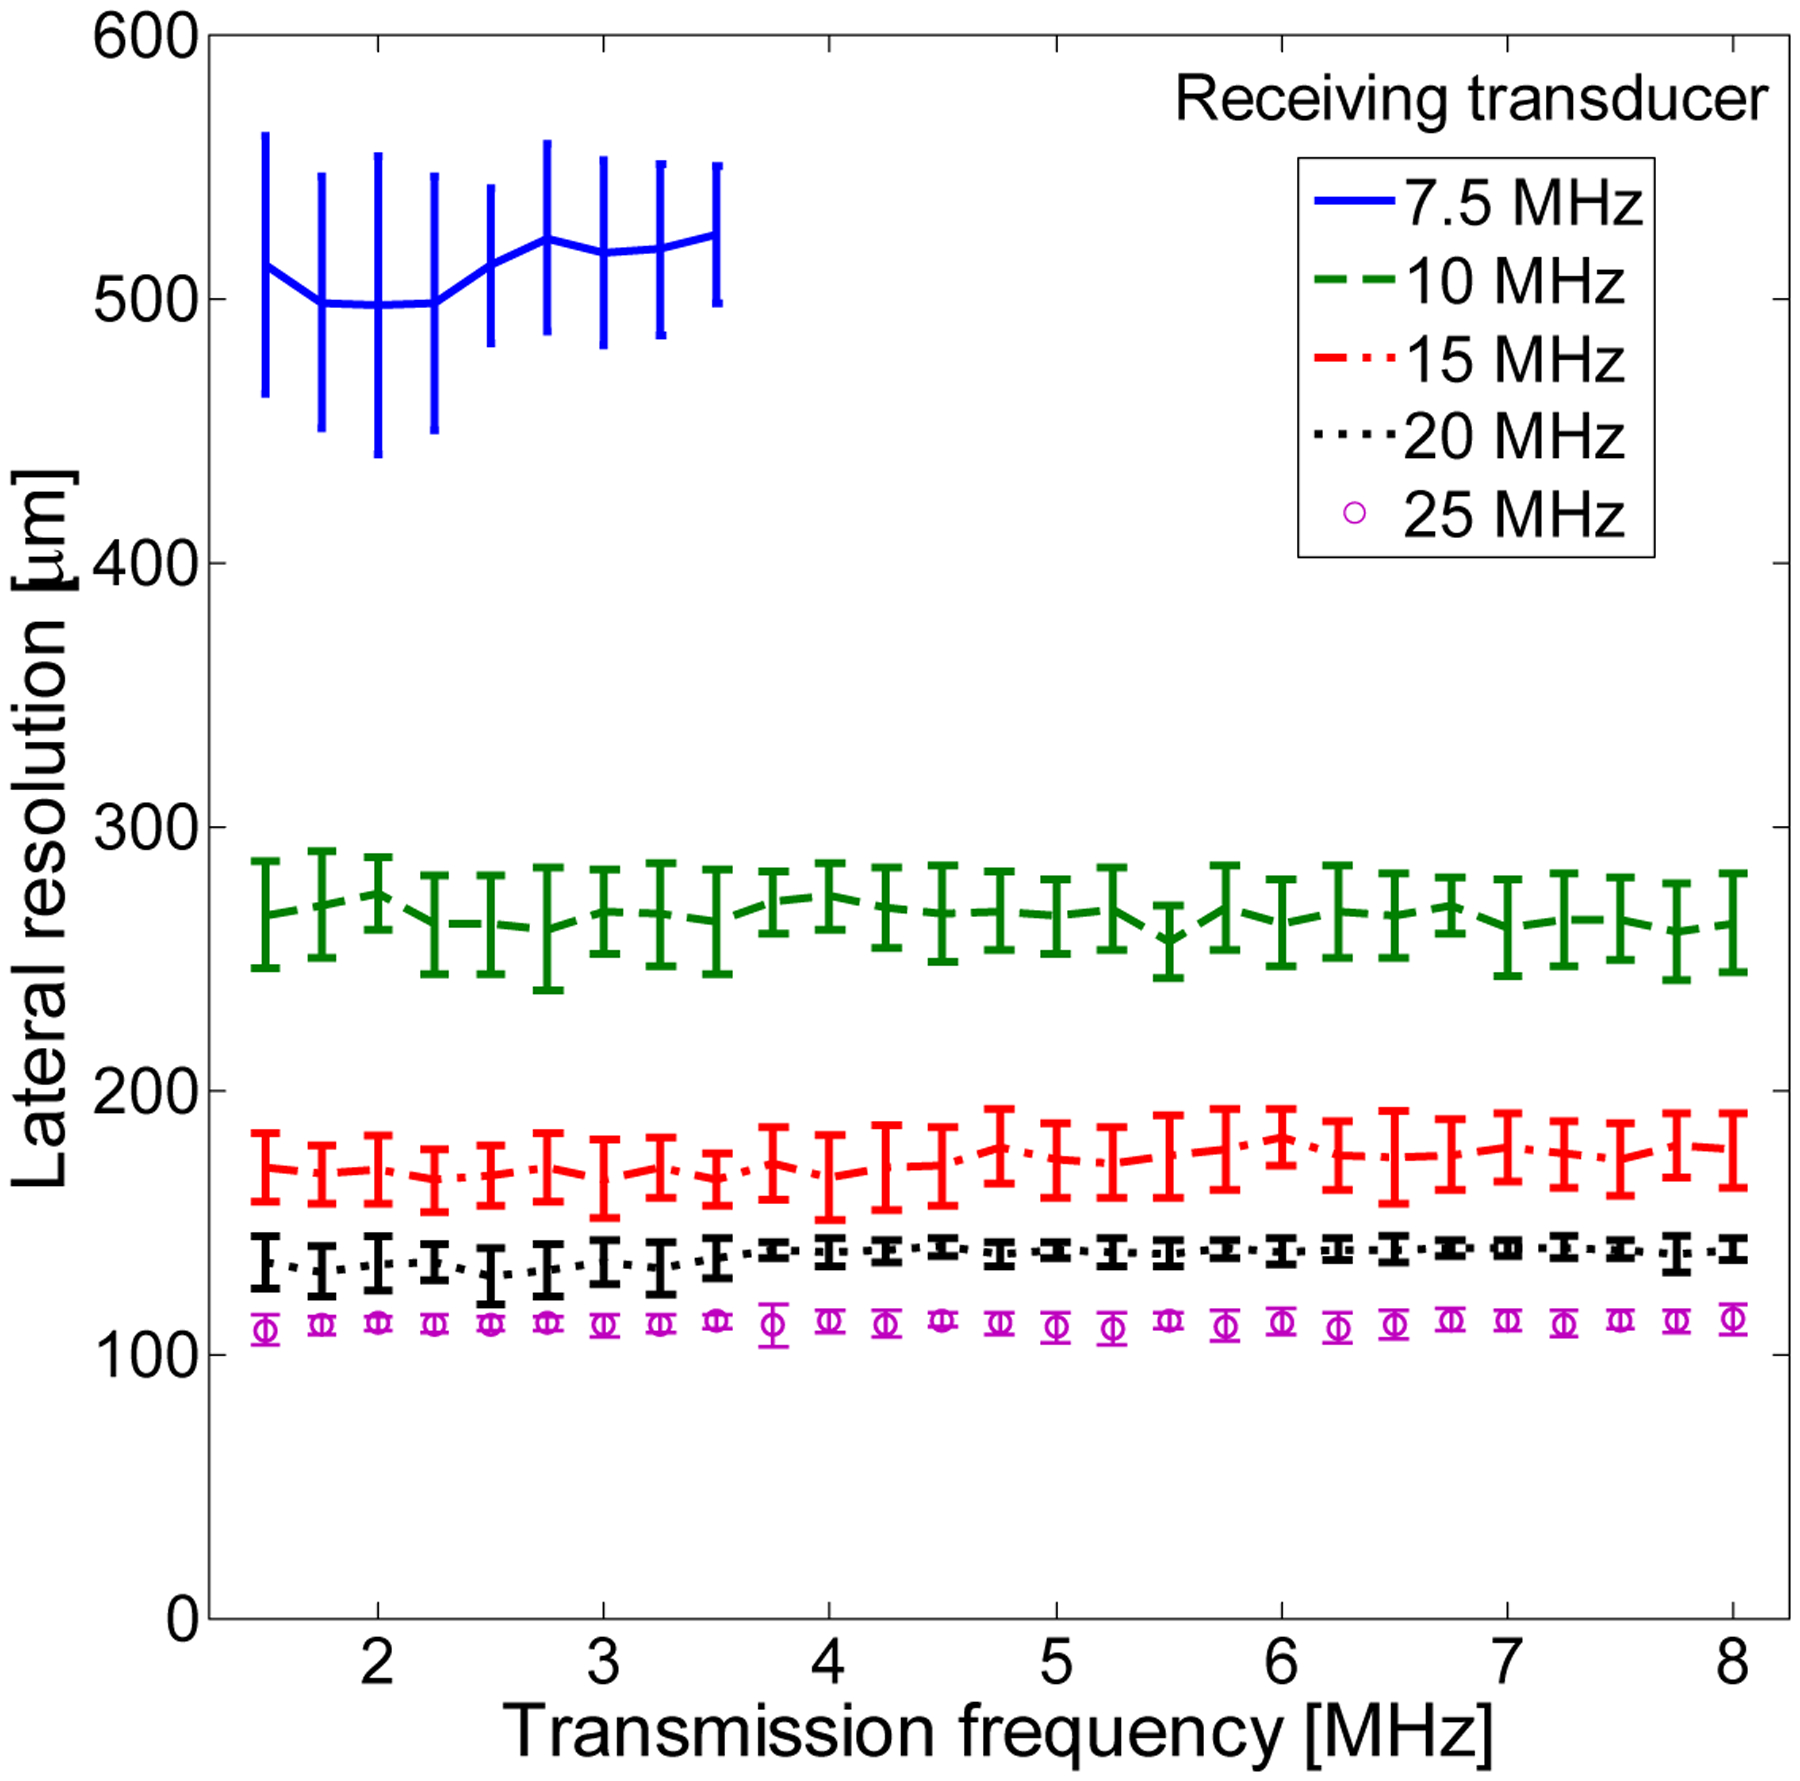
Data-based surrogate for lateral resolution based on energy of maximum frequency for each transducer for a 1% dilution and using λz/D with z= 1.5 cm and D=3.8 mm. For the 7.5 MHz transducer, only lower transmit frequencies were tested.
B. Microbubble non-linear scattering
While nonlinear signal generation in tissue due to propagation has been described in detail [66, 67], the mechanism of non-linear signal production in microbubble contrast agents is based on scattering, though non-linear acoustic propagation through microbubbles is an important phenomenon which limits microbubble localization and quantification [68]. Briefly, when an acoustic wave interacts with a microbubble, the bubble’s nonlinear oscillation depends on several factors including incident pressure and bubble resonance. While numerous models of microbubble behavior have been described [30], a simple method for describing the microbubble frequency response is the use of scattering cross-section [49], given by:
| (4) |
where R0 is initial bubble radius, m is harmonic number, and pac is applied acoustic pressure, and ps is the pressure of the scattered sound, defined as:
| (5) |
ρ is the density of the surrounding medium, is the time derivative of radius, and ω0 is bubble resonance frequency. Using these equations, de Jong et al. demonstrate a decrease in normalized scattering power at the second harmonic with increasing transmit frequency, as non-linear behavior in increases up to bubble resonance frequency. Scattering cross-section at the fundamental and second harmonic frequencies increases close to resonance and with increasing bubble size [49] . Church also investigated the scattering cross section of the second harmonic in simulations, reporting that for a given bubble size, scattering cross section decreased with increasing excitation frequency and that R0 was the primary determining factor of scattering cross section with varying bubble size, with scattering peaks corresponding to resonance behavior [69]. Previous experimental studies in the dependence of non-linear microbubble scattering on transmission frequency also indicated decreased energy at higher harmonics with increasing transmit frequency [70].
In examining only the SNR results (Fig. 6), there are no obvious resonance effects associated with varying either transmission frequency, nor are there for varying bubble diameter (Figs. 12–13). This likely occurred due to the fact that all distributions were polydisperse (as for commercial contrast agents), experiments used flowing streams of multiple microbubbles rather than stationary single bubbles, and higher order nonlinearities typically have been noted to become lower in amplitude and broader in bandwidth with increasing frequency [71]. It should also be noted that because water has similar non-linear acoustic properties to soft tissue, the 2- and 1.5-inch focal lengths produced some harmonic generation which may have contributed to measured non-linear responses. Although this would have been present in the noise measurements as well, tissue attenuation is much greater than water, thus damping nonlinear signals. Given the experimentally observed CTR dependence on transmit frequency—which may be explained by the increase in tissue harmonic generation with increasing frequency—any microbubble resonance behavior or increase in microbubble scattering cross section occurring at transmit frequencies beyond approximately 1.5–3 MHz would likely be difficult to take advantage of in in vivo imaging.
C. Axial resolution
As noted, measurable axial resolution is limited by the receiving transducer and tube diameter. However, the trends in resolution remain valid and show the expected dependence of resolution on receiving frequency. There is minimal influence of transmission frequency on axial resolution, likely because of the small size of the bubbles and the fact that harmonic echoes within discrete but wide bands are analyzed, so the frequency content of the received signals changes very little within a given band as transmit frequency is varied. The fact that pulse length has some dependence on transmit pressure suggests that some bubble destruction may be occurring [72]. As axial resolution is determined by the product of the frequency response of the receiving transducer and the frequency domain representation of the signal scattered by microbubbles, it is also important to note the relationship between bandwidth and sensitivity. At a given center frequency, as transducer (or digital filter) bandwidth is increased, sensitivity increases up to the point where the bandwidth of microbubble harmonics are exceeded. Assuming sufficient sensitivity, axial resolution may be increased by either increasing transducer center frequency (with an accompanying a loss of sensitivity above 15 MHz) or by increasing transducer or filter bandwidth to match that of the microbubble broadband harmonics. Thus the presented results using wide bandwidths assist in future design of transducer and filter bandwidths for the signal of interest.
D. Effect of varying microbubble size
In general, the 4 μm microbubbles produced the greatest CTR, followed by 1 μm, with 2 μm bubbles producing much weaker echoes. That the largest CTR is produced by larger bubbles may be explained by the dependence of scattering cross-section on bubble radius (Equation 4). However, it is unclear why 2 μm produced lower CTR than 1 μm bubbles. One possible explanation is the existence of very small bubbles in the 1 μm population which have a high resonance frequency. Exciting these bubbles below resonance may produce some oscillations near the resonance frequency of these smallest bubbles, while in the 2 μm population, the majority of these small bubbles were extracted by centrifugation. This is supported by the fact that at the highest receiving frequencies (20 and 25 MHz), 1 μm bubbles had higher peak CTR than 4 μm bubbles, although a higher peak pressure was required to reach this peak CTR for 1 μm bubbles (Figs. 12D–E, 13D–E). The lower transmit frequencies continue to yield the largest CTR regardless of bubble size.
As mentioned, one notable effect of varying bubble diameter is the shift in peak CTR as a function of peak negative pressure. When receiving echoes at 7.5 and 10 MHz, 2 μm-diameter bubbles produced maximum CTR at pressures close to the maximum applied peak negative pressure (2 MPa). However, 1 and 4 μm microbubbles exhibited maximum CTR at lower peak pressures, followed by a slight decrease in CTR observed at the very highest amplitudes. 4 μm bubbles required particularly low peak negative pressures. Specifically, maximum CTR occurs at PNP values of approximately 800–1700 kPa for 1 μm and 4 μm bubbles across a range of transmit frequencies in the 1.5 to 4 MHz range when receiving with a center frequency 7.5 or 10 MHz. In a separate optical study outside the scope of this paper, 4 μm bubbles were optically observed using a microscope (Olympus IX71, Tokyo, Japan) and a high-speed camera (Photron Fastcam APX-RS, San Diego, CA) when excited by 500 kPa, 3.5 MHz single-cycle pulses with the same acoustic system described here. It was observed that these bubbles did not break after 100 pulses, although some bubbles exhibited loss of core gas and corresponding decrease in diameter to the 1–2 μm range. This data suggests that total microbubble destruction is not a requirement to produce the broadband signals described here. Further studies are required to comprehensively assess high frequency content scattered by microbubbles and its relation to microbubble destruction.
E. Imaging implications
This data has several important implications for in vivo imaging. The presented results allow for design of a dual frequency probe or imaging system in order to either 1) optimize CTR by transmitting at approximately 1.5 MHz and receiving in the 10–15 MHz range, or 2) design for a desired resolution by selecting the appropriate receiving frequency, then maximizing CTR within the selected frequency. While choosing a receiving frequency in the 10 to 15 MHz range can maximize CTR, this must be weighed with the required resolution for the intended application. Although attenuation was not addressed in this study, it clearly plays a major role in system design and must be accounted for, as frequency-dependent attenuation will diminish CTR and downshift the maximum frequency of both transmitted waves arriving at the site of the contrast agent and waves received by the receiving transducer.
Thorough attenuation measurements in beef have been performed in several previous studies in the literature [73–75]. Using the data in [73], which defines an attenuation coefficient of 0.55 dB/cm/MHz, compensation for 1.25 cm of attenuation in beef would result in decreases in peak CTR of 7.9 dB, 11.3 dB, and 18.2 dB when receiving at 10 MHz, 15 MHz, and 25 MHz, respectively. As Topp and O’Brien have reported attenuation coefficients between 0.24 and 0.48 dB/cm/MHz in rodent skeletal muscle depending on fiber orientation [76], losses in peak CTR in small animal imaging due to 1.25 cm of attenuation may be expected to be 5.2 dB, 7.4 dB, and 11.9 dB when receiving at 10 MHz, 15 MHz, and 25 MHz, respectively (using the mean value of 0.36 dB/cm/MHz).
Lateral resolution of dual-frequency imaging of ultrasound contrast agents was not directly addressed in this work. “In previous studies of tissue harmonics, beamwidth was found to decrease with harmonic number n proportional to 1/n0.78 [77, 78]. However, the mechanism of harmonic generation is quite different for microbubbles [68]. In previous studies of microbubble-produced harmonics, harmonic beamwidth was intermediate to the separate transmit and receive beamwidth [51], though determined primarily by the smaller receive beamwidth [79]. As discrete harmonics cannot be identified in the present work with broadband harmonics, we will use the peak frequency of acquired data to compute the receive beamwidth alone. Lateral resolution is given by λz/D, where z is depth and D is aperture dimension. In Fig. 16, peak frequency of acquired data are used to compute this lateral beam width alone as a function of transmitted frequency and received frequency. Depth z is assumed to be 1.5 cm, and the transducer is assumed to be a 128-element linear array with inter-element separation of 30 μm (D=3.8 mm). A linear array is designed because it will allow real-time imaging with higher spatial uniformity and depth of focus than a single element. λ = c /fmax, where c = 1540 m/s and fmax is the frequency of maximum energy for a given receiving transducer. The limitations of the tube diameter on the measured axial resolution have already been discussed. Fig. 16 can be interpreted as the theoretically achievable resolution given the measured frequency content for varying transmit frequencies.
While we have previously demonstrated the ability of this approach to distinguish healthy and cancerous microvascular patterns in small animals [42], clinical translation depends on the ability to overcome attenuation in human imaging scenarios. The low frequency transmit pulse aids in this. For example, attenuation in the prostate is approximately 0.2 dB/cm/MHz [80], resulting in two-way attenuation of 11.2 dB in a 4 cm single-frequency B-mode scan at 7 MHz. Alternatively, in a dual-frequency dual-frequency prostate scan of the same depth, two-way attenuation is 9.2 dB for a 1.5 MHz transmit pulse and a receiving transducer centered at 10 MHz. According to Figure 7, image CTR would be 16.3 dB after attenuation in this example. In conventional ultrasound imaging of breast cancer, frequencies in the range of 7.5–13 MHz are typically used at imaging depths < 4 cm [81, 82]. In a Doppler study of breast cancer, average large vessel depth was <1 cm [83]. In this example, two-way attenuation is 18 dB at 1 cm for both a 9 MHz B-scan and a 3 MHz/15 MHz dual-frequency scan, assuming 1.0 dB/cm/MHz [84].
In addition to oncology, dual-frequency imaging poses several additional imaging opportunities. Molecular imaging with targeted microbubbles is a promising technique in which requires the ability to non-destructively image a small number of bound microbubbles and to be able to separate this signal from that of tissue or circulating bubbles [85–87]. If a regime can be found which is non-destructive to bubbles but produces a superharmonic signal, there is potential for molecular imaging with greater specificity. In looking at the CTR results in Fig. 7, in which MI lines divide the results into regions of “low,” “moderate,” and “high” mechanical index, it is possible to achieve near-maximal CTR at MI between 0.5 and 1.0, and perhaps even at MI<0.5 at a frequency of approximately 3 MHz. While further experiments are required, if such a regime can be located, specificity of imaging a small number of bound, targeted bubbles without breaking them might be improved through a dual-frequency approach.
Secondly, at the present time the greatest clinical use of ultrasound contrast imaging lies in perfusion studies [88–90]. The development of a low- to moderate-MI dual-frequency approach with increased specificity relative to present single-frequency approaches could increase accuracy of measuring time-intensity curves through improved rejection of extraneous signals or improved frame rate if fewer pulses are required relative to present multi-pulse sequences [15]. While high frequencies used on the receive side may rule out performing dual-frequency perfusion studies humans in anatomically deep organs such as the heart or liver, the high resolution that can be achieved through dual-frequency imaging also opens new anatomical regions to investigation such as peripheral microvasculature [91, 92] and ophthalmic imaging [93–95].
V. CONCLUSION
In this work we have used confocally-aligned piston transducers in a water bath setup to measure the signal-to-noise ratio (SNR), contrast-to-tissue ratio (CTR), and axial resolution for ultrasound imaging of non-linear scattering of microbubble contrast agents when transmitting at a lower frequency (1.5 – 8 MHz) and receiving at a higher frequency (7.5 – 25 MHz). SNR, CTR, and axial resolution were reported as a function of the frequency and peak negative pressure of transmitted waves, center frequency of the receiving transducer, microbubble concentration, and microbubble size. Results indicate that CTR is maximized at the lowest transmission frequencies but may be acceptable for imaging in the 1.5–3.5 MHz range. At these frequencies, CTR is optimized when a receiving transducer with a center frequency of 10 or 15 MHz is used, with the maximum CTR of 25.5 dB occurring when transmitting at 1.5 MHz with a peak negative pressure of 1600 kPa, and receiving with a center frequency of 10 MHz. Predictably, axial resolution is influenced more heavily by receiving frequency than transmitting frequency. A microbubble population containing predominately 4 μm-diameter bubbles yielded greatest CTR, followed by 4 and then 2 μm bubbles. When varying dilution, a 0.5% dilution (4.2 × 10⁷ bubbles/mL), yielded similar CTR to a 1% dilution (8.4 × 10⁷ bubbles/mL), as did a 0.1% dilution (8.4 × 10⁶ bubbles/mL) at lower receiving frequencies (7.5–15 MHz). Finally, the frequency and pressure dependence of these results was verified in vivo, suggesting future implications for in-vivo imaging using acoustic angiography.
ACKNOWLEDGMENTS
The authors would like to thank Jim Tsuruta and Lee Mullin for providing instruction and assistance in contrast agent preparation and size-sorting, Connor Puett for LabView assistance, Sandeep Kasoji for performing machining, and Kennita Johnson for assistance with the optical setup. Funding was provided by the National Institutes of Health 1R01CA170665.
REFERENCES
- [1].Gramiak R and Shah PM, “Echocardiography of the aortic root,” Invest Radiol, vol. 3, pp. 356–66, Sep-Oct 1968. [DOI] [PubMed] [Google Scholar]
- [2].Gramiak R, Shah PM, and Kramer DH, “Ultrasound cardiography: contrast studies in anatomy and function,” Radiology, vol. 92, pp. 939–48, April 1969. [DOI] [PubMed] [Google Scholar]
- [3].Cosgrove D, “Ultrasound contrast agents: an overview,” Eur J Radiol, vol. 60, pp. 324–30, December 2006. [DOI] [PubMed] [Google Scholar]
- [4].Goldberg BB, Liu JB, and Forsberg F, “Ultrasound contrast agents: a review,” Ultrasound Med Biol, vol. 20, pp. 319–33, 1994. [DOI] [PubMed] [Google Scholar]
- [5].Dayton PA, Morgan KE, Klibanov AL, Brandenburger GH, and Ferrara KW, “Optical and acoustical observations of the effects of ultrasound on contrast agents,” IEEE Trans Ultrason Ferroelectr Freq Control, vol. 46, pp. 220–32, 1999. [DOI] [PubMed] [Google Scholar]
- [6].Ferrara K, Pollard R, and Borden M, “Ultrasound microbubble contrast agents: fundamentals and application to gene and drug delivery,” Annu Rev Biomed Eng, vol. 9, pp. 415–47, 2007. [DOI] [PubMed] [Google Scholar]
- [7].Schrope B, Newhouse VL, and Uhlendorf V, “Simulated capillary blood flow measurement using a nonlinear ultrasonic contrast agent,” Ultrason Imaging, vol. 14, pp. 134–58, April 1992. [DOI] [PubMed] [Google Scholar]
- [8].Schrope BA and Newhouse VL, “Second harmonic ultrasonic blood perfusion measurement,” Ultrasound Med Biol, vol. 19, pp. 567–79, 1993. [DOI] [PubMed] [Google Scholar]
- [9].Chang PH, Shung KK, Wu SJ, and Levene HB, “Second harmonic imaging and harmonic Doppler measurements with Albunex “ IEEE Trans Ultrason Ferroelectr Freq Control, vol. 42, pp. 1020–1027, November. 1995. 1995. [Google Scholar]
- [10].Porter TR and Xie F, “Transient myocardial contrast after initial exposure to diagnostic ultrasound pressures with minute doses of intravenously injected microbubbles. Demonstration and potential mechanisms,” Circulation, vol. 92, pp. 2391–5, November 1 1995. [DOI] [PubMed] [Google Scholar]
- [11].Shankar PM, Dala Krishna P, and Newhouse VL, “Advantages of subharmonic over second harmonic backscatter for contrast-to-tissue echo enhancement,” Ultrasound Med Biol, vol. 24, pp. 395–9, March 1998. [DOI] [PubMed] [Google Scholar]
- [12].Shi WT, Forsberg F, Hall AL, Chiao RY, Liu JB, Miller S, et al. , “Subharmonic imaging with microbubble contrast agents: initial results,” Ultrason Imaging, vol. 21, pp. 79–94, April 1999. [DOI] [PubMed] [Google Scholar]
- [13].Simpson DH, Chin CT, and Burns PN, “Pulse inversion Doppler: a new method for detecting nonlinear echoes from microbubble contrast agents,” IEEE Trans Ultrason Ferroelectr Freq Control, vol. 46, pp. 372–82, 1999. [DOI] [PubMed] [Google Scholar]
- [14].Eckersley RJ, Chin CT, and Burns PN, “Optimising phase and amplitude modulation schemes for imaging microbubble contrast agents at low acoustic power,” Ultrasound Med Biol, vol. 31, pp. 213–9, February 2005. [DOI] [PubMed] [Google Scholar]
- [15].Phillips P, “Contrast pulse sequences (CPS): imaging nonlinear microbubbles,” in IEEE Ultrasonics Symposium, Atlanta, GA, 2001, pp. 1739–1745. [Google Scholar]
- [16].Leavens C, Williams R, Foster FS, Burns PN, and Sherar MD, “Golay pulse encoding for microbubble contrast imaging in ultrasound,” IEEE Trans Ultrason Ferroelectr Freq Control, vol. 54, pp. 2082–90, October 2007. [DOI] [PubMed] [Google Scholar]
- [17].Eckersley RJ, Tang MX, Chetty K, and Hajnal JV, “Microbubble contrast agent detection using binary coded pulses,” Ultrasound in Medicine and Biology, vol. 33, pp. 1787–1795, November 2007. [DOI] [PubMed] [Google Scholar]
- [18].Duck FA, “Nonlinear acoustics in diagnostic ultrasound,” Ultrasound Med Biol, vol. 28, pp. 1–18, January 2002. [DOI] [PubMed] [Google Scholar]
- [19].Christopher T, “Finite amplitude distortion-based inhomogeneous pulse echo ultrasonic imaging,” IEEE Trans Ultrason Ferroelectr Freq Control, vol. 44, pp. 125–39, 1997. [DOI] [PubMed] [Google Scholar]
- [20].Tranquart F, Grenier N, Eder V, and Pourcelot L, “Clinical use of ultrasound tissue harmonic imaging,” Ultrasound in Medicine and Biology, vol. 25, pp. 889–894, July 1999. [DOI] [PubMed] [Google Scholar]
- [21].Thomas JD and Rubin DN, “Tissue harmonic imaging: why does it work?,” J Am Soc Echocardiogr, vol. 11, pp. 803–8, August 1998. [DOI] [PubMed] [Google Scholar]
- [22].Pinton GF, Trahey GE, and Dahl JJ, “Sources of image degradation in fundamental and harmonic ultrasound imaging using nonlinear, full-wave simulations,” IEEE Trans Ultrason Ferroelectr Freq Control, vol. 58, pp. 754–65, April 2011. [DOI] [PMC free article] [PubMed] [Google Scholar]
- [23].Averkiou MA, Roundhill DN, and Powers JE, “A new imaging technique based on the nonlinear properties of tissues,” 1997 Ieee Ultrasonics Symposium Proceedings, Vols 1 & 2, pp. 1561–1566, 1997. [Google Scholar]
- [24].Demi L, van Dongen KW, and Verweij MD, “A contrast source method for nonlinear acoustic wave fields in media with spatially inhomogeneous attenuation,” J Acoust Soc Am, vol. 129, pp. 1221–30, March 2011. [DOI] [PubMed] [Google Scholar]
- [25].Christopher PT and Parker KJ, “New approaches to nonlinear diffractive field propagation,” J Acoust Soc Am, vol. 90, pp. 488–99, July 1991. [DOI] [PubMed] [Google Scholar]
- [26].Starritt HC, Duck FA, Hawkins AJ, and Humphrey VF, “The development of harmonic distortion in pulsed finite-amplitude ultrasound passing through liver,” Phys Med Biol, vol. 31, pp. 1401–9, December 1986. [DOI] [PubMed] [Google Scholar]
- [27].Averkiou M, “Tissue Harmonic Imaging “ in IEEE Ultrasonics Symposium, San Juan, PR, 2000. [Google Scholar]
- [28].de Jong N, Bouakaz A, and Frinking P, “Basic acoustic properties of microbubbles,” Echocardiography-a Journal of Cardiovascular Ultrasound and Allied Techniques, vol. 19, pp. 229–240, April 2002. [DOI] [PubMed] [Google Scholar]
- [29].Hoff L, Sontum PC, and Hovem JM, “Oscillations of polymeric microbubbles: Effect of the encapsulating shell,” Journal of the Acoustical Society of America, vol. 107, pp. 2272–2280, April 2000. [DOI] [PubMed] [Google Scholar]
- [30].Doinikov AA and Bouakaz A, “Review of shell models for contrast agent microbubbles,” IEEE Trans Ultrason Ferroelectr Freq Control, vol. 58, pp. 981–93, May 2011. [DOI] [PubMed] [Google Scholar]
- [31].Goertz DE, Frijlink ME, Bouakaz A, Chin CT, De Jong N, and Van der Steen AF, “The effects of bubble size on nonlinear scattering from microbubbles,” in IEEE Ultrasonics Symposium, 2003, pp. 1503–1506. [Google Scholar]
- [32].Sassaroli E and Hynynen K, “Resonance frequency of microbubbles in small blood vessels: a numerical study,” Phys Med Biol, vol. 50, pp. 5293–305, November 21 2005. [DOI] [PubMed] [Google Scholar]
- [33].Garbin V, Cojoc D, Ferrari E, Di Fabrizio E, Overvelde M, van der Meer SM, et al. , “Changes in microbubble dynamics near a boundary revealed by combined optical micromanipulation and high-speed imaging “ Applied Physics Letters, vol. 90, pp. 114103–114103–3 March 2007. 2009. [Google Scholar]
- [34].Doinikov AA, Zhao S, and Dayton PA, “Modeling of the acoustic response from contrast agent microbubbles near a rigid wall,” Ultrasonics, vol. 49, pp. 195–201, February 2009. [DOI] [PMC free article] [PubMed] [Google Scholar]
- [35].Martynov S, Stride E, and Saffari N, “The natural frequencies of microbubble oscillation in elastic vessels,” J Acoust Soc Am, vol. 126, pp. 2963–72, December 2009. [DOI] [PubMed] [Google Scholar]
- [36].Goertz DE, de Jong N, and van der Steen AF, “Attenuation and size distribution measurements of Definity and manipulated Definity populations,” Ultrasound Med Biol, vol. 33, pp. 1376–88, September 2007. [DOI] [PubMed] [Google Scholar]
- [37].Chin CT and Burns PN, “Predicting the acoustic response of a microbubble population for contrast imaging in medical ultrasound,” Ultrasound Med Biol, vol. 26, pp. 1293–300, October 2000. [DOI] [PubMed] [Google Scholar]
- [38].Chatterjee D, Sarkar K, Jain P, and Schreppler NE, “On the suitability of broadband attenuation measurement for characterizing contrast microbubbles,” Ultrasound Med Biol, vol. 31, pp. 781–6, June 2005. [DOI] [PubMed] [Google Scholar]
- [39].Bouakaz A, Krenning BJ, Vletter WB, ten Cate FJ, and De Jong N, “Contrast superharmonic imaging: a feasibility study,” Ultrasound Med Biol, vol. 29, pp. 547–53, April 2003. [DOI] [PubMed] [Google Scholar]
- [40].Kruse DE and Ferrara KW, “A new imaging strategy using wideband transient response of ultrasound contrast agents,” Ieee Transactions on Ultrasonics Ferroelectrics and Frequency Control, vol. 52, pp. 1320–1329, August 2005. [DOI] [PMC free article] [PubMed] [Google Scholar]
- [41].Gessner R, Lukacs M, Lee M, Cherin E, Foster FS, and Dayton PA, “High-resolution, high-contrast ultrasound imaging using a prototype dual-frequency transducer: in vitro and in vivo studies,” IEEE Trans Ultrason Ferroelectr Freq Control, vol. 57, pp. 1772–81, August 2010. [DOI] [PMC free article] [PubMed] [Google Scholar]
- [42].Gessner RC, Aylward SR, and Dayton PA, “Mapping microvasculature with acoustic angiography yields quantifiable differences between healthy and tumor-bearing tissue volumes in a rodent model,” Radiology, vol. 264, pp. 733–40, September 2012. [DOI] [PMC free article] [PubMed] [Google Scholar]
- [43].Gessner RC, Frederick CB, Foster FS, and Dayton PA, “Acoustic angiography: a new imaging modality for assessing microvasculature architecture,” Int J Biomed Imaging, vol. 2013, p. 936593, 2013. [DOI] [PMC free article] [PubMed] [Google Scholar]
- [44].Marsh JN, Hughes MS, Hall CS, Lewis SH, Trousil RL, Brandenburger GH, et al. , “Frequency and concentration dependence of the backscatter coefficient of the ultrasound contrast agent Albunex (R),” Journal of the Acoustical Society of America, vol. 104, pp. 1654–1666, September 1998. [Google Scholar]
- [45].Sboros V, MacDonald CA, Pye SD, Moran CM, Gomatam J, and McDicken WN, “The dependence of ultrasound contrast agents backscatter on acoustic pressure: theory versus experiment,” Ultrasonics, vol. 40, pp. 579–583, May 2002. [DOI] [PubMed] [Google Scholar]
- [46].Hsu MJ, Eghtedari M, Goodwin AP, Hall DJ, Mattrey RF, and Esener SC, “Characterization of individual ultrasound microbubble dynamics with a light-scattering system,” J Biomed Opt, vol. 16, p. 067002, June 2011. [DOI] [PMC free article] [PubMed] [Google Scholar]
- [47].Tang MX and Eckersley RJ, “Frequency and pressure dependent attenuation and scattering by microbubbles,” Ultrasound Med Biol, vol. 33, pp. 164–8, January 2007. [DOI] [PubMed] [Google Scholar]
- [48].Chen Q, Zagzebski J, Wilson T, and Stiles T, “Pressure-dependent attenuation in ultrasound contrast agents,” Ultrasound Med Biol, vol. 28, pp. 1041–51, August 2002. [DOI] [PubMed] [Google Scholar]
- [49].Dejong N, Cornet R, and Lancee CT, “Higher Harmonics of Vibrating Gas-Filled Microspheres .1. Simulations,” Ultrasonics, vol. 32, pp. 447–453, November 1994. [Google Scholar]
- [50].Tang MX, Eckersley RJ, and Noble JA, “Pressure-dependent attenuation with microbubbles at low mechanical index,” Ultrasound in Medicine and Biology, vol. 31, pp. 377–384, March 2005. [DOI] [PubMed] [Google Scholar]
- [51].Goertz DE, Cherin E, Needles A, Karshafian R, Brown AS, Burns PN, et al. , “High frequency nonlinear B-scan imaging of microbubble contrast agents,” IEEE Trans Ultrason Ferroelectr Freq Control, vol. 52, pp. 65–79, January 2005. [DOI] [PubMed] [Google Scholar]
- [52].Bouakaz A, Frigstad S, Ten Cate FJ, and de Jong N, “Super harmonic imaging: a new imaging technique for improved contrast detection,” Ultrasound Med Biol, vol. 28, pp. 59–68, January 2002. [DOI] [PubMed] [Google Scholar]
- [53].Imaging LM, “Definity Prescribing Information,” in http://www.definityimaging.com/pdf/DEFINITY%20Prescribing%20Information%20515987-0413.pdf, ed. Billerica N, MA: Lantheus Medical Imaging, 2013, pp. 1–3. [Google Scholar]
- [54].Streeter JE, Gessner R, Miles I, and Dayton PA, “Improving sensitivity in ultrasound molecular imaging by tailoring contrast agent size distribution: in vivo studies,” Mol Imaging, vol. 9, pp. 87–95, April 2010. [PMC free article] [PubMed] [Google Scholar]
- [55].Feshitan JA, Chen CC, Kwan JJ, and Borden MA, “Microbubble size isolation by differential centrifugation,” J Colloid Interface Sci, vol. 329, pp. 316–24, January 15 2009. [DOI] [PubMed] [Google Scholar]
- [56].Clerk LH, Vincent MA, Jahn LA, Liu Z, Lindner JR, and Barrett EJ, “Obesity blunts insulin-mediated microvascular recruitment in human forearm muscle,” Diabetes, vol. 55, pp. 1436–42, May 2006. [DOI] [PubMed] [Google Scholar]
- [57].Bohs LN and Trahey GE, “A novel method for angle independent ultrasonic imaging of blood flow and tissue motion,” IEEE Trans Biomed Eng, vol. 38, pp. 280–6, March 1991. [DOI] [PubMed] [Google Scholar]
- [58].Mallart R and Fink M, “The Van Cittert-Zernike Theorem in Pulsed Ultrasound - Implications for Ultrasonic-Imaging,” Ieee 1990 Ultrasonics Symposium : Proceedings, Vols 1–3, pp. 1603–1607, 1990. [Google Scholar]
- [59].Dahl J, Jakovljevic M, Pinton GF, and Trahey GE, “Harmonic spatial coherence imaging: an ultrasonic imaging method based on backscatter coherence,” IEEE Trans Ultrason Ferroelectr Freq Control, vol. 59, pp. 648–59, April 2012. [DOI] [PMC free article] [PubMed] [Google Scholar]
- [60].de Jong N, Hoff L, Skotland T, and Bom N, “Absorption and scatter of encapsulated gas filled microspheres: theoretical considerations and some measurements,” Ultrasonics, vol. 30, pp. 95–103, March 1992. [DOI] [PubMed] [Google Scholar]
- [61].de Jong N and Hoff L, “Ultrasound scattering properties of Albunex microspheres,” Ultrasonics, vol. 31, pp. 175–81, 1993. [DOI] [PubMed] [Google Scholar]
- [62].Wang SH and Shung KK, “An approach for measuring ultrasonic backscattering from biological tissues with focused transducers,” IEEE Trans Biomed Eng, vol. 44, pp. 549–54, July 1997. [DOI] [PubMed] [Google Scholar]
- [63].Sboros V, Pye SD, Macdonald CA, Gomatam J, Moran CM, and McDicken WN, “Absolute measurement of ultrasonic backscatter from single microbubbles,” Ultrasound Med Biol, vol. 31, pp. 1063–72, August 2005. [DOI] [PubMed] [Google Scholar]
- [64].Apfel RE and Holland CK, “Gauging the likelihood of cavitation from short-pulse, low-duty cycle diagnostic ultrasound,” Ultrasound Med Biol, vol. 17, pp. 179–85, 1991. [DOI] [PubMed] [Google Scholar]
- [65].Chomas JE, Dayton P, May D, and Ferrara K, “Threshold of fragmentation for ultrasonic contrast agents,” J Biomed Opt, vol. 6, pp. 141–50, April 2001. [DOI] [PubMed] [Google Scholar]
- [66].Fubini E, “Anomalie nella propagazione di ande acustiche de grande ampiezza,” Alta Frequenza, vol. 4, pp. 530–581, 1935. [Google Scholar]
- [67].Hamilton MF and Blackstock DT, Nonlinear Acoustics. Oxford: Academic Press, 1997. [Google Scholar]
- [68].Tang MX and Eckersley RJ, “Nonlinear propagation of ultrasound through microbubble contrast agents and implications for Imaging,” Ieee Transactions on Ultrasonics Ferroelectrics and Frequency Control, vol. 53, pp. 2406–2415, December 2006. [DOI] [PubMed] [Google Scholar]
- [69].Church CC, “The Effects of an Elastic Solid-Surface Layer on the Radial Pulsations of Gas-Bubbles,” Journal of the Acoustical Society of America, vol. 97, pp. 1510–1521, March 1995. [Google Scholar]
- [70].Goertz DE, Wong SWS, Chin CT, Cherin E, Burns PN, and Foster FS, “Non-linear scattering from microbubble contrast agents in the 14–40 MHz range,” in 2001 IEEE Ultrasonics Symposium, Atlanta, GA, 2001, pp. 1747–1750. [Google Scholar]
- [71].Haider B and Chiao RY, “Higher order nonlinear ultrasonic imaging,” in IEEE Ultrasonics Symposium, Caesars Tahoe, NV, 1999, pp. 1527–1531. [Google Scholar]
- [72].King DA, Malloy MJ, Roberts AC, Haak A, Yoder CC, and O’Brien WD Jr., “Determination of postexcitation thresholds for single ultrasound contrast agent microbubbles using double passive cavitation detection,” J Acoust Soc Am, vol. 127, pp. 3449–55, June 2010. [DOI] [PMC free article] [PubMed] [Google Scholar]
- [73].Shore D, Woods MO, and Miles CA, “Attenuation of ultrasound in post rigor bovine skeletal muscle,” Ultrasonics, vol. 24, pp. 81–7, March 1986. [DOI] [PubMed] [Google Scholar]
- [74].Ghoshal G, Luchies AC, Blue JP, and Oelze ML, “Temperature dependent ultrasonic characterization of biological media,” J Acoust Soc Am, vol. 130, pp. 2203–11, October 2011. [DOI] [PMC free article] [PubMed] [Google Scholar]
- [75].Bamber JC and Hill CR, “Ultrasonic attenuation and propagation speed in mammalian tissues as a function of temperature,” Ultrasound Med Biol, vol. 5, pp. 149–157, 1979. [DOI] [PubMed] [Google Scholar]
- [76].Topp KA and O’Brien WD Jr., “Anisotropy of ultrasonic propagation and scattering properties in fresh rat skeletal muscle in vitro,” J Acoust Soc Am, vol. 107, pp. 1027–33, February 2000. [DOI] [PubMed] [Google Scholar]
- [77].Ward B, Baker AC, and Humphrey VF, “Nonlinear propagation applied to the improvement of resolution in diagnostic medical ultrasound,” J Acoust Soc Am, vol. 101, pp. 143–54, January 1997. [DOI] [PubMed] [Google Scholar]
- [78].Humphrey VF, “Nonlinear propagation in ultrasonic fields: measurements, modelling and harmonic imaging,” Ultrasonics, vol. 38, pp. 267–72, March 2000. [DOI] [PubMed] [Google Scholar]
- [79].Needles A, Arditi M, Rognin NG, Mehi J, Coulthard T, Bilan-Tracey C, et al. , “Nonlinear contrast imaging with an array-based micro-ultrasound system,” Ultrasound Med Biol, vol. 36, pp. 2097–106, December 2010. [DOI] [PubMed] [Google Scholar]
- [80].Tanoue H, Hagiwara Y, Kobayashi K, and Saijo Y, “Ultrasonic Tissue Characterization of Prostate Biopsy Tissues by Ultrasound Speed Microscope,” in IEEE EMBS, Boston, Massachusetts, 2011, pp. 8499–8502. [DOI] [PubMed] [Google Scholar]
- [81].Kuhl CK, Schrading S, Leutner CC, Morakkabati-Spitz N, Wardelmann E, Fimmers R, et al. , “Mammography, breast ultrasound, and magnetic resonance imaging for surveillance of women at high familial risk for breast cancer,” Journal of Clinical Oncology, vol. 23, pp. 8469–8476, November 20 2005. [DOI] [PubMed] [Google Scholar]
- [82].Weinstein SP, Conant EF, and Sehgal C, “Technical advances in breast ultrasound imaging,” Semin Ultrasound CT MR, vol. 27, pp. 273–83, August 2006. [DOI] [PubMed] [Google Scholar]
- [83].Adler DD, Carson PL, Rubin JM, and Quinn-Reid D, “Doppler ultrasound color flow imaging in the study of breast cancer: preliminary findings,” Ultrasound Med Biol, vol. 16, pp. 553–9, 1990. [DOI] [PubMed] [Google Scholar]
- [84].Dastous FT and Foster FS, “Frequency-Dependence of Ultrasound Attenuation and Backscatter in Breast-Tissue,” Ultrasound in Medicine and Biology, vol. 12, pp. 795–808, October 1986. [DOI] [PubMed] [Google Scholar]
- [85].Ellegala DB, Leong-Poi H, Carpenter JE, Klibanov AL, Kaul S, Shaffrey ME, et al. , “Imaging tumor angiogenesis with contrast ultrasound and microbubbles targeted to alpha(v)beta3,” Circulation, vol. 108, pp. 336–41, July 22 2003. [DOI] [PubMed] [Google Scholar]
- [86].Streeter JE, Gessner RC, Tsuruta J, Feingold S, and Dayton PA, “Assessment of Molecular Imaging of Angiogenesis with Three-Dimensional Ultrasonography,” Molecular Imaging, vol. 10, pp. 460–468, Nov-Dec 2011. [PMC free article] [PubMed] [Google Scholar]
- [87].Willmann JK, Kimura RH, Deshpande N, Lutz AM, Cochran JR, and Gambhir SS, “Targeted contrast-enhanced ultrasound imaging of tumor angiogenesis with contrast microbubbles conjugated to integrin-binding knottin peptides,” J Nucl Med, vol. 51, pp. 433–40, March 2010. [DOI] [PMC free article] [PubMed] [Google Scholar]
- [88].Feinstein SB, “Myocardial perfusion imaging: contrast echocardiography today and tomorrow,” J Am Coll Cardiol, vol. 8, pp. 251–3, July 1986. [DOI] [PubMed] [Google Scholar]
- [89].Seidel G, Meyer-Wiethe K, Berdien G, Hollstein D, Toth D, and Aach T, “Ultrasound perfusion imaging in acute middle cerebral artery infarction predicts outcome,” Stroke, vol. 35, pp. 1107–11, May 2004. [DOI] [PubMed] [Google Scholar]
- [90].Cosgrove D and Lassau N, “Imaging of perfusion using ultrasound,” European Journal of Nuclear Medicine and Molecular Imaging, vol. 37, pp. S65–S85, August 2010. [DOI] [PubMed] [Google Scholar]
- [91].Lindner JR, Womack L, Barrett EJ, Weltman J, Price W, Harthun NL, et al. , “Limb stress-rest perfusion imaging with contrast ultrasound for the assessment of peripheral arterial disease severity,” JACC Cardiovasc Imaging, vol. 1, pp. 343–50, May 2008. [DOI] [PMC free article] [PubMed] [Google Scholar]
- [92].Zemp RJ, Bitton R, Li ML, Shung KK, Stoica G, and Wang LV, “Photoacoustic imaging of the microvasculature with a high-frequency ultrasound array transducer,” Journal of Biomedical Optics, vol. 12, Jan-Feb 2007. [DOI] [PubMed] [Google Scholar]
- [93].Seiler GS, Salmon JH, Mantuo R, Feingold S, Dayton PA, and Gilger BC, “Effect and Distribution of Contrast Medium after Injection into the Anterior Suprachoroidal Space in Ex Vivo Eyes,” Investigative Ophthalmology & Visual Science, vol. 52, pp. 5730–5736, July 2011. [DOI] [PubMed] [Google Scholar]
- [94].Zhang Q, Yang H, Kang SJ, Wang Y, Wang GD, Coulthard T, et al. , “In vivo high-frequency, contrast-enhanced ultrasonography of uveal melanoma in mice: imaging features and histopathologic correlations,” Invest Ophthalmol Vis Sci, vol. 52, pp. 2662–8, April 2011. [DOI] [PMC free article] [PubMed] [Google Scholar]
- [95].Kang SJ, Zhang Q, Patel SR, Berezovsky D, Yang H, Wang YG, et al. , “In vivo high-frequency contrast-enhanced ultrasonography of choroidal melanoma in rabbits: imaging features and histopathologic correlations,” British Journal of Ophthalmology, vol. 97, pp. 929–933, July 2013. [DOI] [PMC free article] [PubMed] [Google Scholar]


